Abstract
Iridium is the main element in modern catalysts for the oxygen evolution reaction (OER) in proton exchange membrane water electrolyzers (PEMWE), which is predominantly due to its relatively good activity and tolerable stability in harsh PEMWE conditions. Limited abundance of iridium, however, poses limitations on widespread applications of these devices, in particular in the large scale conversion and storage of renewable energy. In this work we investigate if the electrocatalytic performance of iridium can be fine-tuned by thermal treatment of catalysts at different temperatures. The OER activity and the dissolution of two different iridium electrodes, viz. (a) flat metallic iridium surfaces prepared by electron beam physical vapor deposition (EBPVD) and (b) electrochemically prepared porous hydrous iridium oxide films (HIROF) are studied. The range of applied annealing temperatures is 100°C–600°C, with a general trend of decreasing activity and increasing stability the higher the temperature. Numerous peculiarities in the trend are however observed. These are discussed considering variations of oxide structure, morphology and electronic conductivity.
Export citation and abstract BibTeX RIS

This is an open access article distributed under the terms of the Creative Commons Attribution 4.0 License (CC BY, http://creativecommons.org/licenses/by/4.0/), which permits unrestricted reuse of the work in any medium, provided the original work is properly cited.
In the future energy concept renewable wind and solar energy are considered to play an important role. Due to the alternating nature of power outcome from renewable energy sources, seasonal and/or local energy surplus has to be efficiently converted and stored to remain available at other times of high demand. Examples of promising technologies that could flank the renewables are e.g. producing hydrogen via proton exchange membrane water electrolysis (PEMWE) or converting carbon dioxide to valuable products in an electrochemical reduction process. In both processes the oxygen evolution reaction (OER) will be the counter reaction on the anode side. Due to slow kinetics of this reaction even on the state-of-the-art Ir and Ru based catalysts, the OER makes up a significant part of efficiency losses in an electrolyzer and therefore has the largest potential for improvement of the whole system. Additionally, high potentials and acidic environment on the anode side of a PEMWE lead to dissolution of the mentioned metals even though they are considered as noble.1 The obvious consequence of catalyst dissolution is the loss in active material and thus surface area, with potential secondary effects following. Crystalline IrO2 is also considered as the anode catalyst, since it shows better stability and rather tolerable activity.1–3 Due to the high price and scarcity of Ir, however, widespread application of PEMWE using Ir-based catalyst is questionable. Since no inexpensive and suitable replacement for Ir has been found so far, current research efforts are directed toward a more efficient utilization of Ir based catalysts.4
Nanoparticulated materials efficiently dispersed on a support,5–8 highly porous layers,9–11 core shell12,13 and mixed oxide systems14–16 have been suggested to reduce the loading of expensive elements. An alternative way is the structural modification of iridium oxides, e.g. formation of an amorphous metal oxide.17 Iridium, among some other metals, is able to form an amorphous hydrous oxide under continuous potential cycling.18–24 It was found out by Gottesfeld and Srinivasan20 that the rate for oxygen evolution reaction on a hydrous iridium oxide film (HIROF) – often also called anodic iridium oxide film (AIROF) – is significantly increased compared to a bare iridium metal. This unique activity of HIROF was assigned to a high level of bulk defects and high surface concentration of active sites. Since then the high activity of amorphous iridium oxide compared to crystalline IrO2 is in the focus of research. Minguzzi et al.25 pointed out that hydrous oxide approaches complete utilization of the material, while in crystalline oxide films only 1–2% of the iridium atoms participate in the reaction. Pfeifer et al.26 assigned an increased activity of amorphous oxides to IrIII species and vacancies in the lattice. High activity of HIROF, however, goes hand in hand with low stability. It was reported that HIROF is not stable at relevant PEMWE potentials of 1.4 to 1.6 VRHE.27 Danilovic et al.28 compared amorphous and crystalline metal oxides regarding their trends in activity and stability. According to these authors very active oxides are prone for dissolution and a compromise is required. To circumstance this problem annealing of HIROF has been suggested by Vukovic.29,30 In general, such treatment led to decrease in activity with temperature, which has been reported for several iridium based systems.5,9–11,29,31–35 The main reasons for the decline in activity are (i) a change in oxide stoichiometry toward a crystalline IrO2 phase, (ii) a lower amount of accessible active sites due to sintering and (iii) an ion insertion and reactant/product mass transfer limitations due to dehydration. On the basis of chronoamperometric measurements, heat-treatment at 200°C was suggested as optimum by Vukovic, since the produced films could withstand a prolonged polarization without significant performance deterioration. Problematic in this case is the essential thickness of the formed layer, which can provide a stable value of potential during several hours with no significant activity drop even though the material dissolves more. Therefore, 5 h tests cannot guarantee that the investigated material is indeed stable. Other authors used chronoamperometry for 0.5 h34 or chronopotentiometry for 15 h,6 25 h36 and 120 h.5 Instead, investigation of the actual loss of active material directly during polarization can be very helpful to assess the stability on a long run.37 Such data can be used for estimation of the electrodes end-of-life.
Recently, in a similar system, in which hydrous oxide was formed from an iridium acetate precursor under additional heat-treatment, it was shown that oxides formed at low temperatures are still prone to severe dissolution.10 This discrepancy in results, supported by the importance of the topic, encouraged us to revisit the topic of HIROF heat-treatment and its effect on the material activity and stability. In order to get a new insight into the hidden relationships between material physical properties and OER performance we investigated OER activity and corrosion of the formed materials using a scanning flow cell (SFC) directly connected to an inductively coupled plasma mass spectrometer (ICP-MS).
Experimental
Sample preparation
Two types of electrodes were used in this work, namely iridium films as prepared by electron beam physical vapor deposition (EBPVD) and hydrous iridium oxide films (HIROF) formed electrochemically. Both types of electrodes were investigated as prepared and after an additional heat-treatment (100°C–600°C). EBPVDs were formed on silicon wafers using a Leybold Univex450 machine. Prior to deposition, the silicon wafers were cleaned in ethanol and dried with a stream of nitrogen gas. After transferring to the deposition chamber, the wafers were first coated with 15 nm of titanium adhesive layer and then by a 100 nm thick film of iridium. The evaporation rate for titanium and iridium was maintained below 0.25 and 0.5 nm s−1 respectively. HIROFs were formed in 0.1 M H2SO4 applying 300 square wave (SQW) cycles on the EBPVD iridium film using the setup described in Electrochemical measurements section. The lower and upper potential limits (ELPL and EUPL) were 0.04 and 1.4 VRHE, respectively. The frequency of potential change was 2 Hz. Thermal treatment was carried out in air for 5 h at selected temperatures resulting in 14 different samples labelled as EBPVDTemp and HIROFTemp with the corresponding temperature of thermal treatment as subscript. Examples of the obtained spots are shown in Figs. 1a and 1b. Each sample was prepared and measured at least three times.
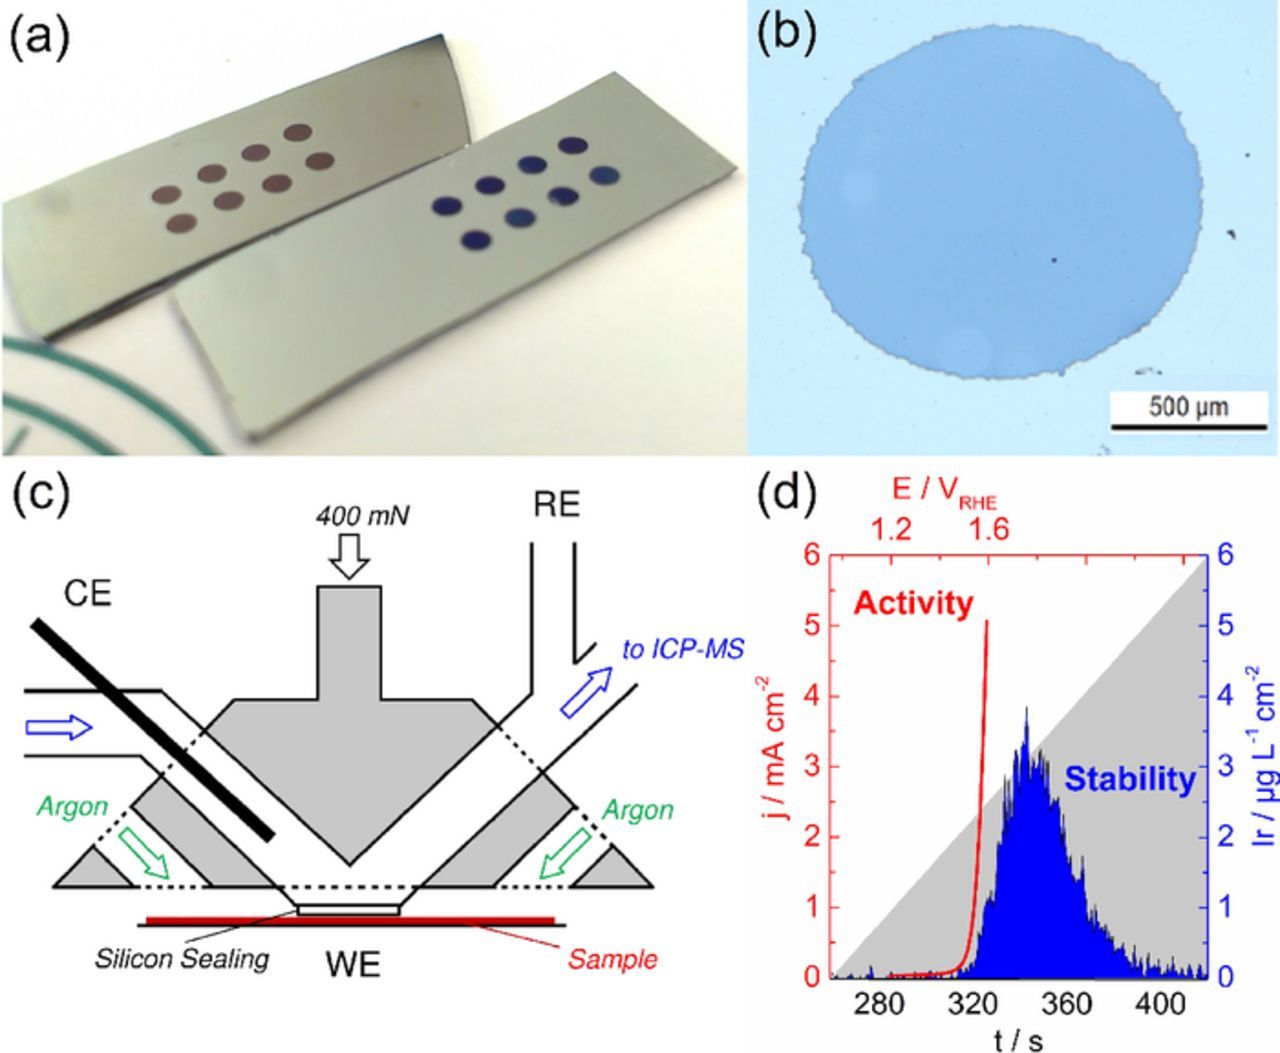
Figure 1. (a) Two exemplary wafers with an array of 8 spots HIROF; color difference is caused by different annealing temperature. (b) Spot of HIROF formed with the SFC on the EBPVD film (optical microscope); surface area = 0.01 cm². (c) 2D-sketch of the scanning flow cell (SFC). (d) Exemplary result of measurement; activity obtained by a linear sweep of potential (10 mV s−1) to a current limit of 5 mA cm−2 or potential limit of 1.55 VRHE (shown in red), stability obtained by integration of the iridium signal (shown in blue).
Electrochemical measurements
Electrochemical measurements have been carried out using a three electrode electrochemical scanning flow cell (SFC) which was described in detail in earlier publications.38,39 A small sketch of the SFC is presented in Fig. 1c. Briefly, a thin graphite rod counter electrode (CE) was placed in the inlet tube and an Ag/AgCl reference electrode (RE) (Metrohm) was connected downstream of the SFC. The iridium surfaces were connected as working electrode (WE). To localize and approach on the same spots after thermal treatment an USB microscope (Basler AG) was used. The potentiostat (Gamry Reference 600) and SFC parameters were controlled by a home-made LabVIEW software.38 The electrolyte was prepared freshly from concentrated H2SO4 (Suprapur, Merck) and diluted in ultrapure water (PureLab Plus system, ELGA, 18.2 MΩ, TOC: 3 ppb). The electrolyte was purged by argon (Air Liquide, 5.0) and pumped through the SFC system (180 μL min−1). To ensure a tight connection between the opening of the SFC and the working electrode (contact area = 0.01 cm2) a silicon sealing was used. An additional argon shield prevented oxygen diffusion through the sealing. All potentials are referred to the reversible hydrogen electrode scale (RHE) determined independently on each measurement day. The outlet of the SFC was connected to an inductively coupled plasma mass spectrometer (ICP-MS) (NexION 300X, Perkin Elmer). By doing so, iridium dissolution can be recorded in parallel to the electrochemical measurement. An exemplary measurement result is illustrated in Fig. 1d. A daily calibration of the ICP-MS and an internal standard (187Re) added downstream of the SFC ensured a constant performance of the ICP-MS during the investigations. All experiments were performed at room temperature (ca. 20°C).
Surface characterization
X-ray photoelectron spectroscopy (XPS) measurements were performed using a Quantera II spectrometer (Physical Electronics, Chanhassen, MN, USA) applying a monochromatic Al Kα X-ray source (1486.6 eV) operating at 15 kV and 25 W. The binding energy scale was referenced to the C 1s signal at 285.0 eV. Analysis of the spectra was carried out with the Casa XPS software (http://www.casaxps.com/). XPS measurements were carried out after linear sweep voltammetry that was used to study activity and stability. Scanning electron microscopy (SEM) images were taken in secondary electron mode using a Leo 1550 VP (Zeiss) operated at 7 kV and 6 mm sample distance.
Results
Formation and heat-treatment of the iridium samples
HIROF were formed on a metallic iridium electrode during continuous potential cycling in the region of iridium oxidation and reduction. Fig. 2a shows how the characteristic shape of a cyclic voltammogram (CV) of iridium changes during the first 500 cycles. Three redox processes in the region of iridium oxidation potentials can be assigned. The main redox couple A2/C2 is assigned to the IrIII ↔ IrIV transition.24,40 Its intensity grows with number of cycles owing to the formation of a new monolayer of HIROF with each cycle. At the same time, HUPD is decreasing due to hindered access of protons to the iridium metal surface (see Ref. 41 and references therein). The A3/C3 couple can be assigned to IrIV ↔ IrV/VI transition and most likely overlaps with the onset of the OER. The so called pre-peak A1 is the least understood feature in the CV of a HIROF. According to Birss et al.,42 it is believed to originate from oxidation of IrIII sites close to the metal/oxide interface and more extensive water exchange detected by in situ mass changes.
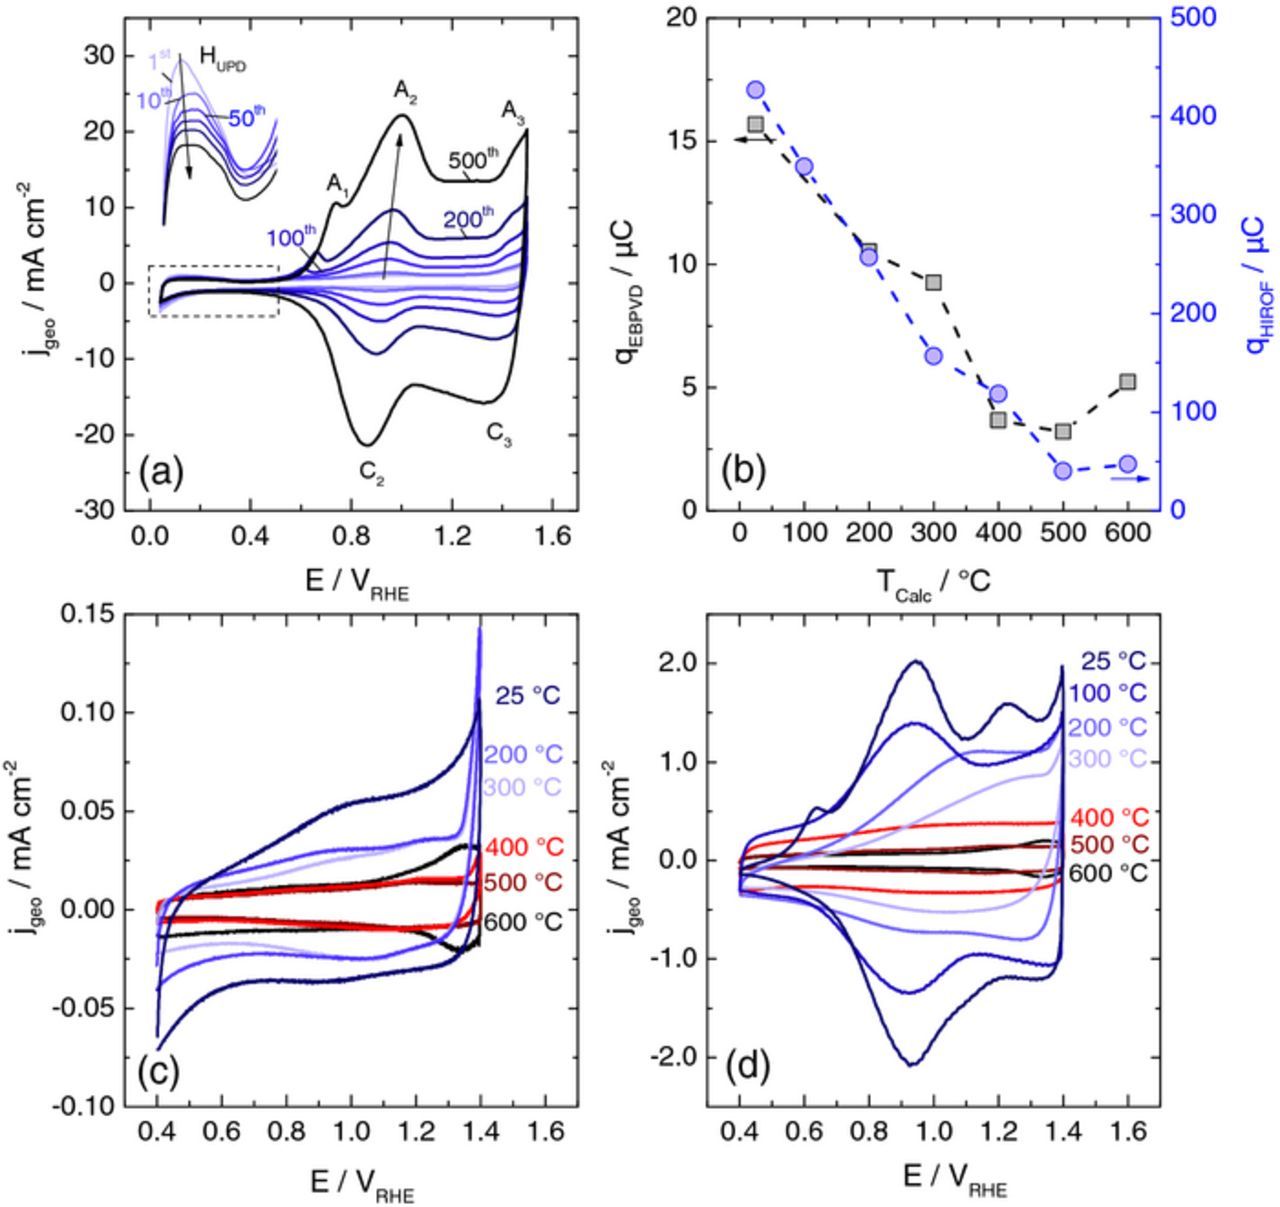
Figure 2. (a) Cyclic voltammograms indicating the growth of a HIROF recorded with the SFC on iridium metal at 500 mV s−1 showing 1st to 500th cycle in 0.1 M H2SO4. (b) Influence of temperature treatment on charge obtained by integration of the CVs (50 mV s−1) for EBPVD (c) and HIROF (d).
As was examined by Pickup and Birss in their study on the growth mechanism, parameters defining the rate of HIROF formation on an iridium metal electrode are the potential limits of cycling and the cycling procedure.24 According to the authors, EUPL (upper potential limit) has to be high enough to partially hydrate the compact oxide and ELPL (lower potential limit) has to be low enough to reduce the compact oxide situated underneath. Reduction of the compact oxide is required to enable the formation of a fresh layer of HIROF in the following potential cycle. More details on the growth of HIROF can be found elsewhere.22–24 Regarding the cycling procedure, it was shown that HIROF can be formed by using both CV and square wave pulse (SQW) programs. Between the two, the latter is much more time efficient and therefore used in this study. The applicability of the SFC is limited when it comes to severe gas evolution on the electrode. Hence, to minimize hydrogen evolution while still reducing the compact oxide layer (at least partially1) ELPL = 0.04 VRHE was adopted. EUPL was chosen to be 1.4 VRHE as in this case the resulting CV used for electrochemical characterization of the oxides resembled the literature data best. To summarize, all HIROF samples in this work were produced with 300 SQW cycles at 2 Hz with ELPL = 0.04 VRHE and EUPL = 1.4 VRHE.
The amount of hydrous oxide formed at the electrode during cycling can be quantified using the charge obtained by integration of a CV. Moreover, the so-called charge enhancement factor (CEF) introduced by the group of Conway23,43–45 is employed to estimate the relative thickness of the oxide layer. The CEF is defined as the ratio of the charge after formation of the HIROF to the charge obtained in the first scan on the iridium metal. Using the described above HIROF formation procedure, a CEF of 28 is obtained in the current work. According to the classification of Conway23 or Elzanowska et al.46 such HIROF layer can be classified as a thin film. Since probability of HIROF detachment enhances with CEF increase, thin films are the most appropriate in the dissolution study presented below.
Following the electrochemical preparation, a part of the HIROFs were treated thermally over 5 h in air at different temperatures (100°C–600°C). For the sake of comparison, the same thermal treatment procedure was applied to the electrochemically untreated EBPVD films. The effect of thermal treatment on the electrochemical behavior was studied using cyclic voltammetry between 0.4 VRHE and 1.4 VRHE at 50 mV s−1. The resulting CVs for EBPVD and HIROF electrodes are shown in Figs. 2c and 2d, respectively. The charge obtained by integration of the total current over time can be used as a measure of active sites.31,47 The dependence of the charge on annealing temperature is shown in Fig. 2b. One can see a comparable descending trend for both types of samples, which was as well obtained for iridium oxides produced with different methods.31,33 Enhanced charge for HIROF by one order of magnitude compared to EBPVD indicates increased porosity of the HIROF. It should be noted that while such method is valid for quantification of active sites on HIROF electrodes, its applicability for metallic EBPVD electrodes is questionable. For the latter, the charge can be mainly due to metallic surface oxidation/reduction rather than due to reversible IrIII to IrIV transition. Only in the high temperature region (500°C–600°C) a comparison between HIROF and EBPVD is feasible, since it is based on the same material properties.
Influence of electrochemical and thermal treatment on morphology
The morphology of the as-prepared, electrochemically and thermally treated electrodes was analyzed using SEM, and the results for representative annealing temperatures are summarized in Fig. 3. Each picture shows the border between HIROF (left part) and EBPVD (right part). Except small particles originating from the physical vapor deposition itself the employed magnification does not allow to identify morphological features at TCalc ≤ 500°C. The morphology of samples formed at 600°C is strikingly different, similar to what was observed by Reier et al.32 They found increased texturing of iridium oxide at 550°C was explained by growth of iridium oxide grains. Additionally, increased texturing and oxidation of the titanium substrate was reported. No signs of titanium presence on the surface, however, was found in the current study (data is not shown).
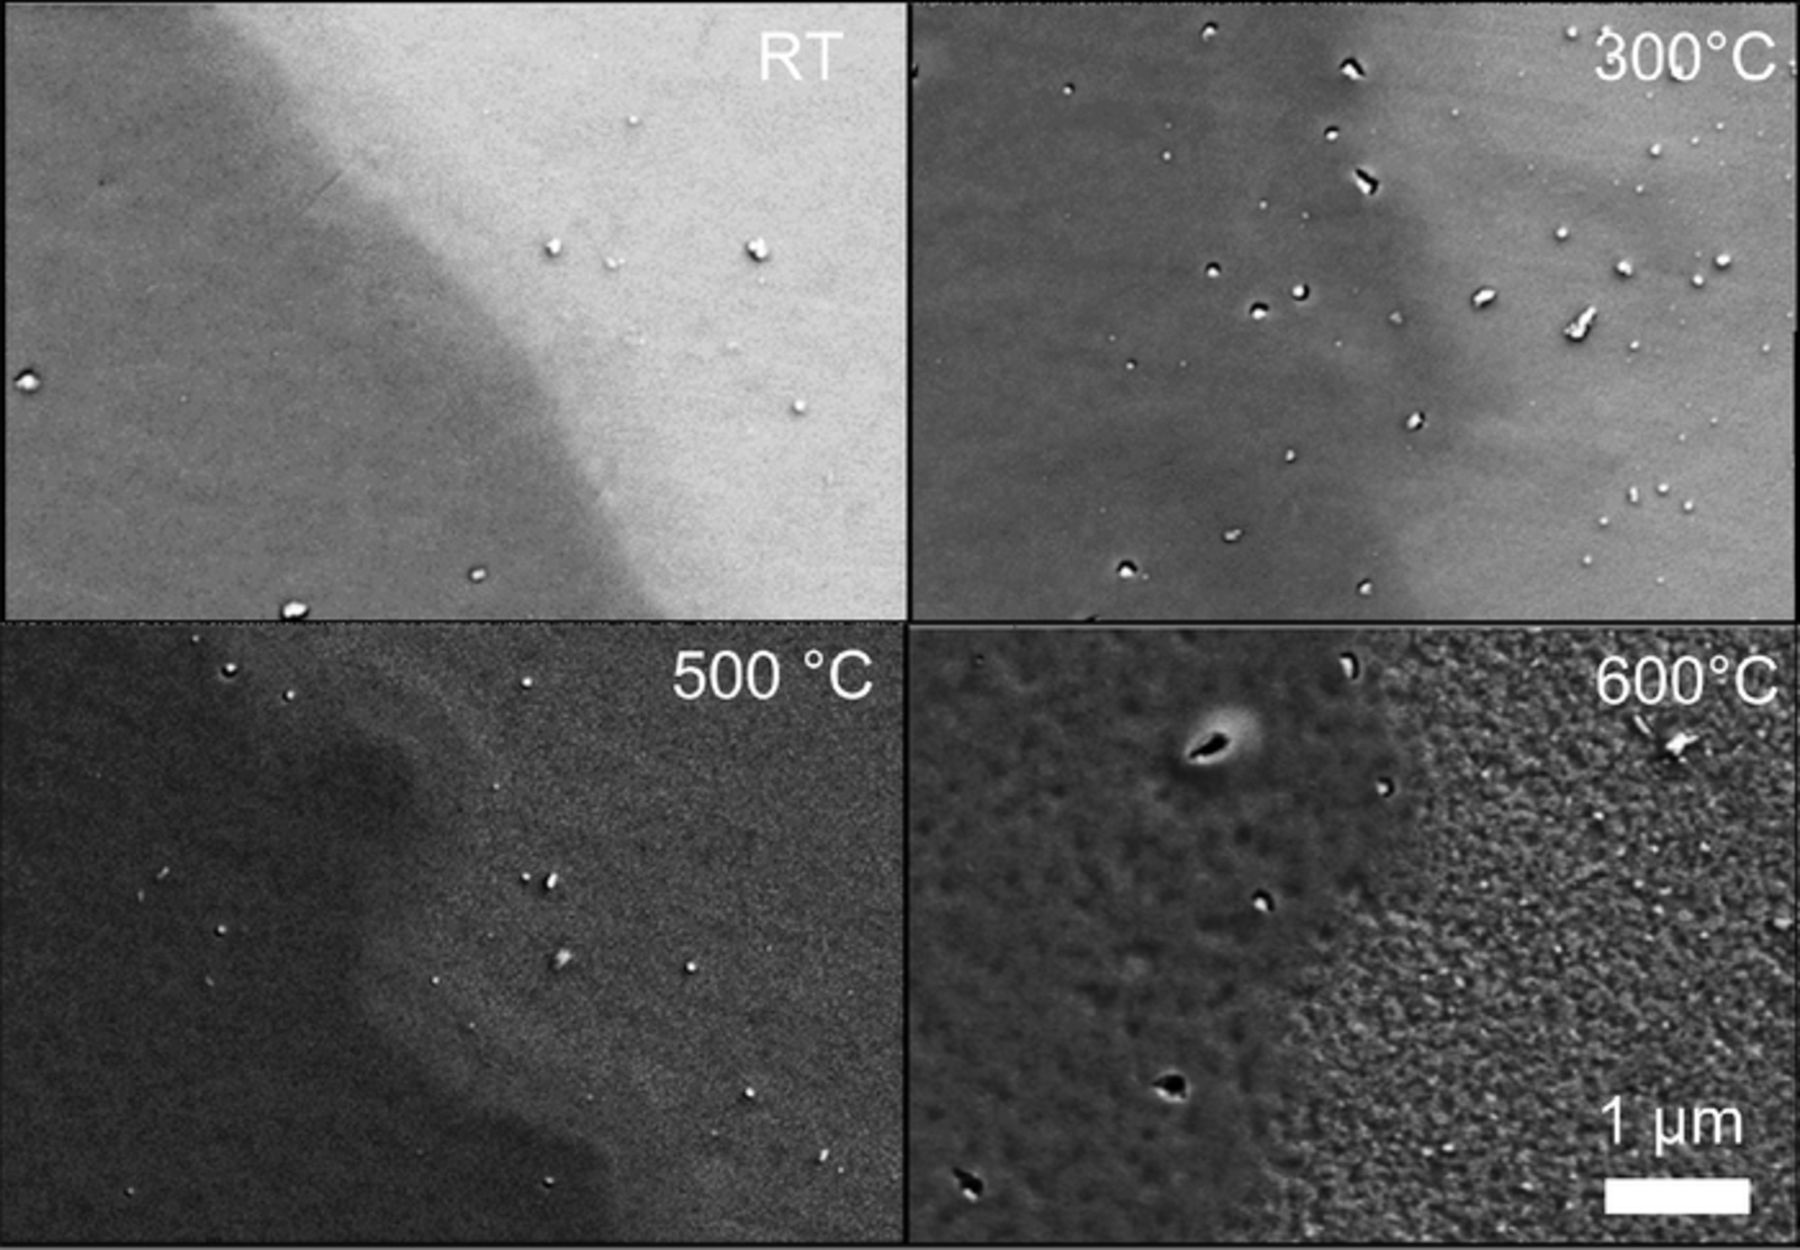
Figure 3. SEM images of the iridium samples after electrochemical and thermal treatment. The HIROF surface is located on the left part of each image while the EBPVD surface can be seen on the right side.
Oxide structure analyzed by X-ray photoelectron spectroscopy
Changes in the electronic structure of the electrodes caused by the electrochemical and thermal treatment were tracked by recording XPS spectra in the region of O 1s and Ir 4f binding energies. As a reference point we use data reported by Kötz et al.48 Shown in Fig. 4a, the XPS spectrum from the as-prepared HIROF reveals that iridium hydroxide is the main phase present on the surface, as the binding energy of the O 1s level at 531.5 eV corresponds well to oxygen in a hydroxyl bonding.11,48 The spectra recorded after heat-treatment indicate a gradual change with the appearance of an additional peak at ca. 530 eV and the diminishing of the peak at 531.5 eV in the samples treated at higher temperatures which is a clear sign of a transition from hydroxyl to lattice oxygen. Fig. 4b presents the Ir 4f spectra recorded on HIROF samples. The latter reveals that iridium on the surface of the HIROF is in an oxidized state, as the signal corresponding to metallic iridium is negligibly small. This indicates that the thickness of the oxide or hydrous oxide films is higher than the escape depth of the photoelectrons. According to recent XPS studies,26,49 the spectrum of amorphous IrOx can be represented as a superposition of two peaks, one is corresponding to IrIV (61.75 eV) and one at 62.4 eV corresponds to IrIII. Hence, the shift of the Ir 4f7/2 peak of 0.5 eV toward lower values with increase in annealing temperature can be related to partial transition of hydrous IrOx to IrO2.
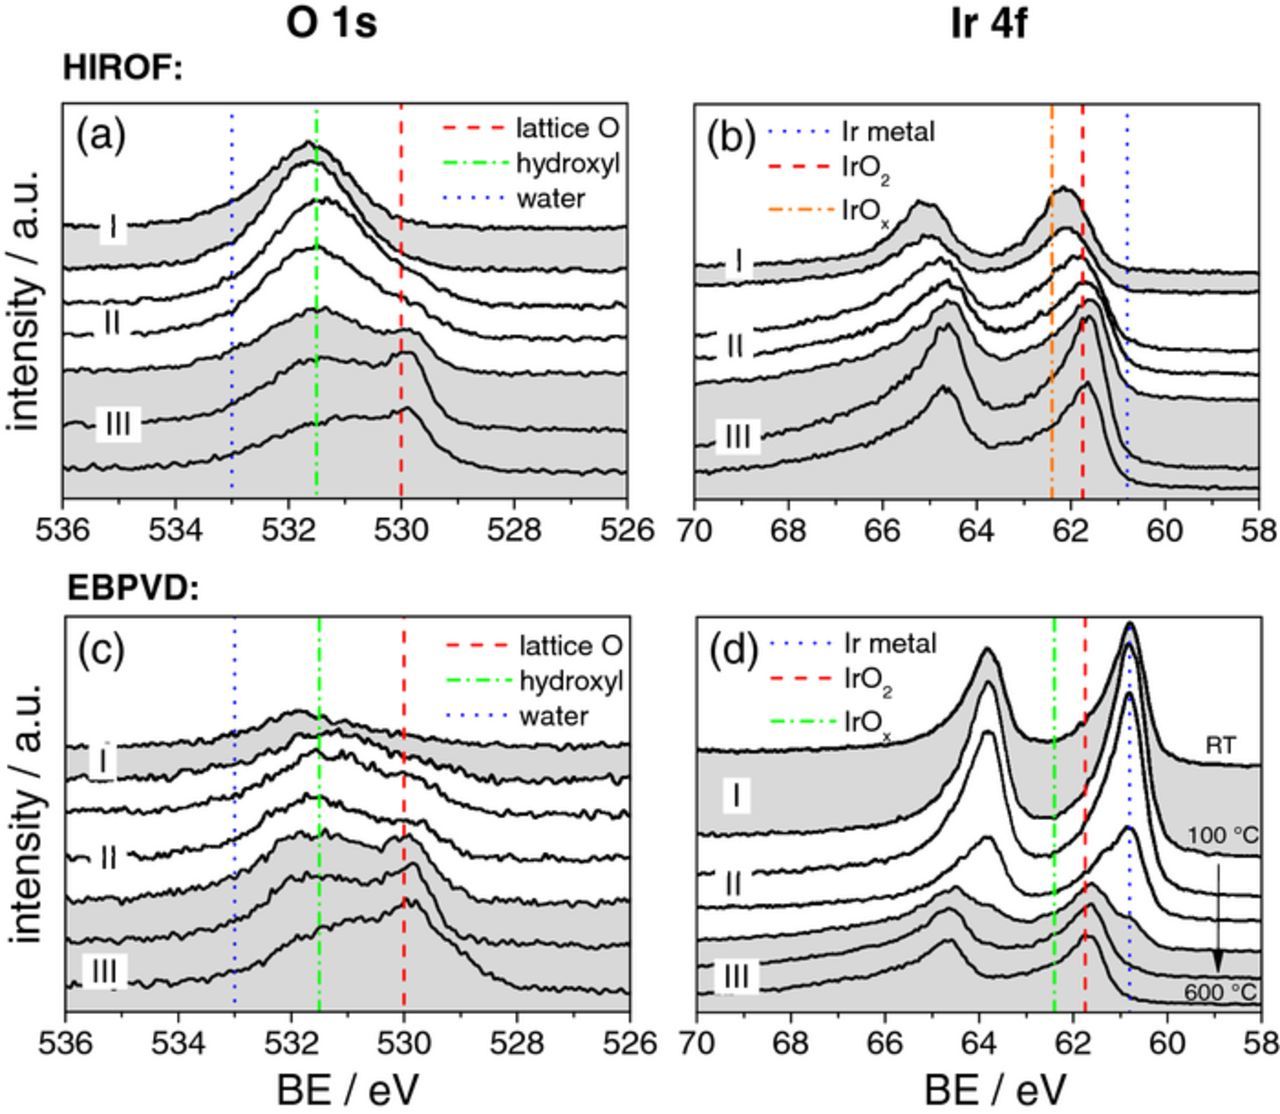
Figure 4. X-ray photoelectron spectra showing the Ir 4f and O 1s levels for the HIROF (upper row) and EBPVD surface (bottom row). The effect of annealing temperature is illustrated in each graph starting from the top line assigned to no thermal treatment (RT = room temperature) until the bottom line of 600°C with a step size of 100°C. Region I, II and III are defined based on activity and stability results as shown in Fig. 5. Dotted lines represent the reference binding energies for Ir- and O-species.11,48,55
Similarly to HIROF, the O 1s spectrum of the untreated EBPVD film shown in Fig. 4c consists of only one broad peak corresponding to OH groups originally present on the surface of a metal stored in air. After thermal treatment at 200°C a component corresponding to oxygen in oxide lattice appears at 530 eV. However, as in the case of HIROF, the oxide lattice component in the O 1s level becomes much more pronounced after the treatment of electrodes at 400°C. In line with the changes in the O 1s level, the Ir 4f spectra in Fig. 4d show the transition from metal toward oxide with increasing temperature. The spectra for the samples treated at temperature below 400°C indicate that no thick oxide layer was formed in 5 hours. A small shoulder in the spectrum for EBPVD400 observed at 60.9 eV corresponds to metallic iridium and indicates that the oxidation is still incomplete. Further increase in temperature results in formation of a relatively thick iridium oxide film on the surface of the electrodes. These data are in agreement with the previously reported results, where on the basis of depth profiling XPS the oxide film thickness was shown to be around 15 nm for iridium treated at 600°C during 5 h.1
Comparison of activity and stability
The SFC-ICP-MS setup was employed in the in-situ investigation of the OER activity and stability of the prepared electrodes. Two short protocols were used, namely a linear potential sweep with the scan rate of 10 mV s−1 up to (i) a limiting potential of 1.55 VRHE or (ii) a potential which corresponds to the limiting current density of 5 mA cm−2geo. Activity was estimated using the resulting electrochemical signal while stability was estimated in parallel by recording the amount of dissolved iridium using the ICP-MS. A typical measurement of electrochemical and dissolution profiles is illustrated in Fig. 1d. The comparison between activity and stability of different electrodes is presented in Fig. 5 by plotting the potential at 5 mA cm−2geo and the total amount of dissolved iridium during the sweep to 1.55 VRHE. For both materials (EBPVD and HIROF) and both properties (activity and stability), three regions can be differentiated: I) non-treated samples, II) samples treated at 100°C–300°C and III) samples treated at 400°C–600°C.
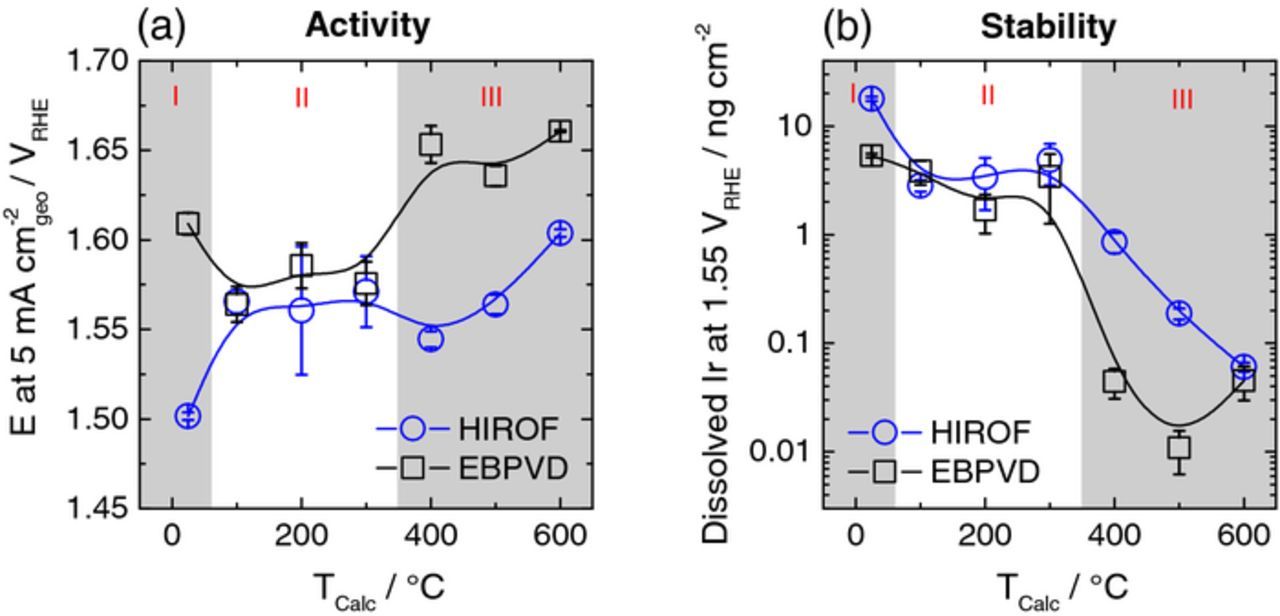
Figure 5. (a) The effect of annealing temperature on activity of the as prepared iridium film (EBPVD) and the hydrous iridium oxide film (HIROF) measured with a linear sweep of potential (10 mV s−1) from 1.2 VRHE to a potential corresponding to the current density of 5 mA cm−2geo. (b) Effect of the annealing temperature on stability; data obtained by integrating the iridium concentration during a sweep of potential of 10 mV s−1 from 1.2 VRHE to 1.55 VRHE. Measurements carried out in 0.1 M H2SO4 (Ar-purged). Error bars calculated from at least 3 repetitions on different spots.
The main trends in Fig. 5 are:
- (a)Increase in activity from region I to II for EBPVD.
- (b)Decrease in activity from region I to II for HIROF.
- (c)Similar and stagnant values for activity and stability for EBPVD and HIROF inside region II.
- (d)Drop in activity for EBPVD from region II to III.
- (e)Slightly increased activity for HIROF from region II to III.
- (f)Decreasing activity for HIROF from 400°C to 600°C.
- (g)More stable electrodes formed at T ≥ 400°C.
Intrinsic activity and stability
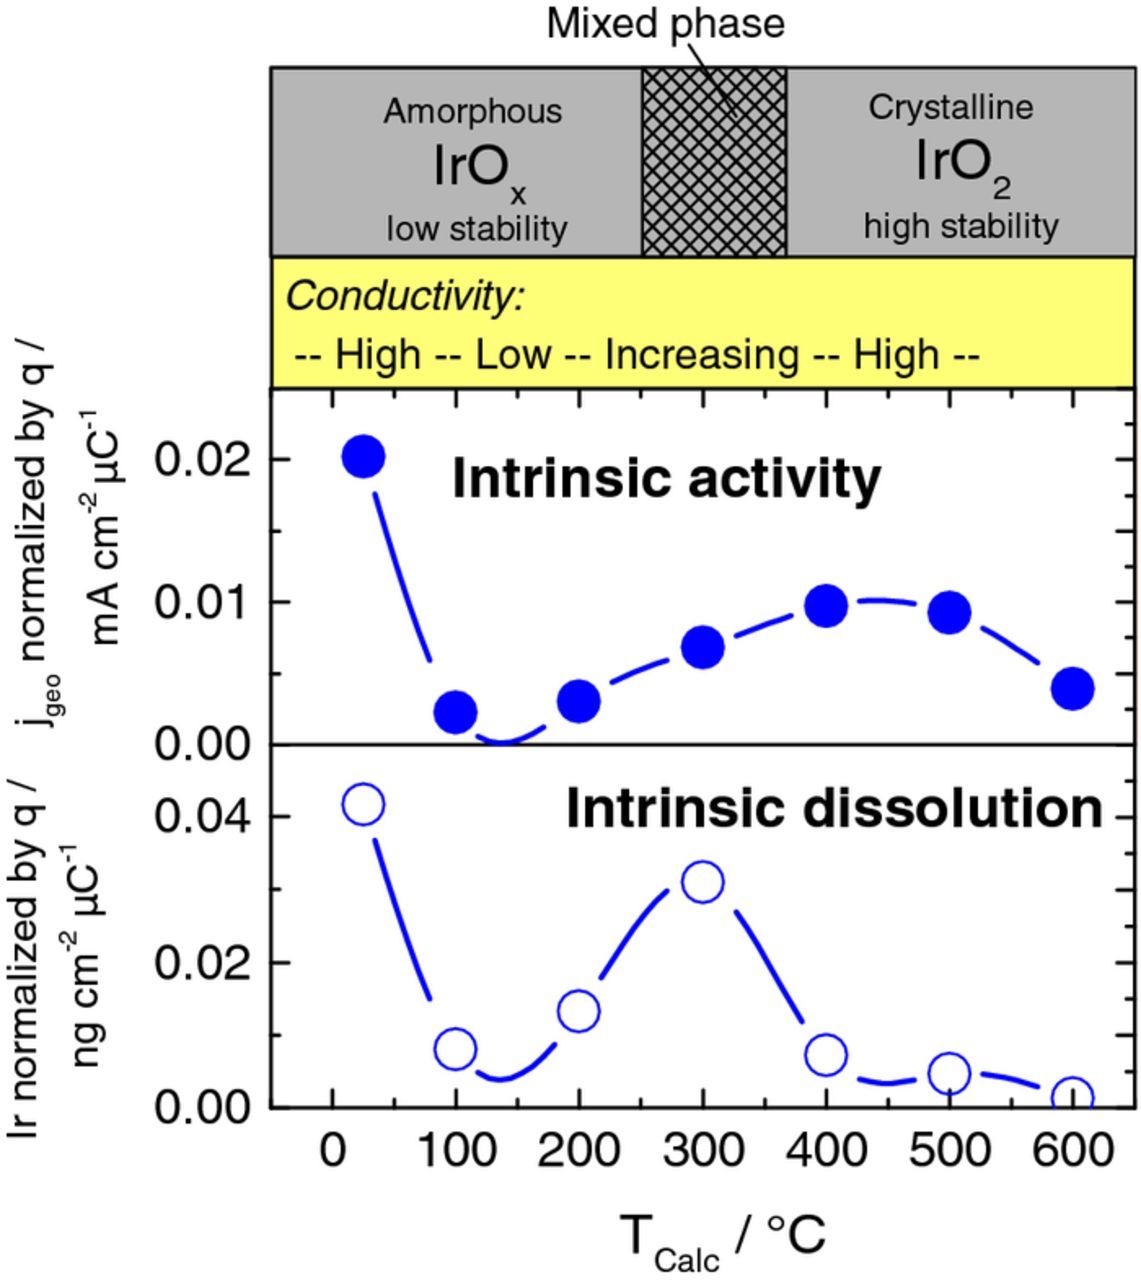
To get an insight on the intrinsic activity, iR-corrected currents observed from a linear potential sweep were normalized by the CV charge presented in Fig. 2b, which can be used as a descriptor for the amount of active sites. Fig. 6 shows the normalized currents at 1.5 VRHE and the normalized dissolution during the linear sweep to 1.55 VRHE. Note that the used method is critical especially in the low temperature range for the EBPVD samples, since (i) the CV charge is influenced by faradaic oxidation currents of the metal and (ii) the dissolution is dominated by transient dissolution of iridium oxidation. Therefore just results of HIROF are presented in Fig. 6. Highest intrinsic activity is observed for HIROFRT with another maximum at HIROF400, while the intrinsic dissolution is enhanced for HIROFRT and HIROF300. The predominant phase composition and a trend for conductivity are given on top to support the discussion (see below).
Discussion
Changes in morphology and oxide structure of the EBPVD and HIROF electrodes upon heat-treatment at various temperatures can be visualized as shown in Scheme 1. According to Fig. 5a the activity of the HIROF film decreases when going from region I to II. This can be attributed to the loss of accessible active sites by "drying" out (shown as dehydration in Scheme 1) of the hydrous oxide film. Indeed, Fig. 2d clearly reflects the loss of active sites by a decrease in the A2/C2 peak intensity. Such loss of water from amorphous iridium oxide upon heat-treatment in the temperature range from 100°C to 300°C was recently confirmed using thermogravimetry quadrupole mass spectrometry (TG-QMS) by Pfeifer et al.26 On the other hand, improved activity of EBPVD100–300 compared to EBPVDRT might be explained by the formation of a thin amorphous oxide layer during annealing. Such layer can be more active compared to the one formed electrochemically on the bare metal during a linear anodic sweep of potential. Both films are stabilized with heat-treatment. Improved stability of HIROF can be understood assuming that both, the amount of accessible active sites and the conductivity decrease with temperature (see discussion of Fig. 6). The latter will result in a slower OER reaction rate on the active sites and, hence, their lower dissolution, as both are related.50 For EBPVD, a better passivation of the underneath laying metallic iridium can be suggested.
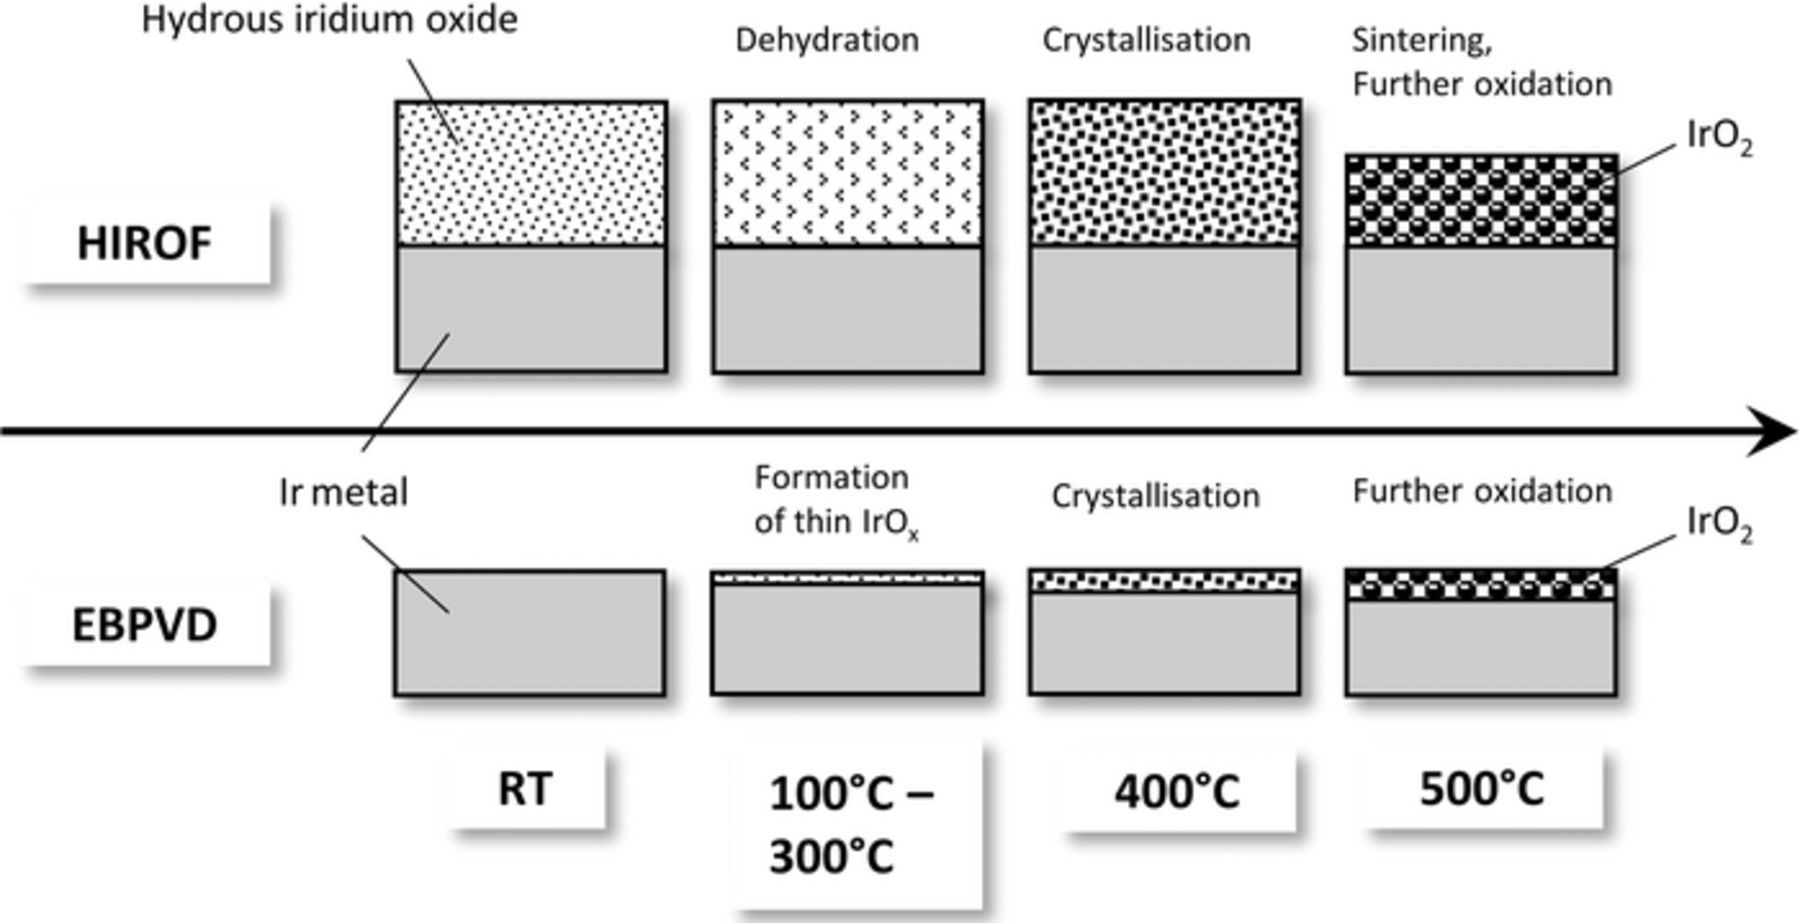
Scheme 1. Main processes taking place during thermal treatment of the studied samples HIROF and EBPVD.
Within region II in Fig. 5 activities of HIROF and EBPVD are comparable and relatively constant. Active surface area variation with temperature discussed in Fig. 2 cannot explain this result as (i) the CV charge of the two electrodes differs for an order of magnitude and (ii) especially for the HIROF the CV charge is decreasing with increasing temperature from 100°C to 300°C. Lower electronic conductivity of the dried amorphous iridium oxide is suggested as explanation. Assuming that conductivity is improving again with increase in annealing temperature, the decrease in active sites can be compensated. Literature data supports our assumption of higher resistivity in amorphous iridium oxide compared to crystalline IrO2.51–53
With increase in annealing temperature from 300°C to 400°C once again the activity trends of the two types of electrodes are opposite. While the overpotential for EBPVD samples is increasing significantly by about 100 mV, the activity of HIROF improves. Results from EBPVD can be understood taking a look at XPS data in Fig. 4d, which indicates the formation of a significant amount of IrO2 at this temperature. Such oxide is less active in comparison to amorphous oxide and metal (covered with a thin layer of electrochemically formed oxide). Formation of IrO2 was as well observed in the XPS spectrum of HIROF400 (Fig. 4b). As mentioned above, activity of HIROF increases in this case. Cruz et al.54 reported the same trend for IrO2 powders from 200°C to 500°C with a high activity for materials treated at 400°C. We assume that initial crystallization of the layer at 400°C improves the conductivity compared to HIROF300, still preserving a high number of active sites for OER in the porous matrix of the oxide. Both electrodes (HIROF400 and EBPVD400) show an improved stability with increase in temperature from 300°C to 400°C due to crystallization. At even higher annealing temperatures the porous matrix of the HIROF will further oxidize and sinter, which explains the decreasing activity for HIROF inside region III. Since there is no porous oxide matrix, no significant sintering is assumed for the EBPVD electrode. As a result, the activity remains relatively constant inside region III for this electrode. Both electrodes are very stable in region III due to surface passivation by the crystalline IrO2 phase confirmed by XPS in Fig. 4. EBPVD400 still contains some metallic iridium (small shoulder in Ir 4f spectrum at 60.9 eV), which could explain enhanced dissolution compared to EBPVD500. Higher dissolution for EBPVD600 is not totally understood and further investigations are necessary to explain this phenomenon. The presence of an additional redox couple at 1.3 VRHE in the CVs for HIROF600 and EBPVD600 in Figs. 2c and 2d and SEM images in Fig. 3 confirm a certain anomaly for this sample. Although, the formation of an Ir-Ti mixed oxide is ruled out by XPS. Stability of HIROF increases in region III due to ongoing processes of crystallization (decreasing amount of relatively unstable hydrous oxide) and sintering (lowering surface area).
The data on intrinsic activity in Fig. 6 can be explained using the same arguments. Briefly, the electronic conductivity of the untreated HIROF in the region of OER is believed to be high.20 Furthermore Pfeiffer et al.26 reported higher intrinsic activity for amorphous hydrous oxide compared to crystalline iridium oxide using BET surface normalization, which could be confirmed using a different normalization method in this work. Defects and IrIII species in the hydrous oxide were suggested to explain the experimental results. The heat-treatment at 100°C–300°C is not sufficient to crystallize iridium oxide, but high enough to dehydrate the hydrous oxide, leading to a steep decrease in conductivity and intrinsic activity. With formation of crystalline phases at T ≥ 400°C conductivity regains. Hence, higher intrinsic activity is observed for these samples. The trend is in good agreement with results published by Hu et al.33 The latter authors observed the intrinsic activity peak at 550°C. A decreased intrinsic activity at 600°C is difficult to explain, but also has been reported in literature.33 Results of Bernicke et al.9 can be used as well to confirm the trend from 300°C to 600°C.
The data on intrinsic dissolution can be explained by the combination of the two properties stability and conductivity. HIROFRT has good conductivity and low stability leading to high intrinsic dissolution. The dried out HIROF100–200 show low intrinsic dissolution since the conductivity is low and the reaction rate for OER decreased. At 300°C some conductive IrO2 crystals form in this so called mixed phase, which leads to increased conductivity of the whole film and therefore dissolution of amorphous IrOx parts enhances. At 400°C mainly the stable IrO2 crystalline phase has formed so that intrinsic dissolution is low even though conductivity is high. High dissolution at 350°C was as well observed in a previous study.10 Interestingly, while showing a similar trend, electrochemical activity and iridium dissolution peak at different potentials.
Conclusions
In this work we investigated how thermal treatment affects physicochemical properties such as morphology, oxide structure and electrochemical surface area of the as prepared iridium film (EBPVD) and electrochemically formed hydrous iridium oxide (HIROF). The latter was synthesized to increase iridium utilization in OER. This was followed by a detailed study on the effect of annealing temperature on OER activity and stability. Both were found to depend on temperature treatment influencing intrinsic activity, amount of active sites and conductivity – parameters defining the catalyst performance. Based on intrinsic activity and dissolution the electrodes treated at 400°C–500°C are identified as most promising for the acidic OER.
Acknowledgments
The authors acknowledge the BMBF (Kz: 033RC1101A) for financial support. S. G. acknowledges financial support from BASF. O. K. acknowledges financial support from the Alexander von Humboldt Foundation. K. M. acknowledges financial support from the DFG under the project number MA4819/4-1.