Abstract
Metal dissolution and passivation of Fe-20Cr alloy in an alkaline solution were investigated using in-situ polarized neutron reflectometry. The dissolution of the alloy, the thickness of sub-layers in the passive film, the interfacial roughness between layers, and the scattering length density profile of the passive film were measured with sub-nanometer resolution. An anodization ratio for oxide growth of 3.4 ± 0.4 nm/V was determined. The oxide formation efficiency and the layer density at different applied potentials were also quantified.
Export citation and abstract BibTeX RIS

This is an open access article distributed under the terms of the Creative Commons Attribution 4.0 License (CC BY, http://creativecommons.org/licenses/by/4.0/), which permits unrestricted reuse of the work in any medium, provided the original work is properly cited.
Composition, structure, and growth of passive films on Fe-Cr alloys are strongly affected by the environments to which the alloys are exposed.1,2 Over the years, a number of methods have been developed to study the passive films in-situ.2–12 For instance, using the rotating ring disc electrode (RRDE) and electrochemical impedance spectroscopy (EIS) to study the dissolution and passivation of Fe-Cr alloys in sulfuric acid, it was observed that the ferrous emission efficiency increased with increasing EIS perturbation frequency and may be explained by the replacement of Fe by Cr in the passive layer.3 An increase in the dissolution rate of iron following the potential increase in the passive region of Fe-Cr alloys in sulfuric acid was also detected by combined inductive coupled plasma-atomic emission spectroscopy (ICP-AES) and electrochemical quartz crystal microbalance (EQCM) measurement.4 In-situ X-ray absorption near edge spectroscopy (XANES) revealed that the passive film on Fe-Cr alloys in acetate buffer (pH 4.5) solution contained Cr3+, Fe2+, and Fe3+ with enrichment of Cr3+ and the ratio [Cr3+]/[Fe2++Fe3+] decreased with increasing potential.5 Similarly, enrichment of Cr in the passive film was also observed in an Fe-Cr alloy using soft X-ray absorption spectroscopy.6 In addition, using ellipsometry7 and EQCM,8 the thickness of the passive film on Fe-Cr alloys was determined to be varying between a few angstroms and several nanometers and increased with increasing potential. It has also been shown that the time-resolved fraction of the film growth current could be calculated from EQCM measurements.10
One of the challenges with the aforementioned in-situ techniques lies in their limited depth resolution that prevents the techniques from accessing more detailed information of the passive film composition and structure in the sub-nanometer regime. Polarized neutron reflectometry (PNR) which has been used to study thin films from the sub-nanometer regime up to about 200 nm thickness13,14 is a non-destructive examination method and can be combined with electrochemical techniques to perform in-situ characterization of the passive film under controlled chemical and electrochemical conditions. The scattering length density (SLD) profile obtained from the measured reflectivity curves provides information about the thickness of layers in the sample, interfacial roughness, material density, and composition depth profile.13–21 In this study, we use PNR to study the passive film growth on an Fe-Cr alloy thin film in an alkaline environment.
Experimental
Fe-20% Cr (in weight percentage) thin films were prepared by magnetron sputtering from a target of the same composition to produce 25 nm thick films on 100 mm diameter x 6 mm thick polished Si(111) wafers. The chemical composition of the thin films was confirmed by X-ray photoelectron spectroscopy (XPS) which detected approximately 79% Fe (in weight percentage), 19% Cr and small amounts of C, N, and O of less than 2%. The thin film samples were stored in a vacuum chamber to minimize the growth of the air-formed oxide layer. An electrolyte of 0.01M NaOH (pH 12) was prepared using deionized water and NaOH reagent. The solution was deaerated using ultra-high purity N2 gas prior to, and during the experiments.
A three-electrode electrochemical cell with a Pt thin foil counter electrode and a KCl saturated Ag/AgCl reference electrode was used in electrochemical experiments. All potentials were reported with respect to this reference electrode. Cyclic voltammetry (CV) experiments were performed in the range between −1.0 and +1.0 V at a scan rate of 10 mV/s. Potentiostatic experiments were conducted on the Fe-20Cr thin film sample concurrently with PNR. Prior to the potentiostatic experiments, the sample was magnetized in a 1000 G magnetic field and was kept in a 56 G magnetic field during the potentiostatic and PNR experiments. The open circuit potential of the sample settled at ca. −0.42 V after 20-hour exposure to the deaerated 0.01 M NaOH solution. The potentiostatic experiment started at an applied potential of −0.2 V. The potential was increased by 0.2 V every 8 hours until it reached +0.6 V. A Solartron 1287 potentiostat was used in both cyclic and potentiostatic experiments.
Figure 1a shows a schematic of the in-situ PNR experimental setup at the National Research Universal (NRU) reactor (Chalk River, Ontario, Canada). This setup allows PNR measurements to be performed concurrently with electrochemical experiments. For the PNR experiments, a neutron beam with a wavelength of 0.237 nm was polarized and the spin of the neutron beam was controlled using a spin flipper.13,14,22 A magnetic guide field was provided along the neutron path to maintain the polarization of the neutron beam. The polarized neutron beam travelled through the Si wafer before it reached the alloy/electrolyte interface at a small grazing angle. The intensity of the specular reflected beam was recorded at different grazing angles θ and the reflectivity curves were plotted as a function of the scattering vector Q which is related to the incident beam angle and the neutron wavelength by the following expression:13,16
![Equation ([1])](https://content.cld.iop.org/journals/1945-7111/166/11/C3064/revision1/d0001.gif)
The intensity of the reflected and transmitted wave can be described with a neutron spin-dependent index of refraction n±, identical to the classical optics:13
![Equation ([2])](https://content.cld.iop.org/journals/1945-7111/166/11/C3064/revision1/d0002.gif)
where N is the atomic density of the material, λ is the neutron wavelength, bnuc and bmag are the nuclear and magnetic scattering length of the nucleus, respectively. The product N⋅b is called the scattering length density (SLD) which is a characteristic of the material. The "+" is used for spin-up neutrons (spin parallel to the external magnetic field H provided by a pair of Helmholtz coils), the "−" is used for spin-down neutrons (spin antiparallel to the external magnetic field). We performed two PNR measurements at every grazing angle: one with spin-down (R−), and one with spin-up (R+) neutrons. PNR measurements started at least one hour after each potential change in the potentiostatic experiment. During this time, the current transient on the sample decreased below 2 × 10⁻⁷ A/cm2 ensuring minimal oxidation of the sample in the subsequent PNR measurements. The thickness, roughness, and SLD profile of the layers in the thin film sample were obtained by fitting the spin-down and spin-up reflectivity curves simultaneously to a thin film model comprised of Si, SiO2, Fe-20Cr, inner layer, and outer layer (Figure 1b) with no constraint on the SLDs of the inner and outer layers. This allowed the fitting to freely change the SLDs of the inner and outer layers but did not force it to fit to a predefined composition. The fitting procedure utilized a least squares fit algorithm which included a recursion algorithm developed by Parratt.23,24 This simultaneous fitting procedure of the two reflectivity curves obtained by PNR provided more confidence in the fitting results compared to the unpolarized neutron reflectometry technique. By allowing a change in the figure of merit of fitting be less than 10%, the error in the thickness measurement was determined to be less than 0.2 nm.
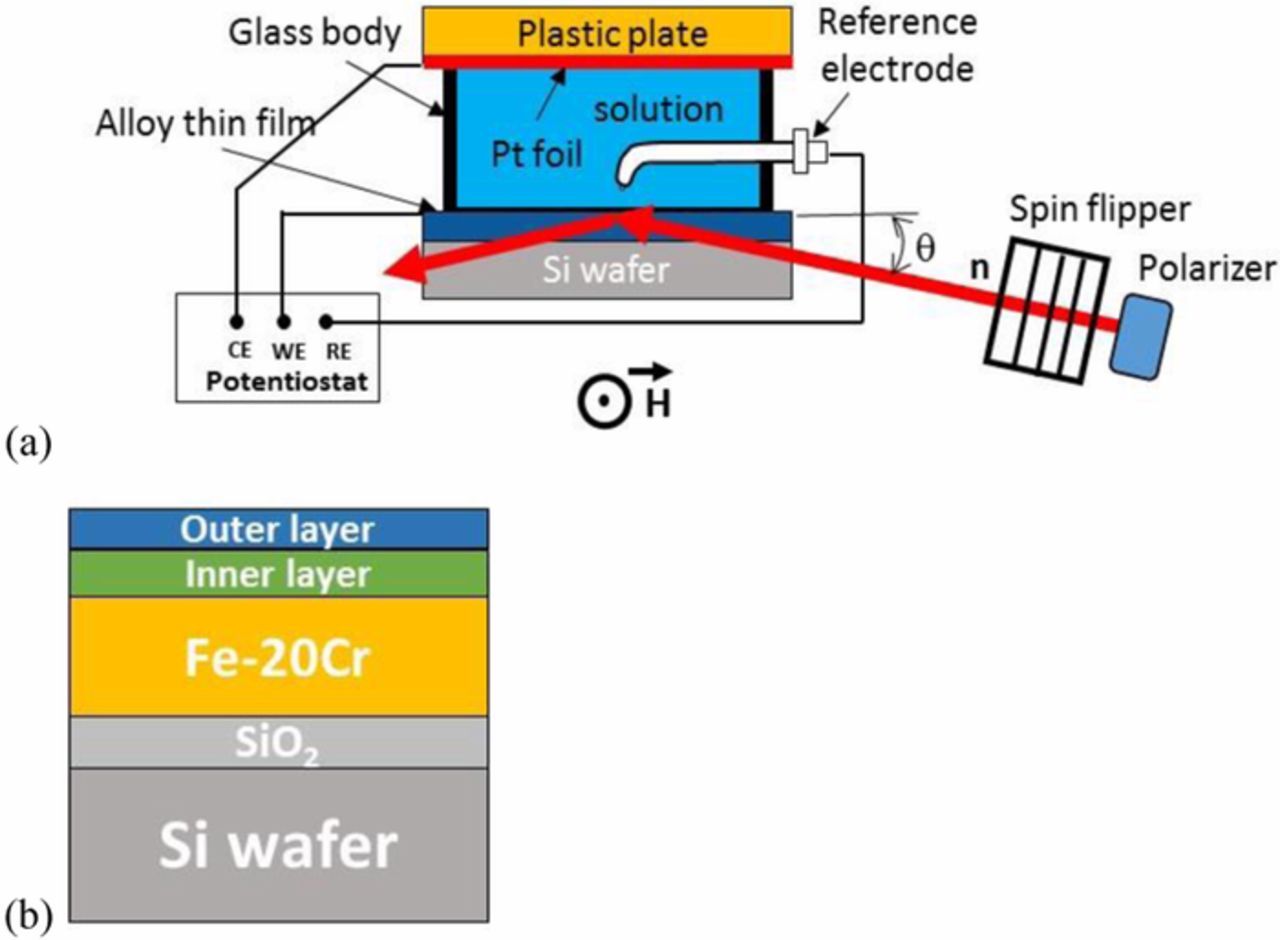
Figure 1. (a) Schematic of the in-situ PNR experiment on the D3 beamline at the NRU reactor. The thin film sample, the Pt foil, and the reference electrode were connected to the corresponding terminal of the potentiostat for potential control and electrochemical measurements. The neutron beam travelled to the thin film/electrolyte interface through the Si wafer; (b) model of the Fe-20Cr thin film on Si wafer exposed to an aqueous environment used for fitting of PNR curves.
Results and Discussion
The CV of the Fe-20Cr thin film in deaerated 0.01 M NaOH solution (Figure 2) shows four anodic (A1, A2, A3, and A4) and two cathodic (C1 and C2) peaks. The CVs of pure Fe and Cr are also plotted in the same graph for comparison. Anodic peaks A1, A2 and A3 and cathodic peak C2 could be attributed to the electrochemical processes related to Fe and the anodic peak A4 and cathodic peak C1 could be attributed to the electrochemical processes related to Cr. Similar behavior of FeCr alloys in alkaline environments was reported by other researchers.25,26 Peak A1 is referred to the oxidation of adsorbed hydrogen, peak A2 to the oxidation of Fe to Fe2+, peak A3 to the oxidation of Fe2+ to Fe3+, and peak C2 to the reduction of Fe3+ to Fe2+.26 Anodic peak A4 coincides with the transpassive dissolution of pure Cr. However, the current density of Fe-20Cr decreased above +0.5 V and transpassive dissolution did not occur in the Fe-20Cr alloy. Therefore, peak A4 is mainly attributed to the oxidation of Cr3+ to Cr6+. The small cathodic peak C1, observed in both Fe-20Cr and pure Cr, is probably related to a reduction of a minor amount of chromate to Cr3+. Oxygen evolution takes place at potentials above +0.8 V on both Fe-20Cr and pure Fe. Passive behavior in the Fe-20Cr thin film is observed between −0.2 and +0.8 V.
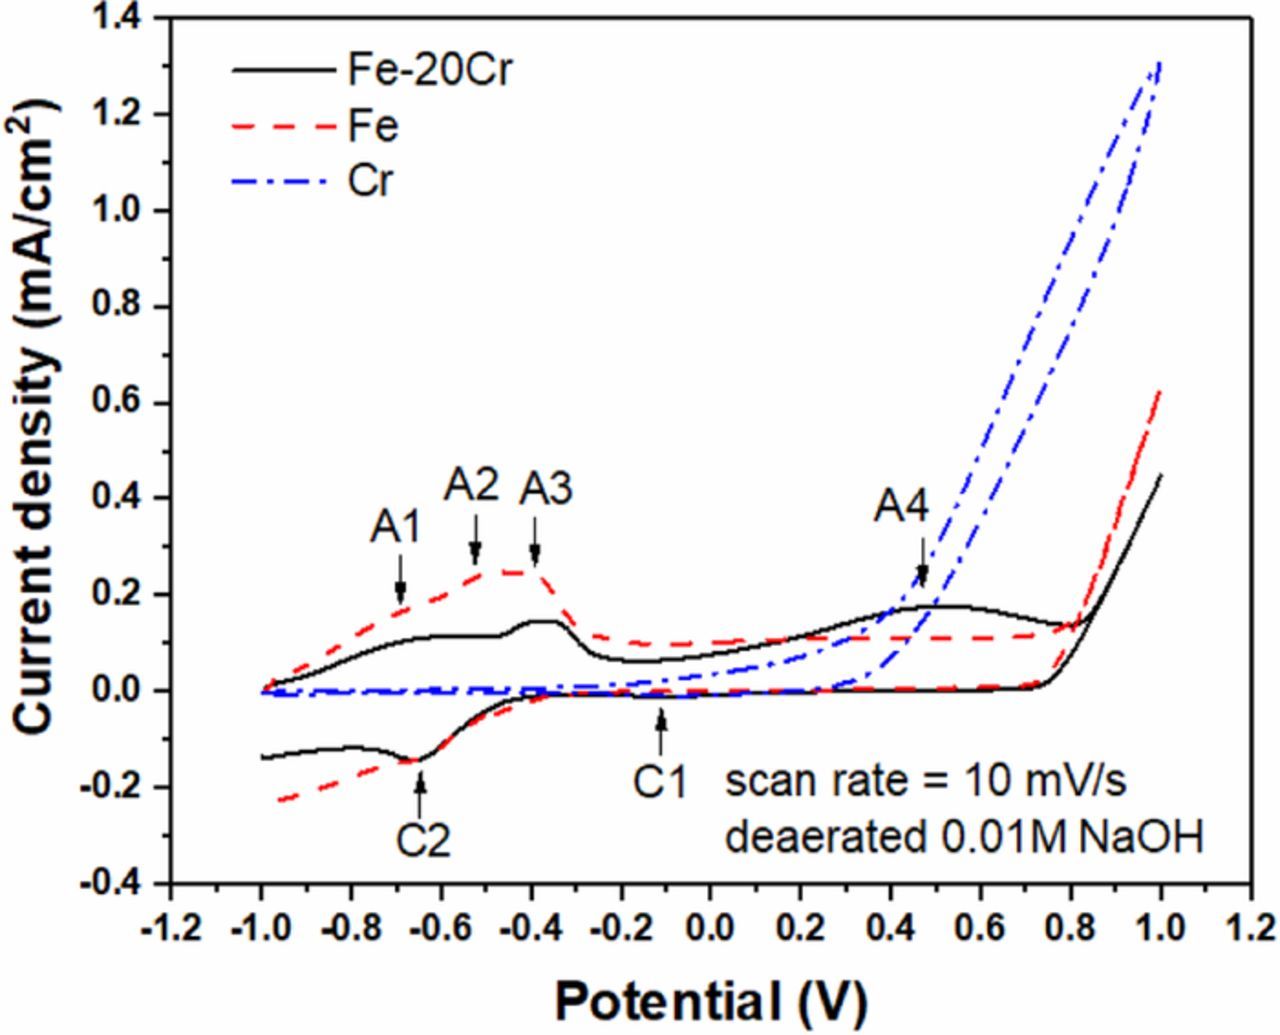
Figure 2. Cyclic voltammograms of the Fe-20Cr thin film, pure Fe, and pure Cr in deaerated 0.01 M NaOH solution. A1, A2, A3 and A4 are oxidation peaks. C1 and C2 are reduction peaks.
Figure 3 shows selected reflectivity curves measured on the Fe-20Cr thin film exposed to deaerated 0.01M NaOH solution at potentials from OCP (−0.42 V) to +0.6 V. The spin-up reflectivity curve is shifted to higher Q compared to that measured with spin-down neutrons as expected due to a higher SLD for spin-up neutrons (Equation 2). Kiessig fringes, which are the result of interference of neutron beams reflected from the surface and interfaces in the sample, are observed. It is worthwhile to mention that the error bars of the data points for Q < 0.07 Å−1, are smaller than the size of the data symbols. Therefore the error bars are excluded from the plot in Figure 3. Experimental and fitted reflectivity curves at each potentials are shown in Figure 4a. The SLD profiles obtained from the fitting are shown in Figure 4b. The roughnessa at the Si/SiO2 and SiO2/Fe-20Cr interfaces are 0.2 and 1.2 nm, respectively, and do not change. The roughness at the Fe-20Cr thin film, inner oxide layer, and outer hydroxide layer interfaces, however, vary between 0.4 and 2.1 nm when the potential increases from −0.2 to +0.6 V. A summary of the layer thickness and roughness is listed in Table I.
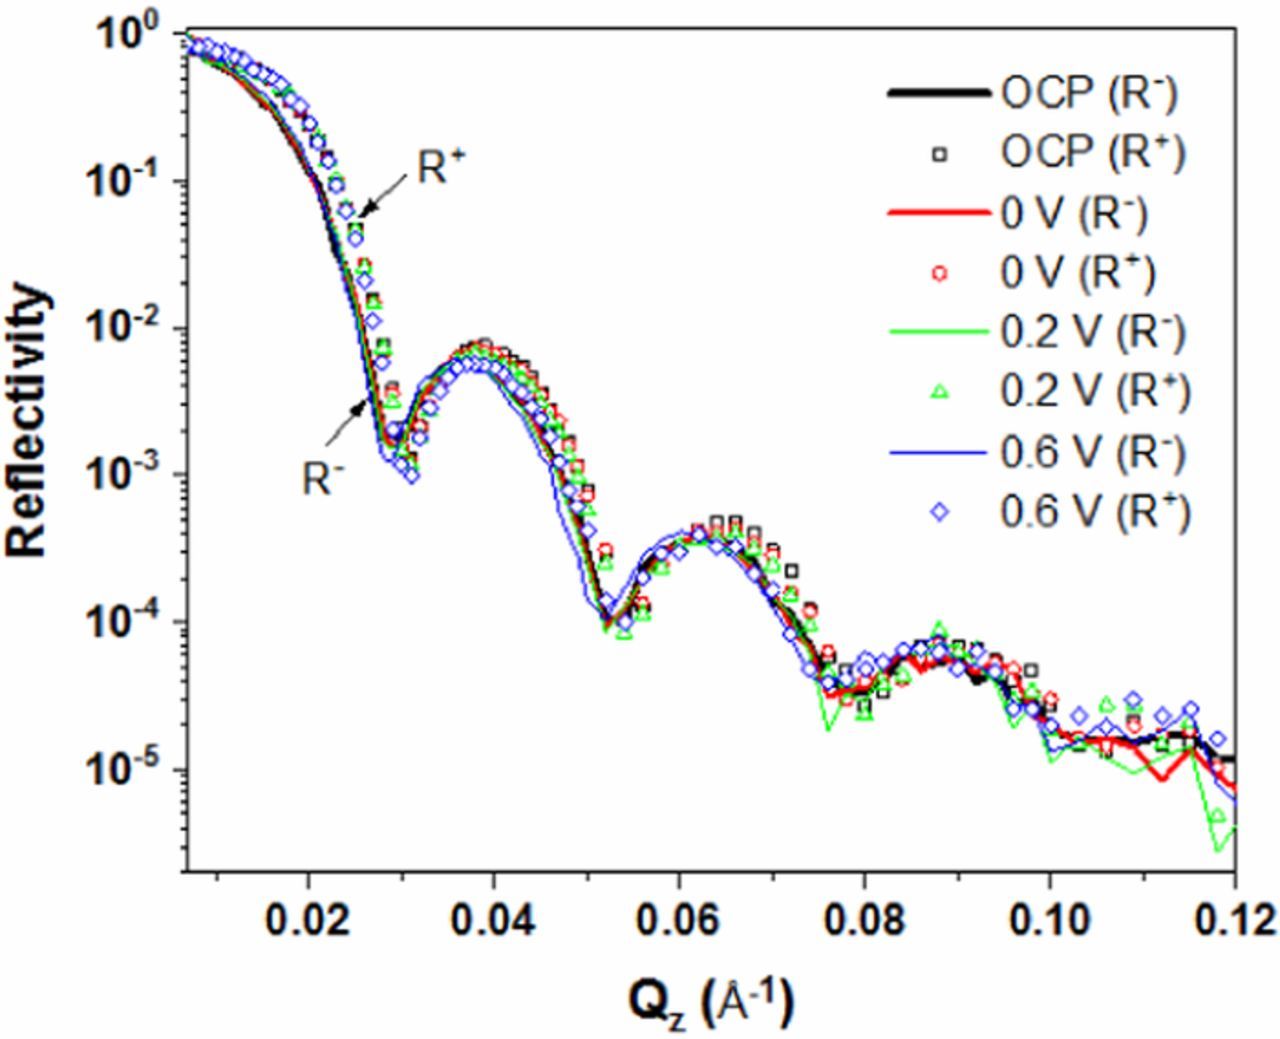
Figure 3. Selected reflectivity curves at OCP, 0, +0.2 and +0.6 V obtained by in-situ PNR during potentiostatic experiments of the Fe-20Cr thin film exposed to deaerated 0.01 M NaOH solution.
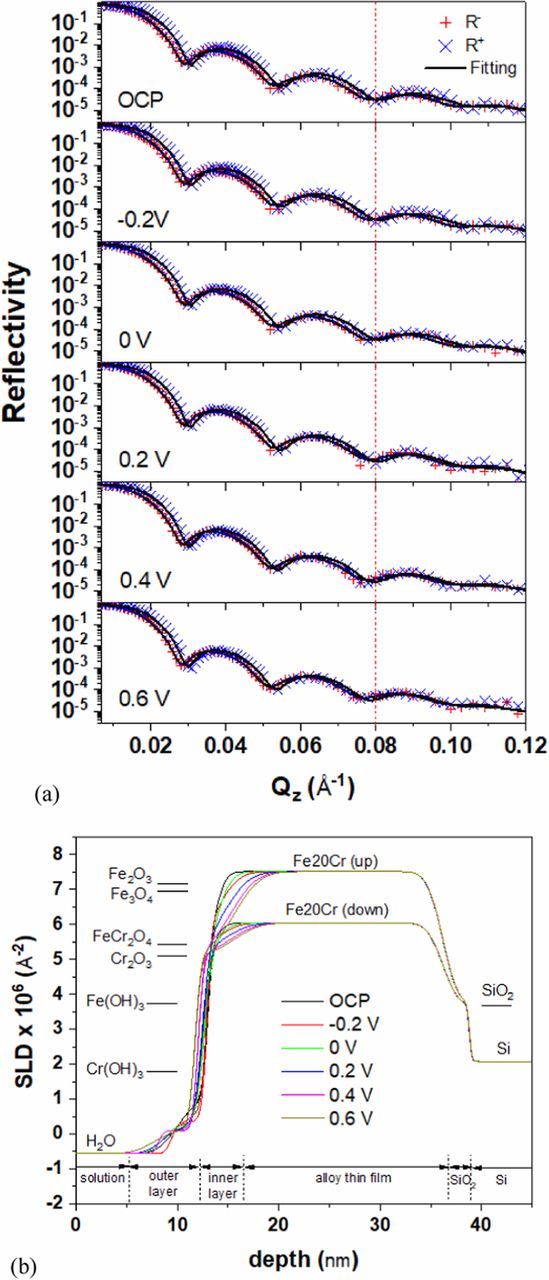
Figure 4. Analysis of the PNR results measured during potentiostatic experiments of the Fe-20Cr thin film exposed to deaerated 0.01 M NaOH solution at potentials between OCP and +0.6 V. (a) experimental and fitted reflectivity curves, the vertical dotted line shows how the minima in the reflectivity curves shift at different applied potentials; (b) SLD profiles and approximate locations of each layer in the thin film sample.
Table I. Summary of layer thickness (d) and roughness (σ) from fitting the PNR results.
| E (V) | dalloy (nm) | σalloy/oxide (nm) | doxide (nm) | σoxide/hydroxide (nm) | dhydroxide (nm) | σhydroxide/electrolyte (nm) | σSiO2/alloy (nm) |
|---|---|---|---|---|---|---|---|
| OCP | 22.4 | 0.8 | 0.7 | 0.4 | 3.0 | 1.6 | 1.2 |
| −0.2 | 22.4 | 1.7 | 0.9 | 0.4 | 3.5 | 1.6 | 1.2 |
| 0 | 22.2 | 1.2 | 1.3 | 0.6 | 4.0 | 1.1 | 1.2 |
| 0.2 | 21.6 | 2.0 | 2.1 | 0.6 | 4.6 | 1.3 | 1.2 |
| 0.4 | 20.9 | 2.1 | 3.2 | 0.4 | 3.9 | 1.5 | 1.2 |
| 0.6 | 20.6 | 2.1 | 3.8 | 0.5 | 4.2 | 1.6 | 1.2 |
The experimentally determined nuclear SLD of the FeCr alloy is 6.8 × 10⁻⁶ Å−2 and is very close to the theoretically expected SLD of 7 × 10⁻⁶ Å−2. However, the experimentally determined magnetic SLD of 0.7 × 10⁻⁶ Å−2 is much smaller than the expected 4 × 10⁻⁶ Å−2 of a magnetically saturated Fe-20Cr alloy.27 The external magnetic field of 56 G is obviously not high enough to saturate the polycrystalline sample. In certain crystallographic directions, more than 2000 G is needed to align the magnetization of thin Fe films parallel to the field.28,29
The SLD of the inner layer (Figure 4b) is close to those of both Cr2O3 and FeCr2O4, but not likely Fe2O3, in agreement with an XPS analysis which detected Cr(III) and Fe(II) as the main composition of the inner passive layer on FeCr alloys in 1M NaOH.26 The exact composition of the inner oxide, however, cannot be determined from PNR results. Based on ex-situ XPS results, researchers proposed the outer layer of the passive film on Fe-Cr alloys is comprised of mainly Cr(OH)3 and a small amount of FeOOH which is the dehydrated form of Fe(OH)3 assumed to form when the film was exposed to the vacuum chamber of the XPS.1,26,30–32 The SLD of the outer layer is approximately 0.2 × 10⁻⁶ Å−2 which is much lower than the theoretical SLD of either Cr(OH)3 (1.7865 × 10⁻⁶ Å−2) or Fe(OH)3 (3.7461 × 10⁻⁶ Å−2). The low SLD of the outer layer can be attributed to the lower density of the outer layer compared to solid hydroxide phase. Assuming the outer layer is mainly Cr(OH)3 and the pores/voids in the outer layer are filled with water, the density of the outer layer can be calculated from the SLDs as follows:
![Equation ([3])](https://content.cld.iop.org/journals/1945-7111/166/11/C3064/revision1/d0003.gif)
Using Equation 3, the density of the outer layer is calculated to be approximately 66% at OCP and decreases to approximately 29% at +0.6 V.
The thicknesses of the Fe-20Cr alloy and the passive film during potentiostatic experiments are shown in Figure 5. At OCP, the thickness of the alloy is ca. 22.4 nm and those of the inner oxide and outer hydroxide are less than 1.0 and 3.0 nm, respectively. When the potential is increased from OCP to +0.6 V, the alloy dissolves by ca. 2.0 nm and the inner oxide grows by ca. 3.0 nm. The hydroxide thickness also increases to ca. 4.6 nm at +0.2 V but reduces to ca. 4.0 nm at higher applied potentials. Linear regression of the thickness vs. E results yields an anodization ratio for oxide growth of 3.4 ± 0.4 nm/V. This anodization ratio is slightly smaller than the value of ca. 4.0 nm/V obtained for the passive film of an Fe-20Cr alloy exposed to 1 M NaOH solution in the same potential range using ex-situ XPS.26
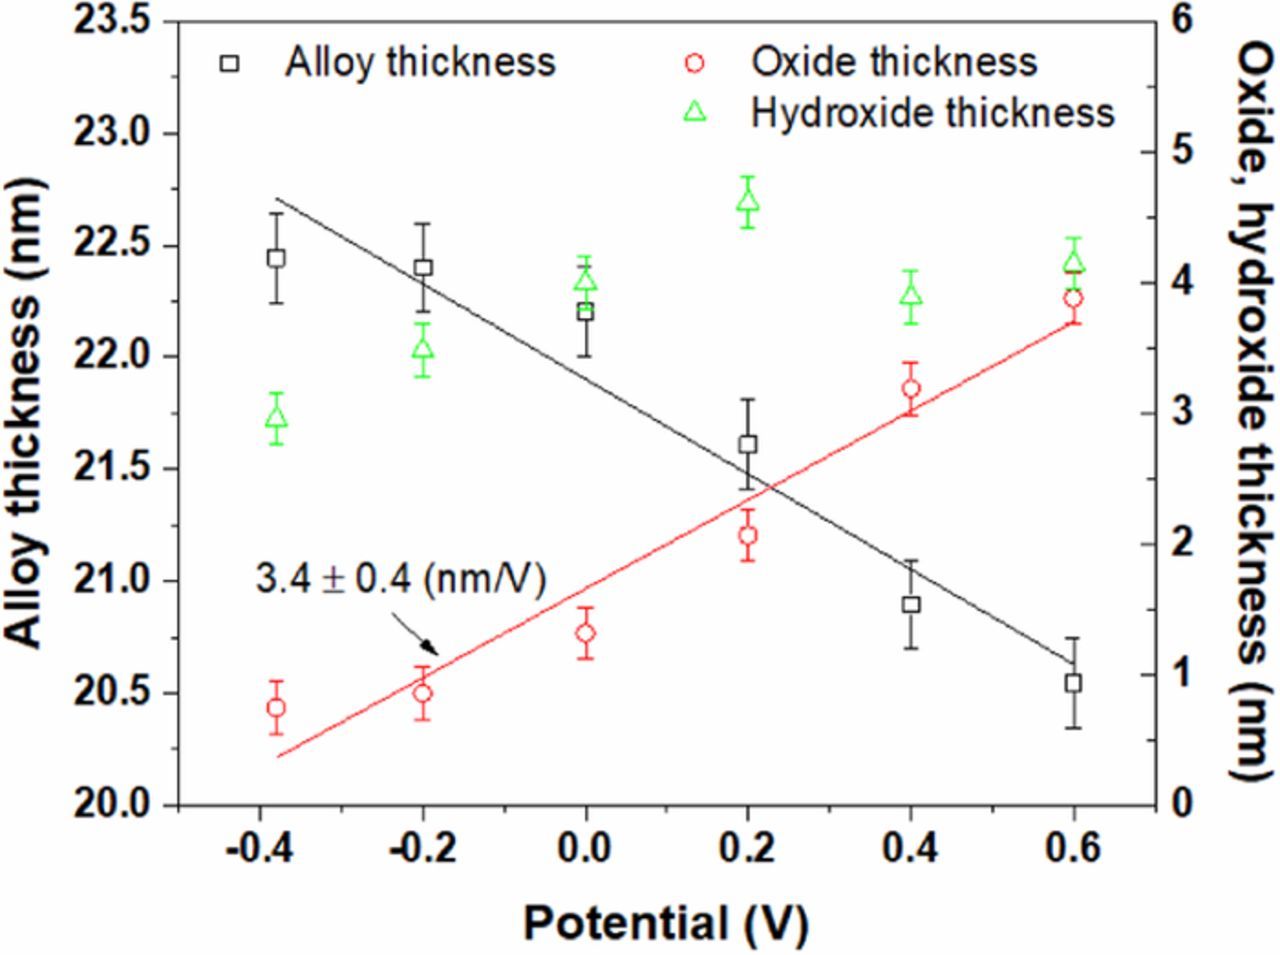
Figure 5. Changes in the thicknesses of the Fe-20Cr thin film and the passive layer.
Thermodynamically, FeCr2O4 is more stable than Cr2O3 at room temperature.33 However, it has been shown experimentally that the most favorable oxide phase predicted by thermodynamics is not always the only oxide observed in the passive film because of their slower kinetics of formation compared to the less stable ones.34,35 The concept of non-equilibrium oxides with captured solutes have also been proposed to explain unexpected combinations of composition and crystallography far outside thermodynamic solubility limits observed on Ni-Cr alloys.36 Identifying the correct oxide phase in the passive film is challenging because it requires the information of both composition and structure of the oxide. Due to the lack of those information, we assumed the two widely accepted stoichiometric oxide phases, i.e. FeCr2O4 and Cr2O3, in the calculation of the oxide formation efficiency. By a simple derivation from Faraday's law, the efficiency of the oxide layer formation can be expressed by:
![Equation ([4])](https://content.cld.iop.org/journals/1945-7111/166/11/C3064/revision1/d0004.gif)
where Q is the amount of charge per unit area for alloy dissolution or oxide formation, n is the number of electron transferred in the alloy dissolution or oxide formation reactions (nalloy = 2.2, nFeCr2O4 = 2.67 and nCr2O3 = 3), ρ is the density of the materials, Δd is the thickness of alloy consumed or oxide grown, M is the molecular weight. Using the parameters for Cr2O3 and FeCr2O4, the oxide forming efficiencies for each oxide composition are calculated to decrease from 0.84 to 0.55 and from 0.49 to 0.32, respectively, as the applied potential increase from −0.2 to +0.6 V. The decrease in the oxide forming efficiency indicates more metallic ions leaving the passive film with increasing potential.
Conclusions
Metal dissolution and passive film growth of an Fe-20Cr thin film under controlled chemical and electrochemical conditions were investigated using in-situ PNR. The thickness and interfacial roughness of the individual layers in the passive film were measured in-situ with sub-nanometer resolution. An anodization ratio for oxide growth of 3.4 ± 0.4 nm/V was determined. Considering the passive film was comprised of Cr2O3 and/or FeCr2O4 inner oxide and Cr(OH)3 outer hydroxide, a trend of decreasing oxide formation efficiency and decreasing hydroxide layer density was observed as the potential increased from −0.2 to +0.6 V.
ORCID
Hung M. Ha 0000-0002-1461-8835
Footnotes
- a
All roughness in this manuscript refer to the root mean square roughness.