Abstract
In some anoxic aqueous environments, especially in underground nuclear waste repositories, the thermodynamic stability of copper is disputed. This communication presents how a highly sensitive H2 detector may be used to define an upper bound of the rate of copper corrosion in anoxic aqueous media. Preliminary results are shown for pure water and 0.25–5.0 mol kg−1 NaCl solutions at 30 – 75°C. The results are interpreted to provide maximum corrosion rates to directly support safety assessments for geological repository designs around the world.
Export citation and abstract BibTeX RIS

This is an open access article distributed under the terms of the Creative Commons Attribution 4.0 License (CC BY, http://creativecommons.org/licenses/by/4.0/), which permits unrestricted reuse of the work in any medium, provided the original work is properly cited.
Deep geological repositories (DGRs) are under evaluation for the feasibility and long-term safety of passive and permanent containment of high-level nuclear waste. Most DGR designs include a used fuel container (UFC) to isolate the waste from the environment for many thousands of years.1 On account of its presumed thermodynamic immunity in anoxic post-closure repository environments,2 copper has been a favored corrosion barrier material for several decades.1 Copper therefore finds use in dual-vessel copper-steel (e.g., Finnish/Swedish KBS-3)3,4 and copper-coated steel container designs (e.g., Canada's Nuclear Waste Management Organization).5,6 However, the underlying assumption of copper's immunity has been intensely debated.7–21
Previous discussions on the possibility of copper corrosion have generally focused on thermodynamic and equilibrium arguments.16,19 This communication presents an alternative approach that makes no effort to resolve these uncertainties. Rather, maximum corrosion rates are calculated based on direct measurement of hydrogen released from anoxic solutions containing metallic copper, regardless of the hydrogen source.
Methods
Corrosion rate calculations
It is assumed that any corrosion of copper in anoxic aqueous media involves the production of hydrogen gas, according to the acidic and alkaline cathodic reactions, respectively:
![Equation ([1a])](https://content.cld.iop.org/journals/1945-7111/166/11/C3015/revision1/d0001.gif)
![Equation ([1b])](https://content.cld.iop.org/journals/1945-7111/166/11/C3015/revision1/d0002.gif)
By accurately measuring the rate of H2 release over a series of monthly measurements, a bounding maximum is determined for the corresponding oxidation of copper, according to the anodic reaction:
![Equation ([2])](https://content.cld.iop.org/journals/1945-7111/166/11/C3015/revision1/d0003.gif)
This assumes that: i) the only source of H2 is copper corrosion and ii) copper oxidizes by a one-electron process. These are very conservative assumptions that may lead to overestimation of the true corrosion rate. Many forms of copper contain trapped hydrogen, which could significantly affect the measurements; thus the assumption that all hydrogen arises from corrosion is particularly conservative.11 It must be stressed that the method in this work provides an upper limit to the corrosion rate, and that the true rate will approach zero, as per the thermodynamic arguments. Nonetheless, a firm maximum value holds practical value for UFC safety predictions.
From the measured moles of H2, nH2, the known surface area of copper, ACu, and the measurement time interval, Δt, the corresponding maximum corrosion rate is calculated using the molar volume, Vm,Cu, of copper:
![Equation ([3])](https://content.cld.iop.org/journals/1945-7111/166/11/C3015/revision1/d0004.gif)
Cell design
Two cell designs were used, shown in Figures 1a and 1b. Glass was used where possible, rather than stainless steel, to avoid the possibility of the outgassing of H2 and/or its evolution from corrosion.22 Top components were fitted with two ports for the introduction and exchange of solutions and headspace gas. Cells were charged with 5 cm segments of copper wire (≥99.9%, temper annealed, 250 μm diameter, Goodfellow, UK). Each cell contained 2,600 segments, corresponding to 1,024 cm2 total surface area. Notably, no effort was made to control impurities in the copper or to quantify the level of hydrogen present in the copper wires prior to immersion, which could contribute to the measured H2 and artificially inflate calculated corrosion rates. The wires were rinsed with acetone, high purity water (18.2 MΩ cm), 1 M HNO3(aq), high purity water again, and then cleaned by ultrasonication in absolute ethyl alcohol. All solutions were prepared with high purity water and were deaerated with certified ultra-high purity N2. Salt solutions were prepared with reagent grade NaCl which may contain trace impurities and therefore may have contributed to hydrogen production. Temperature control was performed using a water bath, where values were selected based on thermal modelling of a repository, which sees a brief thermal elevation above 75°C that lasts < 200 a, before dropping below 50°C then 30°C after ∼7,500 and ∼20,000 a, respectively.23
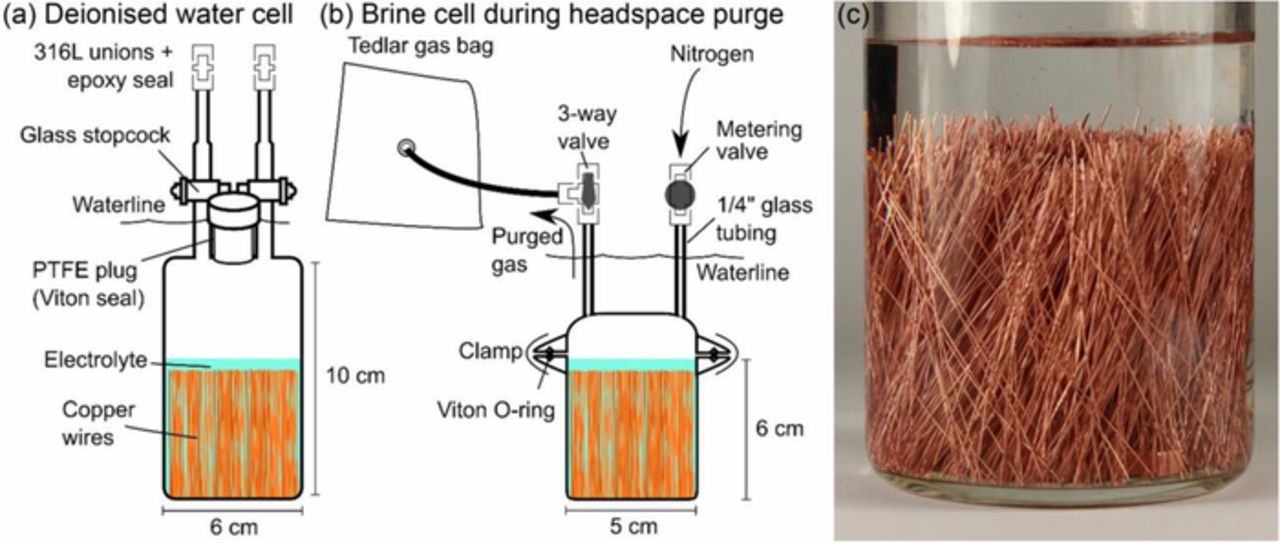
Figure 1. Schematic of the anoxic corrosion cells for a) pure water and b) brine experiments, which also illustrates the process for purging accumulated cell hydrogen. c) The appearance of the copper wires in a sealed cell.
Molecular hydrogen quantification
The cells were held at constant temperature and left to allow H2 to accumulate in the cell headspace. Headspace gas was periodically flushed with N2 into a Tedlar bag. The collected gas was analyzed using an IonScience Hydrosteel 6000 H2 sensor, which consists of a proton-conducting ceramic coated on either side with catalyst electrodes that operate at constant voltage. As gas passes over the anode surface, H2 oxidizes and the resulting protons are transported through the ceramic to the cathode, where they are reoxidized. The instrument outputs a measured current that is mass-transport controlled and thus proportional to the H2 content of the gas stream. The presence of air does not affect the output of the probe. A certified 100 ppm H2 calibration gas was measured immediately before and after each sample, and the sample gas curve was integrated to calculate the moles of H2 in the expelled gas. The copper corrosion detection limit is estimated to be ∼0.1 nm a−1 for an individual monthly measurement.
Results and Discussion
The H2 production rate from copper in anoxic pure water was measured in duplicate cells at 75°C (Figure 2). For both of the cells, the H2 production rates were low, resulting in the equivalent of approximately 1 nm of cumulative corrosion after many months. In addition, for the cell where the initial rate was higher (Blue circles, Figure 2), hydrogen production appeared to be leveling off. Both of these demonstrate that bounding corrosion rates are significantly lower than some estimates of the copper corrosion rate in anoxic water, which range as high as ∼1 nm d−1.8
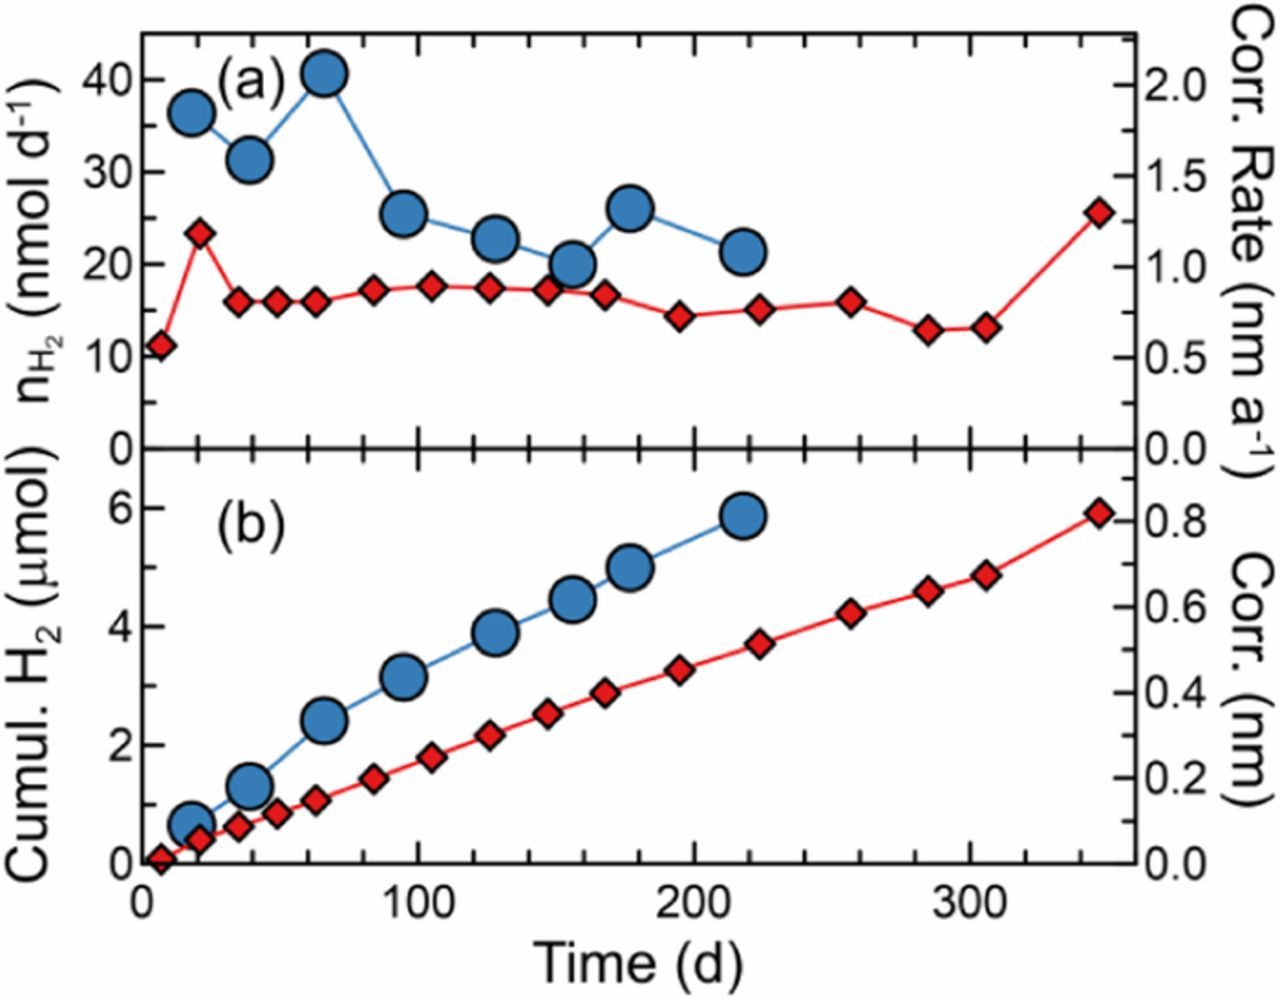
Figure 2. H2 sampling results for duplicate copper exposure experiments in pure anoxic water at 75°C. (a) H2 evolution and corresponding corrosion rates, and (b) cumulative H2 evolved and corresponding maximum corrosion.
In contrast, these results suggest that if copper corrosion occurs in pure water, it is at very slow initial rates (≤ 2 nm a−1) that may decrease over time. Yet for nuclear waste management, corrosion rates in pure water are more academic than they are of actual practical use as containers would be exposed to groundwaters that contain dissolved minerals.2 Of particular concern are chloride anions, from dissolved halite, that could form solution-soluble complexes with copper ions. Therefore, the measurements were repeated using aqueous sodium chloride solutions.
Copper exposed to 0.25 mol kg−1 NaCl(aq) at 30°C or 50°C produced negligible amounts of H2 that was below the detection limit for all except one transient measurement (Figure 3, red diamonds). At 75°C, H2 was produced for the duration of the six month experiment to produce an equivalent damage of <5 nm. Similarly, copper exposed to 2.5 mol kg−1 NaCl(aq) at 50°C produced no detectable H2 (Figure 3, blue circles), while the 6 month exposure at 75°C, saw H2 released at a rate corresponding to 5 nm of cumulative copper corrosion. This experiment also demonstrated that when the temperature was returned to 50°C, the H2 production immediately returned below the detection limit.
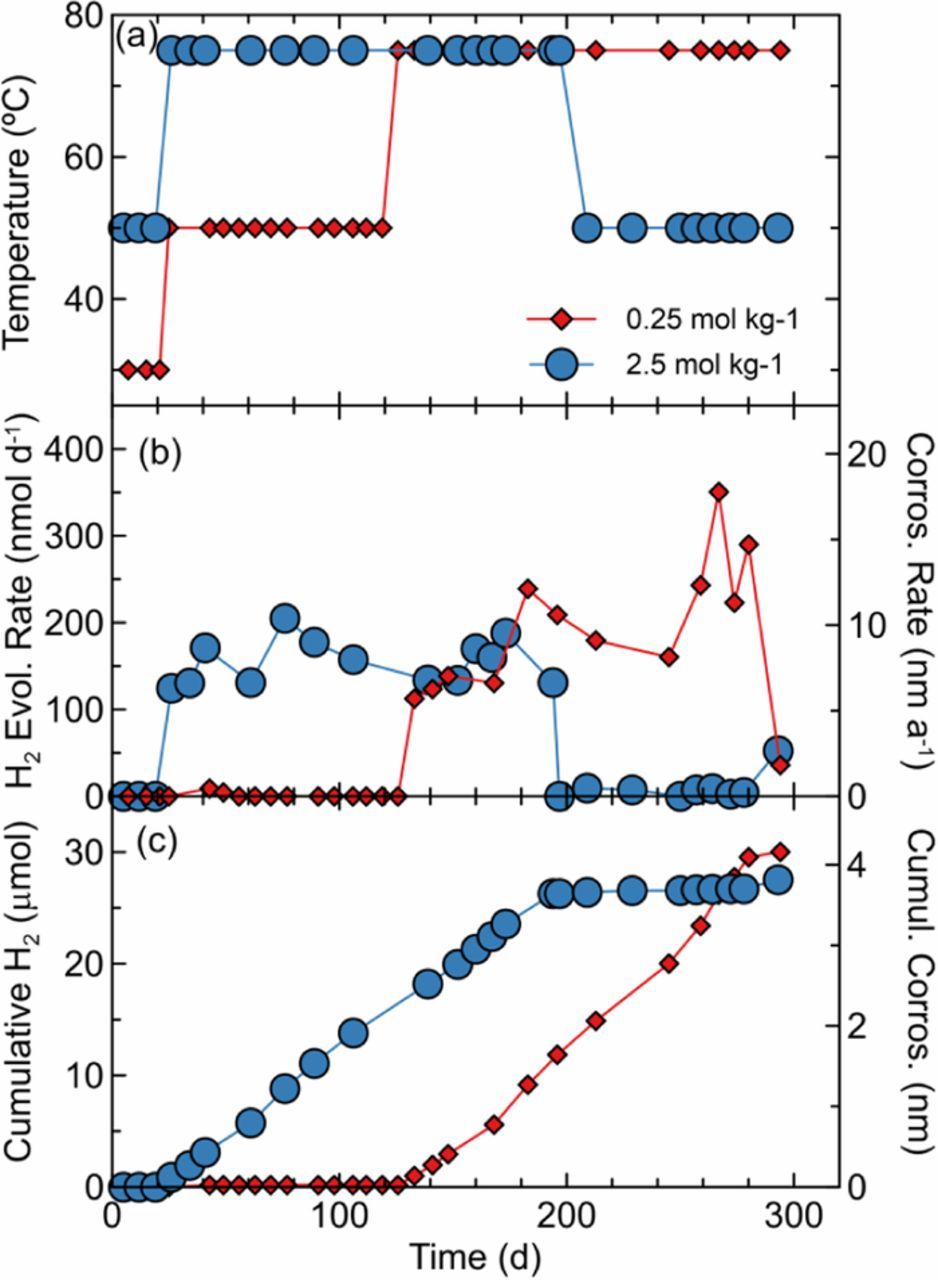
Figure 3. H2 sampling results for copper wire in anoxic 0.25 or 2.5 mol kg−1 NaCl(aq) and 5 mmol L−1 citrate buffer solutions (pHinitial = 5.1). (a) Bath temperature, (b) H2 evolution and corresponding corrosion rates, and (c) cumulative H2 evolved and corresponding maximum corrosion.
Finally, copper was exposed to 5 mol kg−1 NaCl(aq) solution at 75°C (Figure 4). There was nearly an order of magnitude variation in the H2 production rate between duplicate cells at the start of the experiment. Although these cells contained copper from different production batches, the manufacturer's specifications were identical for the two spools, but this does likely reveal the importance of the starting condition of copper, and the hydrogen trapped therein. The results indicate early spikes of H2, particularly for one of the samples, but both cells saw leveling off of their H2 production rates. While the cumulative damage exceeded 15 nm within 6 months for the higher hydrogen producing cell, it did not reach 18 nm after an additional 10 months. For the other cell, reduction of the temperature to 50°C saw a drop in hydrogen release to below the detection limit. Future work is encouraged to perform additional replicates complemented with detailed materials analysis, such as comparing the initial and final hydrogen content of the copper metal itself.
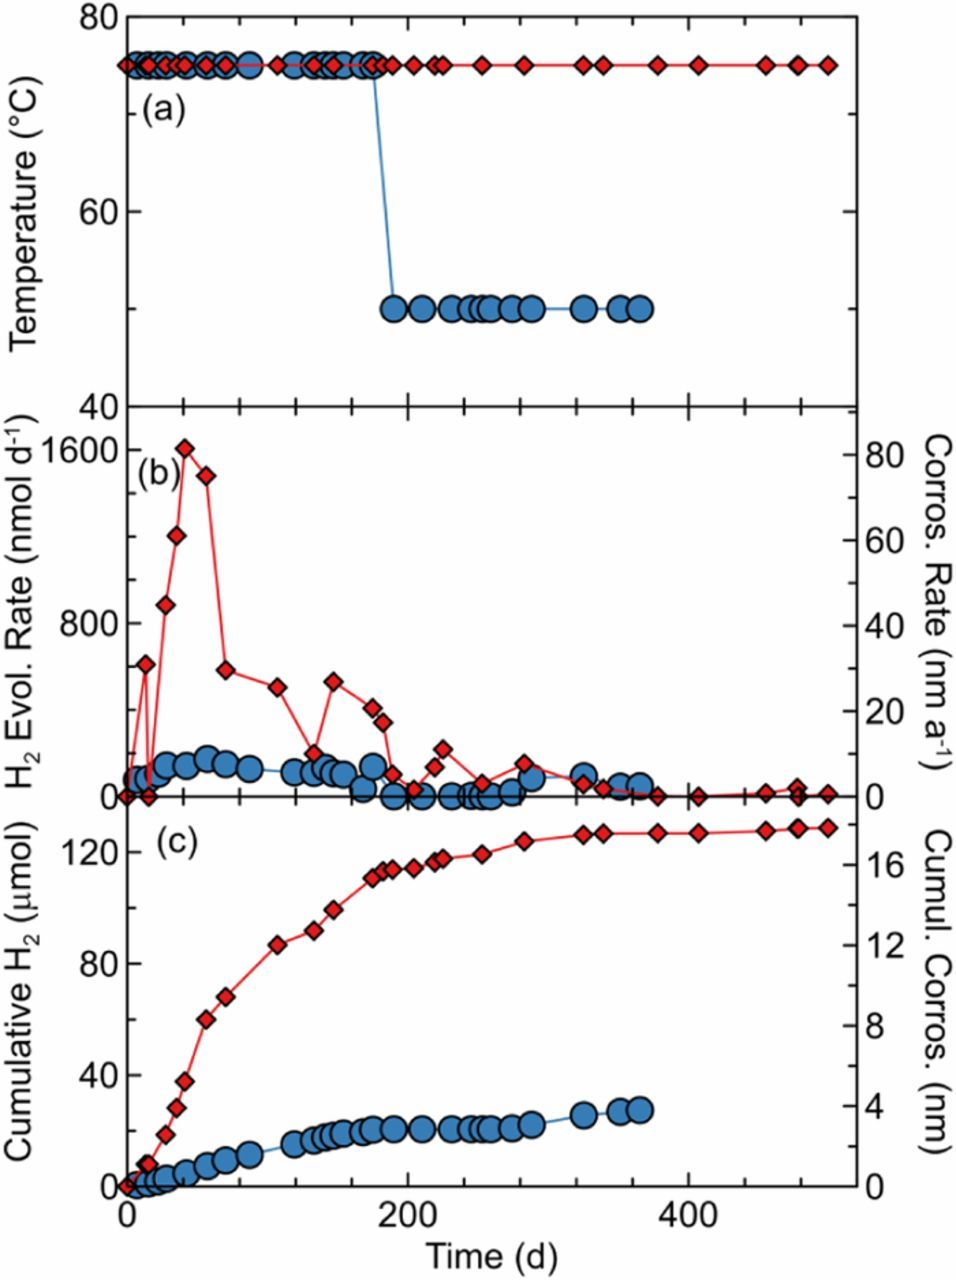
Figure 4. H2 sampling results for duplicate copper exposure experiments in anoxic 5.0 mol kg−1 NaCl(aq) and 5 mmol kg−1 citrate buffer solution (pHinitial = 5.1). (a) Bath temperature, (b) H2 evolution and corresponding corrosion rates, and (c) cumulative H2 evolved and corresponding maximum corrosion.
Summary
A new method is presented using a H2 probe to establish bounding corrosion rates for copper metal in anoxic aqueous media. This approach allows the thermodynamics of the system to be disregarded for the purpose of establishing practical, data-based values to support the safety arguments for copper in nuclear waste containers. Such values have previously remained elusive. Preliminary results are shown for copper in pure water and buffered NaCl(aq) solutions over the range 0.25–5.0 mol kg−1. The results show excellent precision of the measurement itself and reveal an ability to capture short-lived spikes of hydrogen evolution throughout the multi-month experiment. Negligible hydrogen was detected below 50°C, the temperature below which repositories will persist after 7500 a. At 75°C, hydrogen evolution rates tend to decrease over time, even if occasional high transient values occur.
Acknowledgments
This work was funded by the Nuclear Waste Management Organization (NWMO).