
Abstract
MnO2, in its many phases, is abundant, non-flammable, non-toxic, reliable, made with abundant materials using simple manufacturing methods, and can have a high theoretical capacity for some phases (up to 617 mAh g−1). Here we have investigated the sensitivity of the performance ofbirnessite—produced in situ—to the presence of Bi2O3, depth-of-discharge, electrolyte salt type, and relative electrolyte volume. We prepared cathodes composed of 45 wt% MnO2, 22.5 wt% Bi2O3, and 22.5 wt% carbon additives, and compared cycling stability in two electrolytes—6.6 M KOH (27 wt%) and 6.6 M NaOH (21 wt%), and two types of 3-electrode test fixtures (flooded beaker or electrolyte-lean T-cell). Our results showed that birnessite can be synthesized electrochemically in NaOH, and cycling the cathode in NaOH improves its stability when compared to cycling in KOH. We tested the cathode in electrolyte-lean environments and found a drastic improvement in cycling stability in NaOH. The cathode exhibited higher initial capacity in lean amounts of KOH, but capacity retention plummeted after the first 20 cycles. In contrast, the cathode in NaOH delivered 65% of the theoretical capacity for over 400 cycles.
Export citation and abstract BibTeX RIS

This is an open access article distributed under the terms of the Creative Commons Attribution 4.0 License (CC BY, http://creativecommons.org/licenses/by/4.0/), which permits unrestricted reuse of the work in any medium, provided the original work is properly cited.
Alkaline manganese dioxide (MnO2) batteries are promising candidates for stationary applications due to several advantages—raw material abundance, low costs, non-flammability, non-toxicity, and high capacity (617 mAh g−1). MnO2—especially electrolytic MnO2, or γ-MnO2—has long been used in commercial primary alkaline batteries. 1 However, several challenges plague the rechargeable version of the technology and hinder its widescale commercialization. Historically, achieving long-lasting reversibility of MnO2 cathodes required limiting the depth-of-discharge (DOD) to prevent the formation of undesirable manganese oxides such as Mn3O4, accessing only 5%–10% of the theoretical capacity. 1,2 More recently, layered birnessite (δ-MnO2), formed in situ, was shown to operate for multiple cycles with 60%–80% of the theoretical capacity. However, achieving stable birnessite reversibility and preventing Mn3O4 formation required low active mass loading in the test electrodes and reduced DODs during cycling. Fortunately, copper and Bi2O3 additives were recently found to limit Mn3O4 formation, resulting in a cathode with high active mass loading that delivered full theoretical capacity for thousands of cycles. 2–5 Yet, the use of these additives increases material costs—Cu costs 42¢ per mol of ionic species as of 2018—meriting continued study of birnessite stability for lower-cost solutions. 6
To date, MnO2 electrode materials have been thoroughly studied in the existing literature on alkaline systems. Additionally, Na-birnessite and K-birnessite have been repeatedly synthesized and used in different applications and chemistries, but they are typically studied with neutral pH electrolyte solutions. 7–11 Thus, to our knowledge, birnessitic MnO2 in alkaline conditions has only been explored with KOH and LiOH electrolytes. 1 While KOH (which costed 5-5.7 ¢ mol−1 in 2018) 12 is the most commonly used electrolyte by far, research has overlooked a comparable and cheaper alternative: NaOH (1.7-2.9 ¢ mol−1 in 2018). 13
Using different electrolytes has been shown to significantly affect birnessite performance. While the MnO2 reaction pathway in KOH, as documented by various works, 1–4,14–17 is explicitly independent of the electrolytic cation, K+, it has been shown to be influenced by the cation species when LiOH is used. Minakshi et al. found that intercalation in a Zn-MnO2 cell functioned significantly differently in LiOH and KOH, with LiOH demonstrating reversible intercalation of Li while K insertion was irreversible. 18 The authors suggested the difference could be due to the smaller size of the Li+ cation, which has 1/6th of the volume of K+. However, in aqueous environments, the solvation shell of Li+ is larger than that of K+. Rus et al. also found that Li impacted the reaction pathway, with Li intercalation reducing the extent of protonation, more notably at higher LiOH concentrations. 19 There is still a need for improved understanding of the underlying mechanisms and impacts of the electrolytic cation's role in these systems. Additional, underexplored electrolyte properties (e.g., those in Table I) are likely to influence birnessite behavior via ion kinetics.
Table I. Properties of different electrolytic cations.
| Electrolyte (cation) | |||||
|---|---|---|---|---|---|
| Property | Units | KOH (K+) | LiOH (Li+) | NaOH (Na+) | References |
| Ionic mobility in water at 298 K | 10−8m2s−1V−1 | 7.62 | 4.01 | 5.19 | 20 |
| Effective radii in water at 298 K | pm | 111 | 212 | 164 | 20 |
| Limiting molar conductivities | mS m2 mol−1 | 7.352 | 3.869 | 5.011 | 20 |
The influence of electrolyte to active material (E/AM) ratio is unexplored in the literature on alkaline MnO2 systems. The influence of alkaline electrolyte concentration has been studied at length, showing that Mn2+ and Mn3+ solubility increases with the number of OH− ions available for bonding. 1,17,21,22 It follows that limiting the number of available OH- ions by restricting electrolyte volume could reduce parasitic dissolution of useful Mn species.
In this study, we build on the existing literature on electrochemically synthesized Bi-birnessite, examining the performance of MnO2 in a NaOH-based electrolyte. The impact of NaOH on the Bi-birnessite cathode performance is explored under varied cycling conditions. We also present comparisons of cathode performance in electrolyte-lean and -flooded systems. By evaluating this lower-cost solution, we aim to determine if its electrochemical performance can parallel or even exceed the traditionally used KOH electrolyte solution.
Experimental
In this work, we conducted electrochemical testing and materials characterization to study and compare the influence of NaOH- and KOH-based aqueous electrolytes on the performance of a Bi-birnessite cathode under various cycling protocols and environments. Experimental methods are summarized in Table II and described in detail in the following sections.
Cathode preparation
Cathodes were prepared using a method previously reported by Yadav et al. 2 A mixture of EMD (Tronox) or γ-MnO2 (Welly), bismuth (III) oxide or Bi2O3 (Sigma-Aldrich), and Super P carbon black, were ball-milled in a ratio of 18:11:11 for 15 min. An additional 10 wt% polytetrafluoroethylene (PTFE) binder was incorporated into the mixture via mortar-and-pestle. The material was then roll-pressed between aluminum foil or PTFE sheets, then pressed onto stainless steel mesh under 4 metric tons/cm2.
Electrochemical testing
All electrochemical tests were done using a Biologic VMP3 Multi-Channel Potentiostat, equipped with 16 three-electrode test channels. All voltages in this paper are reported using the units V vs Hg/HgO. The mass loading (mg/cm2), areal capacity (mAh/cm2), and electrolyte-capacity ratio (ml/mAh) for each test are provided in SI Table 1. Coulombic efficiencies for selected tests are shown in SI Fig. 11.
Test fixtures
All electrochemical tests were done using Hg/HgO reference electrodes filled with 20 wt% KOH. Two test fixtures were used in this study. The first was a flooded beaker cell, illustrated in SI Fig. 1. The beaker cell was comprised of a polypropylene bottle, a 6.6 M or 10.5 M electrolyte (NaOH or KOH) and a platinum or nickel foam counter electrode. 6.6 M corresponds to 21 and 37 wt% NaOH and KOH, respectively.

Figure 1. (A)–(B) Voltage vs capacity during the birnessite formation cycle in NaOH and KOH, with and without Bi2O3. (E) XRD data for cathodes after 1 cycle in NaOH and KOH, with and without Bi2O3. The black diffraction pattern is for an uncycled cathode. For full peak identification, see SI Fig. 5. References: 00-042-1317 (•), 00–030–0820 (○), 00–022–0515 (△). (F) XRF results show increased Na & K concentrations in charged state, which indicates cation intercalation into the layered birnessite.
Download figure:
Standard image High-resolution imageThe second fixture was an electrolyte-lean T-cell, illustrated in SI Fig. 2, composed of a polypropylene tee-junction with a 16 mm diameter. In the center of the tee, the working electrode, two synthetic cotton separators, and the counter electrode were sandwiched between two graphite current collectors and two 304 stainless steel plungers. Approximately 1–2 ml of an aqueous electrolyte was added into the system. NiOOH counter electrodes were prepared by mixing NiOOH and PTFE with mortar and pestle in a 9:1 mass ratio and pressing the mixture into nickel mesh. NiOOH was prepared by dissolving 1.43 g Na2S2O8 in 100 ml DI water, then adding 1.41 g Ni(NO3)2·6H2O. Upon dissolution, enough KOH was added to make the solution a strong base (pH > 13), resulting in the formation of black precipitate. The mixture was stirred at 45 C for 2 h, then filtered to extract the NiOOH powder.

Figure 2. Comparison of constant-current cycling and CV tests of the Bi-birnessite cathode in beaker cells, with (A)–(B) 6.6 M NaOH and (C)–(D) 6.6 M KOH electrolyte.
Download figure:
Standard image High-resolution imageIn-situ birnessite synthesis
Following the electrochemical synthesis method reported by Yadav et al., 2 each cathode was discharged in 6.6 M KOH or NaOH at a C/3 rate to −1.0 V, allowed to rest for 5 min, and then charged at a C/3 rate to 0.3 V. The resulting voltage-capacity curve in KOH was as expected and is shown in SI Fig. 3, annotated with the expected reaction pathway (as reported by Yadav et al. for KOH). 2

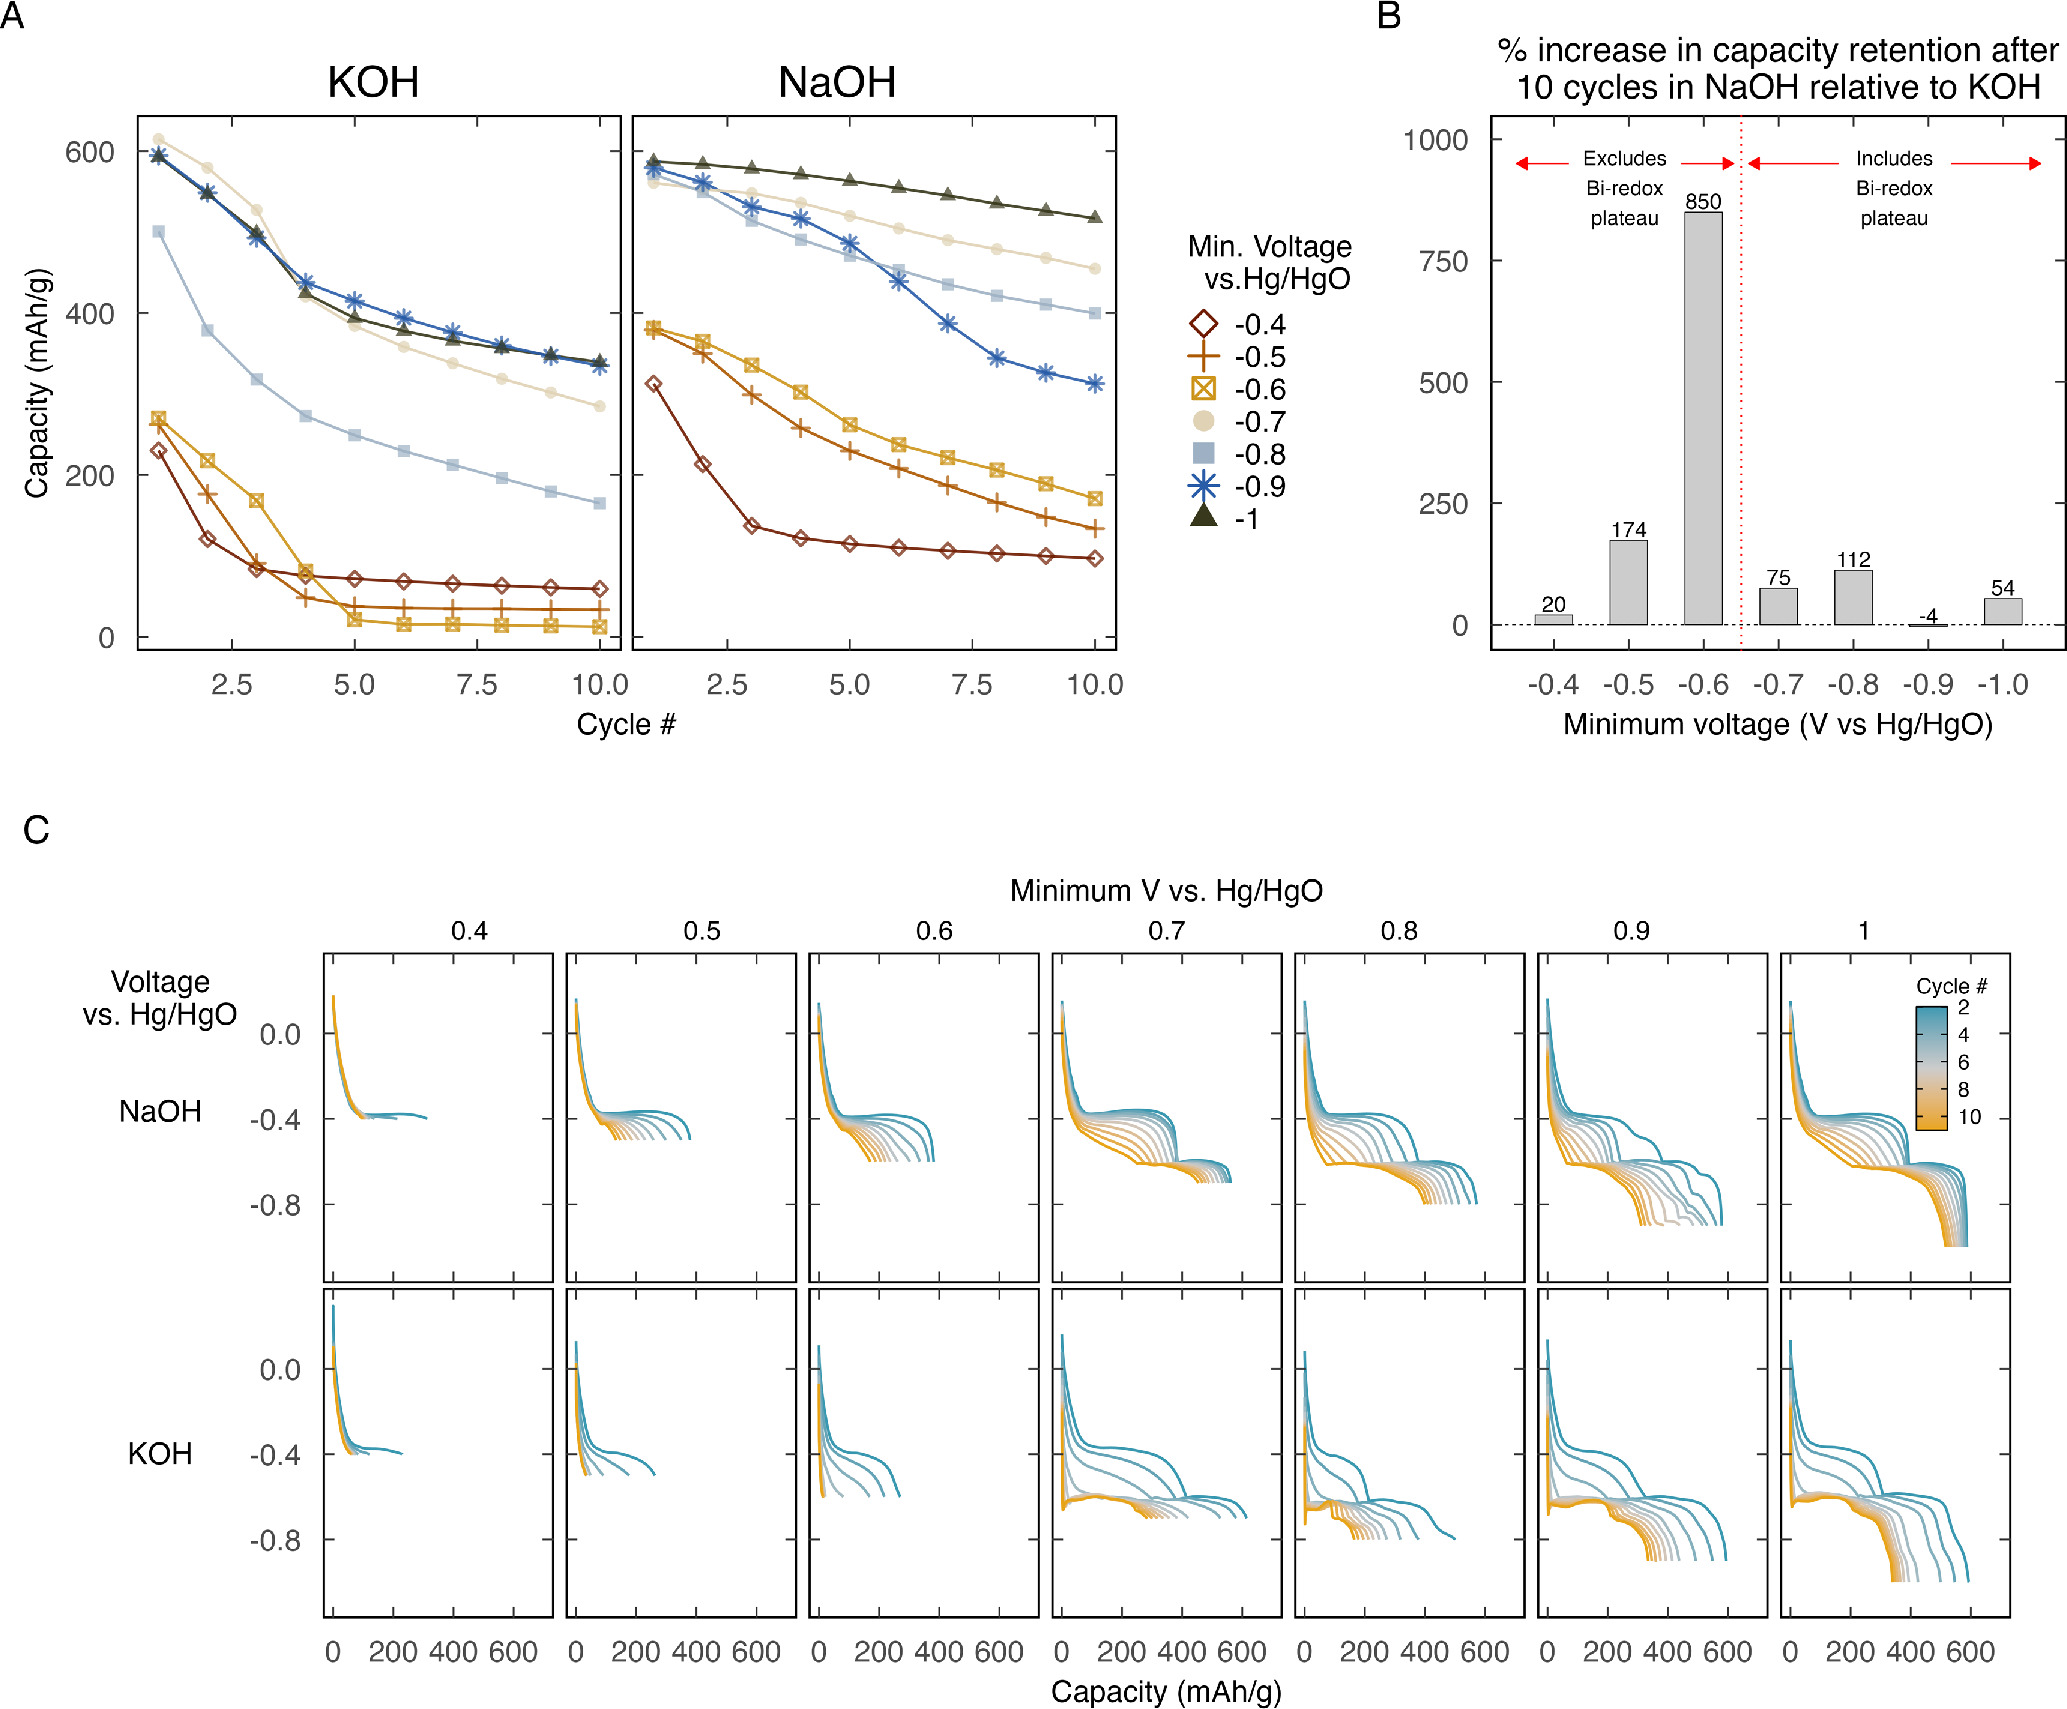
Figure 3. Relation between (A) cathode lifetime and depth-of-discharge (DOD) in 6.6 M KOH and 6.6 M NaOH and (B) percent increase in cathode lifetime when cycled in NaOH, compared to KOH.
Download figure:
Standard image High-resolution imageCyclic voltammetry (CV)
Bi-birnessite cathodes were also cycled in 6.6 M KOH or NaOH using the cyclic voltammetry (CV) technique on the Biologic VMP3 after undergoing the birnessite formation process. The CV method used applied a voltage sweep at a rate of 0.1 mV s−1 (8-h cycle time) between the potential limits 0.3 V and −1.0 V (vs Hg/HgO) while recording the current drawn from the cathode at each voltage level.
Galvanostatic cycling with potential limits (GCPL)
Cathode performance was tested using galvanostatic cycling with potential limits (GCPL), in which the cathode was cycled under a constant current (C/3 rate) between two voltage limits (e.g., 0.3 V to −1.0 V vs Hg/HgO).
First, we tested whether layered Bi-birnessite could be electrochemically synthesized in situ in NaOH using the same recipe developed for synthesizing Bi-birnessite in KOH. We conducted electrochemical tests and materials characterization on EMD cathodes cycled once under four scenarios: (1) with Bi2O3 in NaOH; (2) with Bi2O3 in KOH; (3) without Bi2O3 in NaOH; and (4) without Bi2O3 in KOH. The final two scenarios were included to examine the role of Bi2O3 in the phase transition from EMD to birnessite.
Table II. Summary of experimental test matrix.
| Variable | Values |
|---|---|
| Electrolyte type | 6.6 M KOH; 6.6 M NaOH |
| Cathode composition | 45 wt% MnO2; 45 wt% MnO2 with 22.5 wt% Bi2O3 |
| Cell configuration | Beaker cell; T-cell |
| Test type | Lifetime GCPL test; Cyclic voltammetry |
We also compared the lifetime of the Bi-birnessite cathode, measured as total Ah processed per unit mass, in NaOH and KOH under the same use conditions. We conducted lifetime tests using the GCPL cycling protocol described above.
We note an inconsistency in the KOH concentration used for the experiment depicted in Fig. 5B. The concentration was 10.5 M KOH in Fig. 5B, rather than the 6.6 M used in the rest of the study. We have assessed the potential impact of this variation to be minimal. The pH increase between 6.6 M KOH (pH 14.8) and 10.5 M KOH (pH 15.0) is by approximately 1%, which is a relatively minor discrepancy. Thus, we assert that the difference in KOH concentration did not significantly affect the cathode lifetime outcomes reported.
Materials characterization
X-ray diffraction (XRD)
Fresh and cycled materials were characterized using a P'Analytical X'Pert diffractometer with a Cu Kα radiation source. Samples were continuously scanned from 2θ = 10° to 80° with a step size of 0.026° and scan step time of 170 s. In cases where samples were pressed into stainless steel mesh, a monochromator was used to prevent fluorescence. Before XRD characterization, cycled electrodes were pressed under 4 metric tons cm−2 to reduce low-angle scattering.
Scanning electron microscopy (SEM)
Scanning electron microscopy (SEM) was used to observe surface morphologies and phases present in samples. Samples were vacuum-dried after cycling and stored in ambient conditions in sealed plastic bags for one week prior to SEM analysis. SEM images were captured at 500 x, 10 kx, and 30 kx magnification using a Tescan Mira3 with a secondary electron detector at 30 kV.
X-ray fluorescence spectroscopy (XRF)
We used X-ray fluorescence spectroscopy to determine the cation concentrations of cycled cathodes. The concentrations of Na and K cations were measured in cathodes that underwent one complete cycle and one full discharge after the formation of birnessite in NaOH and KOH, respectively. Cathodes that underwent a complete cycle were in the charged state and thus had the birnessite structure. Cathodes that only underwent one discharge were in the discharged state and thus had the Mn(OH)2, or pyrochroite, structure.
Data were collected using an Oxford Instruments' XSupreme8000 with a He-filled test chamber. We calibrated the XRF data using two categories of standards: (1) EMD and potassium chloride and (2) EMD and sodium chloride. The calibration standards were prepared for each chloride using the weight percentages 0%, 0.5%, 1%, 1.5%, 2%, 5%, 10%, 20%, 30%, and 38%. Each calibration standard was ball-milled for 15 min. Calibration curves are shown in SI Fig. 6.
Results and Discussion
Electrochemical testing and materials characterization were used to study the influence of NaOH- and KOH-based aqueous electrolytes on the performance of a Bi-birnessite cathode under various cycling protocols and environments.
The influence of Bi2O3 and electrolytes on birnessite formation
Electrochemical behavior during birnessite formation
The process by which EMD is electrochemically converted to birnessite is illustrated in the voltage curves displayed in Figs. 1A–1D, and an annotated version is provided in SI Fig. 3. As reported by Yadav et al., during the first discharge of electrolytic MnO2 (EMD) in KOH, MnO2 converts into pyrochroite Mn(OH)2 through a two-step reaction between manganese oxides and water. 15,23
The first step is the solid-state protonation of EMD, which transforms into orthorhombic α-MnOOH, commonly referred to as groutite. 1,14,15,24 This reaction can be observed as a sigmoidal shape in the discharge curve between 0.3 V and −0.4 V vs Hg/HgO. The second step is a dissolution-precipitation reaction, observed via the first discharge plateau at approximately −0.4 V vs Hg/HgO. 15
Upon subsequent charging, Mn(OH)2 reverts to MnOOH at −0.2 V vs Hg/HgO, finally transforming to birnessite at 0 V vs Hg/HgO.
Our results show that the birnessite formation process was significantly influenced by the presence of Bi2O3 and the electrolyte constituents. When Bi2O3 was present (Figs. 1A and 1C), there were three significant plateaus during the first discharge and two plateaus during the subsequent charge. These five plateaus are presumably associated with the chemical reactions that transform EMD into layered. 15 Without Bi2O3 (Figs. 1B and 1D), the third discharge plateau at −0.6 V vs Hg/HgO and the first charge plateau at −0.5 V vs Hg/HgO vanish. It follows that these two plateaus correspond to Bi-redox reactions.
The voltage behavior at the end of the first charge is drastically different in the NaOH and KOH cases. In NaOH (Figs. 1A and 1B), there are two very small, successive plateaus at approximately −0.1 V and 0.1 V vs Hg/HgO. According to Yadav et al., these plateaus occur in the voltage range that corresponds to proton insertion in KOH systems. However, when the proton insertion reaction occurs in KOH, it results in a peak feature, as seen in the top right of Fig. 1C. The difference in the shape of the charge curves in NaOH and KOH indicate that different electrolytes generate different reaction mechanisms. Furthermore, the characteristic peak feature around 0 V vs Hg/HgO in KOH did not occur when Bi2O3 was absent. This suggests that the proton insertion reaction behavior in NaOH is unaffected by the presence of Bi2O3. In contrast, the proton insertion reaction in KOH is only detectable when Bi2O3 is present.
These findings merit future investigations of the impact of electrolyte properties (such as those listed in Table I) on birnessite formation and behavior.
Material characterization
Layered birnessites are intriguing as cathodes due to their 1 × ∞ tunnel structure, formed by sheets of edge-sharing MnO6 octahedra. 25 The space between the MnO6 sheets often house water and various cations, which play a pivotal role in determining birnessite properties. A classic illustration is the larger spacing between K-birnessite layers than Na-birnessite, attributed to the size variations of the K+ and Na+ cations (see Table I). 25
Structure: X-ray diffraction (XRD) was used to examine structural differences that arose during the birnessite formation cycle, based on the electrolyte composition and the presence of Bi2O3. Shown in Fig. 1E, the birnessite formation cycle resulted in prominent (001) peaks at 12°–13° and less intense (002) peaks at 25°–26°, regardless of which electrolyte was used and whether Bi2O3 was present. These peaks indicate that a layered birnessite structure formed in all of the tested conditions. However, the signal-to-noise ratios of the (001) and (002) peaks are slightly higher for the samples without Bi2O3. This suggests that the presence of Bi2O3 reduced the samples' birnessite concentration.
The samples' interlayer spacings, summarized in Table III, were noticeably impacted by the electrolytes and Bi2O3. Adding Bi2O3 increased the (100) interlayer spacing, d100, by 1.1% in KOH and by 0.20% in NaOH. The additive also increased the (200) interlayer spacing, d200, by 0.73% in KOH and by 0.15% in NaOH. Furthermore, switching from KOH to NaOH increased the interlayer spacings—d100 expanded by 0.71% and 1.6%, with and without Bi2O3, while d200 expanded by 0.47% and 1.1%, with and without Bi2O3. Given these trends, it is unsurprising that the smallest d-spacings occurred in KOH without Bi2O3 while the largest occurred in NaOH with Bi2O3. While it was expected that adding large Bi2O3 molecules would increase d-spacing, the expansion effect of the NaOH electrolyte was interesting since Na+ (2.04 Å in diameter) is smaller than K+ (2.76 Å in diameter). Early work by Post and Veblen similarly showed that the interlayer spacing in synthetic Na-birnessite was 2% higher than that in K-birnessite. 26 Thus, the d-spacing is likely influenced by factors other than cation size, such as bonding characteristics like the solvation shell, which may also explain performance differences.
Table III. Comparative summary of interlayer spacings in samples cycled in KOH or NaOH, with or without Bi2O3.
| Electrolyte | Active material |

|
 (Å) (Å) |

|
 (Å) (Å) |
|---|---|---|---|---|---|
| KOH | Bi-MnO2 | 12.6 | 7.04 | 25.1 | 3.51 |
| NaOH | Bi-MnO2 | 12.5 | 7.09 | 25.0 | 3.56 |
| KOH | MnO2 | 12.7 | 6.97 | 25.3 | 3.52 |
| NaOH | MnO2 | 12.5 | 7.08 | 25.0 | 3.55 |
Composition and Electrolytic cation incorporation: The ratio of intercalated electrolytic cations to MnO2 was analyzed using X-ray fluorescence spectroscopy (XRF). As summarized in Fig. 1F, the molar concentration of Na in NaxMnO2 in the charged and discharged states was 0.19 and 0.025, respectively. The molar concentration of K in KxMnO2 in the charged and discharged states was 0.23 and 0.00, respectively. The increase in cation concentration in the charged cathodes indicates that Na and K both inserted into the layered birnessite structure during charging. The molar fraction of K was 24% higher than that of Na, suggesting K inserts into the cathode more effectively.
While little is known about the impact of cation content on the electrochemical performance of birnessite, recent work by Gao et al. studied the impact of cation content on nanostructured pseudocapacitive birnessite electrodes. 27 The authors found that an increase in Mn vacancy concentrations, which was associated with higher cation incorporation, served as low-energy intercalation sites and thereby increased the specific capacitance of the electrode. Thus, the performance trend observed by Gao et al.—in which higher cation concentration corresponded with improved performance–was opposite to the trend we observed in this work—in which lower cation concentration correlated with improved performance. However, future research could adapt the authors' approach and insights to more deeply explore the impacts of ion incorporation on birnessite performance.
Morphology: SEM was used to compare the influence of the KOH and NaOH electrolytes on the morphological evolution of the cathode during cycling (SI Fig. 8). For comparison, the morphology of a fresh, uncycled cathode is shown in SI Fig. 7. During the initial birnessite formation cycle, significant morphological differences were evident. After the first discharge, low magnification images showed that bright clusters were distributed throughout the KOH sample (SI Fig. 8A) but were absent from the NaOH sample (SI Fig. 8B). The bright clusters were flower-like agglomerations of 1–2 μm flake- and needle-like particles. While similar flower-like clusters have been associated with birnessite in previous work, 28,29 they were not found to have been reported for the discharged, pyrochroite phase during MnO2 cycling. Instead, Patrice et al. observed cubic particles after discharging a 3 wt% γ-MnO2 cathode in KOH to form pyrochroite. 30 Similar orthorhombic-like particles were observed in this work—2–3 μm wide in KOH and 0.6–1.2 μm wide in NaOH—dispersed within a dense matrix of significantly smaller (~0.2 μm) particulate features. It is worth considering that the SEM images after discharge may partially reflect changes due to the air exposure prior to imaging, which could lead to Mn(OH)2 oxidation.
After the first charge, which completes the birnessite formation cycle, the birnessite in the KOH sample (SI Fig. 8C) resembled previously observed assembled birnessite nanosheets. 2,27,31 On the other hand, the birnessite in the NaOH sample predominantly displayed small 0.5–1.0 μm bulk particles (SI Fig. 8D) and occasional large hexagonal flakes measuring 1–2 μm (seen in the figure insets). Large 2 by 5 μm particles, likely the tetragonal form of Bi2O3 detected via XRD, were also evident in the NaOH sample.
By the second cycle, similarities in cathode morphologies emerged between the two electrolyte environments. After the second discharge, the cathodes in both electrolytes presented predominantly smooth morphologies interspersed with 200 nm bulk particle clusters and sporadic larger 5 μm particles electrolytes (SI Figs. 8E–8F). The subsequent charged sample in KOH was characterized primarily by 200 nm bulk particles (SI Fig. 8G), while the NaOH sample displayed a mix of smooth portions and occasional 5 μm needle-like particles (SI Fig. 8H).
Given the interesting morphological differences observed in this work, future work should thoroughly study relationships between the electrolyte environment and the cathode's morphological evolution and performance.
The influence of depth-of-discharge on cathode lifetime in NaOH and KOH
Previous work has shown that after formation, the birnessite cathode reversibly cycles between the birnessite phase and Mn(OH)2. 15,23 However, complications often emerge, where side reactions may compromise system reversibility. Chief among these is the irreversible formation of spinel-like Mn3O4, with other side reactions like groutite precipitation also playing a role. 1,15,17 The inclusion of Bi2O3 in the cathode has been observed to mitigate Mn3O4 formation, possibly through Mn-Bi complexation reactions. 15
Cathode performance was initially evaluated via various cycling tests using a flooded beaker cell system.
Lifetime comparison at full DOD
We assessed the cathode's stability at full depth-of-discharge (DOD) by cycling it between 0.3 V to −1.0 V vs Hg/HgO at a C/3 rate. The lifetime test concluded when the cathode's capacity declined by 80%. We defined cathode lifetime as the total Ah processed per unit of active mass. Additionally, we examined cathode performance through cyclic voltammetry, with a voltage sweep rate of 0.1 mv s−1 within voltage limits of 0.3 V to −1.0 V vs Hg/HgO.
The discharge and CV curves in Fig. 2 showcase the cathode's behavior during its first 15 cycles in a flooded beaker cell using NaOH (A)–(B) and KOH (C)–(D) electrolytes. Fast capacity fade occurred in both KOH and NaOH. After 15 cycles, the discharge curves (Figs. 2A and 2C) show that NaOH maintains marginally superior capacity; yet the CV scans (Figs. 2B and 2D), while very similar, show that KOH has a 18% higher discharge peak and 1.2% larger area under the curve. This contrast might arise from differing reaction kinetics between the electrolytes. While KOH seems better for quick reaction, evident in CV scans, NaOH appears more stable during the slower reactions of cycling. Together, the CV and cycling plots provide a nuanced view of the electrolytes' electrochemical differences.
Upon closer examination, the discharge plateau at −0.4 V in Figs. 2A and 2C stands out as a distinctive comparison between the two electrolytes. Corresponding to peak (i) in Figs. 2B and 2D, this plateau signifies the dissolution-precipitation reaction converting MnOOH to Mn(OH)2. While this reaction is short-lived in KOH, disappearing after 4 cycles, it persists in NaOH for at least 10 cycles. Thus, NaOH appears to sustain the reaction more sustainably.
The −0.6 V discharge plateau and its corresponding peak (ii) also draw attention as they represent the Bi-redox processes. Notably, this reaction exhibited improved stability in both electrolytes, compared to the other reaction steps. Figure 2A reveals that this plateau is noticably more constant in NaOH than KOH.
Shifting focus to another key comparison, the behavior of peak (v) at approximately 0.15 V is drastically different between the two electrolytes. During the first few cycles, peak (v) is very pronounced in KOH CV curve (Fig. 2D), corresponding to a short charge plateau (Fig. 2C) associated with solid-state protonation of MnOOH. In contrast, this peak is barely detectable in the NaOH CV scan (Fig. 2B). Evidence of this reaction occurring in NaOH is more prominent in the charge curves (Fig. 2A), which shows two small successive plateaus in the V-range of interest. This contrast in peak behavior suggests that birnessite formation occurs via slower kinetics in NaOH than in KOH.
Finally, the rightmost bar in Fig. 3A presents the cathode lifetimes at full DOD in KOH (blue) and NaOH (yellow). The NaOH system had a lifetime of 13.7 Ah g−1, outperforming KOH in the beaker cell system with a 70% longer cathode lifetime.
Lifetime comparison at various DOD
To further our understanding of the system's performance in each electrolyte, we analyzed the influence of the lower voltage limit during cycling on the cathode's lifetime. While the upper voltage limit was set to 0.3 V vs Hg/HgO, we varied the minimum voltage to which the cathode was discharged. In each test, the upper and lower voltage limits remained fixed throughout the lifetime of the cathode. The lifetime test concluded when the cathode's capacity fell below 20% of its initial capacity at the predefined voltage range. Cathode lifetime was calculated as the total Ah processed per gram of MnO2.
Figure 3A visualizes the relationship between cathode lifetime (in Ah throughput) and lower voltage limit in both electrolytes. Similarly, SI Fig. 10 shows how cycle life is influenced by the lower voltage limit. Each bar in the figure represents a different cathode lifetime test. Our analysis revealed a weak positive correlation between lifetime (in Ah/g) and lower voltage limits (i.e., deeper discharge). The correlation was stronger in KOH (R2 = 0.67, p-value = 0.024) than in NaOH (R2 = 0.55, p-value = 0.055). To summarize this trend, we calculated the percentage increase in lifetime for each electrolyte, M (where M represents K or Na), using the formula: % lifetime increase in MOH =  where
where  is the lifetime in MOH when the minimum voltage is −1.0 V, and
  is the lifetime when the minimum voltage is −0.4 V. Remarkably, this approach revealed that lifetimes surged by 175% in NaOH and 487% in KOH when discharged to the deepest level (−1.0 V vs Hg/HgO), compared to the highest minimum voltage tested (−0.4 V vs Hg/HgO).
In every voltage window tested, NaOH outperformed KOH. This superiority is especially clear in Fig. 3B, which illustrates the percentage increase in cathode lifetime when cycled in NaOH relative to KOH. The figure indicates a 20% to 250% lifetime enhancement in NaOH. The most pronounced divergence in lifetimes (over 200%) occurred when the minimum voltage was −0.5 or −0.6 V vs Hg/HgO. Figures 4A and 4B show the immediate capacity retention improvement in NaOH from the beginning of the tests. Figure 4C further highlights the significantly higher 10th discharge capacity in NaOH. Importantly, as showcased by Fig. 4C, setting the minimum voltage to −0.5 and −0.6 V vs Hg/HgO omits the Bi-redox plateau. This suggests that lifetime boost in NaOH mainly stems from the steadier dissolution-precipitation reaction. The dissolution-precipitation plateau decayed immediately in KOH when the cathode was discharged −0.5 or −0.6 V, disappearing after just 3–4 cycles (as seen in the 2nd and 3rd columns in Fig. 4C). In contrast, the same reaction plateau showed significantly higher stability in NaOH.

Figure 4. Discharge capacity in each the first 10 cycles in (A) KOH and NaOH at various depths of discharge. (B) Comparison of capacity retention in NaOH and KOH after 10 cycles at various depths of discharge. (C) The first 10 cycles in each electrolyte at various depths of discharge (after the initial birnessite formation cycle, shown in SI Fig. 9).
Download figure:
Standard image High-resolution imageMaterials stability in electrolyte-lean environments
Finally, we tested the cathode's performance in electrolyte-starved conditions, expecting the volume of the electrolyte and the electrolyte-to-active material (E/AM) ratio to influence the ionic movements, solvation phenomena, and possible side reactions. The influence of electrolyte starvation on cathode lifetime was studied by implementing full DOD cycling tests using T-cell three-electrode fixtures.
The exploration of electrolyte to active material (E/AM) ratio is largely unexplored in the literature on alkaline MnO2 systems. However, electrolyte concentrations have been shown to impact system reversibility. Higher concentrations of NaOH and KOH are known to increase the solubility of Mn2+ and Mn3+, leading to active material loss. 1,17,21 The solubility increase is due to increased concentrations of OH− ions available for bonding. It follows that limiting the number of available OH- ions by restricting electrolyte volume could reduce parasitic dissolution of useful Mn species.
We found that electrolyte starvation resulted in significantly improved cathode stability. Figure 5C elucidates this observation, contrasting the cathode's capacity per cycle in a (A) KOH-flooded, (B) NaOH-flooded, (C) KOH-lean, and (D) NaOH-lean scenarios. The cathode capacity immediately plummeted in the flooded environments (A and B). In the KOH-lean T-cell, however, the cathode capacity stayed at approximately 600 mAh/g for several cycles. The most impressive performance emerged in NaOH-lean scenario, where the cathode consistently delivered a capacity of approximately 400 mAh g−1 for over 400 cycles.

Figure 5. Comparison of cycling performance of Bi-birnessite cathode in electrolyte-lean T- cells, with (A) 6.6 M NaOH and (B) 10.5 M KOH electrolyte. (C) Discharge capacity, in mAh per g MnO2, of Bi-birnessite cathode in A − 6.6 M KOH in a beaker cell, B − 6.6 M NaOH in a beaker cell, C − 10.5 M KOH in a T-cell, and D − 6.6 M NaOH in a T-cell.
Download figure:
Standard image High-resolution image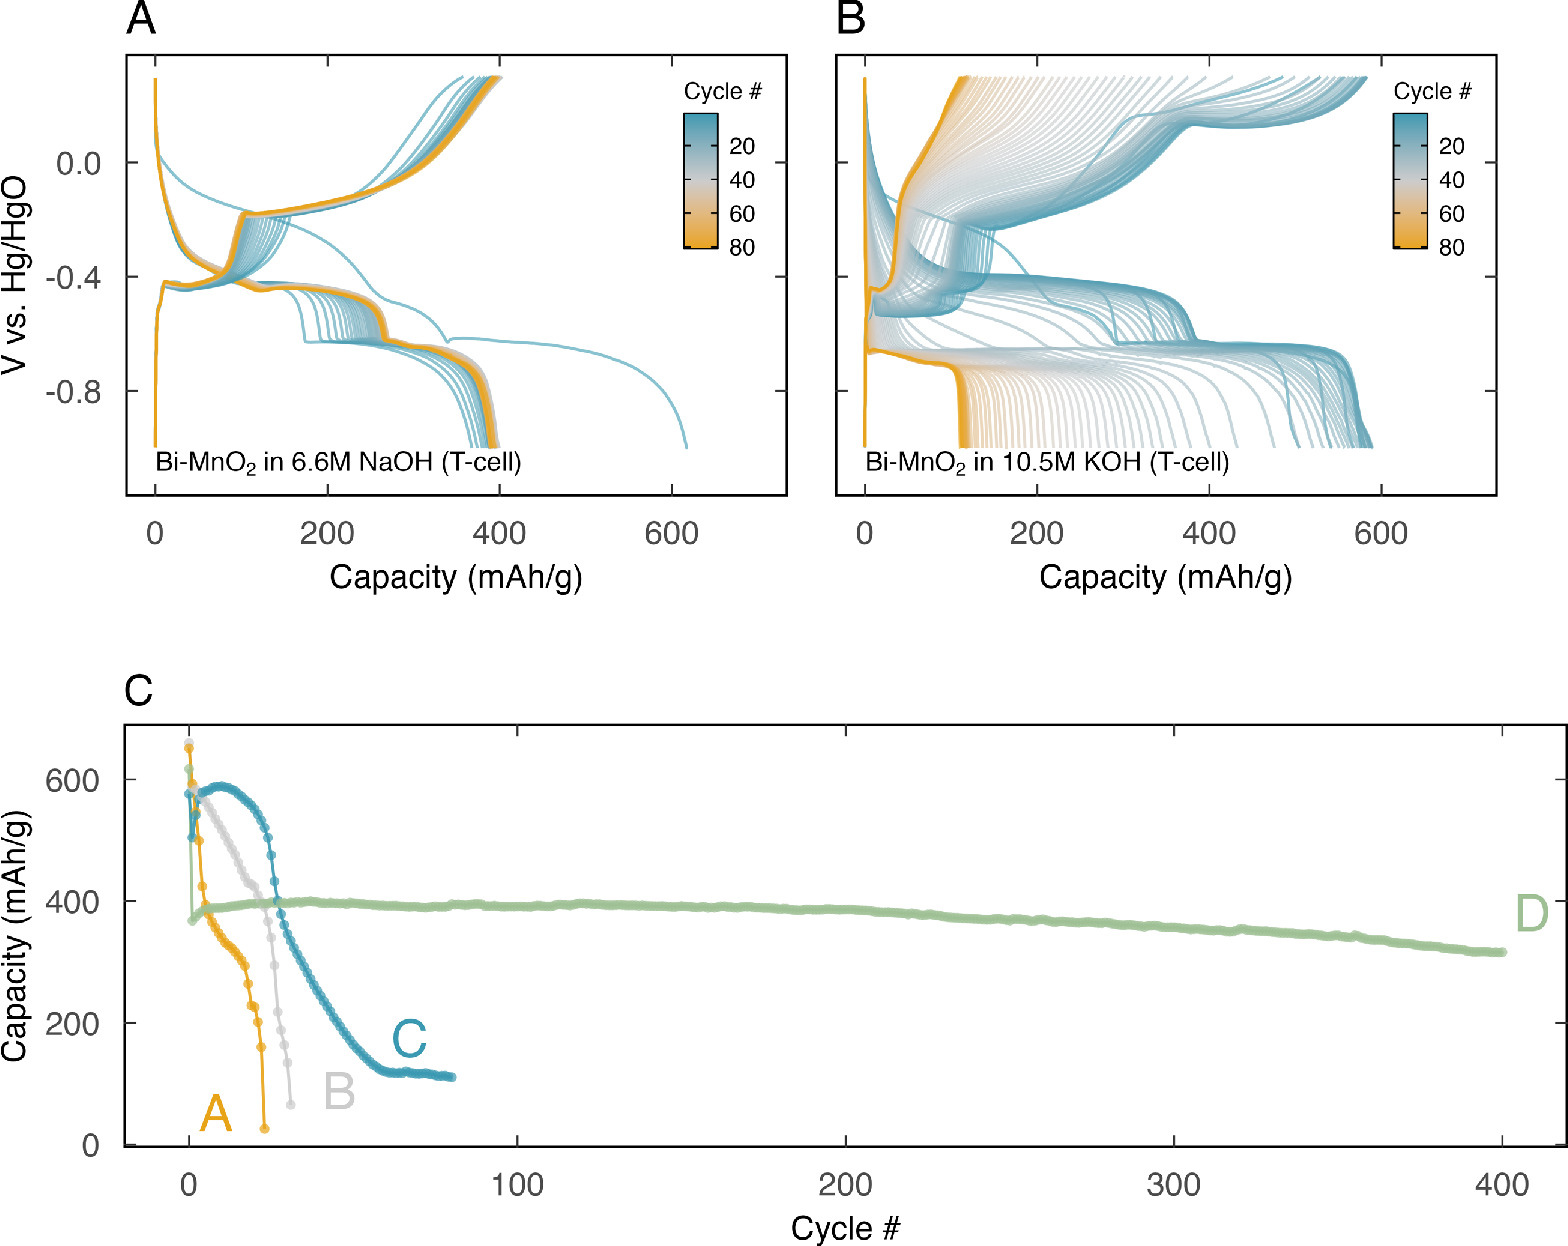
The discharge curves in Fig. 5 offer deeper insights into the evolution of reactions in both lean systems. In KOH (Fig. 5B), all reaction plateaus fade gradually over time. By the 60th cycle, the discharge curve predominantly reflects the Bi-redox plateau, suggesting that the dissolution-precipitation reaction is the failure point of the reaction pathway. In contrast, the NaOH system (Fig. 5A) exhibited highly stable reaction plateaus. Notably, the capacity contribution from the dissolution-precipitation reaction, observed at −0.4 V vs Hg/HgO in the discharge curve, increased throughout the cathode's lifetime.
Due to the importance of the dissolution-precipitation process during MnO2 cycling, we hypothesize that the superior performance in the T-cell system is due to two phenomena curtailing solvation side-reactions. The first is the saturation of solutes in the electrolyte. In Table IV, the solubility limits for Mn2+ and Mn3+—based on polarographic measurements reported by Kozawa et al.—were used to estimate active material mass dissolved in the beaker- and T-cells. 21 Factoring in the 10–20 mg range of active material in the cathodes tested, up to 10%–30% of this mass was inferred to have dissolved in the beaker cell. The T-cell, on the other hand, only allowed a maximum of 3% of the active mass to exist in a solvated state at any particular time.
Table IV. Estimates of active material mass dissolved in the beaker- and T-cells. Solubility limits on Mn species in KOH and NaOH were reported by Kozawa et al. 21 Maximum mass dissolved in the T-cell and beaker cell is estimated assuming they respectively contain 1–2 ml and 15–20 ml of electrolyte. The active material mass in the cathodes tested ranged from 10–20 mg.
| Species | Electrolyte | Solubility limit at 6.6 M 21 (E/AM ratio in ml/mg) | Mass dissolved in T-Cell (% of active material) | Mass dissolved in beaker cell (% of active material) |
|---|---|---|---|---|
| Mn(II) | KOH | 15 mg l−1 (70) | 15–30 μg | 230–300 μg |
| NaOH | 15 mg l−1 (70) | (0.075%–0.30%) | (1.1%–3.0%) | |
| Mn(III) | KOH | 150 mg l−1 (7) | 150–300 μg | 2.3–3.0 mg |
| (0.75%–3.0%) | (11%–30%) |
The second phenomenon is the constrained ion diffusion length in the T-cell. Due to the limited electrolyte volume in the T-cell, dissolved ions remain close to the reaction surface. In contrast, the expansive domain of the flooded beaker cell permits ions to drift into the bulk electrolyte, potentially initiating undesired reactions such as Mn3O4 formation. Since the dissolution process or the side reactions could also contribute to the capacity of the battery, this could explain why we see a smaller specific capacity in the T-cell system, as shown in Figs. 5A and 5B and SI Fig. 4. Particularly, in the NaOH-lean system, there was a 40% drop in capacity after the first discharge. SI Fig. 12 shows that this drop was reproducible in replications of the first few cycles. Future work should investigate mechanistic causes of this capacity drop and potential solutions.
The diffusion of solvated ions may also be influenced by the electrolytic cation, explaining the more stable performance in NaOH in the T-cell. The larger K+ solvation shell may hinder pathways through which Mn ions can return to the reaction surface. Thus, the influence of electrolyte volume (E/AM ratio) and electrolytic cation are an important opportunity for future research on birnessite cathodes.
Conclusions
In this work, we explored the properties and performance of Bi-birnessite using different electrolyte types and cycling protocols. Our analysis compared the formation and cycle life of Bi-birnessite in KOH and NaOH. XRD, SEM, and XRF were used at various points in the cathode's cycle life to observe the phase evolution of the material. Our findings, summarized in Table V, delineate the nuanced interactions between factors such as Bi2O3 content, electrolytic cation, and electrolyte-to-active material (E/AM) ratio. These interactions significantly influenced performance metrics including capacity, stability, and voltage profile.
Table V. A quick-reference overview of the primary factors examined in this study and their observed influences on the properties and electrochemical behavior of Bi-birnessite.
| System component | Influence |
|---|---|
| Bi2O3 content | Performance - Bi2O3 presence increased the cathode's capacity from 70% of the theoretical value to 100% (Fig. 1). |
| Behavior—In KOH, protonation was undetectable in the absence of Bi2O3 (Fig. 1D). | |
| Electrolyte composition (NaOH vs KOH) | Property - NaOH increased the interlayer spacing by 0.5%-1% (Table III). |
| Property - NaOH reduced the ratio of intercalated cations to MnO2 (Fig. 1 F). | |
| Behavior - NaOH changed the voltage behavior during the protonation reaction at approx. 0 V vs Hg/HgO (Fig. 1). | |
| Performance - NaOH increased cathode lifetime at full DOD by 70% in a flooded environment (Figs. 2 and 3). | |
| Performance - The dissolution-precipitation reaction is more stable in NaOH (Fig. 4). | |
| Performance - In an electrolyte-starved environment, NaOH maintained cathode stability at ~400 mAh/g for over 400 cycles. Failure began in KOH after ~20 cycles (Fig. 5). | |
| Voltage range | Performance- Discharging to shallower voltage depths significantly reduced cathode lifetime (Fig. 3). |
| Performance - The largest cathode lifetime difference between NaOH and KOH occurred when the Bi-redox plateau was excluded during cycling, suggesting the main differentiating factor is the dissolution-precipitation reaction (Fig. 4). | |
| Electrolyte-to-active material (E/AM) ratio | Property—Electrolyte starvation significantly reduces Mn3+ and Mn2+ saturation concentrations (Table IV). |
| Performance - Electrolyte starvation significantly improved stability in both electrolytes (Fig. 5). | |
| Performance - The dissolution-precipitation reaction is more stable in electrolyte-lean systems (Figs. 2 and 5). | |
| Performance - Trends in capacity per cycle plots suggest that electrolyte starvation increased cathode cycle life by over 300% in KOH and by over 1300% in NaOH (Fig. 5). |
The birnessite structure was successfully formed in both electrolytes using a known in situ electrochemical synthesis method. XRF analysis immediately after birnessite synthesis showed a mole fraction of potassium in KxMnO2 that was 24% higher than that of sodium in NaxMnO2, suggesting a substantially different chemical reaction pathway that depends on electrolyte cation species.
Furthermore, in beaker cell systems, the cathode's lifetime at full DOD in NaOH was 10% higher than in KOH. This superior performance in NaOH continued in the T-cell system, where NaOH maintained cycling stability for over 400 cycles with only a 12% capacity decay. We attribute the improved performance in the electrolyte-starved T-cell system to saturation of solutes in the electrolyte and shortened ion diffusion pathways.
We also evaluated the impact of DOD on the capacity fade behavior of the cathode in NaOH and KOH. Our findings revealed weak positive correlations between DOD and cathode lifetime. Notably, cathodes cycled to the deepest DODs exhibited significant stability, with lifetimes increasing by 175% in NaOH and 487% in KOH compared to the shallowest DODs tested.
The performance of Bi-birnessite in NaOH-lean cells demonstrates promise as a chemistry for stable stationary batteries. To build on the findings of this study, future work should delve into a comparative analysis of reaction mechanisms in KOH and NaOH in electrolyte-flooded and -lean environments. It should also include varying NaOH concentrations in electrolyte-lean environments and replicate experiments to understand cell-to-cell variation, further enhancing our understanding of these complex systems.
Acknowledgments
This work is supported by the National Science Foundation Graduate Research Fellowship Program under Grant No. DGE1745016. Any opinions, findings, conclusions, or recommendations expressed in this material are those of the authors and do not necessarily reflect the views of the National Science Foundation. Additional support was provided by the Wilton E. Scott Institute for Energy Innovation at Carnegie Mellon University. The authors acknowledge use of the Materials Characterization Facility at Carnegie Mellon University supported by grant MCF-677785. The authors would also like to thank the thoughtful comments provided by Jared Mitchell, Han Wang, Sven Burke, and Chris Pistorius. The authors declare that they have no known competing financial interests or personal relationships that could have appeared to influence the work reported in this paper.
Supplementary data (1.3 MB PDF)