
Abstract
Stress tests are developed that focus on anode catalyst layer degradation in proton exchange membrane electrolysis due to simulated start-stop operation. Ex situ testing indicates that repeated redox cycling accelerates catalyst dissolution, due to near-surface reduction and the higher dissolution kinetics of metals when cycling to high potentials. Similar results occur in situ, where a large decrease in cell kinetics (>70%) is found along with iridium migrating from the anode catalyst layer into the membrane. Additional processes are observed, however, including changes in iridium oxidation, the formation of thinner and denser catalyst layers, and platinum migration from the transport layer. Increased interfacial weakening is also found, adding to both ohmic and kinetic loss by adding contact resistances and isolating portions of the catalyst layer. Repeated shutoffs of the water flow further accelerate performance loss and increase the frequency of tearing and delamination at interfaces and within catalyst layers. These tests were applied to several commercial catalysts, where higher loss rates were observed for catalysts that contained ruthenium or high metal content. These results demonstrate the need to understand how operational stops occur, to identify how loss mechanisms are accelerated, and to develop strategies to limit performance loss.
Export citation and abstract BibTeX RIS

This is an open access article distributed under the terms of the Creative Commons Attribution 4.0 License (CC BY, http://creativecommons.org/licenses/by/4.0/), which permits unrestricted reuse of the work in any medium, provided the original work is properly cited.
While hydrogen is used today as a chemical commodity in agriculture and transportation, production cost limits its impact in energy overall, particularly when produced through electrochemical water splitting. Hydrogen, however, has several advantages as an energy carrier, including the ability to transition between electricity and chemical bonds, a high gravimetric energy density, and its ability to be stored effectively for long durations. 1–3 With recent reductions in the cost of electricity, hydrogen is positioned for significant growth by directly load-following renewable power sources. 4 Electrolysis growth opportunities include use as grid support, storing variable inputs, and offloading hydrogen to both existing (agriculture, transportation) and emerging (metal refining, chemical synthesis) markets. 1,5
Challenges exist, however, in reducing the cost of hydrogen produced from electrolyzers including materials integration, manufacturing, and durability considerations. While electrolyzer durability is not a concern under constant load and with high catalyst loading, it becomes significantly more important as platinum (Pt) group metal (PGM) loading reductions are implemented to lower capital cost and address sustainability as electrolysis shifts to intermittent power supplies. 4,6–8 For proton exchange membrane (PEM)-based systems, component durability has been evaluated in numerous efforts. For the anode catalyst, studies include ex situ characterization of materials based on activity loss and dissolution rates following a variety of test protocols. 9–14 In situ durability testing has explored catalyst durability through constant and variable load, as well as through hydrogen crossover. 6,15–28 Both ex and in situ evaluations have in turn provided feedback to catalysis studies and catalyst development efforts, where innumerable materials (admetals, oxidation states, non-PGM) and integration (supports, morphology) strategies have been explored. 3,16,29–33 For other components, the impact of porous transport layer (PTL) coatings and substructure have been evaluated and enabled PTL development and PGM thrifting; 19,34–43 the mechanical and chemical durability of membranes has also been examined to assess the impact on performance losses over time. 22,44,45
This study focuses on simulating performance losses in PEM-based low temperature electrolyzers from start-stop operation and the associated anode catalyst layer redox transitions caused by hydrogen crossover. These experiments utilize low catalyst loading and frequent cycling to reduce experiment duration, previously found to be representative in mechanism and observation (loss type, diagnostics) to more moderate loading and test conditions, provided that reasonable catalyst layer uniformity and ionomer integration were achieved. 23,46 This study also leverages past efforts that studied the durability impact of intermittent load as a comparison point to demonstrate the effect of catalyst redox on increasing dissolution and performance loss rates. 23 The accelerated stress tests utilized here explore this test condition and loss mechanism, and are not intended as a field test replacement. Evaluating individual degradation mechanisms are critical to developing device level stress tests. These types of studies examining catalyst redox are also necessary to provide feedback into technoeconomic analysis, to determine the cost tradeoffs between performance loss and materials (e.g., recombination layers) or operational (backpressure release, battery) mitigation strategies.
Experimental
Ex situ testing was performed using rotating disk electrode (RDE) half-cells and previously-developed protocols. 10 Working electrode inks consisted of 3.5 mgIr (Alfa Aesar, 43396, 85 wt% Ir), 7.6 ml of water, and 2.4 ml of 2-propanol. After immersing in an ice bath for 5 min, 20 μl of Nafion ionomer (Sigma Aldrich, 5 wt%) was added; the ink was then horn sonicated for 30 s, bath sonicated for 20 min, and horn sonicated for 30 s, all while immersed in an ice bath. After sonication, 10 μl of ink was pipetted onto a polycrystalline gold electrode rotating at 100 rpm on an inverted modulated speed rotator (Pine Research Instrumentation). After the ink was deposited on the electrode, the rotation speed was increased to 700 rpm and the ink was allowed to dry for 20 min at room temperature.
RDE testing was completed with an electrocatalyst ink-coated polycrystalline gold working electrode, a gold counter electrode, and a reversible hydrogen electrode (RHE) reference. Testing was performed using nitrogen-saturated 0.1 M perchloric acid (ACS grade) and an Autolab PGSTAT 302 N. Working electrodes were conditioned for 50 cycles, 1.2‒1.8 V vs RHE at 100 mV s‒1 and 2500 rpm. Oxygen evolution reaction (OER) activities were taken with anodic linear sweep voltammograms at 20 mV s‒1, focused on kinetics (1.2‒1.6 V vs RHE) and to cover the full potential range of interest (1.2‒2 V vs RHE). OER activity measurements utilized potentials corrected for uncompensated internal resistance; resistance was measured using the current interrupt technique at 1.6 V. Resistance values were typically 25 ± 1 Ω and varied slightly based on the experiment and the distance between the working electrode and RHE Luggin capillary. Kinetic comparisons were made at 1.55 V vs RHE, to avoid transport and capacitance at the specified rotation speed (2500 rpm) and scan rate (20 mV s‒1). Cyclic voltammograms were taken 0.025‒1.4 V vs RHE at 20 mV s‒1.
Ex situ durability was evaluated with a variety of potential holds and cycling protocols, specified in figure discussions and captions. For dissolution measurements after 13.5 h durability tests, 10 ml aliquots were taken for analysis by inductively-coupled plasma mass spectrometry (ICP-MS). Total dissolution in μg was calculated based on the sample concentration and the total electrolyte volume (125 ml). ICP-MS data was acquired using a Thermo Scientific iCAP Q in kinetic energy dispersive (KED) mode with a dwell time of 0.15 s. The instrument was calibrated to internal standards, a blank (0.1 m perchloric acid), and Ir standards (2, 20, 200 ppb in 0.1 m perchloric acid), resulting in a detection limit (IDL) of 3 ppt or less.
Catalyst-coated membranes (CCMs) were prepared on Nafion 117 with an automated spray station and Accumist ultrasonic spray head to loadings of 0.1 mg cm‒2 (Ir/anode and Pt/cathode basis) using previously optimized inks and spray conditions. 46 Each run coated four CCMs to keep the spray time constant, the first round with carbon supported Pt (Pt/HSC, 47 wt% Pt, Tanaka Kikinzoku Kogyo TKK, TEC10E50E). For the Pt/HSC cathode ink, 91.9 mg of catalyst was added to water (24 ml) and n-propyl alcohol (18.3 ml). After 5 min of icing, 109.9 μl of Nafion ionomer (DE2020, 20 wt%, ionomer to carbon ratio 0.45:1) was added; the ink was then horn sonicated for 30 s, bath sonicated for 20 min, and horn sonicated for 30 s, all with the ink immersed in an ice bath. After sonication, the ink was added to a syringe pump and sprayed onto Nafion 117 at 0.2 ml min‒1 and 80 °C.
The second round of spraying deposited the Ir anode catalyst layers (unsupported Ir oxide, Alfa Aesar, 43396). Previous characterization of this catalyst found a particle size of roughly 5 nm, a crystallite size of 7.4 Å, and an electrochemical surface area of 28.7 m2 gIr ‒1. 12,30,47 This particular catalyst was used in this study due its oxide characteristics (no hydrogen underpotential deposition in cyclic voltammograms), the higher durability of Ir oxide compared to metal/mixed oxides, and the reasonable electrochemical surface area. 6,14 For the Ir anode ink, 113.8 mg of catalyst was added to water (11.7 ml) and n-propyl alcohol (23.8 ml). After 5 min of immersion in an ice bath, 95.6 μl of Nafion ionomer (DE2020, 20 wt%, ionomer to catalyst ratio 0.2:1) was added; the ink was then horn sonicated for 30 s, bath sonicated for 20 min, and horn sonicated for 30 s, all while the ink was immersed in an ice bath. After sonication, the ink was added to a syringe pump and sprayed onto Nafion 117 (cathode already sprayed) at 0.2 ml min‒1 and 90 °C. After the anode and cathode layers were sprayed, the CCMs were rehydrated then dried at 50 °C on a vacuum plate to minimize warping and contact resistances during testing.
Reproducibility in MEA preparation is a concern in electrolyzer performance and durability, particularly at low catalyst loading. CCMs (simulated redox and intermittent load baselines) were sprayed by the same experimenter, four at a time, and tested for reproducibility. Within individual data sets, performances before and following durability were reproducible within 5 mV at set current densities provided that the spray and test conditions were as identical as possible, including the same components (including the same catalyst, membrane, ionomer batches), configuration, similar water conductivity, and minimal interruptions or unintended shutdowns.
After spraying the CCMs, catalysts loadings were confirmed with X-ray fluorescence (XRF) using a Fischer XDV-SDD energy dispersive XRF spectrometer. Catalyst loadings (Pt and Ir) were averaged over four measurements with a 30 s exposure time.
Single-cell hardware consisted of Fuel Cell Technologies endplates and current collectors, carbon gas diffusion layers (GDLs; Toray) and flow fields (Fuel Cell Technologies) at the cathode, and Pt-coated titanium porous transport layers (PTLs) and flow fields (Giner, Inc.) at the anode. MEAs (25 cm2) were tested with Greenlight test stands with water fed to the anode at 300 ml min‒1 and a dry cathode without backpressure. Prior to polarization curves, MEAs were conditioned with galvanostatic holds at 0.2 A cm‒2 (1 h) and 1 A cm‒2 (1 h), followed by a 1.7 V hold until the current stabilized (less than 0.5 mA change over 1 h). Polarization curves were then taken, first anodically, then cathodically, with cell voltage reported as the average over the final min of each step (5 min step duration). Cyclic voltammograms (0.025‒1.3 V) were taken at 50 mV s‒1 and impedance spectra (1 Hz ‒ 100 kHz) were taken at each current density evaluated. Polarization curves were corrected for high frequency resistance to form Tafel plots and to focus on reaction kinetics. Impedance spectra (0.2 A cm‒2) were also fit to a modified Randles cell equivalent circuit model to monitor differences in the HFR (Rs), polarization resistances (Rp,α and Rp,β ), and capacitance (Cα and Cβ , Fig. 1). Overpotentials were separated as: ohmic, the difference between cell potential corrected and uncorrected for HFR; kinetic, from the Tafel slope and exchange current density calculated from the HFR-corrected potential; and transport, the difference between the Tafel slope and the HFR-corrected potential.
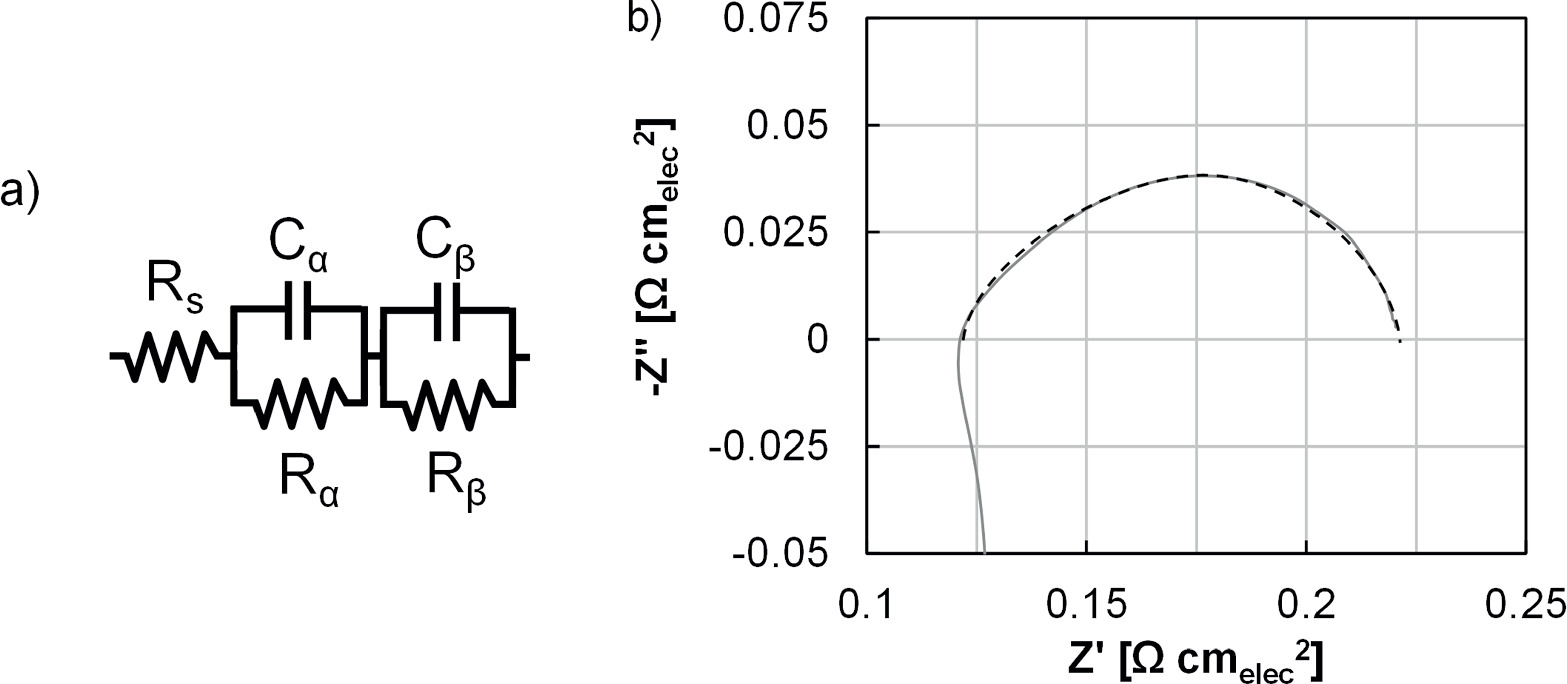
Figure 1. (a) Modified Randles cell equivalent circuit model and (b) demonstration of fitting for an impedance spectra at 0.2 A cm‒2 prior to durability testing.
Download figure:
Standard image High-resolution imageDurability testing was performed by probing several test parameters including intermittent load (cycling 1.45‒2 V) and simulated redox (cycling 0‒2 V) with and without a continual water feed. Testing consisted of 31.5 k cycles (525 h) with polarization curves and diagnostics taken every 4.5 k cycles. The intermittent load baseline consisted of triangle wave cycling and was based on previously-developed ASTs. 23 These types of tests were used to assess the impact of Ir redox on catalyst layer degradation, and how the periodic loss of temperature control and hydration affect these measurements. These protocols are not a field test since they intentionally focus on a single component (anode catalyst layer) and loss mechanism. Other mechanisms that result in membrane (mechanical, chemical), transport layer (coating defects, sub-coating passivation), and catalyst layer (defects, contaminants) are currently being evaluated or, in cases, have been studied previously. Realistic incorporation of these different mechanisms into a cell-based AST is also currently being explored.
Durability testing was also extended to a variety of iridium (Ir) and ruthenium (Ru) -based catalysts to assess differences when exposed to ASTs incorporating catalyst redox. The evaluated catalysts included Alfa Aesar Ir oxide, TKK Ir, Umicore Ir oxide supported on titania, Furuya Ir-Ru, Alfa Aesar Ru oxide, Johnson Matthey Ir, Umicore Ir, Premetek Ir, and Premetek carbon-supported Ir. Catalysts were segregated based on metal/oxide content, based on previous ex situ efforts examining differences in hydrogen underpotential deposition and capacitance responses. 14 These MEAs maintained the same anode catalyst loading (0.1 mgMetal cm‒2) and components (PTLs, Nafion 117); catalyst layer optimization was completed in previous efforts. 14 While this study was designed to focus on general materials trends, it is possible that further optimization of electrode structure may reorder MEA performances and durabilities.
Anode catalyst particle size distributions were determined using X-ray scattering. Samples were prepared for these measurements by removing the anode catalyst layer from the membrane with single-sided, transparent Scotch™ tape using a press-peel technique. The samples were then supported in a custom-made sample holder. X-ray scattering data were collected on a combined Bonse–Hart (ultra-small X-ray scattering, USAXS) and pinhole (small angle X-ray scattering, SAXS) instrument at beamline 9-ID-C at the Advanced Photon Source, Argonne National Laboratory. Details regarding the optics and instrumentation have been reported previously. 48,49 The X-ray beam was monochromatized, via a pair of Si (220) crystals, to an energy of 21 keV. The beam spot size for USAXS was 0.8 × 0.6 mm (horizontal x vertical) and 0.8 × 0.2 mm for SAXS. The X-ray beam exposure times for each sample were 90 seconds for USAXS and 30 seconds for SAXS. Patterns collected on a blank piece of tape were subtracted from the patterns acquired for the samples during data reduction. The data were corrected and reduced with the NIKA software package, and data analysis was conducted using the IRENA software package. 49,50 Both packages were run on IGOR Pro 7.0 (Wavemetrics). Particle size distribution was obtained from the measured scattering data using the maximum entropy (MaxEnt) method, which involves a constrained optimization of parameters to solve the scattering equation:
Where, I(q) is the scattered intensity, ϱ is the scattering length density of the particle, F(q, r) is the scattering function at scattering vector q of a particle of characteristic dimension r. 51 V is the volume of the particle, and Np is the number density of particles in the scattering volume.
Ir L2-edge extended X-ray absorption fine structure (EXAFS) data were acquired for the anode catalyst layers at beamlines 10BM and 10ID, Materials Research Collaborative Access Team, Advanced Photon Source (APS), Argonne National Laboratory. The L2 edge was chosen rather than the L3 edge to avoid interference from Pt fluorescence in the extended region of the spectra. Data reduction and analysis were performed with the Athena software package. 52 The oxidation state of Ir in the MEAs was evaluated by fitting the X-ray absorption near edge (XANES) regions of the spectra from −20 eV to 30 eV (vs an Eo of 12823 eV), using the linear combination algorithm of the Athena software, to the spectra of two Ir-containing standards: IrO2 and Ir metal. These two standards were chosen based on the appearance of characteristic features of these two forms of Ir in the k-space representations and the Fourier transforms of the extended regions of the spectra.
Scanning transmission electron microscopy (STEM) was performed to analyze Ir anode catalyst layers. To prepare cross sections of Ir anodes, portions of the MEA were embedded in epoxy resin and then cut by diamond-knife ultramicrotomy, with a target thickness of ∼75 nm. High-angle annular dark-field (HAADF) and bright-field (BF)STEM imagesand energy-dispersive X-ray spectrum (EDS) images were recorded using a Talos F200X transmission electron microscope (TEM) (Thermo Fisher Scientific) operated at 200 kV and equipped with Super-X EDS system with 4 windowless silicon drift detectors. EDS elemental maps were processed with the Esprit 1.9 software (Bruker). Anode cross-sections were also imaged using a scanning electron microscope (SEM) with a backscattered electron (BSE) detector on a Hitachi S4800 operated at 5 kV.
Results and Discussion
Ex situ testing of the Ir oxide catalyst (Alfa Aesar, 43396) was completed in RDE half-cells to evaluate potential-driven processes in the range of interest for the electrolyzer anode, and included dissolution and redox transitions. Initially, this effort focused on three separate potential regimes: at and above 1.4 V (red) to focus on operation-relevant potentials; at and below 1 V (blue) to focus on Ir reduction; and between 1 and 1.4 V (green) to incorporate the potentials in between operation and reduction (Fig. 2). Potential holds (open black circles, potential specified on x-axis) and cycles (solid circles) were imposed and presented in terms of catalyst dissolution as measured by ICP-MS and OER activity at 1.55 V vs RHE.
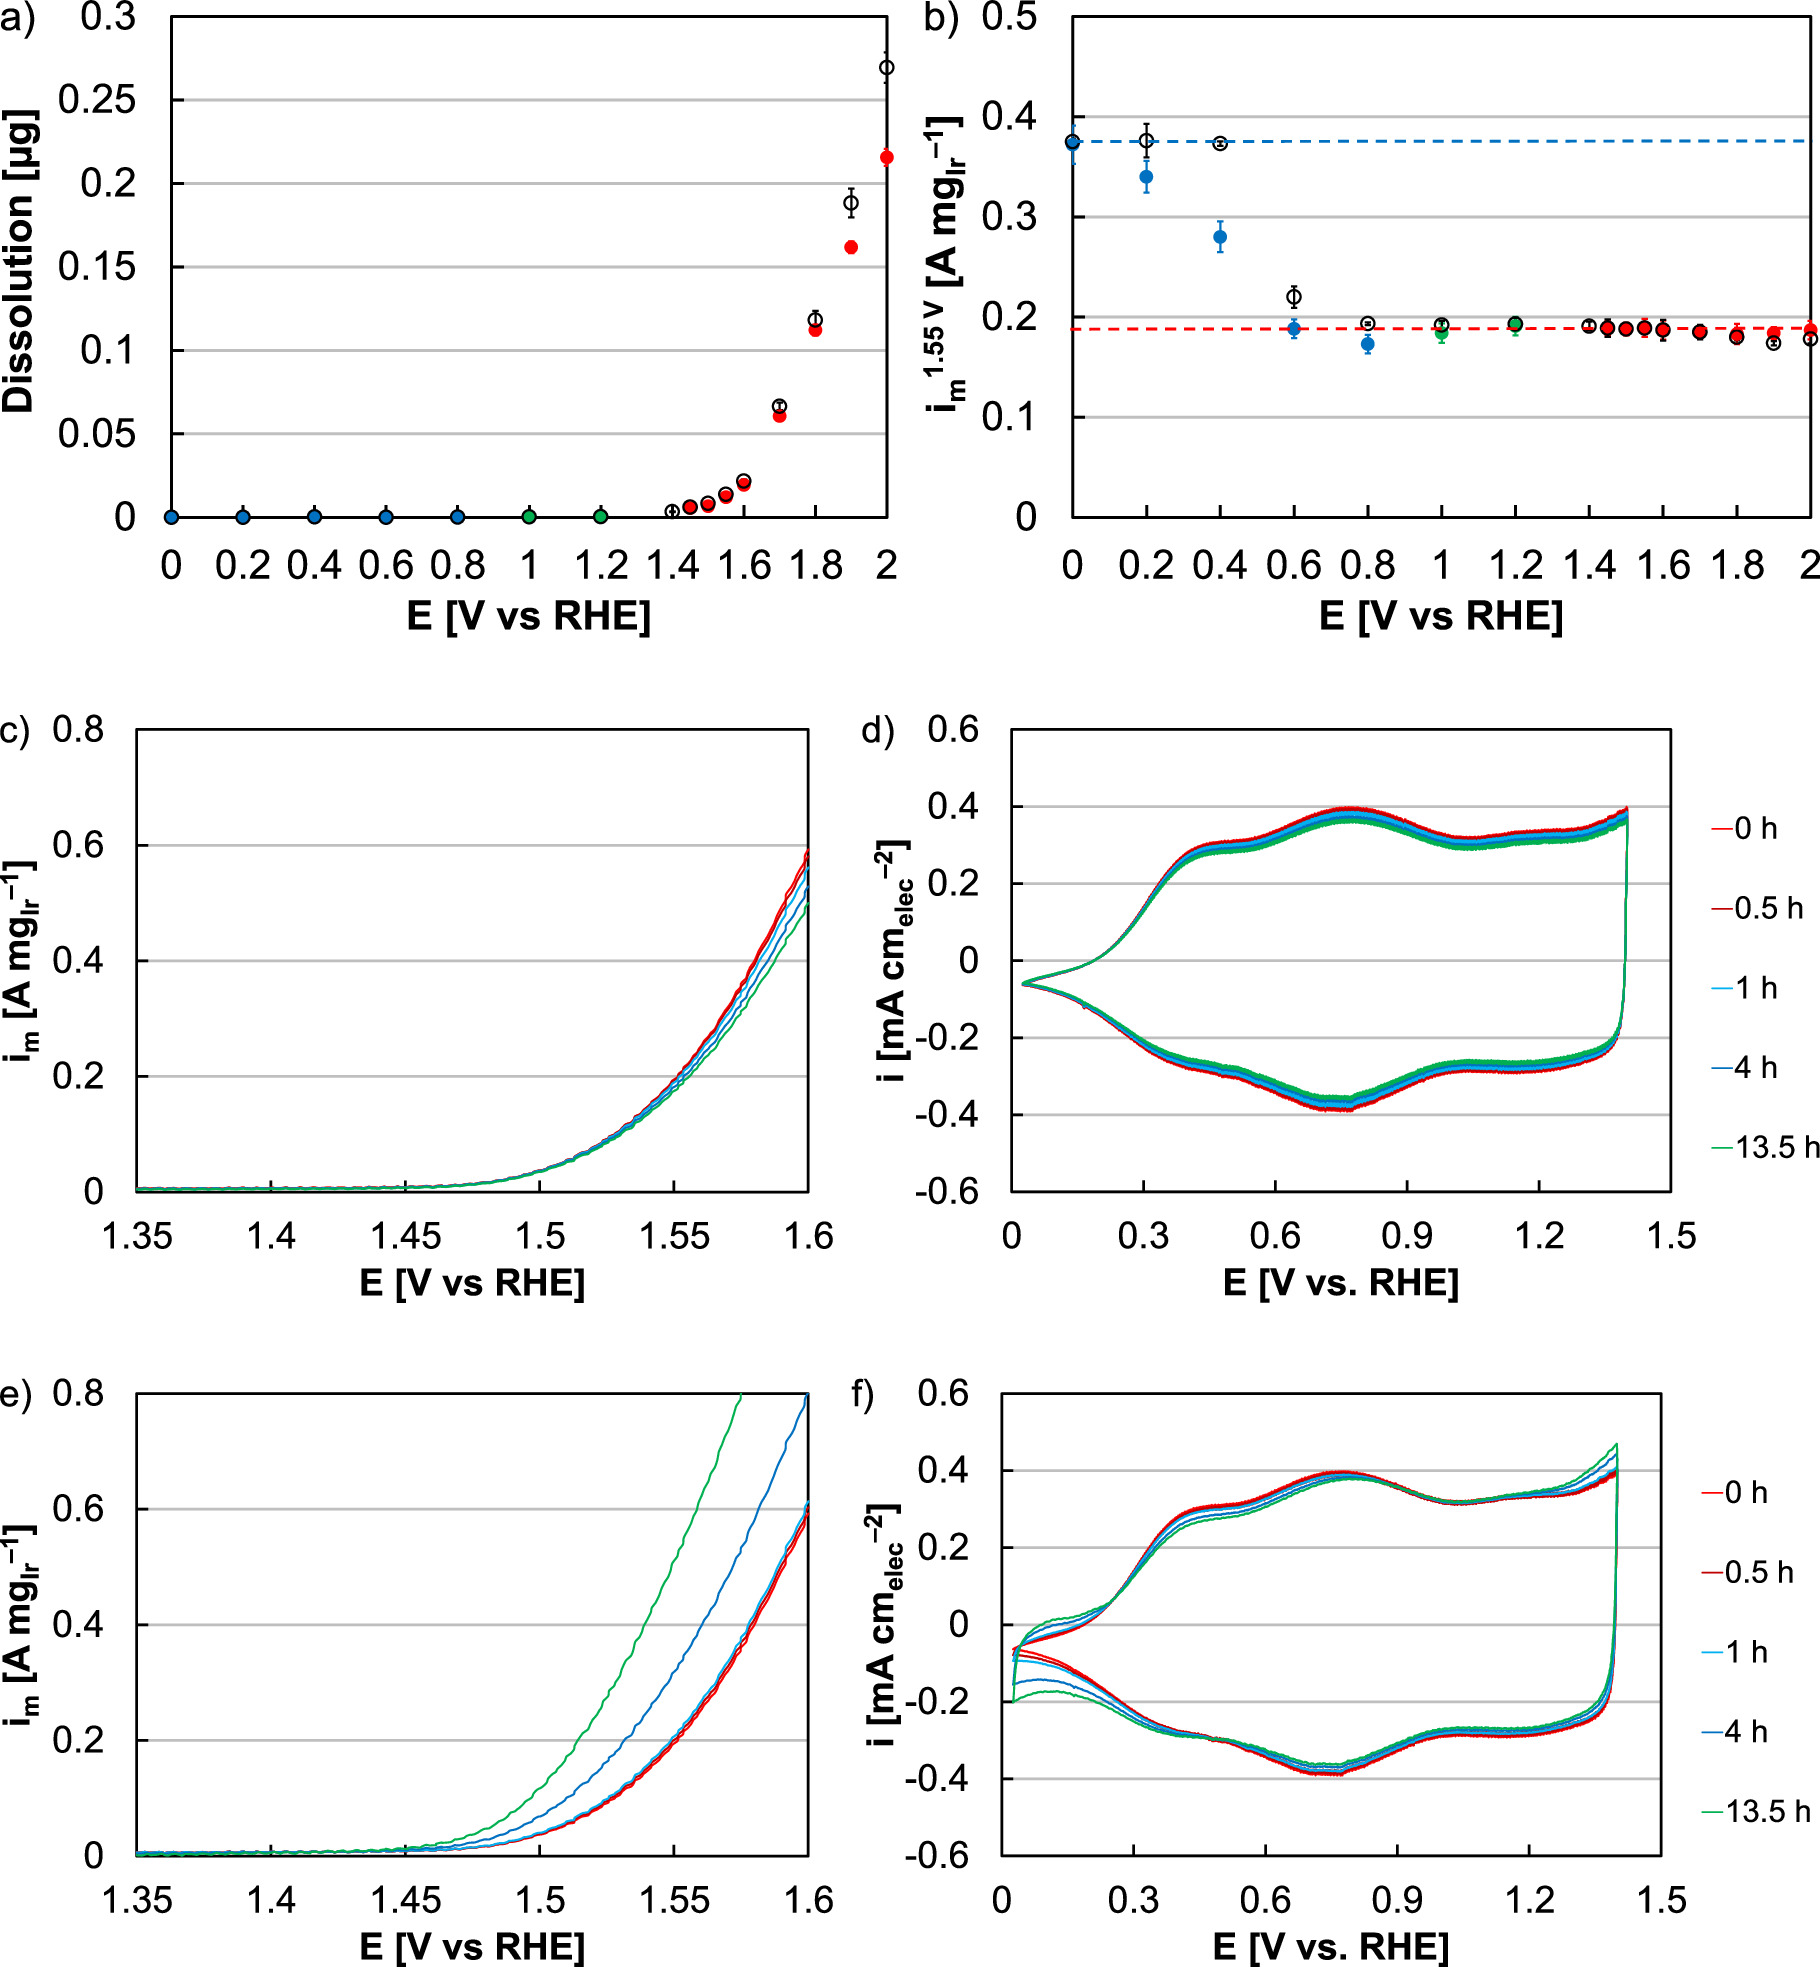
Figure 2. (a) Dissolution and (b) RDE activity of the Ir oxide catalyst (Alfa Aesar) following 13.5 h potential holds (open black circles, specified on the x-axis) and cycles (solid circles) in the range: 1.4 V (lower) to potential specified on the x-axis (upper, red); 1 V (upper) to potential specified on the x-axis (lower, blue); and 1.4 V (upper) to potential specified on the x-axis (lower, green). Examples of changes to OER linear sweep voltammograms and cyclic voltammograms during a (c)‒(d) 2 V hold and a (e)‒(f) 0 V hold at 0 h (red), 0.5 h (dark red), 1 h (blue), 4 h (dark blue), and 13.5 h (green).
Download figure:
Standard image High-resolution imageWhen focusing on operation-relevant potentials at or above 1.4 V, small amounts of Ir dissolution and activity decreases were found (Figs. 2a, 2b, red). These results were consistent with previous findings on Ir oxide, and for potential cycling were at most 3% in activity loss and 6% mass loss by dissolution (1.4‒2 V). 10 During potential holds, these losses were marginally higher (5% activity, 8% dissolution, 2 V hold), due to the elevated time spent at higher potential and the impact of potential on dissolution kinetics. 23 Additionally, cycling did not increase loss rates since the potential range (1.4 V and above) did not include a metal-oxide redox transition; this particular catalyst and the conditions (oxide, ex situ) may further minimize the impact of intermediate transitions (III/IV/V) at high potential. 53 At a 2 V potential hold, dissolution corresponded with gradual decreases in the OER current response during linear sweep voltammograms (Fig. 2c) and slight decrease of the cyclic voltammetric capacitive current (Fig. 2d), consistent with loss of catalyst.
When focusing on the potential range (0‒1 V) where Ir remains metallic, dissolution was not observed and potential holds and cycling in this range increased OER activity (Figs. 2a, 2b, blue). Activity improvements were generally small when the potential stayed near the metal-oxide redox transition, but increased with exposure to lower potential (91% increase, cycling 0‒1 V). At potentials below Ir's redox transition, Ir will reduce and lose oxygen from the surface, and from the near-surface over extended periods of time. 54 This Ir reduction was confirmed with cyclic voltammograms (Fig. 2f), where hydrogen underpotential deposition was increasingly observed during potential holds below the redox transition, and since hydrogen underpotential deposition occurs on Ir metal but not oxide. 47 Additionally, minimal change to the capacitance was found, indicating that reduction likely did not extend to the nanoparticle core. This reduction further coincided with oxygen evolution activity increases (Fig. 2e), expected since the intrinsic activity of Ir metal (subsurface) is greater than oxides, previously confirmed with nanoparticle and thin film catalysts. 10,12,14,55–57 Previous studies have also observed the OER activity of Ir oxide increase following holds at reducing potentials, and the OER activity of Ir metal decrease following holds at oxidizing potentials. 14 While all OER activity measurements were made at a potential at which the surface was oxidized (1.55 V), extended time below redox likely grew subsurface metal and improved activity by inducing lattice strain (compressing the oxide surface lattice) weakening Ir-O binding. 14
A small decrease in activity was further found after cycling in the potential range 0.8‒1 V and may have been due to repeated metal-oxide redox transitions. Significant Ir particle coarsening was not expected for this material set (5 nm unsupported nanoparticles), however, and both the activity (11%) and electrochemical surface area (7%) losses were small. In the potential range between the Ir metal-oxide redox transition and electrolyzer operation (1‒1.4 V), minimal change was expected and found.
Additional ex situ experiments were performed transitioning between operation-relevant potentials and other potential regions (Fig. 3). In all cases, dissolution and activity loss rates increased with exposure to higher potential. These losses were generally small when the lower potential limit was above Ir redox (1.4 V in red, 1 V in blue). As the lower potential was decreased to reach the reduction region, however, dissolution and activity losses increased, likely due to near-surface Ir reduction and the faster kinetics of metal dissolution when compared to oxides. 14 Exposure to lower potentials further increased loss rates, which indicated: (1) a hysteresis between the Ir surface's exposure to a reducing potential and the surface or near-surface reducing; (2) that a minimum time may be required to fully reduce the Ir surface or near-surface; and (3) that dictated potentials may not result in an identical reduction rate compared to hydrogen exposure (from crossover following operational stops). Cycling in the range 0‒2 V also resulted in the largest decrease in activity (80%) and the highest dissolution (59%), approaching those of Ir metal (1.4‒2 V, 82% dissolution, 99% activity).
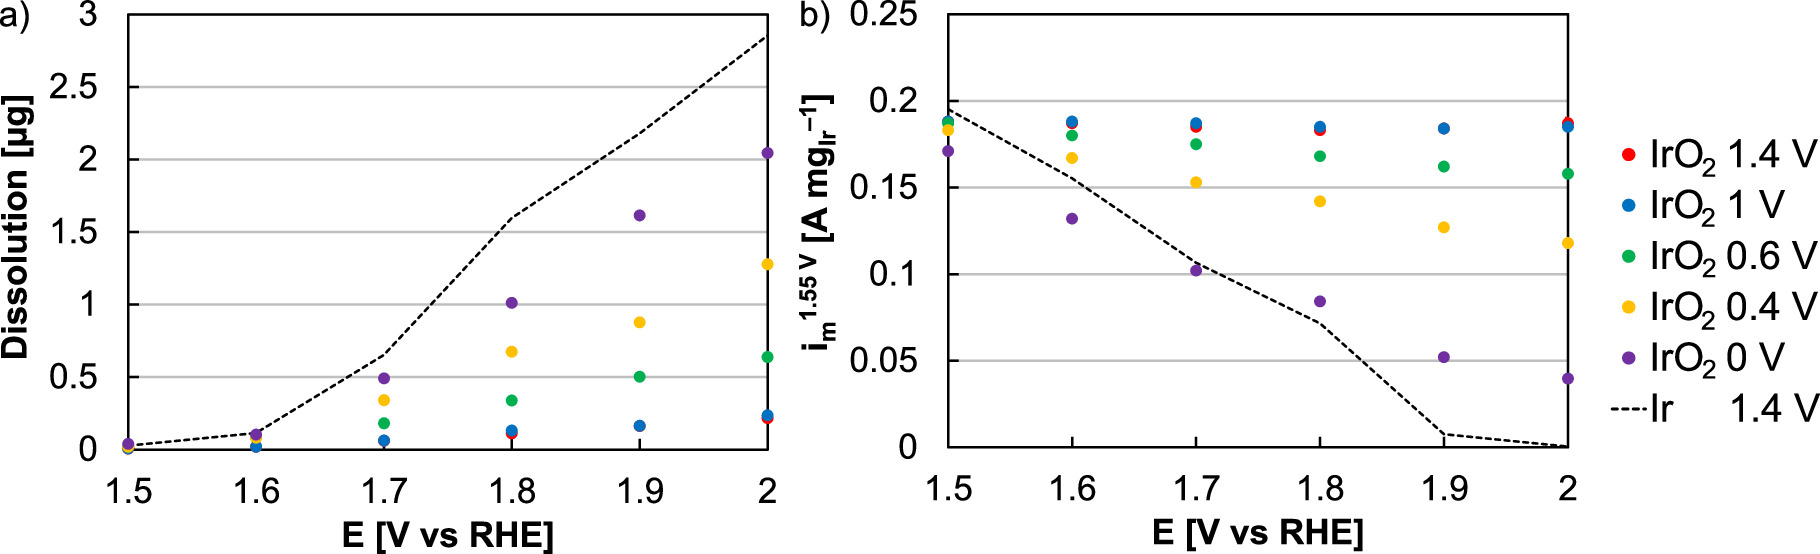
Figure 3. (a) Dissolution and (b) RDE activity following 13.5 h potential cycling between an upper potential specified on the x-axis and a lower potential of 1.4 (red), 1 (blue), 0.6 (green), 0.4 (yellow), and 0 V (purple). Dissolution and RDE activities were included for Ir metal nanoparticles following potential cycling (1.4 V lower potential, upper potential specified on x-axis) with a dashed black line.
Download figure:
Standard image High-resolution imageDuring in situ testing, several experimental approaches were explored. Exposing the anode catalyst layer to hydrogen can be accomplished by hydrogen crossover through the membrane or by a hydrogen purge in the anode line. Relying on hydrogen crossover was not used in this case due to the time required to transport hydrogen through Nafion 117 and complications comparing performance losses with a thinner membrane to previous efforts simulating intermittent operation. 6,23,46 A hydrogen purge to accelerate cell depolarization was also not used due to test stand and laboratory safety features intended to prevent operation with gas mixing (hydrogen in oxygen outlet, oxygen in hydrogen outlet). In this instance, anode catalyst reduction was simulated with a potentiostat cycling the cell voltage between 0 and 2 V. Due to the possible hysteresis between applied potential and catalyst surface/near-surface reduction, loss rates determined by potential cycling may be different than through hydrogen exposure and efforts are currently underway to determine and simulate more realistic shutdowns. This method, however, allowed for a direct comparison to intermittent load experiments and focused on the loss mechanism and how performance losses corresponded to catalyst layer changes.
In the first instance, 0‒2 V voltage cycling was performed with continual water flow to the anode and at one cycle per minute for 31.5 k cycles to match the cycle count and experiment duration of previous efforts evaluating intermittent operation (Fig. 4a). Anode catalyst layer loading (0.1 mgIr cm‒2), spray optimization, and other components (Nafion 117, Pt/Ti PTLs) were kept the same to compare loss rates and evaluate how catalyst redox accelerates performance decreases. 23,46 At 1 A cm‒2, the loss rate when incorporating Ir redox was 5.5 μV cycle‒1, significantly higher than when cycling in the potential range 1.45‒2 V (3.2 μV cycle‒1). 46 As in other efforts, increased overpotential was primarily due to a decline in OER kinetics, and the exchange current density decreased from 703 to 20 nA cm‒2 (Fig. 4b). The decrease in cell kinetics may be due to several processes. Ir mobility and migration into the membrane clearly impacts kinetics through losses in site quantity and may further by reducing site quality. 23 Additionally, changes to catalyst/ionomer/pore distribution throughout the catalyst layer, to interfacial contact with the transport layer, and to interfacial tearing or weaking with the membrane can impact catalyst utilization and cell kinetics. Since the decrease in cell kinetics was gradual and with a relatively consistent rate throughout the test duration (Fig. 4b), Ir dissolution/mobility and other degradation processes likely continued throughout the test duration and were affected by the cycle number. Compared to intermittent or variable operation (1.45‒2 V), kinetics also largely accounted for the increase in the performance loss rate (Fig. 5, green). Ohmic increases, however, had an effect as well (1.2 μV cycle‒1, 0.3 μV cycle‒1 for intermittent), grew disproportionately during simulated redox experiments, and were 21% of the overall overpotential increase (red, 11% for intermittent). 46
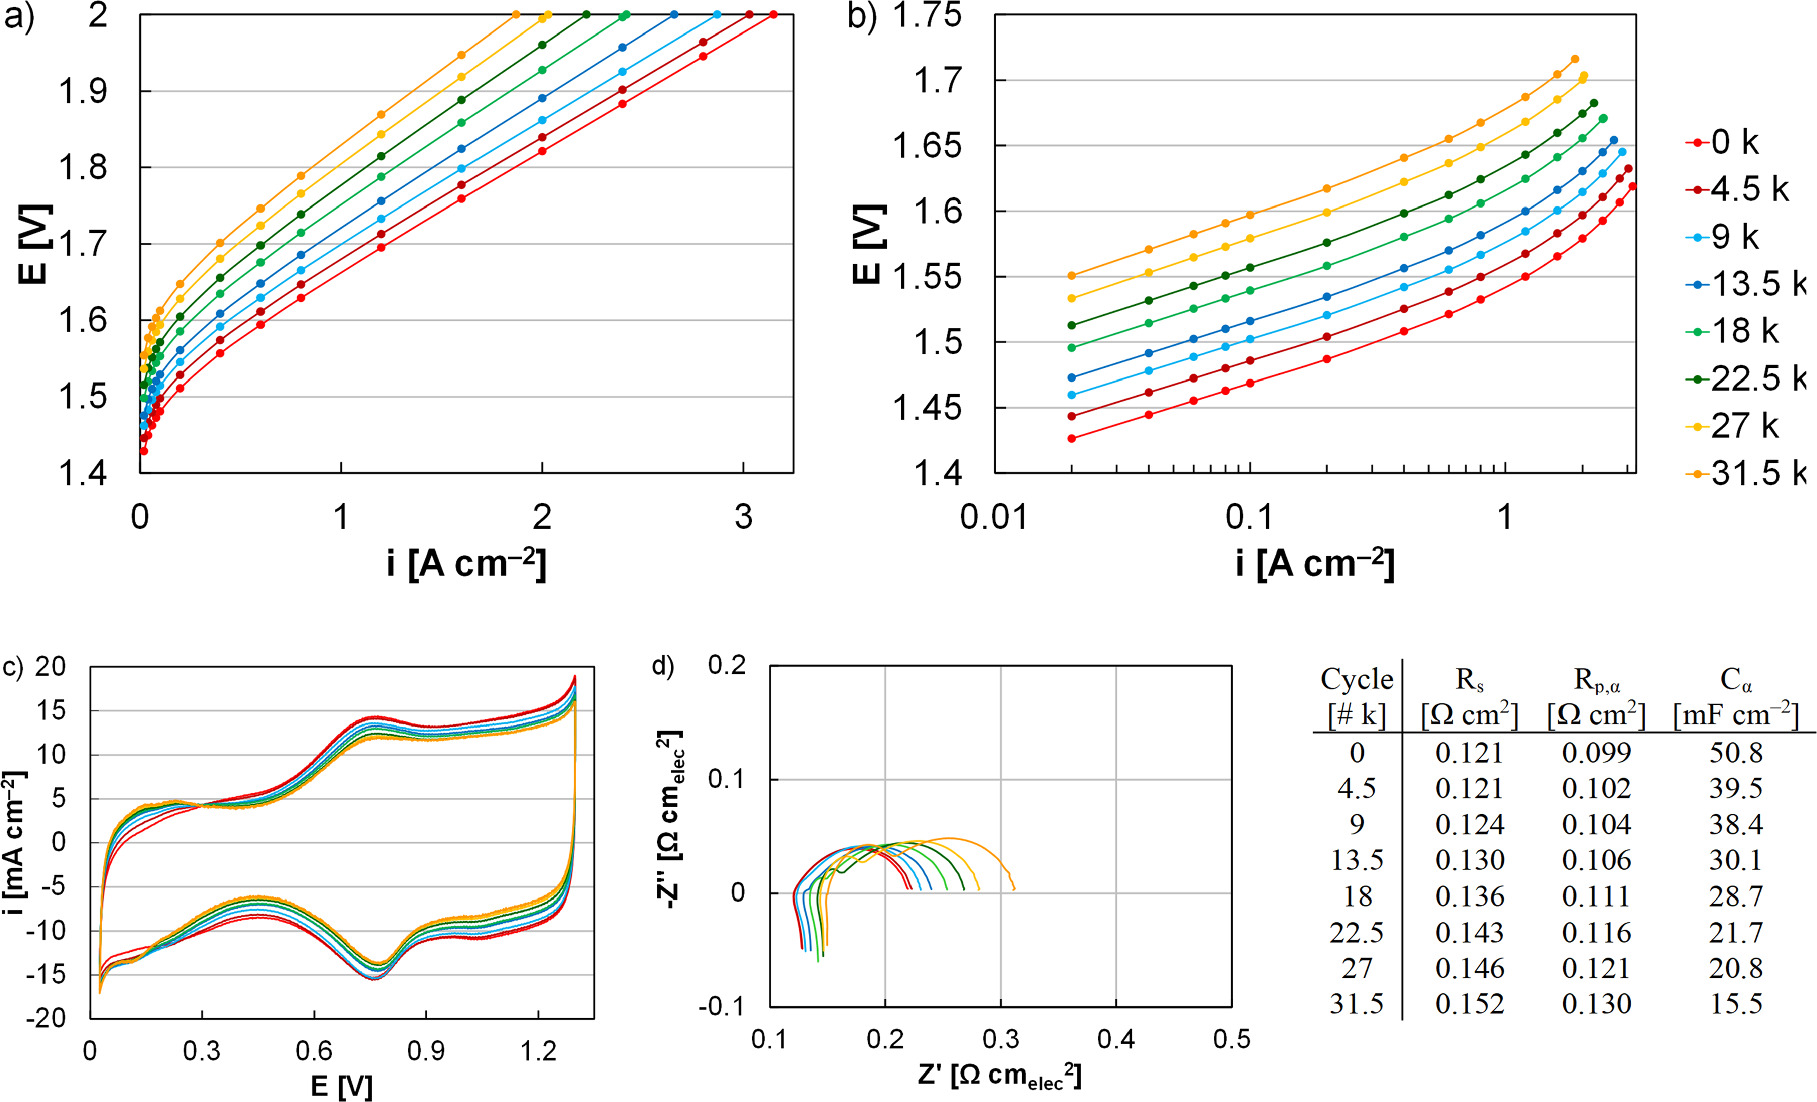
Figure 4. (a) Polarization curves, (b) HFR-corrected Tafel plots, (c) cyclic voltammograms, and (d) impedance spectra of a MEA in durability testing simulating anode catalyst layer redox, 0‒2 V potential cycling (31,500 cycles). Impedance data was taken at 0.2 A cm‒1, fit to a modified Randles cell equivalent circuit model (Fig. 1), and tabulated in subfigure (d).
Download figure:
Standard image High-resolution image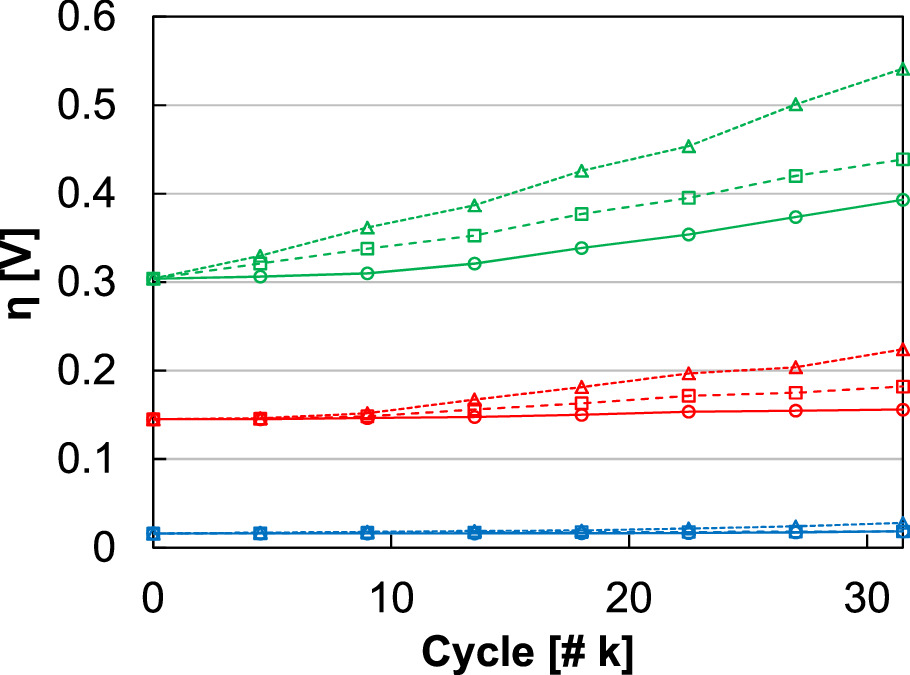
Figure 5. Overpotential changes at 1 A cm‒2 as a function of cycle number and based on ohmic (red), transport (blue), and kinetic (green) losses. Data was included for intermittent operation (1.45‒2 V, circles/solid line), simulated redox with constant water flow at the anode (0‒2 V, squares/dashed line), and simulated redox with periodic water flow at the anode (0‒2 V, triangles/dotted line).
Download figure:
Standard image High-resolution imageIn addition to decreased kinetics driving MEA performance losses, several observations were made through in situ diagnostics. In cyclic voltammograms, a decrease of the capacitive current indicated loss of catalyst, likely due to catalyst migration and isolation. 23,46 Additionally, an increasing current response was found at low potential due to hydrogen underpotential deposition, and likely indicated higher Ir metal content within the anode catalyst layer or increased access to and interaction with the Pt-PTL coating. This change was significantly larger than that observed in past studies that avoided Ir redox transitions. 23,46 Interaction with the Pt-PTL coating can have several detrimental effects, including Pt migration into the catalyst layer lowering anode-OER reactivity, and coating defects/breakthroughs forming and resulting in increasing contact resistance (titanium passivation), lower catalyst utilization, and increased catalyst layer resistances. While Pt migration may have contributed to declining kinetics, PTL coating failure in this instance was less likely since subsequent tests with the PTL produced identical MEA performances. The absence of a PTL failure may have been due to the relatively short experiment duration or a thick PTL coating (commercial PTL); extended operation under similar conditions or PGM-thrifted coatings may result in additional degradation mechanisms and increased performance loss rates. Gradual increases in the HFR were found by impedance spectroscopy, indicating increased ohmic loss. The polarization resistance also grew and was consistent with past efforts correlating higher resistances to lower exchange current densities and higher kinetic loss. 46
Following MEA testing simulating anode catalyst layer redox transitions, periodic stops to the anode water flow were added to evaluate the impact on durability testing. These stops were completed 88 times (4 times per day) and consisted of the simultaneous interruptions of applied potential and a nitrogen purge to the anode and cathode lines. The purge continued for 15 s, after which water flow was resumed along with potential (after roughly 1 min); cell temperature (80 °C) was maintained throughout this process. Once constant water flow was maintained, these experiments were completed to separate that impact on testing. These tests may provide insight into how shutdown modes, particularly the loss of temperature control and hydration, can impact extended operation; they were also partially motivated by past observations that frequent shutdowns added significant variability to durability results.
In this second instance, all other components (Nafion 117, Pt/Ti PTLs), catalyst loading (0.1 mgIr cm‒2), spray optimization, and test conditions (31.5 k cycles, one cycle per min, 0‒2 V) were identical as those described previously to isolate the effects of periodic stops to the anode water flow. 23,46 At 1 A cm‒2, the loss rate increased from 5.5 to 10.4 μV cycle‒1, accounting for significant overpotential increase compared to the simulated redox (1.9 times higher) and intermittent operation (3.3 times higher, Fig. 6a). 46 As in all other cases, the loss and the higher loss rate were primarily due to kinetics, and the exchange current density decreased from 703 to 1 nA cm‒2 (Fig. 6b). Similar to simulated redox, the ohmic losses increased (2.5 μV cycle‒1) and accounted for a larger portion of the overall overpotential increases (24%, Fig. 5). In cyclic voltammograms, decreased capacitive current reflected loss of catalyst surface area and increased hydrogen underpotential deposition likely indicated increased access to the Pt-PTL coating. While the capacitance decrease was qualitatively similar to simulated redox, however, the increased hydrogen underpotential deposition appeared less severe in spite of the higher performance loss rate. Impedance spectra further showed larger increases in the HFR and the polarization resistance, consistent with higher ohmic and kinetic loss. Although not a significant factor in the loss rate, periodic water shutoffs also resulted in higher transport losses (0.4 μV cycle‒1) compared to the simulated redox (0‒2 V, 0.1 μV cycle‒1) and intermittent tests (1.45‒2 V, 0.08 μV cycle‒1). 46 In the impedance spectra (Fig. 6d), increasing polarization resistance was observed that was larger but consistent with simulated intermittent operation profiles and performance losses over time. 23 A change in shape, however, was also observed and appeared to be a kinetic process best modelled by an additional capacitor/resistor element. The additional response was likely not due to catalyst layer resistance and was not consistent with a transmission line since the response size changed with current density. 58 The additional response was also likely not due to the cathode since significant damage was not observed. While it was possible that the severe and heterogeneous anode damage created a distribution of utilization and performance reflected in the impedance spectra, efforts to better understand, analyze, and determine the origin of impedance features are underway.
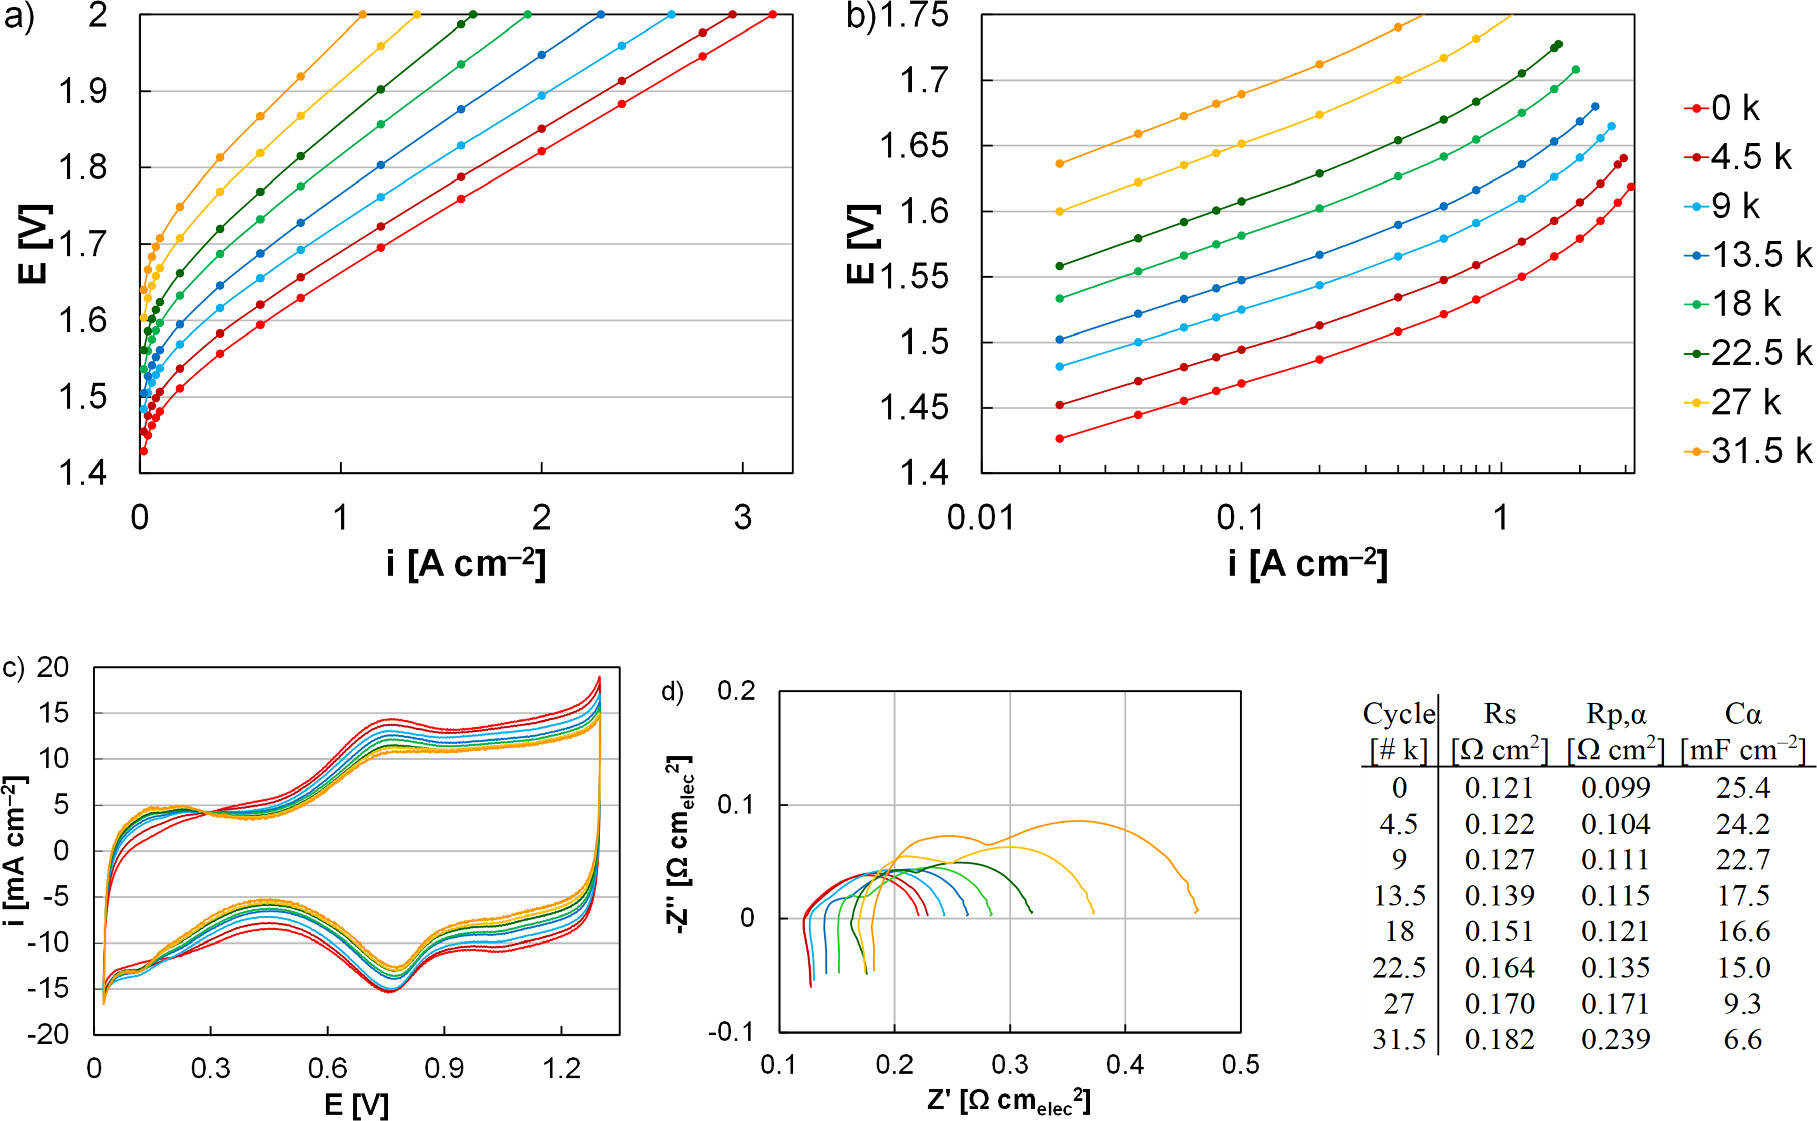
Figure 6. (a) Polarization curves, (b) HFR-corrected Tafel plots, (c) cyclic voltammograms, and (d) impedance spectra of a MEA in durability testing simulating anode catalyst layer redox (0‒2 V) potential cycling (31,500 cycles) with periodic water shutoffs (88 in total). Impedance data was taken at 0.2 A cm‒1, fit to a modified Randles cell equivalent circuit model (Fig. 1), and tabulated in subfigure (d).
Download figure:
Standard image High-resolution imageCross-sectioned MEAs were evaluated using electron microscopy to assess how testing stressed different components and accelerated different processes. For tests that cycled the Ir anode through redox (with or without constant water flow), the physical manifestation of performance losses were generally consistent with past efforts focusing on intermittent or variable loads. 23,46 Ir migration into the membrane was observed for the constant flow case (Fig. 7a), but not for the intermittent water flow case (Fig. 7b). The migration that was observed did not crossover to the cathode or result in bare anode sections (Fig. 8). Periodic weakening or tears at the membrane/catalyst layer interface were also found (Figs. 7c‒7f). While tearing/weaking could have occurred during sample preparation, it tended to occur at the anode (only at the cathode in one instance) and the frequency increased with larger stressors. Operation may also not have resulted in complete tears in situ but may have weakened the interface allowing for tearing during the MEA drying or ultramicrotomy stages of sample preparation. Loss of interfacial contact can lessen kinetics by decreasing utilization of the catalyst layer, increase ohmic losses by adding contact resistances, and increase catalyst layer resistances by lessening ionic pathways. For tests with the repeated water shutoffs, an increased frequency of interfacial tearing and delamination was observed. Bubble formation may cause mechanical degradation particularly at the catalyst/membrane interface due to the high catalyst site utilization, and it was possible that loss of temperature/hydration made the catalyst/membrane interface more susceptible to bubble formation damage. For these MEAs, however, the total gas generation rates were similar but less than the constant water flow due to a higher loss rate and lower average current densities, which may have slightly lessened this impact.
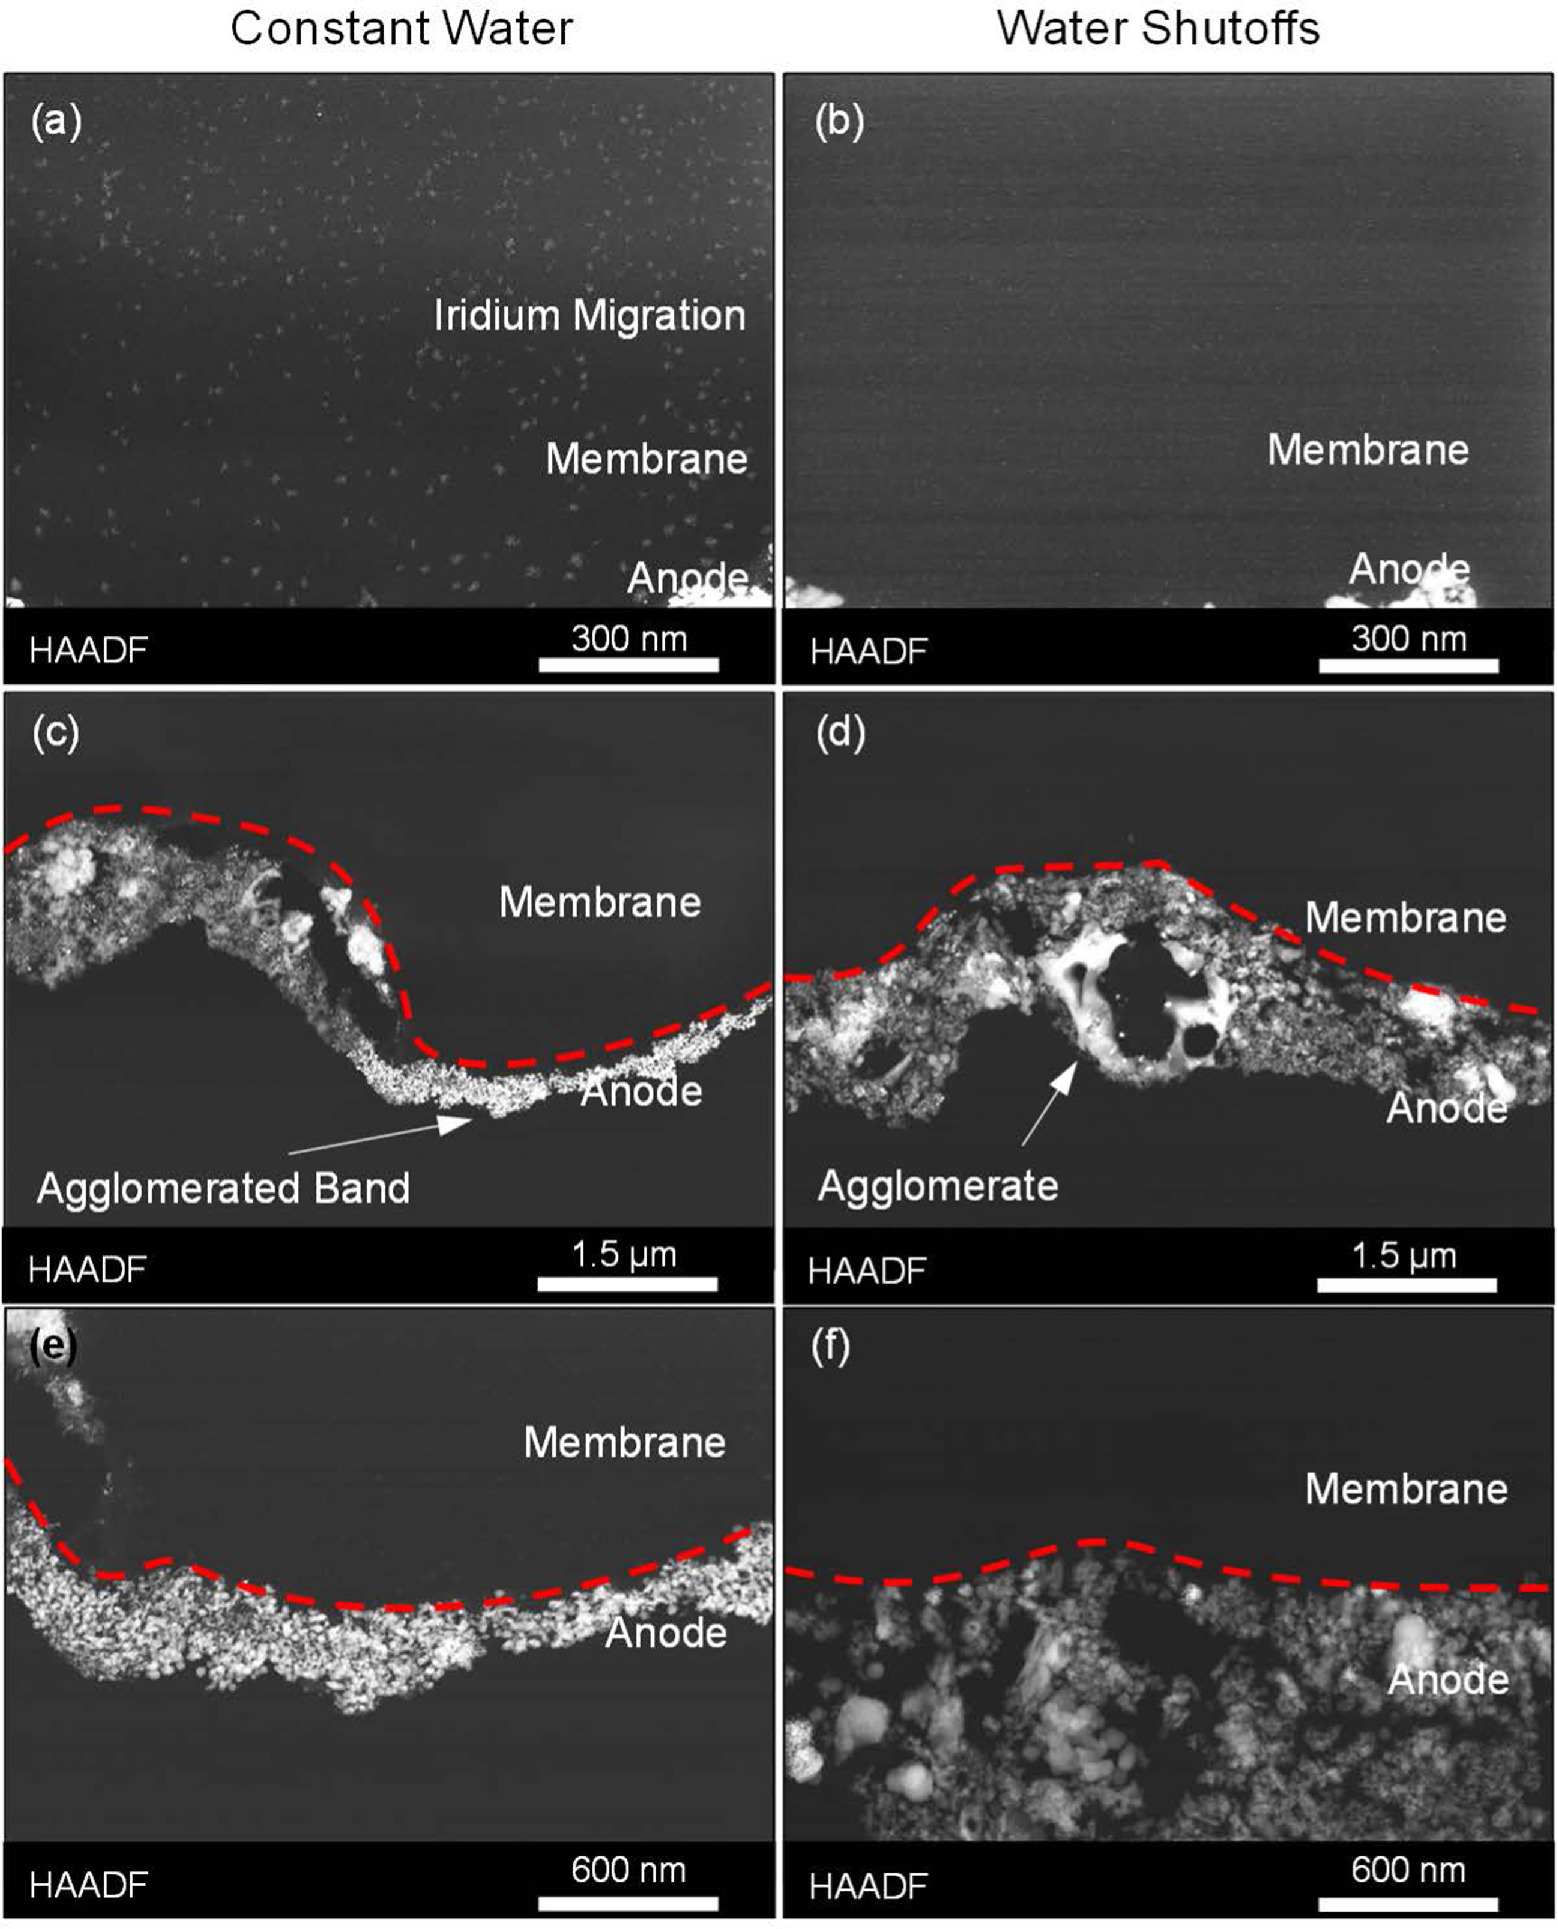
Figure 7. HAADF-STEM images of cross-sectioned MEAs with simulated Ir redox (0‒2 V) with (left column) a constant water flow and (right column) periodic water shutoffs. The images focused on evaluating (a), (b) Ir anode migration into the membrane, (c), (d) interfacial (membrane/anode catalyst layer) tearing, and (e), (f) anode catalyst layer changes.
Download figure:
Standard image High-resolution image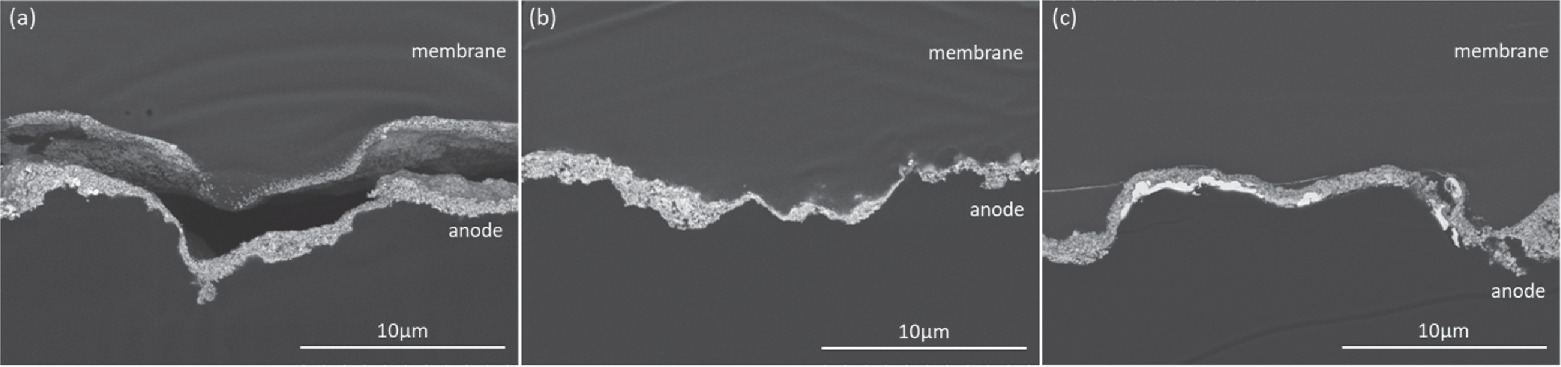
Figure 8. Backscattered electron images of cross-sectioned MEAs cycled for (a) intermittent load (1.45‒2 V), (b) Ir redox (0‒2 V) with constant water flow and (c) Ir redox (0‒2 V) periodic water shutoffs.
Download figure:
Standard image High-resolution imageCycling through Ir redox appeared to qualitatively result in a higher frequency of interfacial tearing which may contribute to increases in kinetic (catalyst isolation) and ohmic (contact resistance) losses. On occasion, these tears occurred within the catalyst layer (as opposed to the interface) and an instance is demonstrated in Fig. 7d where an Ir agglomerate appeared fall out of the catalyst layer during sample preparation. Additionally, cycling through redox clearly resulted in catalyst layer changes, including Ir agglomeration (heterogeneous) and the formation of thinner and denser catalyst layers (bright band, Figs. 7c, 7e, denoted with arrow in Fig. 7c), which is a significant deviation from what was observed in past experiments with intermittent loads. 23,46 This change was more apparent when contact at the membrane/catalyst layer interface was maintained and interfacial tearing may prevent further changes by isolating portions of the catalyst layer.
In addition to expected degradation processes, evidence of several others was observed. For the simulated redox with both constant and periodic water flow, instances of Pt were found in the anode catalyst layer and likely migrated from the PTL coating (Figs. 9a, 9b). This was consistent with hydrogen underpotential deposition responses in cyclic voltammograms and indicated that catalyst layer changes (thinning, agglomeration, lower porosity) enabled site-access to the PTL coating. It was also possible that periodic water shutoffs resulted in a higher frequency of tearing (interfacial or within the catalyst layer) or membrane dehydration that limited anode access and anode catalyst layer agglomeration/thinning, while increasing kinetic and ohmic losses by isolating portions of the catalyst layer (lower utilization) and adding contact resistances. Small changes were generally observed in the cathode of the MEA with constant water flow. Some observed interfacial tearing may have been due to the larger potential variability reversing operation (Pt redox transitions, carbon corrosion) and periodic fluctuations in hydration (cathode nitrogen purge) or temperature causing catalyst layer delamination.
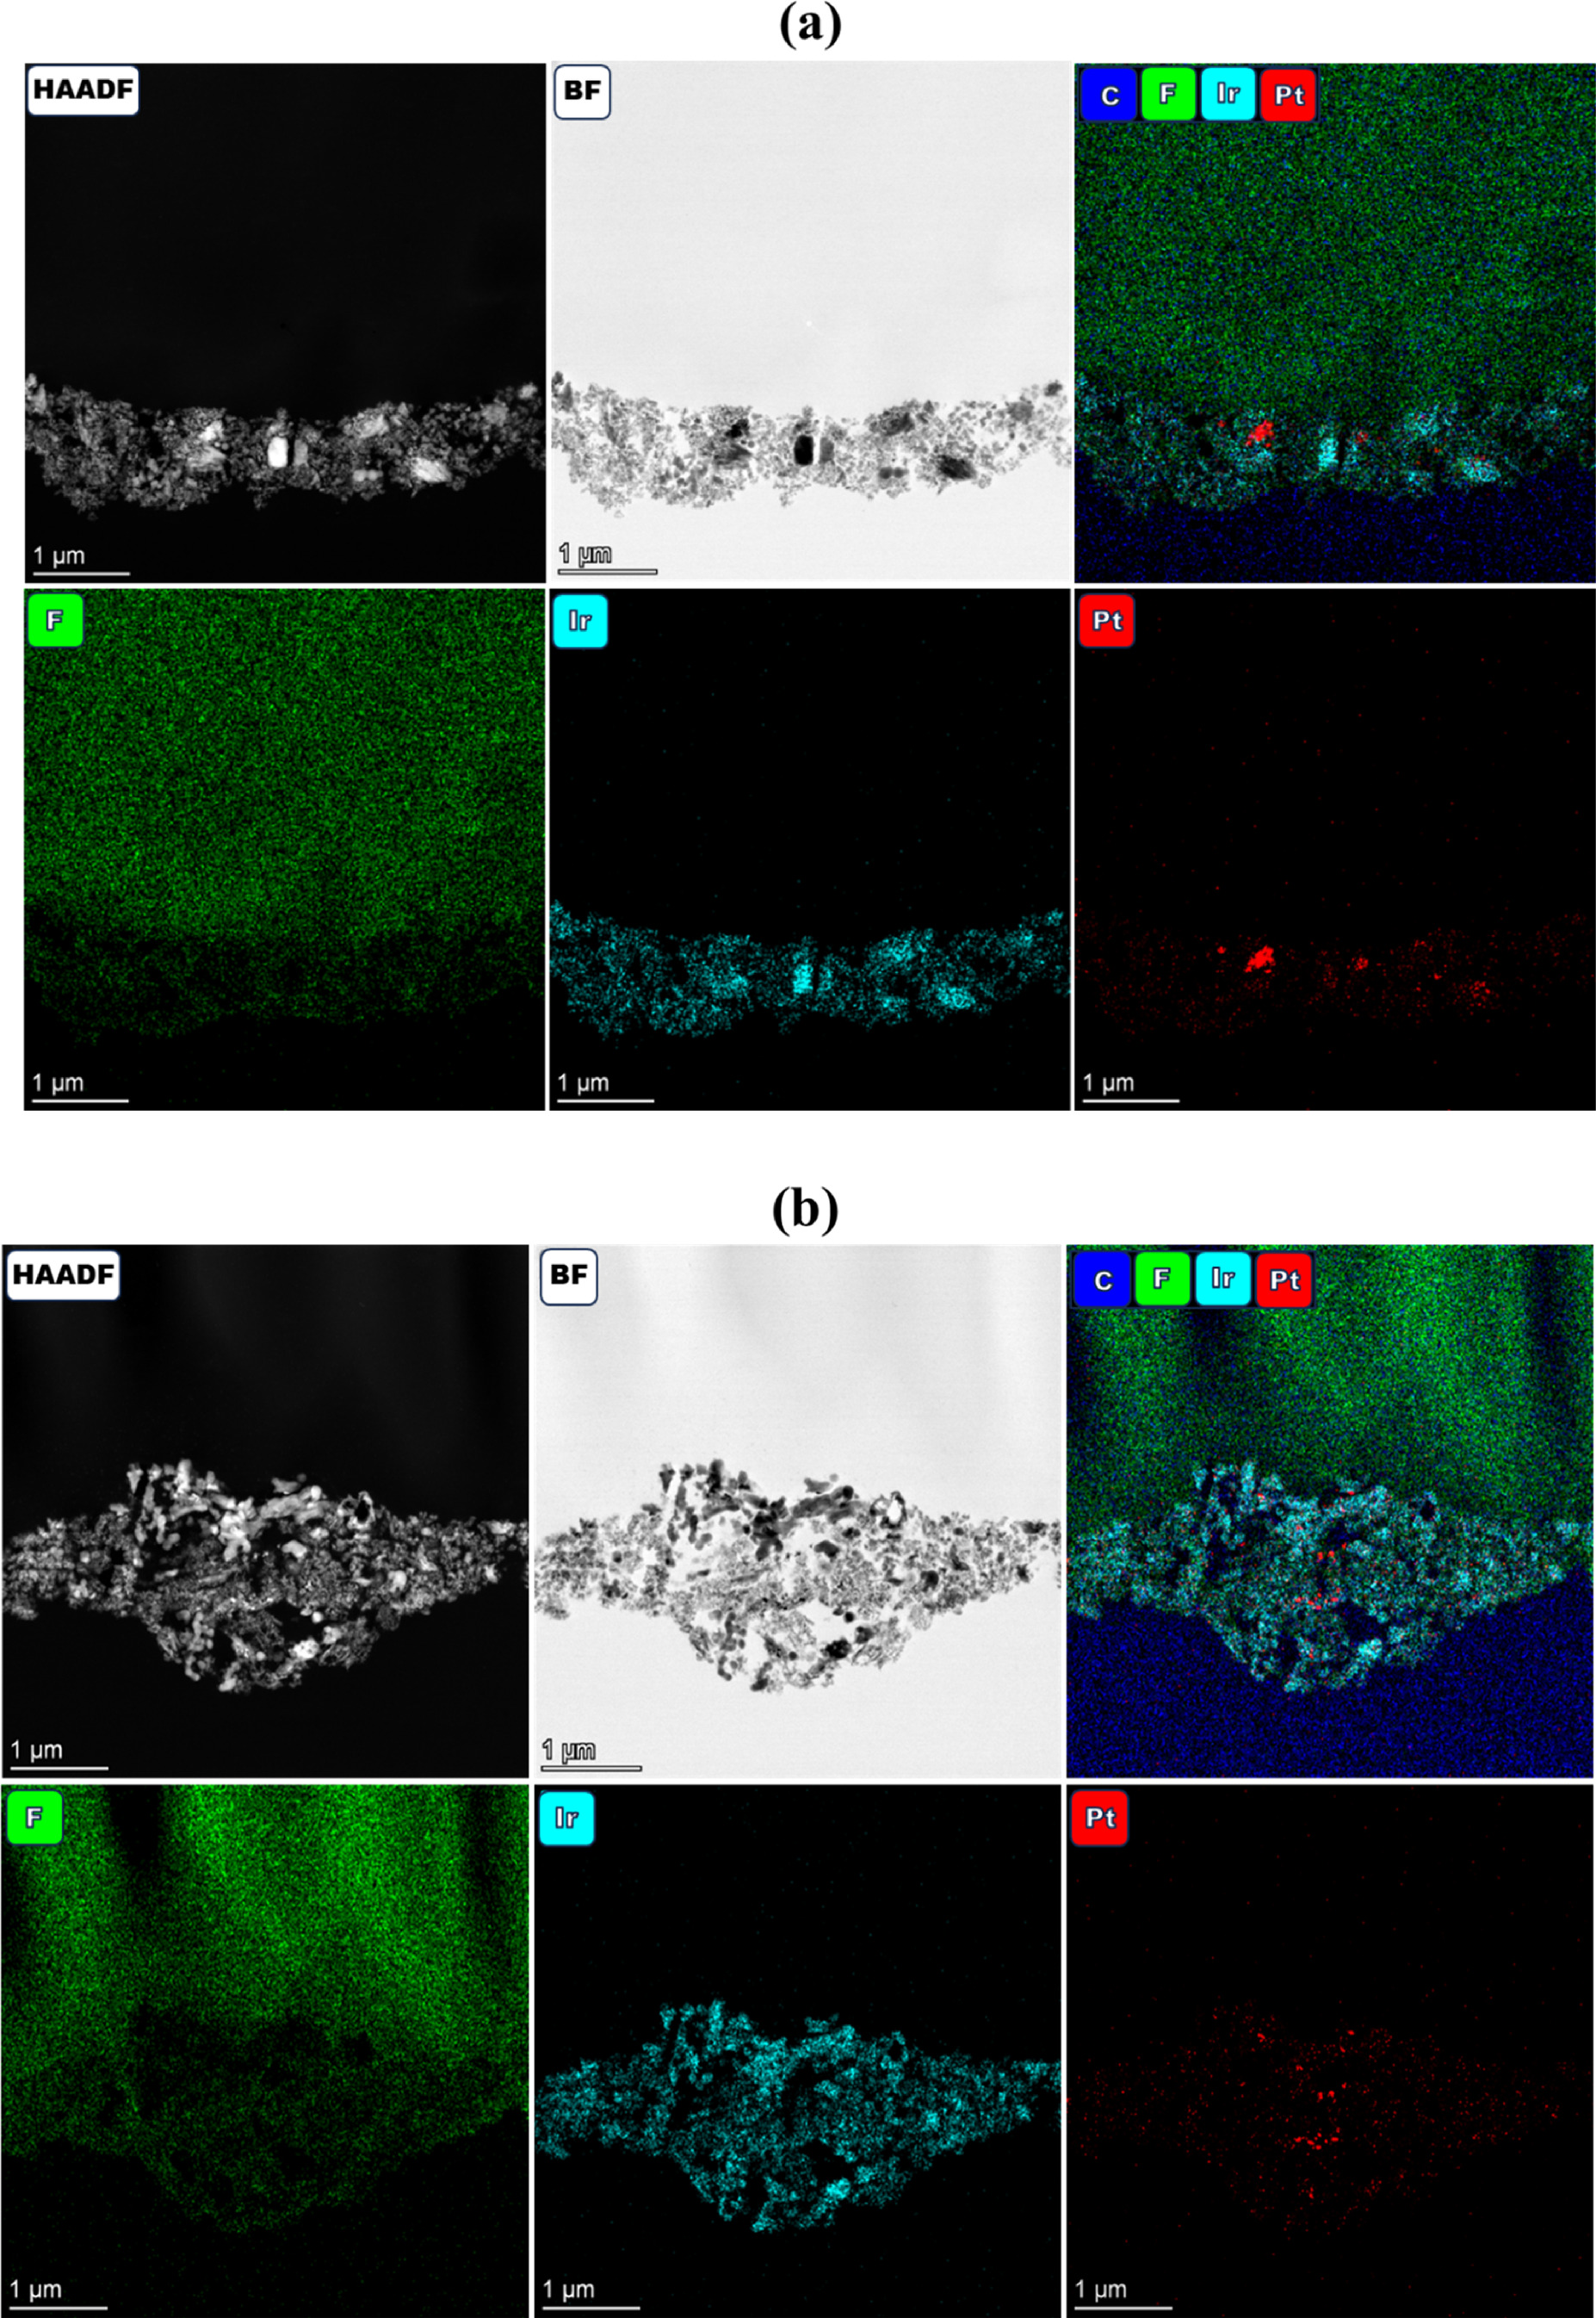
Figure 9. HAADF/BF-STEM and EDS spectrum images (Ir, F, Pt) of cross-sectioned MEAs cycled for (a) simulated Ir redox (0‒2 V) with a constant water flow and (b) simulated Ir redox (0‒2 V) with periodic water shutoffs.
Download figure:
Standard image High-resolution imageX-ray scattering characterization was performed on the two anodes removed from the membranes of the cells cycled with constant water flow and with periodic water shutoffs. The X-ray scattering intensity for the two anodes as a function of q is shown in Fig. 10a, as well as the X-ray scattering for the Alfa Aesar IrO2 catalyst powder. The anode scattering profiles show two distinct scattering peaks in the 0.04 to 0.2 Å−1 and 0.0004 to 0.04 Å−1 regions, which can be attributed to scattering from ionomer aggregates and IrO2 aggregates/agglomerates, respectively, based on comparison with the scattering profile of the catalyst powder, which lacks the former peak. The scattering profiles were fit in the 0.0004 to 0.04 Å−1 region using the Maximum entropy method and assuming spherical particles to obtain particle volume distribution functions (Fig. 10b). The particle volume distribution functions show that the cycled anodes are comprised of larger particles than the powder, that the 0 to 2 V cycled anode with periodic stops and limited water supply contains a larger fraction of particles with diameters >100 nm and a larger mean diameter of the bimodal peaks in the 5 to 50 nm diameter region than the continuously cycled anode with no interruption of water supply. The mass-specific surface areas for these two samples were calculated from the particle volume distribution functions by assuming spherical particles and a density of 11.66 g cm‒3, the density of Ir oxide, as shown in Fig. 10c. These calculations are consistent with the periodic interruption of water flow and cycling causing a greater loss of surface area than the continuous flow of water during 0 to 2 V cycling. It should be noted that the X-ray scattering measurements do not reflect differences in catalyst mass remaining in the anode for these two MEAs, do not capture Ir that has migrated into the membrane, and that the scattering is not metal-specific (i.e., Pt particles will contribute to the scattering).
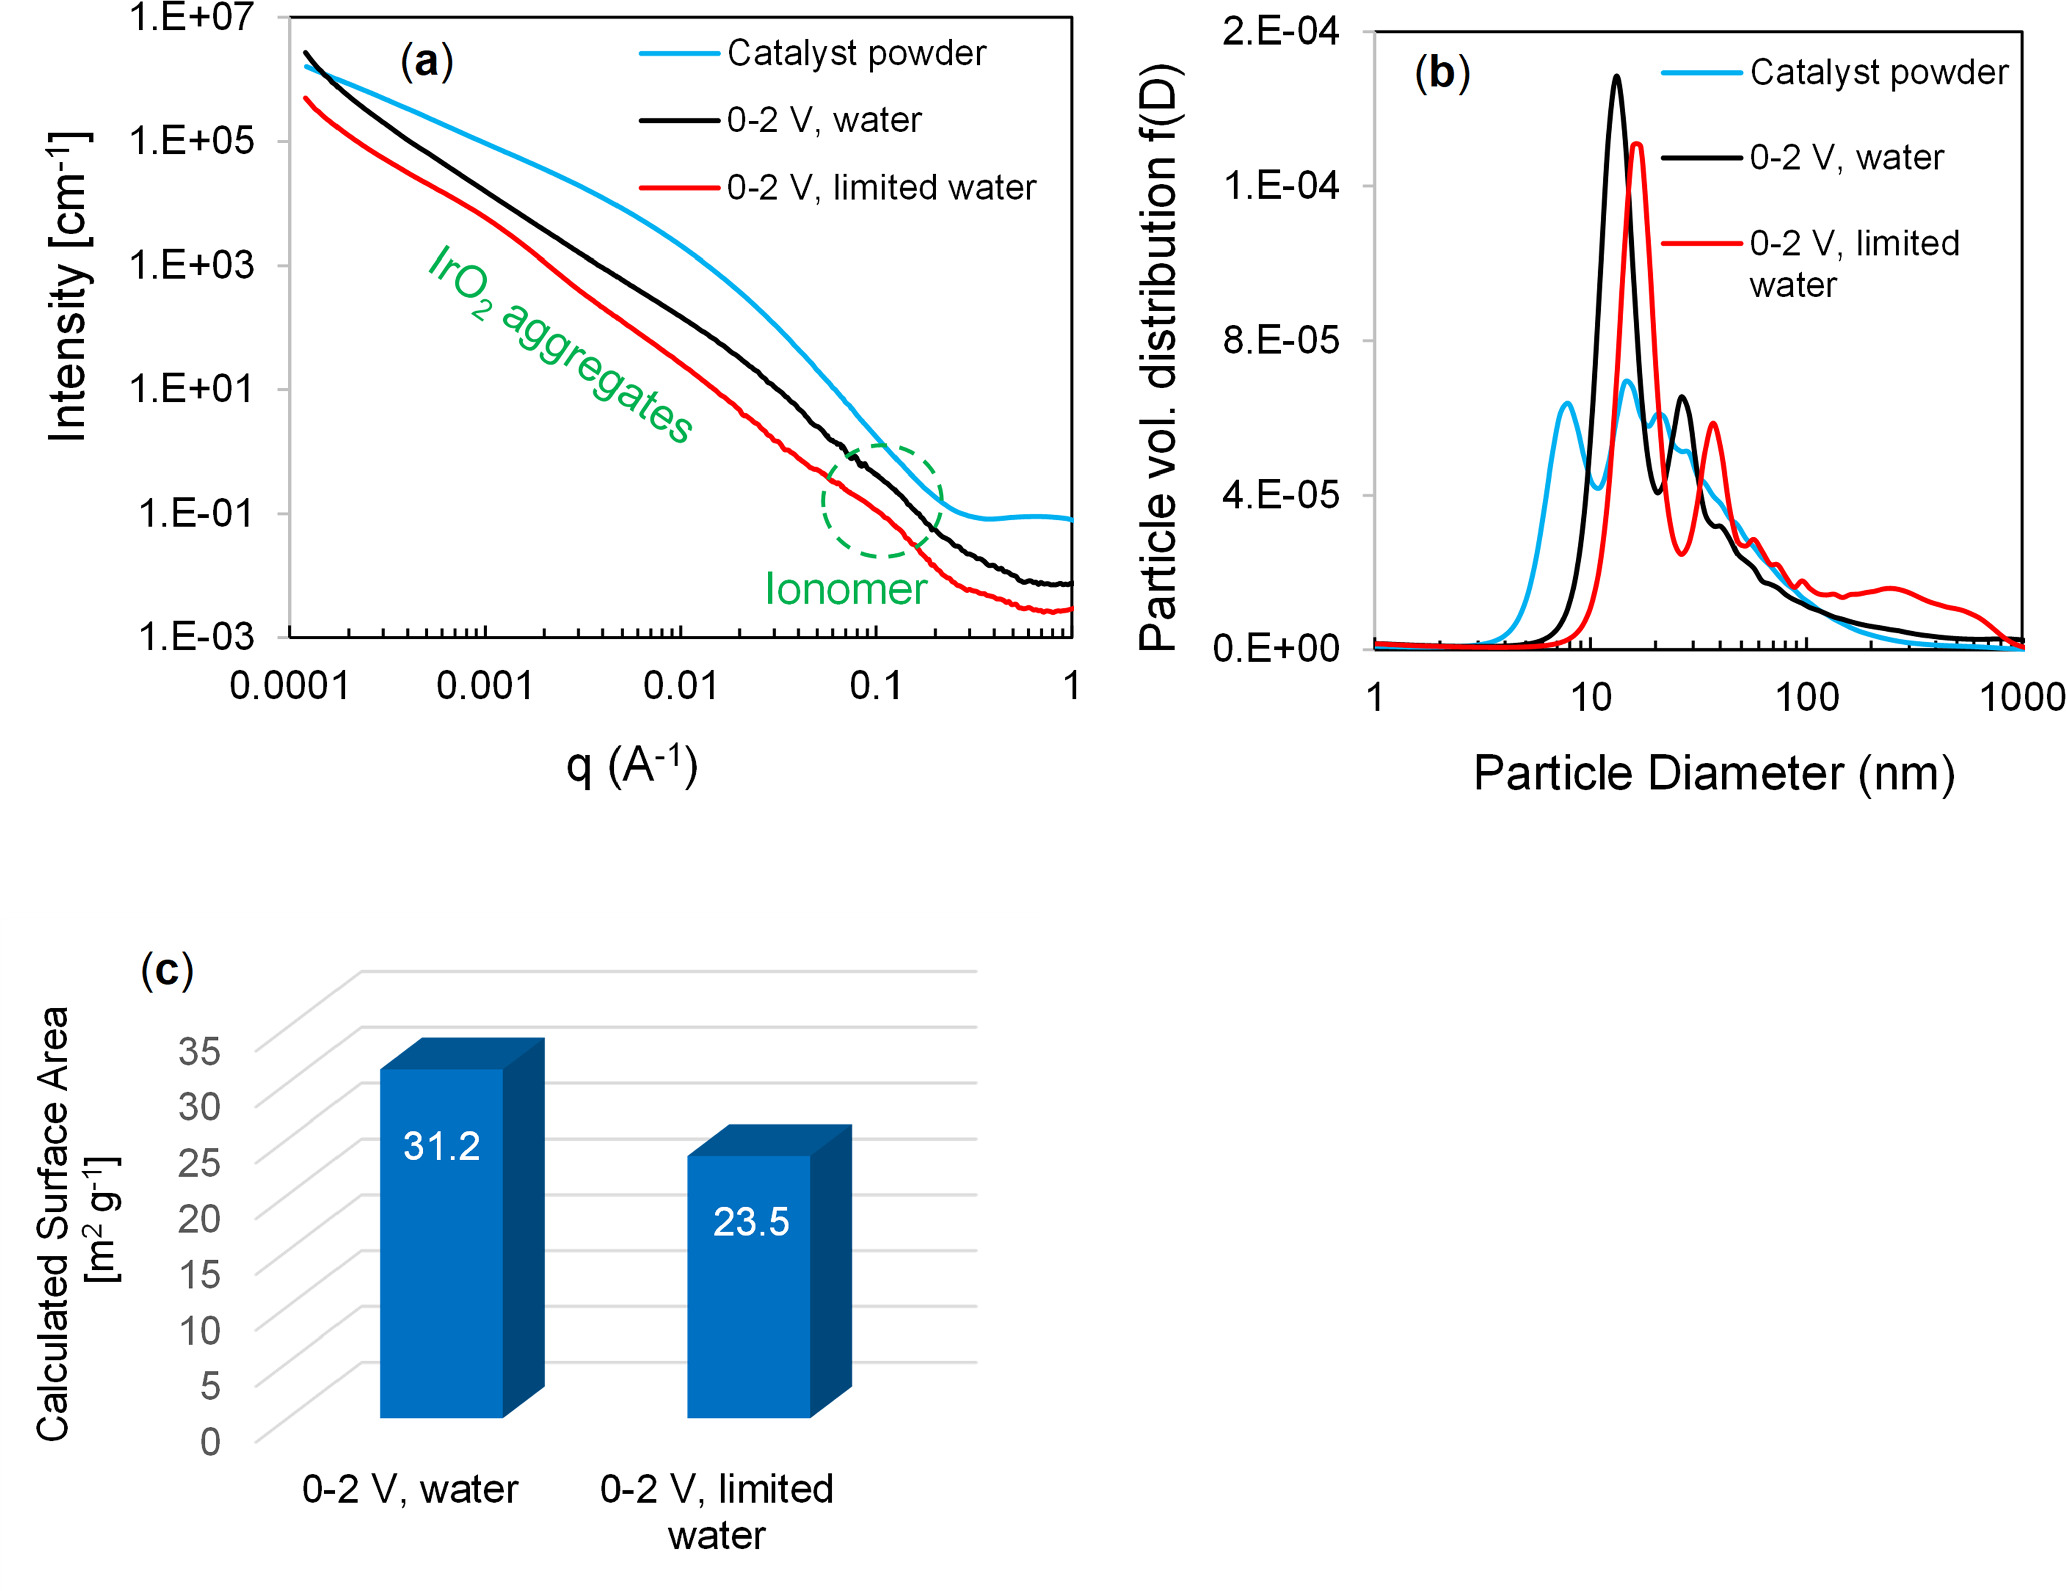
Figure 10. (a) X-ray scattering profiles for the cycled anodes and Alfa Aesar IrO2 powder, (b) Particle volume distribution functions derived from X-ray scattering data fit, and (c) Particle mass-specific surface areas for the two electrodes calculated from the particle volume distribution functions.
Download figure:
Standard image High-resolution imageThe extent of oxidation of Ir in the 0 to 2 V cycled MEAs was determined using Ir L2 edge X-ray absorption spectroscopy. The near-edge region of the spectra (XANES) and the Fourier transform of the extended region are shown in Fig. 11 for the three anodes and for two standards: Ir metal (Johnson Matthey Ir, C2026/160000) and IrO2 (TKK Ir oxide, US171109). These two catalysts were chosen as metal and IrO2 standards based on their phase purity, as determined previously using X-ray diffraction and wide-angle X-ray scattering. 6,14 The higher "white line" in the XANES region and the larger peak at ∼1.5 Å in the Fourier transform, which can be attributed to Ir-O scattering, indicate that the Ir in the 0–2 V cycled MEA without interruption of the water flow was more oxidized than the Ir in the 0–2 V cycled MEA with interruption of water flow. Linear combination fitting of the XANES regions of these two spectra to those of the two Ir standards was also utilized to determine the extent of Ir oxidation. The linear combination fitting results for the anode samples supports the observations based on the height of the "white line" and the Fourier transforms: 97% Ir oxide, 3% Ir metal for the MEA cycled without water interruption and 90% Ir oxide and 10% Ir metal for the MEA cycled with periodic interruption of water flow.
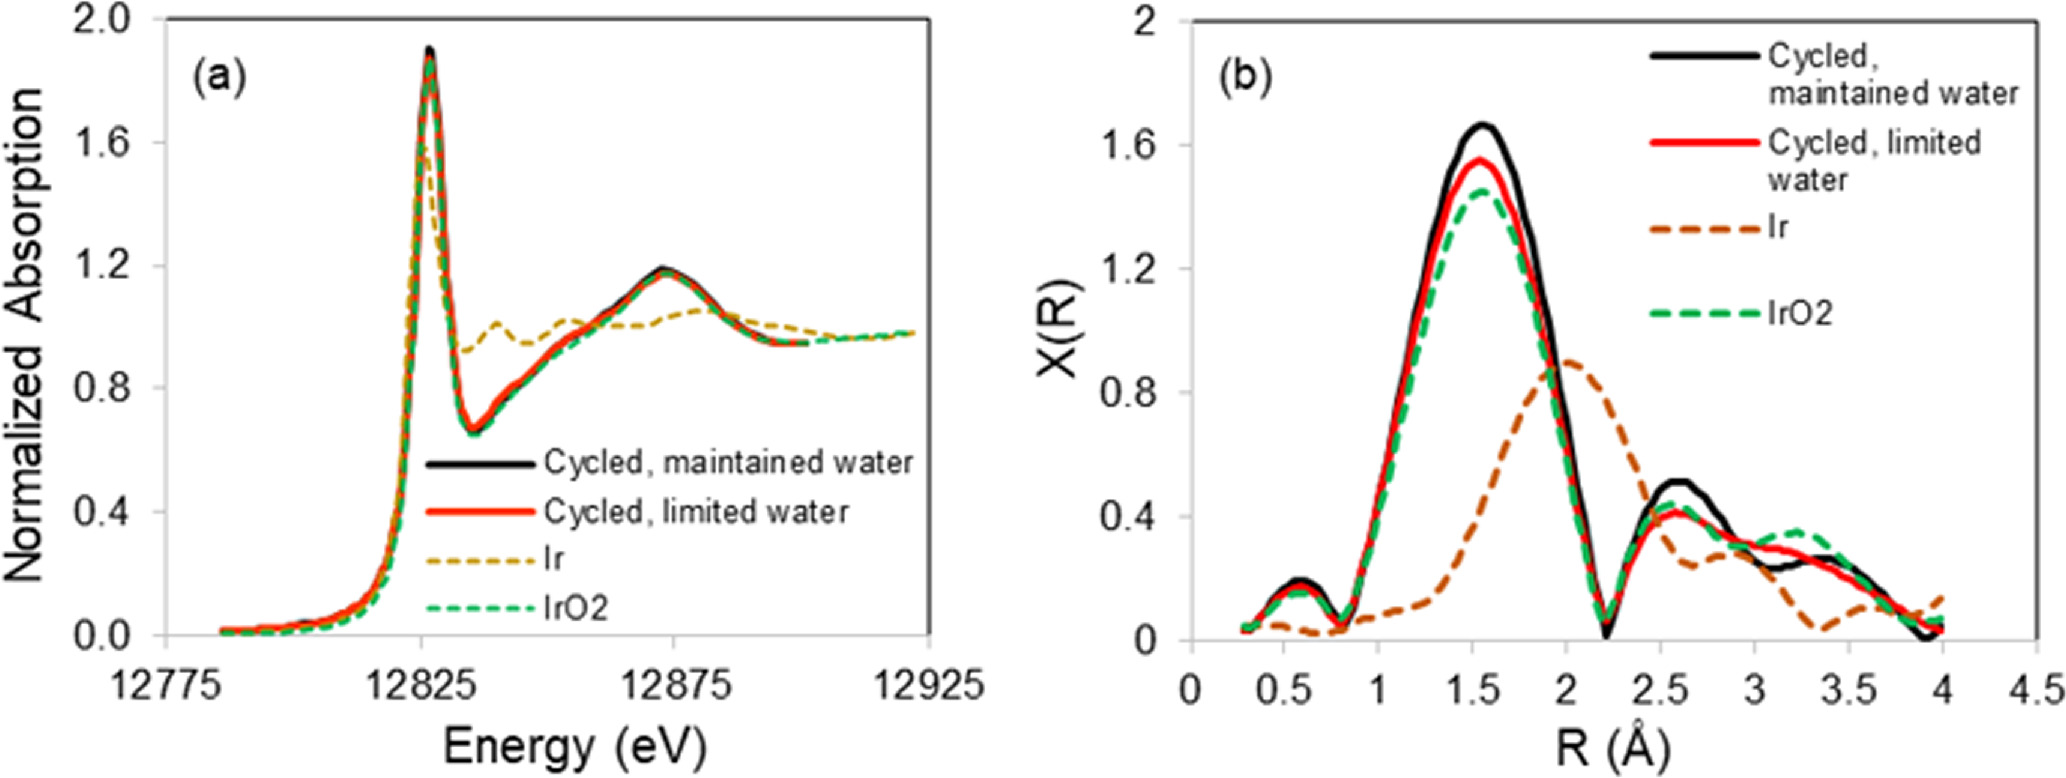
Figure 11. (a) X-ray absorption near edge region of the Ir L2 edge (inset: enlargement of "white line" region), and (b) Fourier transform of the Ir L2 extended X-ray absorption spectra of the anodes of the 0 to 2 V square-wave cycled MEAs with and without interruption of water flow during cycling. The X-ray absorption data for Ir metal and IrO2 are shown for reference.
Download figure:
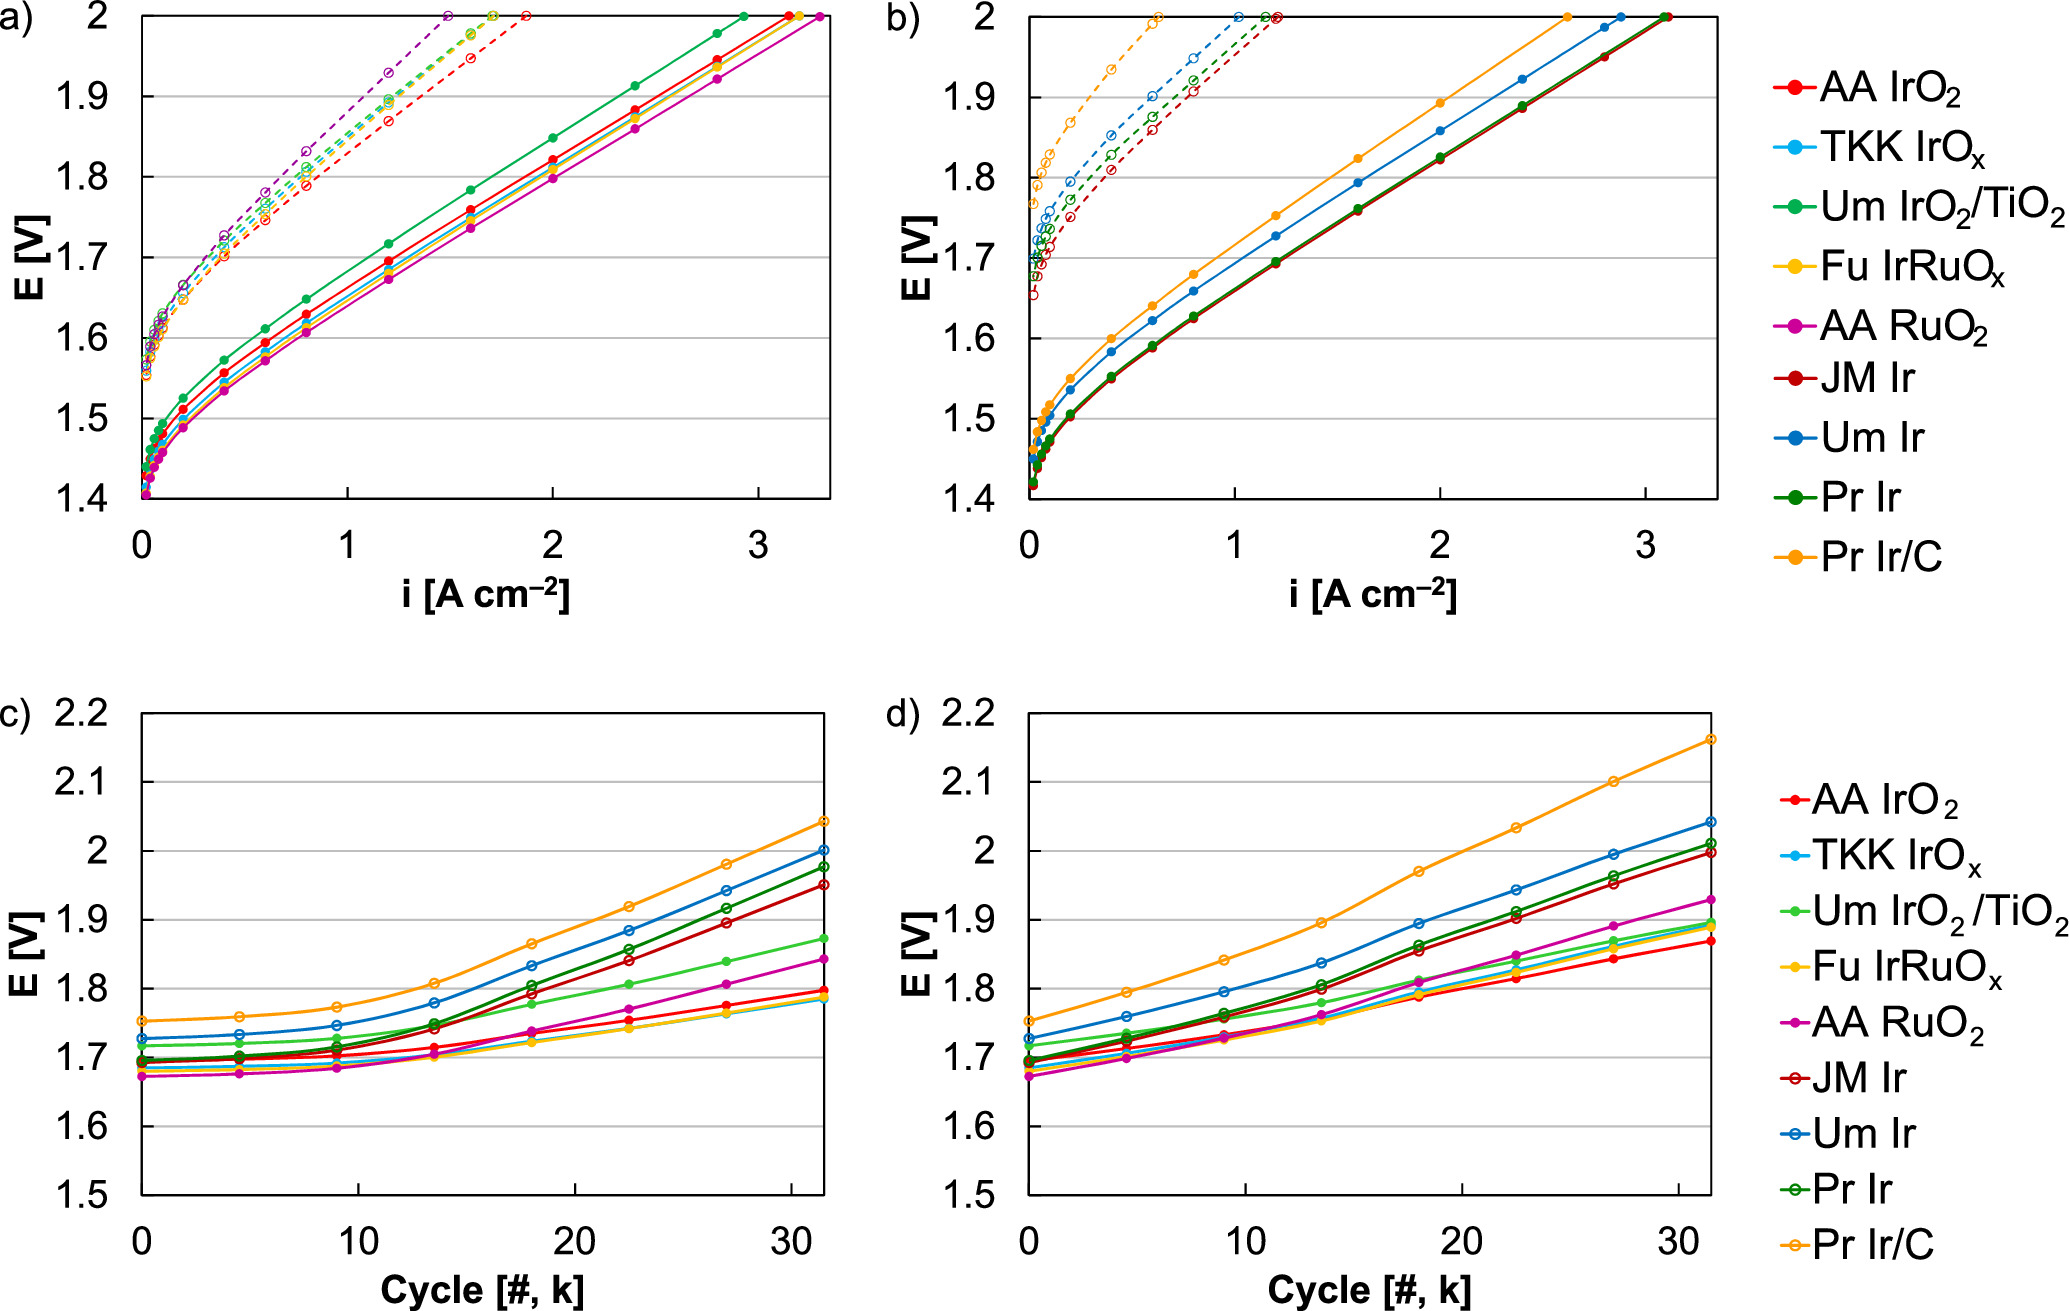
Standard image High-resolution imageBeyond Ir oxide, several catalysts were screened by cycling through redox (0‒2 V) with constant water flow. When focusing on intermittent operation (1.45‒2 V), catalysts other than Ir oxide tended to exhibit larger losses due to the higher dissolution kinetics of other elements (Ru) and sub-stoichiometric oxides. 6,12,14 In this case, different catalysts were evaluated since redox cycling may neutralize differences in near-surface oxide content and more metallic catalysts may provide a benefit (slightly higher performance, comparable durability with redox transitions). In MEA testing, performances are presented initially and following durability testing (31.5 k cycles, 0‒2 V), and were segregated into materials that were more oxides (Fig. 12a and more metals (Fig. 12b). Since many of these catalysts were not exclusively metal/oxide, separation was based on qualitative ex situ differences in hydrogen underpotential deposition and capacitance responses. 14 Within individual material sets, the differences in durability were expected and included higher loss rates for Ru (Ir-Ru and Ru higher than Ir, Fig. 12a) and the carbon supported catalyst (Fig. 12b). When comparing the metal/oxide material sets, however, more metallic catalysts (hydrogen underpotential deposition participation ex situ) tended to produce larger in situ performance losses, and higher loss rates may be due to subsurface metal accelerating dissolution once cycling to low potential reduced the surface/near-surface. 14 This may also have contributed to ordering within the oxide set, where the mixed metal/oxide ex situ composition of TKK IrOx produced larger performance losses than Alfa Aesar Ir oxide. 14 Initially, several catalysts outperformed the Alfa Aesar Ir oxide, including TKK IrOx, Furuya IrRuOx, and Alfa Aesar Ru oxide. During intermittent operation ASTs (1.45‒2 V) these performance gaps narrowed, but both TKK IrOx and Furuya IrRuOx demonstrated a slightly lower overpotential following 31.5 k cycles (9‒10 mV at 1 A cm‒2, Fig. 12c). 6 Following cycling through catalyst redox, however, the overall loss rate and the loss rate relative to Ir oxide (Alfa Aesar) was higher for each of the evaluated catalysts; this included TKK IrOx and Furuya IrRuOx where the overpotential at 1 A cm‒2 for was 23 and 20 mV higher than Alfa Aesar Ir oxide, respectively (Fig. 12d).
Figure 12. (a) Polarization curves of more oxidized anode catalysts before (solid) and after redox cycling (31.5 k cycles, 0‒2 V, dashed), including Alfa Aesar Ir oxide (AA IrO2), TKK Ir (TKK IrOx), Umicore Ir oxide supported on titania (Um IrO2/TiO2), Furuya Ir-Ru (Fu IrRuOx), and Alfa Aesar Ru oxide (RuO2). (b) Polarization curves of more metallic anode catalysts before (solid) and after redox cycling (31.5 k cycles, 0‒2 V, dashed), including Johnson Matthey Ir (JM Ir), Umicore Ir (Um Ir), Premetek Ir (Pr Ir), and Premetek carbon-supported Ir (Pr Ir/C). Cell voltage at 1 A cm‒2 as a function of cycle count for (c) intermittent operation (1.45‒2 V) and (d) when including redox transitions (0‒2 V, constant water flow).
Download figure:
Standard image High-resolution image
Conclusions
This study examines loss mechanisms associated with catalyst layer degradation, focusing on the higher performance losses from catalyst redox transitions when simulating start-stop operation. These tests required low catalyst loading, frequent cycling, and high peak load to accelerate degradation and reduce experiment duration. Compared to intermittent or variable load, repeated redox transitions significantly accelerated loss, from 3.2 to 5.5 μV cycle‒1.
For this stressor, ex situ results suggest that higher losses were due to Ir near-surface reduction and the higher dissolution kinetics of Ir metal once operation at electrolyzer-relevant potential resumed. A similar process was observed in situ, where the anode catalyst migrated into the membrane and the cyclic voltammogram capacitance thinned during device-level testing. Several other processes, however, appeared as well and likely increased performance losses. First, catalyst layer changes were found, including Ir agglomeration and the formation of thinner and denser (less porous) anode catalyst layers, likely due to Ir dissolution and redeposition. Second, interfacial tearing and the membrane/anode catalyst layer interface occurred and likely increased ohmic loss by adding contract resistances and kinetic loss by isolating portions of the catalyst layer. Third, Pt from the PTL coating was found in the anode catalyst layer that may additionally affect kinetics by a lower intrinsic activity for OER. With periodic water shutoffs, accelerated loss was also found that may have been caused by interfacial tearing (anode, cathode) due to catalyst layer delamination (dehydration, temperature, local potential) and greater extents of particle growth and concomitant loss in electrochemically-active surface area. The periodic water shutoffs also caused a slightly lower extent of oxidation of the IrO2 during redox cycling versus cycling with continuous water flow.
Different catalysts were also evaluated since redox cycling may minimize differences in near-surface oxide content and performance losses over time. In MEA testing, losses for all tested catalysts occurred in similar ways (primarily kinetics, secondarily ohmic), although different degrees of catalyst migration and agglomeration were observed following testing. Catalysts that contained Ru or higher amounts of Ir metal also saw larger performance decreases, consistent with higher dissolution rates and literature expectations.
These results demonstrate a significant increase in durability losses when simulating start-stop operation, well beyond the performance losses associated with low catalyst loading and load input fluctuations. Mitigating this process, through either materials (recombination layers) or operational (backpressure release, battery) strategies, is therefore critical to maintain electrolyzer lifetime. Additional efforts are needed to understand the full extent of variables in operational stops and how those variables further impact electrolysis durability. Studies evaluating the degradation mechanisms and developing component and device-based stress tests are needed, particularly as electrolysis addresses variable power inputs and lower production costs. Improving our understanding of electrolyzer degradation is critical to reducing electrolyzer cost and increasing electrolyzer lifetime.
Acknowledgments
This work was authored by the National Renewable Energy Laboratory, operated by Alliance for Sustainable Energy, LLC, for the U.S. Department of Energy (DOE) under Contract No. DE-AC36–08GO28308. Funding provided by U.S. Department of Energy Office of Energy Efficiency and Renewable Energy, Hydrogen and Fuel Cell Technologies Office through H2@Scale and the H2NEW Consortium. Electron microscopy research was supported by the Center for Nanophase Materials Sciences (CNMS), which is a U.S. Department of Energy, Office of Science User Facility at Oak Ridge National Laboratory. The Talos F200X S/TEM tool was provided by U.S. DOE, Office of Nuclear Energy, Fuel Cycle R&D Program, and the Nuclear Science User Facilities. The X-ray absorption (MRCAT, 10-BM and 10-ID) and scattering (XSD, 9-ID-C) experiments were performed at the Advanced Photon Source (APS), a DOE Office of Science User Facility operated for the DOE Office of Science by Argonne National Laboratory under Contract No. DE-AC02–06CH11357. The operation of MRCAT at the APS is supported by DOE and the MRCAT member institutions. The authors would like to thank Jan Ilavsky and Ivan Kuzmenko of the APS, 9-ID-C.
The views expressed in the article do not necessarily represent the views of the DOE or the U.S. Government. The U.S. Government retains and the publisher, by accepting the article for publication, acknowledges that the U.S. Government retains a nonexclusive, paid-up, irrevocable, worldwide license to publish or reproduce the published form of this work, or allow others to do so, for U.S. Government purposes.