
Abstract
Photoelectrochemical (PEC) CO2 reduction (PEC CO2R) is a prospective approach for utilizing solar energy to synthesize a variety of carbon-containing chemicals and fuels, the most valuable of which are multicarbon (C2+) products, such as ethylene and ethanol. While these products can be produced with high faradaic efficiency using Cu, this occurs over a relatively narrow potential range, which, in turn, imposes constraints on the design of a device for PEC CO2R. Herein, we used continuum-scale modeling to simulate the solar-to-C2+ (STC2+) efficiency of PEC CO2R devices fed with CO2-saturated, 0.1 M CsHCO3. We then explored how cell architecture and the use of single or dual photoelectrode(s) alters the optimal combination of photoelectrode bandgaps for high STC2+ efficiency. Ultimately, this work provides guidance for the co-design of the device architecture and photoelectrode bandgaps required to achieve high STC2+ efficiency. The insights gained are then used to identify systems that yield the highest amount of C2+ products throughout the day and year.
Highlights
Photoelectrochemical CO2 reduction to multicarbon products with high efficiency.
Co-design of photoelectrochemical CO2 reduction devices for multicarbon product generation.
Optimal semiconductor bandgaps for high multicarbon product selectivity.
Limitations in multicarbon product generation from photoelectrochemical CO2 reduction.
Optimizing photoelectrochemical CO2 reduction systems for multicarbon product generation.
Export citation and abstract BibTeX RIS

This is an open access article distributed under the terms of the Creative Commons Attribution 4.0 License (CC BY, http://creativecommons.org/licenses/by/4.0/), which permits unrestricted reuse of the work in any medium, provided the original work is properly cited.
Solar-driven CO2 reduction (CO2R) holds great promise for the sustainable generation of energy-dense fuels and chemicals. 1,2 Multicarbon (C2+) products (e.g., ethylene, ethanol, propanol) are particularly attractive because they have a large market size and can be further converted to higher molecular-weight hydrocarbon fuels that have high volumetric and mass energy densities. 1,3 The majority of the effort on CO2R has been directed towards the coupling of a photovoltaic (PV) energy source to an electrochemical (EC) cell, what is referred to as a PV+EC system. 4–7 However, there is now increasing interest in developing systems for photoelectrochemical CO2 reduction (PEC CO2R), in which single or multiple photo-absorbers are coupled directly to catalysts at the cathode and/or anode of the device. 8–10
A metric for the performance of a solar-driven CO2R system is its solar-to-C2+ (STC2+) efficiency, which gives the percentage of incident solar power used to transform CO2 into C2+ products. State of the art PV+EC systems have demonstrated STC2+ efficiencies of ∼3.8%. 11 For PEC CO2R, the current state of the art is ∼1% STC2+ efficiency, but this is achieved with a PEC device assisted externally by a PV stack. 8 To the best of our knowledge, C2+ product generation in a monolithic, unassisted PEC device has not been demonstrated. The principal challenge to achieving high STC2+ efficiency in monolithic, unassisted PEC devices is the large potential required to generate C2+ products. 12 There are also additional challenges in the development of monolithic, unassisted PEC CO2R devices, such as multijunction photoelectrode fabrication, 13 catalyst and photo-absorber stability, 14,15 device design, 16 and others. 7 But, to overcome these challenges, it is important to first understand how to design PEC systems that operate at potentials large enough for C2+ product formation.
Metallic copper (Cu) has the unique ability to catalyze CO2 to C2+ products with high faradaic efficiency (FE), 12,17 which is the reason that it has been used in photocathodes developed for CO2R. 8,10,18–20 However, the product distribution of CO2R on Cu is potential-dependent. 8,12 The C2+ current density increases with cathode potential and reaches a peak value, beyond which it decreases due to the low CO2 concentration at the Cu surface and a shift to CH4 and H2 formation because of their high transfer coefficients. 21 To achieve selective PEC CO2R to C2+ products, the potential at which C2+ product formation is maximized, referred to here as Vid (ideal operating potential), needs to be attained. The operating potential (Vop) is determined by the intersection between the electrochemical (EC) and PV current-voltage curves (also called the electrochemical load and solar power curves). Operation of the overall device at Vid can be achieved with a photoelectrode that has a high photocurrent and a photovoltage near Vid (e.g., this photoelectrode performance enables intersection of the EC load and solar power curves near Vid; see Fig. S1). 21
The photocurrent and photovoltage are related to the bandgaps of the semiconductors (Vg). 22 A photoelectrode with two or three semiconductors of different bandgaps in a multijunction stack is required to obtain a sufficiently high photovoltage for operation near Vid. The photovoltage and photocurrent depend on the exact combination of bandgaps in the multijunction stack. 23 Moreover, Vid will depend on the overall device architecture because the overpotentials due to kinetics, species transport, and ohmic losses shift the potential at which C2+ products are maximized. Thus, there is a need to co-design the photoelectrode bandgaps and device architecture in order to ensure the photovoltage and photocurrent from the photoelectrode enables operation at the device-specific Vid. Understanding this relationship is critical for the design of monolithic, unassisted PEC CO2R systems which yields high STC2+ efficiency. Previous efforts aimed at modeling PEC CO2R systems have focused on engineering either the photoelectrode bandgap or the device architecture for generating C2+ products. 24–27 Singh et al. 24 and Kalamaras et al. 25 investigated the theoretical maximum STC2+ efficiency as a function of bandgap, assuming that there are no potential losses and that the reactions occur at their thermodynamic equilibrium potentials. Chen et al. 26 have incorporated kinetic, ohmic, and transport potential losses, but only considered a single device architecture. Gutierrez et al. 27 considered alternative cell designs but did not account for reactant transport, a critical consideration for CO2R, 28 and did not investigate the effect of photoelectrode bandgaps on STC2+ efficiency.
In this study, we report a model for PEC CO2R that accounts for photo-absorber performance, anodic and cathodic catalyst kinetics, diffusion and migration through the boundary layers and anionic membrane, and ionic conduction through the bulk electrolyte. The simulations carried out using this model provide guidelines for the co-design of photoelectrode bandgaps and overall device design for achieving high STC2+ efficiency. The model is then used to understand how the optimal bandgaps for generating C2+ products change between single versus dual photoelectrode designs, and which bandgap combinations lead to high STC2+ efficiency throughout the day and year. These efforts enable identification of photoelectrode materials and device architectures for achieving high C2+ product generation in a monolithic, unassisted PEC CO2R device.
Figure 1a shows a schematic of the modeled system. This cell design is similar to that used for electrochemical studies of CO2R 1,12,29,30 and is currently being explored for PEC CO2R. 4,8,10 A liquid-based system is chosen because PEC devices are typically limited to current densities of ∼10 mA cm−2 by the generated photocurrent, assuming no concentration of solar radiation. We note that the general findings (e.g., requirement of co-design between device architecture and photoelectrode bandgaps) are expected to be applicable to both liquid-based and gaseous-fed PEC devices. A photocathode (performing CO2R) and a dark anode (performing the oxygen evolution reaction (OER)) are separated by a Sustainion® anion-exchange membrane. The electrolyte is chosen to be 0.1 M CsHCO3, because it promotes the formation of C2+ products, 28,31–33 and is assumed to be saturated with CO2 (34 mM). Ion transport through the bulk electrolyte is modeled using Ohm's law with an assumed constant concentration of 0.1 M CsHCO3 since it is continuously replenished by feeding fresh electrolyte. CO2 diffuses from the bulk electrolyte to the photocathode surface through a mass-transport boundary layer and reacts on the Cu foil to form C1 (HCOOH, CO, and CH4) and C2+ (C2H4, EtOH, PrOH, and AllylOH) products. Water reduction to form H2 is included as a competing cathodic reaction. The rate at which these products are formed is represented by a Tafel equation (kinetic parameters are listed in Table S3). The mass-transport boundary-layer thickness was assumed to be 100 μm, which corresponds to a Reynolds number of 1800. The impact of electrolyte flowrate (e.g., Reynolds number) on STC2+ rates has been reported by King et al. 21 Mass-transport boundary layers also exist near the membrane surfaces and the anode surface due to ion concentration gradients between the bulk electrolyte and the electrolyte layer adjacent to the membrane (a result from Donnan exclusion) and due to the generation of protons at the anode, respectively. The PV solar power curve is simulated by the ideal-diode equation in the Shockley–Queisser radiative efficiency limit under AM 1.5 G solar illumination. 22 This PV model is coupled to the electrochemical model by determining the intersection point of the electrochemical load and solar power curves. MATLAB is used to identify the operating point and to model the PV component, and COMSOL 6.0 software is used to solve the electrochemical governing equations (details provided in SI sections S2 and S3).
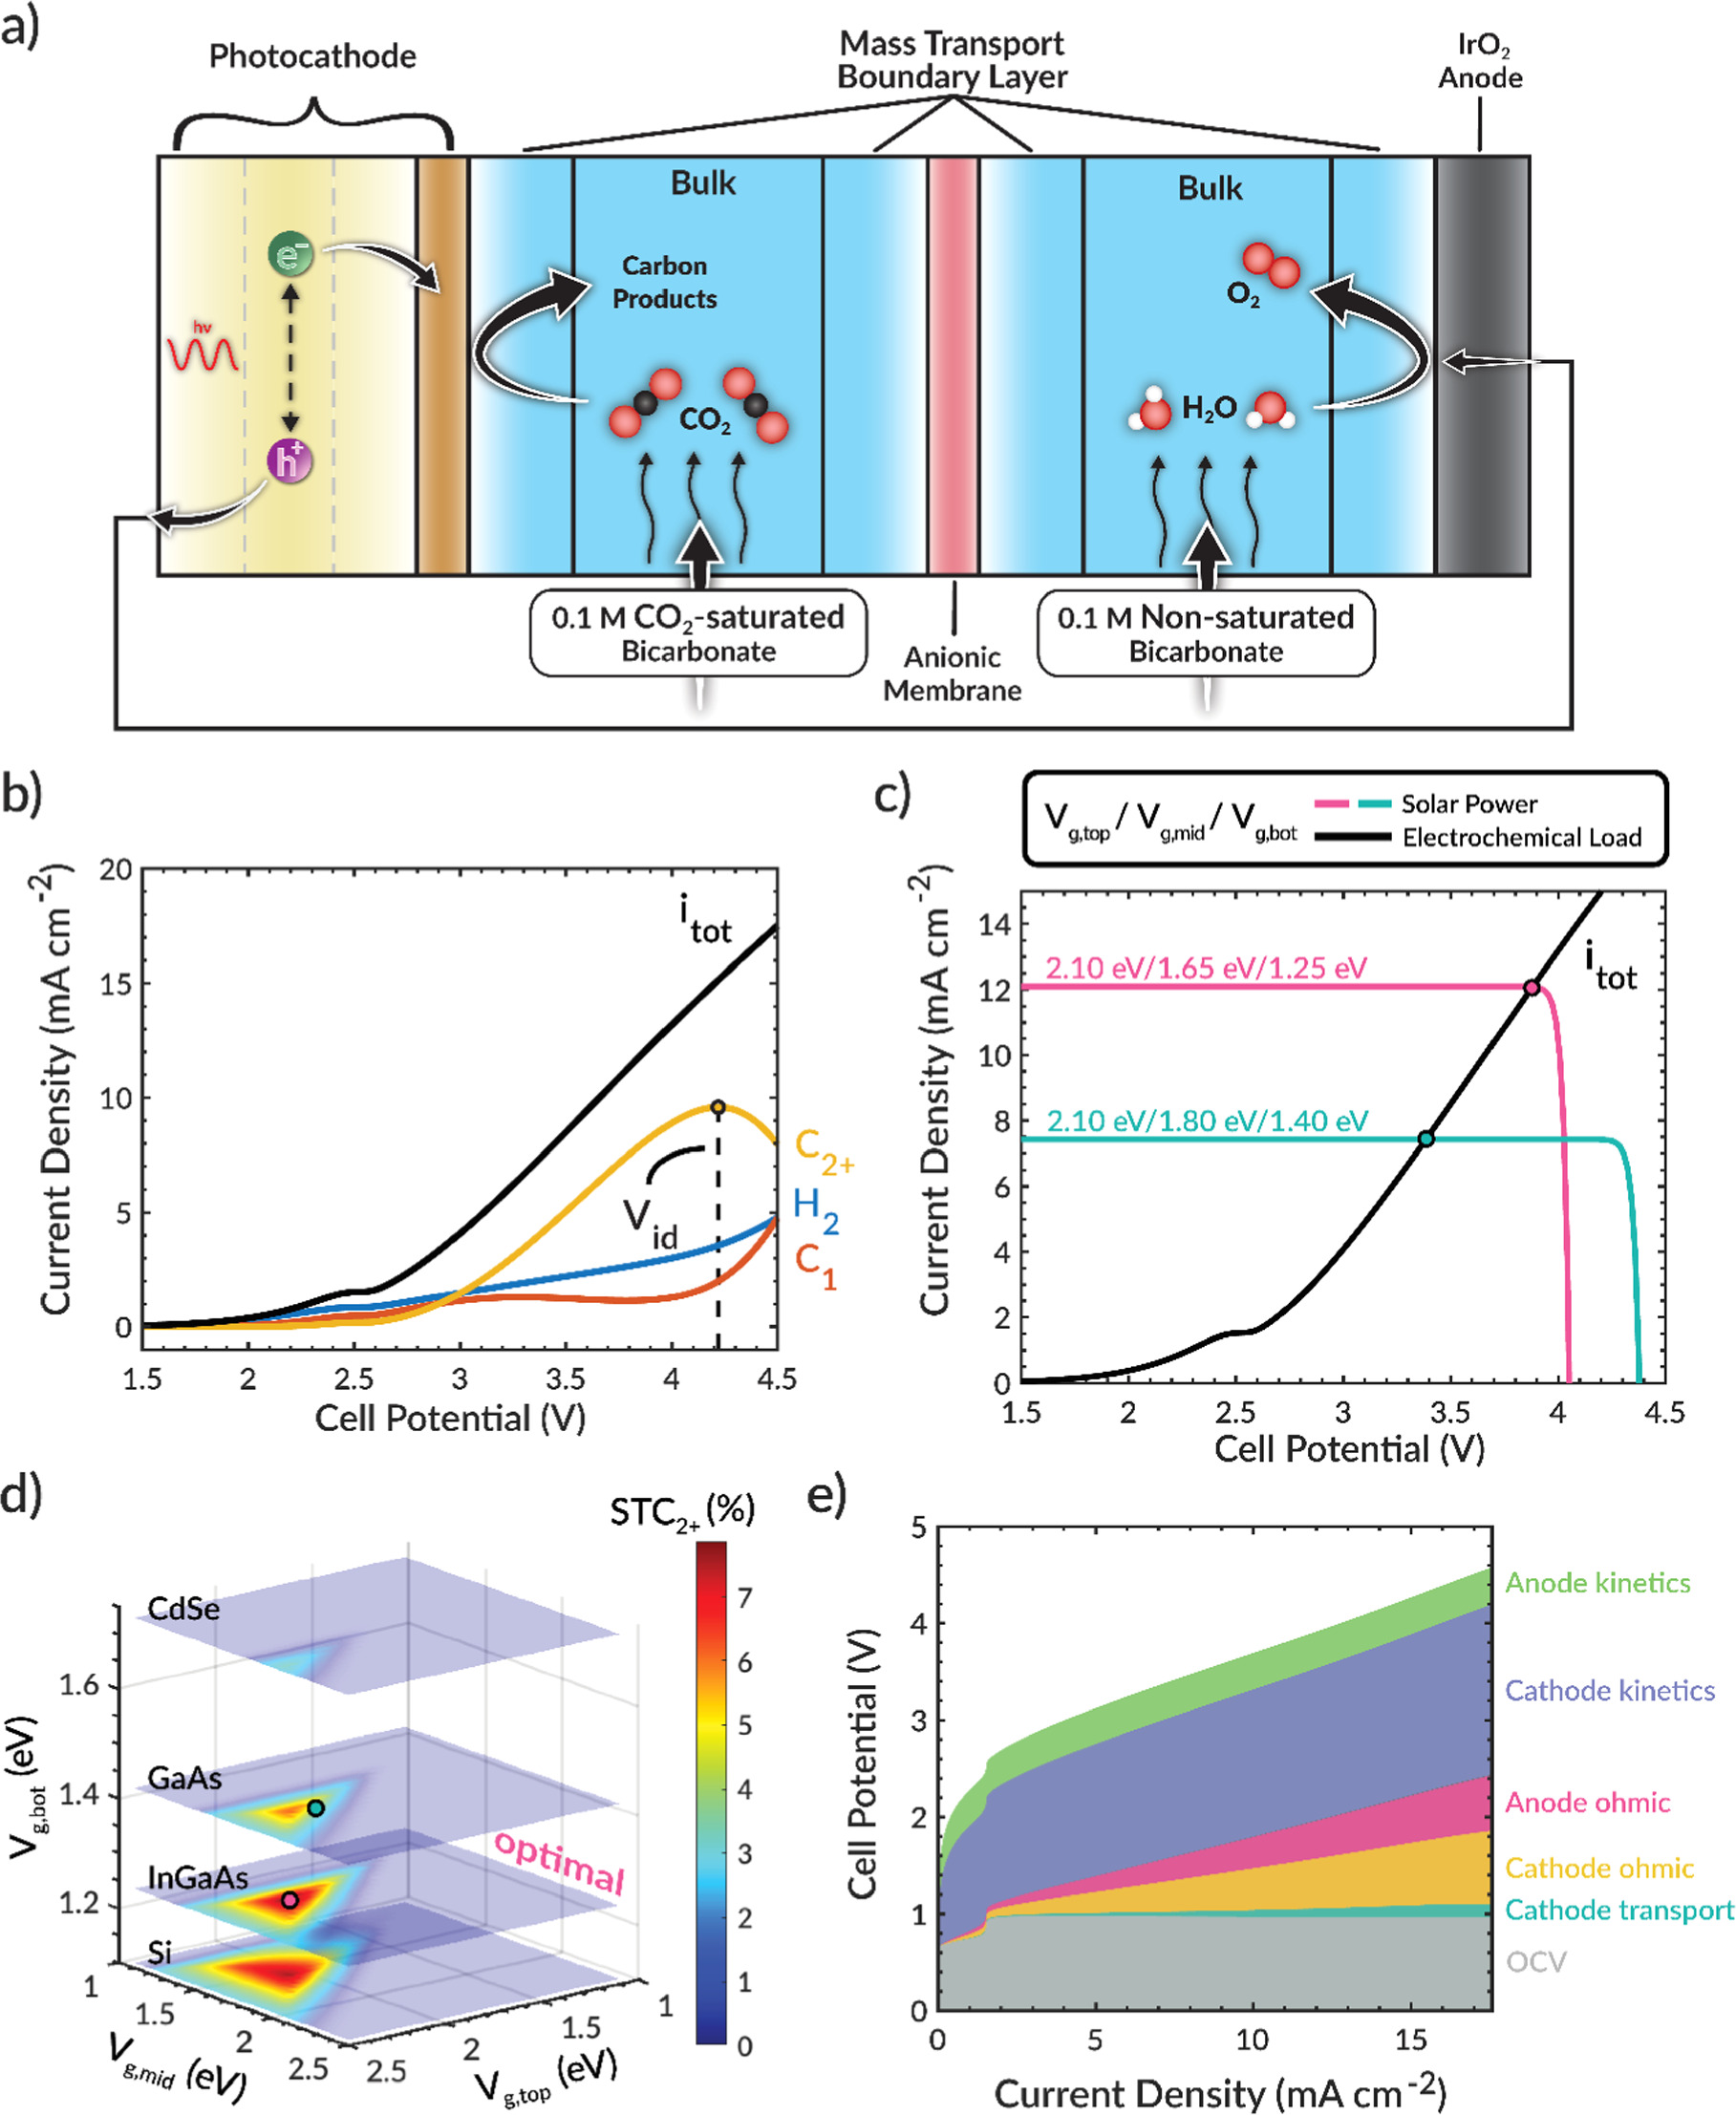
Figure 1. (a) Schematic of model system. (b) Total and partial current densities as a function of cell potential. (c) PEC operating points for two different photoelectrode bandgap combinations. (d) Solar-to-C2+ (STC2+) efficiency (color map) as a function of the top, middle, and bottom bandgap. (e) Electrochemical voltage breakdown versus total current density.
Download figure:
Standard image High-resolution imageThe photo-absorber is assumed to operate at its theoretical maximum (Shockley–Queisser radiative efficiency limit under AM1.5 G solar illumination). This assumption enables the prediction of the STC2+ efficiency from a PEC CO2R device based on the photoelectrode(s) bandgap combination; however, it neglects detailed semiconductor and multijunction properties (i.e., lattice matching, surface defects, semiconductor doping) and their effects on the photo-absorber performance. Moreover, the model excludes the impact of a protective metal-oxide interlayer between the semiconductor and the metal catalyst. 34 In general, the STC2+ efficiency will decrease whenever non-idealities in the photo-absorber are present. While the effects of these properties on the performance of photoelectrodes are important, they are outside the scope of the current study and their qualitative impact has been previously discussed. 21 Instead, we assume that the multijunction stack operates at its theoretical maximum and focus on identifying candidate semiconducting materials for achieving high STC2+ efficiency, as well as how the semiconductor bandgaps change with device architecture. The exclusion of the aforementioned properties is not expected to limit the applicability of the results.
The electrochemical behavior of the H-cell device is shown in Fig. 1b. The total current density (itot) increases monotonically with cell potential. We note the flat region in itot, which has been observed experimentally,
4,5,8,9
is due to the appreciable OER rate that rapidly increases the proton concentration at the anode surface (see Fig. S2) and shifts the anodic equilibrium potential due to the Nernstian pH-shift. Importantly, the C2+ partial current density (PCD) does not increase monotonically but exhibits a peak at ∼4.25 V (e.g., Vid ≈ 4.25 V), after which the C2+ PCD decreases (see Fig. S3 for all products). We note that this maximum in C2+ PCD can be increased by altering the Cu morphology,
35
tuning the electrolyte microenvironment (e.g., pH and CO2 concentration) adjacent to the Cu surface,
28
and increasing the rate of CO2 transport (e.g., increasing electrolyte flowrate).
21
Employing these strategies along with solar-concentrators to increase the photocurrent density could enable STC2+ PCDs that are beyond the maximum C2+ PCD in this study (∼10 mA cm−2). To operate at the point of maximum C2+ generation, the electrochemical load and solar power curves must intersect at Vid. For a given device design, the operating point can be controlled by the bandgap combination of the multijunction photoelectrode, as shown in Fig. 1c. 
 and
and  correspond to the bandgap of the semiconductor at the top, middle, and bottom of the triple-junction stack, respectively. Shown here is the operating point for systems with a high (pink) and a low (teal) C2+ PCD. The teal system has a low C2+ PCD because it operates at a potential much lower than Vid, despite its photovoltage being greater than Vid. This low operating potential is due to the relatively low photocurrent, which causes the electrochemical load and solar power curves to intersect at a potential much lower than Vid. The pink system, on the other hand, has a relatively high photocurrent and is able to operate close to Vid, even though the photovoltage is less than Vid. Thus, the generation of C2+ products strongly depend on the photocurrent and photovoltage, both of which are controlled by the photoelectrode bandgaps.
By sweeping through an array of bandgap combinations for a triple-junction photoelectrode, a PEC operating point can be determined for each bandgap combination. The corresponding STC2+ efficiency for each photoelectrode can be visualized with slices of a 3D surface plot as shown in Fig. 1d. The STC2+ efficiency for the two operating points in Fig. 1c is labeled by circles in Fig. 1d. The z-axis slices in Fig. 1d correspond approximately to Si (1.11 eV), InP (1.27 eV), GaAs (1.43 eV), and CdSe (1.74 eV). This analysis reveals that there exists an optimal bandgap selection around Vg,top = 2.10, Vg,mid = 1.65, and Vg,bot = 1.25 eV for generating C2+ products (the pink line in Fig. 1c) in which the photocurrent is high and the photovoltage is near Vid. This optimal combination correlates to an AlAs/In0.6Ga0.4P/In0.2Ga0.8As multijunction photocathode, which uses semiconductors that have approximately the same lattice constant. 36 These materials have been used in previous studies on multijunction PVs but, to our knowledge, have not been used together. 36,37 A discussion on the use of more economical semiconducting materials (e.g., Si) is provided in SI section S4. For this device architecture, no bandgap combination leads to operation at Vid because the device is either limited by the photovoltage or photocurrent. Therefore, modification to the cell design is needed to reduce Vid and operate at the peak C2+ product generation, further highlighting that co-design of both the photoelectrode and the device architecture will be required to achieve optimal unassisted PEC CO2R to C2+ products.
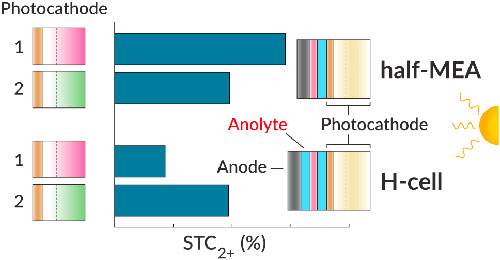
A voltage breakdown analysis, shown in Fig. 1e, 28 identifies the EC potential losses. The catholyte and anolyte chambers exhibit high ohmic potential losses (<1 V) due to their appreciable length (1.5 cm) and the low conductivity of the fed electrolyte. An effective approach for decreasing this potential loss is to reduce the distance between the electrodes, as has been demonstrated for PEC water splitting devices. 38 Accordingly, we showed that the anodic ohmic loss can be reduced by eliminating the anodic chamber entirely (Fig. 2a), resulting in setup similar to that of a zero-gap membrane-electrode-assembly (MEA). 39,40 We refer to this assembly as a half-MEA design because there is no electrolyte gap between the anode and the membrane. In this case, water from the catholyte must transport through the anion-exchange membrane to the anode catalyst layer where it is oxidized to O2, which then diffuses out the back of the porous anode. We note that the model neglects O2 transport because it is assumed to exit the system rapidly and that the porous anode is approximated as a planar surface because of the low operating current densities (<20 mA cm−2). Moreover, water transport does not limit the performance of this device because the activity of liquid water is high (∼1.0). 39 Significantly, this modification removes ∼450 mV of potential loss from the cell (Fig. S4) and decreases the Vid by the same amount (Fig. 2b). The decrease in Vid causes a concomitant decrease in the optimal bandgap selection (Vg,top = 2.00, Vg,mid = 1.55, and Vg,bot = 1.15 eV), as seen in Fig. 2c, in order for the photovoltage to remain near Vid. This optimal bandgap combination corresponds approximately to a In0.4Al0.6As/In0.8Ga0.2P/Si multijunction photocathode 36,41 and leads to a STC2+ efficiency of ∼9%, whereas ∼8% STC2+ efficiency is obtained if the original optimal bandgap combination is used because it does not operate as close to Vid. Therefore, to obtain the maximum STC2+ efficiency, it is important to first optimize the device design and then identify the Vid for that design so that it can be paired with the right combination of semiconductors. In other words, to generate high yields of C2+ products, the selection of the photocathode materials and the design of the reactor are intimately coupled.
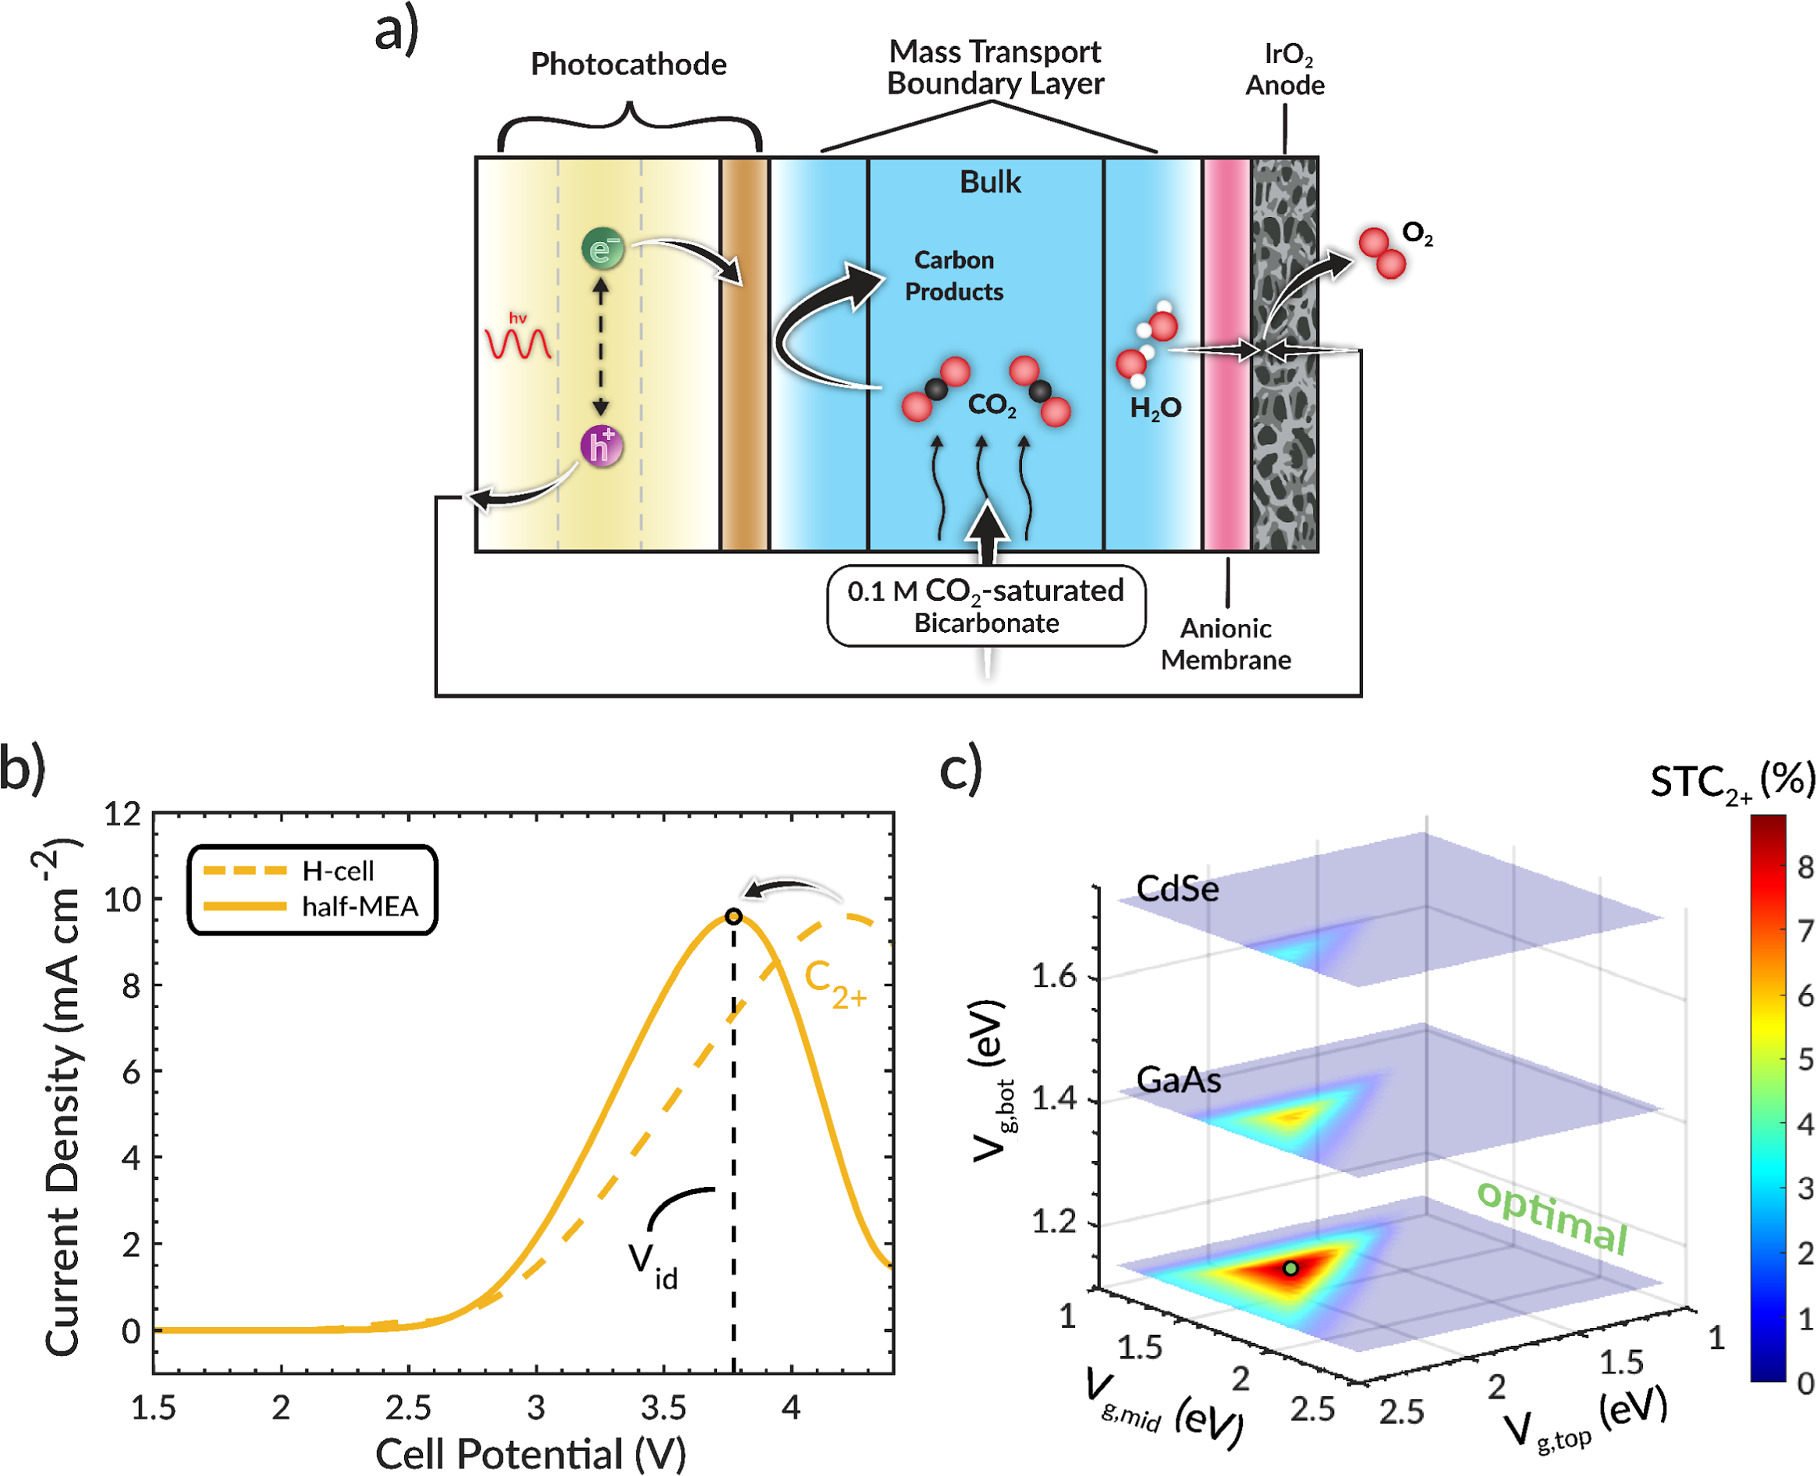
Figure 2. (a) Schematic of the half-MEA model system without anodic chamber. (b) Total and C2+ partial current densities as a function of cell potential. (c) Solar-to-C2+ (STC2+) efficiency (color map) as a function of the top, middle, and bottom bandgap.
Download figure:
Standard image High-resolution imageAnother important design consideration is the use of single or dual photoelectrode(s). Dual photoelectrode devices can generate higher photovoltages and photocurrents for a given bandgap combination than a device with only a single photoelectrode.
42,43
However, this requires illumination of both photoelectrodes.
16,26
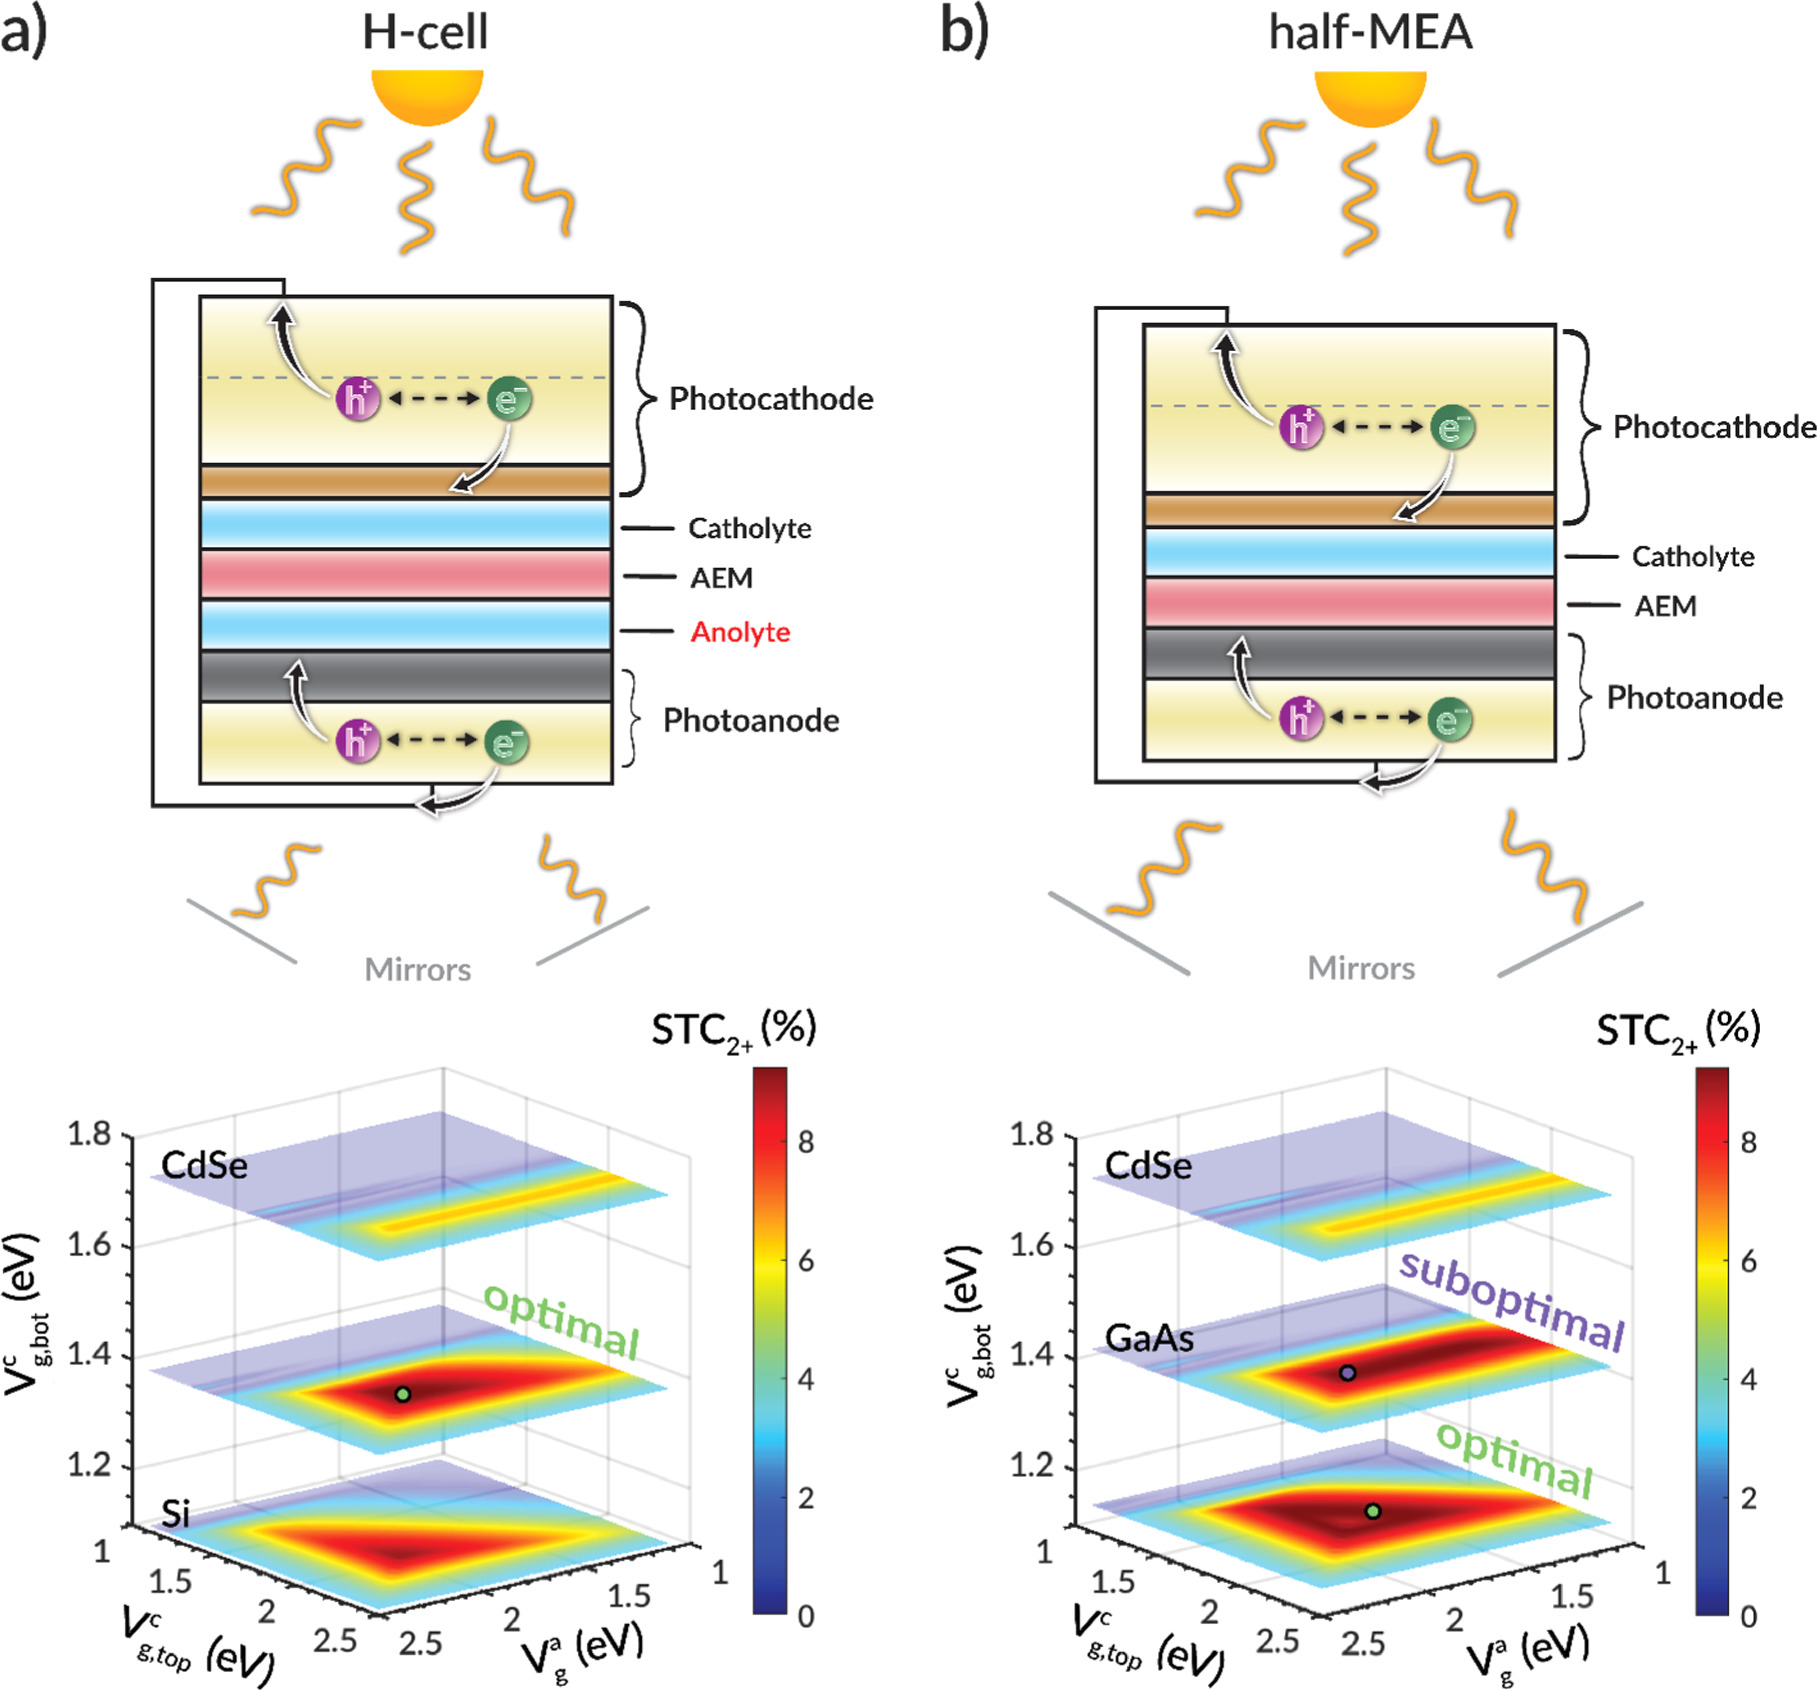
A simple design in which mirrors are used to reflect Sunlight toward the photoanode is depicted in Figs. 3a, 3b. This architecture can be used to evaluate how the optimal bandgap combination changes between single vs dual photoelectrode designs. Figures 3a, 3b also presents the STC2+ efficiency as a function of bandgaps, where the x-axis is the top photocathode bandgap ( ), the y-axis is the photoanode bandgap (
 ), and the z-axis is the bottom photocathode bandgap (
 ). The z-axis slices shown here correspond approximately to Si (1.11 eV), GaAs (1.43 eV), and CdSe (1.74 eV) (see Fig. S5). 2D surface plots at z-axis bandgaps corresponding to Si, GaAs, and CdSe are shown in Fig. S6.

Figure 3. (a) Schematic of the H-cell model system with dual photoelectrodes and corresponding solar-to-C2+ (STC2+) efficiency (color map) as a function of the top cathode, bottom cathode, and anode bandgap, where the top, middle and bottom z-slices are CdSe, the optimal bandgap, and Si respectively. (b) Schematic of the half-MEA model system with dual photoelectrodes and corresponding solar-to-C2+ (STC2+) efficiency (color map) as a function of the top cathode, bottom cathode, and anode bandgap, where the top, middle and bottom z-slices are CdSe, GaAs, and the optimal bandgap respectively.
Download figure:
Standard image High-resolution imageIt is evident that a dual photoelectrode device significantly increases the number of bandgaps capable of achieving high STC2+ efficiency compared to that for a single photoelectrode device. This is because, for both the H-cell and half-MEA cell designs (Figs. 1d and 2c, a higher photovoltage and photocurrent for a given bandgap combination can be achieved using a dual photoelectrode system. We note that this finding is consistent with those previously seen in PEC water-splitting systems.
44,45
Thus, the use of dual photoelectrodes enables greater flexibility in the choice of semiconductors and their photo-absorption characteristics than a single photoelectrode design. We note that the half-MEA dual photoelectrode design exhibits a region of lower STC2+ at the optimal bottom photocathode bandgap (1.15 eV), seen in Fig. 3b, because the operating potential exceeds Vid (see Fig. S7), leading to lower STC2+ efficiency. Although dual photoelectrodes broaden the selection of bandgaps that lead to high STC2+ efficiency, there still exists an optimal bandgap combination that maximizes STC2+ efficiency. This occurs for approximately Vc
g,top = 2.00 eV, Vc
g,bot = 1.40 eV, and Va = 2.00 eV for the H-cell cell design (Fig. 3a) and Vc
g,top = 1.80 eV, Vc
g,bot = 1.15 eV, and Va = 1.75 eV for the half-MEA cell design (Fig. 3b). Interestingly, the decrease in optimal bandgaps for each semiconductor upon removing potential losses is approximately the same (∼0.25 eV). This is also seen in the single photoelectrode design, in which each bandgap in the multijunction stack decreases by ∼0.1 eV (note that this value is less than 0.25 eV because of the smaller shift in operating potential, as discussed in SI section S11). The decrease in optimal bandgaps, for the single and dual photoelectrode systems, corresponds to a decrease of ∼0.55 eV per volt of change in operating potential (e.g., a 1 V decrease in operating potential is achieved by decreasing each bandgap by ∼0.55 eV). This analysis shows that there is a relationship between the optimal operating potential and the optimal bandgaps that is dictated by the device architecture and choice of photoelectrode materials, respectively. We note this decrease in optimal bandgap with reduced potential losses is also seen in PEC water splitting,
43
but this ∼0.55 eV per volt for each bandgap is unique to CO2-saturated liquid-flow cells for which the operating potential is  2.5 V; otherwise, a peak C2+ PCD versus potential would not exist and only two semiconductors would be needed to achieve sufficient photovoltage to drive electrolysis. This observed relationship applies to commonly used device architectures and operating conditions, and it provides a useful guide for choosing the bandgaps of the photoelectrode(s) required to achieve operation at Vid and the maximum STC2+ efficiency. These results also underscore the need to co-design both the device architecture and photoelectrode(s) in order to achieve optimal PEC CO2R to C2+ products.
Another useful guideline drawn from this analysis is the choice of bandgaps for the photoanode and the semiconductor at the top of the photocathode. For both the H-cell and half-MEA cell designs, the optimal bandgap combination for a dual photoelectrode system occurs when the photoanode and top photocathode have approximately the same bandgap. This combination maximizes the photocurrent and generates a large photovoltage, and then the bottom photocathode bandgap is tuned so that the photovoltage is near Vid. Figure S8 shows how the photocurrent and photovoltage change as a function of each bandgap. These results suggest that, for CO2-saturated liquid-flow cells in which the operating potential is  2.5 V, the photoanode and top photocathode should be the same semiconducting material in order to achieve high STC2+ efficiency.
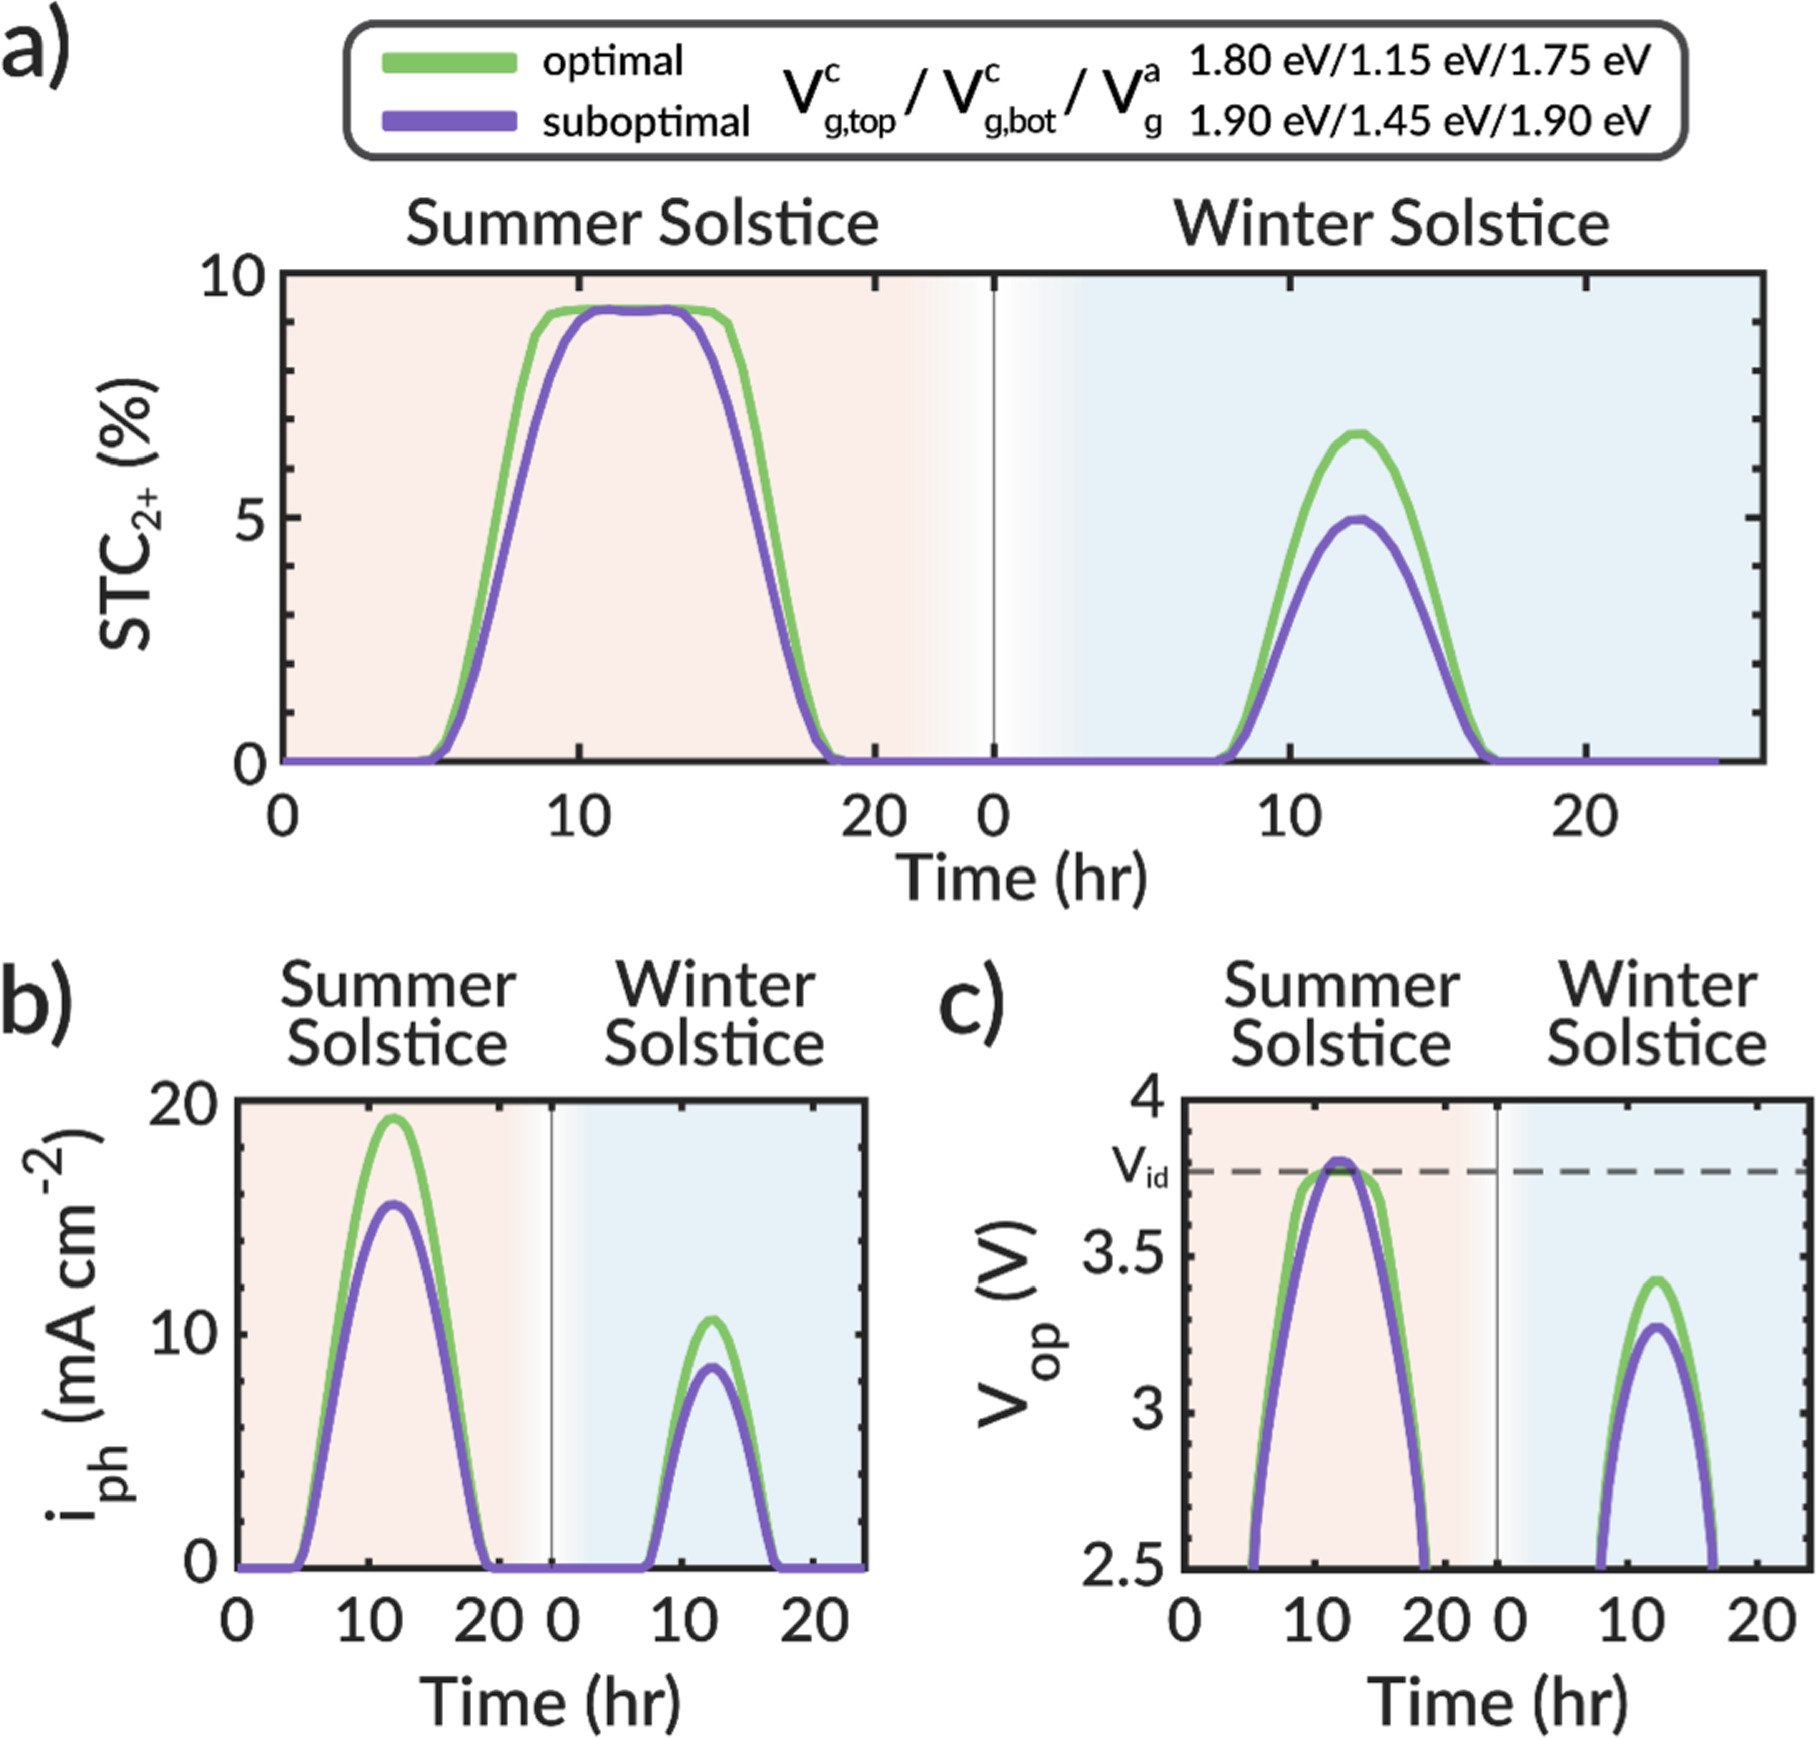
The importance of maximizing photocurrent can be easily seen from an analysis of the STC2+ efficiency throughout the diurnal cycle. Using AM 1.5 G solar illumination and approximating the hourly solar concentration from the NREL's TMY3 dataset for the summer and winter solstices in 2020 at Barstow, CA (see Fig. S9), we estimate the hourly STC2+ efficiency, photocurrent, and operating potential for the optimal (Vc
g,top = 1.80, Vc
g,bot = 1.15, and Va = 1.75 eV) and a suboptimal (Vc
g,top = 1.90, Vc
g,bot = 1.45, and Va = 1.90 eV) combination of semiconductor bandgaps for the half-MEA dual photoelectrode design (these bandgap combinations are shown as circles in Fig. 3b). We note this analysis assumes that the PEC device operates at ambient temperature. The impact of temperature needs to be investigated in the future, but such work needs information about temperature-dependent properties (recombination current, species transport coefficients, material properties, kinetic rate coefficients, etc), which in many cases are not currently known. Figure 4a shows that the hourly STC2+ efficiency between the optimal and suboptimal bandgap selections follows the same trend and that they are similar during the midday summer solstice. Near Sunrise and Sunset and during the winter solstice, however, the optimal bandgap combination has higher STC2+ efficiency than the suboptimal combination. This behavior is also evident from 3D surface plots presented in Fig. S10. The higher STC2+ efficiency when the solar intensity is less than one Sun is due to the high photocurrent of the optimal bandgap combination (Fig. 4b). Because the optimal bandgap selection is able to absorb more of the solar spectrum and generate a higher photocurrent than the suboptimal combination, its solar power curve can intersect the electrochemical load curve at a potential that is closer to Vid throughout the diurnal and annual solar cycles (Fig. 4c). In summary, the optimal bandgap combination generates 1.13 and 1.39
 more C2+ products throughout the day during the summer and winter solstices, respectively, compared to the suboptimal bandgap combination. Throughout the entire year of 2020, the optimal bandgap combination generates 1.21
 more C2+ products than the suboptimal combination. While there are various combinations of bandgaps leading to high STC2+ efficiency at full Sun (Fig. 3), only the bandgaps that lead to a high photocurrent and photovoltage near Vid result in the highest C2+ generation throughout the day and year.
Figure 4. (a) Solar-to-C2+ (STC2+) efficiencies of optimal and suboptimal bandgap combinations for Barstow, CA during the 2020 summer and winter solstices. (b) Photocurrent density (iph) of optimal and suboptimal bandgap combinations for Barstow, CA during the 2020 summer and winter solstices. (c) Operating potential (Vop) of optimal and suboptimal bandgap combinations during the 2020 summer and winter solstices in Barstow, CA.
Download figure:
Standard image High-resolution image
This study demonstrates the use of multiphysics modeling to simulate the electrochemical and photovoltaic performance of PEC CO2R systems involving a Cu catalyst for the unassisted generation of multicarbon (C2+) products. The C2+ product selectivity is potential dependent, which necessitates simultaneous co-design of photoelectrode(s) and system architecture in order to ensure that the overall device operates at the potential for which C2+ production is maximized (Vid). The model is used to identify optimal device designs and photoelectrode bandgaps, as well as general relationships between the two, for achieving high solar-to-C2+ (STC2+) efficiencies. The simulation shows that the optimal combination of bandgaps in a triple-junction stack for achieving high STC2+ efficiency strongly depends on the device architecture. Modifying the device design changes Vid, which necessitates a change in photoelectrode bandgapsin order to ensure the system operates at the new Vid and maintains high STC2+ efficiency. Specifically, the model predicts that the bandgap of each layer in the photoelectrode stack should changeby approximately the same amount, the amount depending on how much Vid changes. This finding holds for both single photoelectrode and dual photoelectrode systems. In addition to these results, the model predicts that photoelectrodes with a high photocurrent and a photovoltage near Vid are required to achieve high STC2+ efficiency throughout the diurnal and annual solar cycles. This is because high photocurrents enable the solar power curve to intersect the electrochemical load curve at potentials close to Vid even when the incident solar power is <100 mW cm−2. To achieve high photocurrents, it is desired to employ semiconductors with moderate bandgaps, but the exact combination of these bandgaps must generate a photovoltage near Vid to attain high STC2+ efficiency. To improve these predictions, future model developments should include non-idealities and series and shunt resistances in the diode equation to account for detailed semiconductor, multijunction, and solid-state interfacial properties because they will impact the ultimate performance of each photoelectrode. While the present analysis neglects these phenomena, it nevertheless reveals useful relationships between photoelectrode bandgaps and device design for achieving high STC2+ efficiency throughout the day, a key step in the development of monolithic, unassisted PEC CO2R systems.
Acknowledgments
This material is based on work performed within the Liquid Sunlight Alliance, which is supported by the U.S. Department of Energy, Office of Science, Office of Basic Energy Sciences, Fuels from Sunlight Hub under Award Number DE-SC0021266. A.J.K. acknowledges funding from the National Science Foundation Graduate Research Fellowship under Grant No. DGE 2146752. J.C.B. would like to acknowledge support from the National Defense Science and Engineering Graduate Fellowship (NDSEG) supported by the Army Research Office (ARO). The authors acknowledge the National Institute of Health under Grant No. S10OD034382 for its support of the Molecular Graphics and Computation Facility in the College of Chemistry at the University of California, Berkeley. The authors also thank Aditya Prajapati for his help in resolving convergence issues and Kyra Yap for her constructive feedback on the paper.
Supplementary data (1.1 MB PDF)