
Abstract
Recently, there has been a growing focus on enhancing carbon efficiency in the field of electrochemical CO2 reduction, quantifying the proportion of CO2 converted electrochemically relative to the total amount consumed. The competition between homogeneous reactions forming carbonates and the electrochemical conversion of CO2 is causing lowered carbon efficiencies in typical buffer or alkaline electrolytes. Consequently, strategies aimed at shifting the equilibrium of these reactions have to be employed. In this work, the application of acidic electrolytes is presented as a promising pathway to overcome this limitation. Experimental investigations at silver gas diffusion electrodes (GDEs) in acidic 0.5 M K2SO4 electrolyte show an improvement of carbon efficiency by up to 20% compared to 1 M KHCO3 electrolyte, while the Faradaic efficiency at high current densities is unaffected. Nevertheless, degradation of silver GDEs occurs in acidic conditions, emphasizing the need for development of more stable catalysts. Furthermore, a spatially resolved mathematical model provides insights into the local reaction environment within the GDE. This highlights the importance of local alkalinity to control the rate of electrochemical CO2 reduction. While the formation of hydroxide ions by the electrochemical reactions creates an alkaline environment favoring CO2 reduction, the acidic bulk electrolyte hinders the formation of carbonates.
Highlights
Electrochemical CO2 reduction at silver GDEs with acidic K2SO4-based electrolytes
Improved carbon efficiency with acidic electrolyte, while Faradaic efficiency is unaffected
Mathematical model adapted for acidic electrolytes and validated with experimental data
Analysis of local environment and transport effects inside the GDE
Identification of three distinct regimes at low, medium and high current density
Export citation and abstract BibTeX RIS

This is an open access article distributed under the terms of the Creative Commons Attribution 4.0 License (CC BY, http://creativecommons.org/licenses/by/4.0/), which permits unrestricted reuse of the work in any medium, provided the original work is properly cited.
Electrochemical CO2 reduction (eCO2R) has the potential to become an important technology supporting the shift from fossil energy sources to renewables. 1 Utilizing CO2 as carbon source, eCO2R enables the storage of electrical energy provided by wind or solar power in form of valuable intermediates for the chemical industry. Depending on the choice of catalyst, the spectrum ranges from CO or HCOOH to C2+ products. 2–6 Silver catalysts have the benefit of selectively generating carbon monoxide as the only carbon product, serving as a vital educt in numerous well-established industrial processes. 7–9 The only by-product is hydrogen formed by hydrogen evolution reaction (HER) which is competing with CO2 reduction reaction (CO2RR) in aqueous electrolytes.
Many efforts have been made to optimize the process regarding its energetic efficiency, e.g. by using membrane electrode assemblies (MEAs) to reduce the ohmic resistance, and its Faradaic efficiency (FE) for the desired products.
10–14
The latter is mostly determined by CO2 mass transport limitations at elevated current densities,
15
Introducing gas diffusion electrodes (GDEs) instead of planar electrodes was a major step to improve mass transport, overcoming the limited solubility of CO2 in aqueous electrolytes.
15–17
Besides energetic and Faradaic efficiency, the carbon efficiency ( ) is gaining rising attention in recent studies.
18,19
Providing information about the CO2 utilization of eCO2R, it relates the CO2 converted electrochemically to the total amount consumed (see Eq. 1).
) is gaining rising attention in recent studies.
18,19
Providing information about the CO2 utilization of eCO2R, it relates the CO2 converted electrochemically to the total amount consumed (see Eq. 1).

In typical electrolytes, mostly aqueous solutions of KHCO3 or KOH, the carbon efficiency is limited by CO2 chemically absorbed in the electrolyte as carbonate or bicarbonate. 18–23 When utilizing anion exchange membranes, these ions cross over to the anolyte compartment, demanding expensive efforts for product separation in industrial electrolyzers. 24–28 The equilibrium of carbonate formation strongly depends on pH, with lower pH values being beneficial to increase the carbon efficiency by shifting the equilibrium toward CO2. However, acidic environments generally favor hydrogen evolution via proton reduction (reaction R3) resulting in decreased Faradaic efficiencies for CO2 reduction. 29,30 Therefore, eCO2R in acidic media has rarely been studied at silver-based electrodes. Nonetheless, it has been demonstrated that the use of acidic bulk electrolytes can increase the carbon efficiency without drawbacks in respect to the Faradaic efficiency for several eCO2R catalyst materials, e.g. Au, 31,32 Cu, 33 SnO2, 34 and molecular catalysts (NiPc-OMe MDE) 35 when operating at elevated current densities. 36
When utilizing MEAs, the issue of limited carbon efficiency persists despite no catholyte being used, because the high rate of hydroxide production in the electrochemical reactions effectuates high local pH. 37 The absence of liquid catholyte in a MEA setup prevents the application of acidic media to address this issue. Therefore, flow cells are preferred in the context of acidic eCO2R. 38
The increased carbon efficiency in acidic media can be understood by investigating the local reaction environment within the GDE via mathematical modeling. Spatially resolved models reveal a highly alkaline local pH during eCO2R at high current densities caused by the electrochemical reactions forming hydroxide ions, even when operating in acidic bulk electrolytes. 33,39
In this study, the feasibility of acidic electrolytes for eCO2R at silver GDEs in comparison to a typical 1 M KHCO3 electrolyte is investigated. Galvanostatic flow cell experiments show an improved carbon efficiency combined with a comparable Faradaic efficiency at high current densities (up to 800 mA cm−2). Furthermore, the experimental data is used to validate a mathematical model for the application to acidic bulk electrolytes. The model allows for insights into the local reaction environment, yielding information about the local pH within the GDE. This information enables a better understanding of the GDE performance at highly acidic conditions over a broad range of current densities.
Experimental
Experiments were conducted in a three-chamber flow cell (Micro Flow Cell V1_2017, ElectroCell) applying a three-electrode configuration, with a planar IrO2 electrode (ElectroCell) as anode and a Ag/AgCl micro electrode (ET072-1, eDAQ) as reference. As cathodes, commercially available silver gas diffusion electrodes by Covestro AG. 40 were used CO2 was supplied to the gas side at a threefold stochiometric surplus for the technical current density of 400 mA cm−2. Anolyte and catholyte compartment were separated by an anion exchange membrane (fumasep® FAA-3-130-PK, fumatech), with anolyte and catholyte being constantly mixed after cycling through the cell (see Fig. (SI 1)). For the electrochemical measurements a workstation (ZenniumPro, Zahner) was used to apply galvanostatic current. The products were analyzed using a gas chromatograph (Trace1310, ThermoFisher) in a two-channel setup equipped with thermal conductivity detectors. For carbon products, a Hayesep Q column was used. Hydrogen was analyzed with a 5 Å molecular sieve. The operating parameters are given in Table I. 39,41
Table I. Experimental Parameters and Conditions.
| Parameter | Value | Unit | Description |
|---|---|---|---|
| Operating conditions | |||
| T | 25 | °C | Temperature |
| p | 1 | bar | Pressure |
| pdiff | 20 | mbar | Gas side excess pressure |

| 960 | mL min−1 | Catholyte flow rate |

| 83.58 | NmL min−1 | CO2 flow rate |
| Geometry | |||
| AGDE | 10 | cm2 | GDE area |
| zec | 5.2 | mm | Catholyte gap |
Measurements were conducted with electrolytes based on 0.5 M K2SO4 (>99 wt%, Carl Roth) at varying bulk pH values of 1, 1.5, 2 and 3. The pH was adjusted by addition of concentrated sulfuric acid (>97 wt%, Honeywell Fluka). Furthermore, reference measurements with 1 M KHCO3 (>99 wt%, Carl Roth) were performed. To rule out major degradation effects, a fresh gas diffusion electrode and fresh electrolyte were used for each current density. This is further explained in the experimental results section of the SI (see Fig. SI 2). Additionally, potential was applied before the electrolyte was cycled through the cell to avoid contact of the silver electrode with the acidic electrolyte before the measurement. Then, the current was applied for 30 min, which corresponds to three injections of the gas chromatograph.
Model
The details of the steady-state thin-film flooded agglomerate (TFFA) model applied in this study are presented elsewhere. 39 Figure 1 shows a schematic overview of the model, consisting of the GDE, covered by a stagnant gas and electrolyte film on the respective sides. The GDE is divided in a gas diffusion layer (GDL) and a reaction layer (RL). While the GDL only serves for gas transport, the RL is intruded by the electrolyte. According to the TFFA approach, 42,43 the electrolyte distribution is defined by flooded agglomerates of cylindrical shape. The electrochemical and homogeneous reactions occuring in the reaction layer are summarized in Table II. Based on the interplay of these reactions with mass transport phenomena including diffusion and migration, the model enables the calculation of the local pH in the GDE and the electrolyte boundary layer. For the use of K2SO4-based acidic electrolytes instead of KHCO3, the following adaptions have been made:
- Ionic species transport equations now include SO4 2− ions.
- The thickness of the stagnant electrolyte film is significantly decreased to reflect the experimental conditions more accurately. This parameter becomes important when using an electrolyte without buffer capacity, whilst its influence was neglectable beforehand due to the high buffer capacity of KHCO3.
- Hydrogen evolution via proton reduction (reaction R3) has to be considered in acidic media. This is implemented by a concentration dependent Tafel approach (Eq. 2) with a reference concentration (cref = 1000 mol m−3), calculating the local thin-film current density jHER2 at every spatial position within the GDE with the pre-exponential factor (AHER2 = 2.77 · 1020 A m−2), the charge transfer coefficient (αHER2 = 0.44) and the reaction order for H+ (γ = 1). 39,44 The exchange current density jHER2,0 in dependence of pH is given by Eq. 3. 44
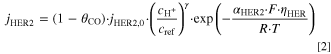

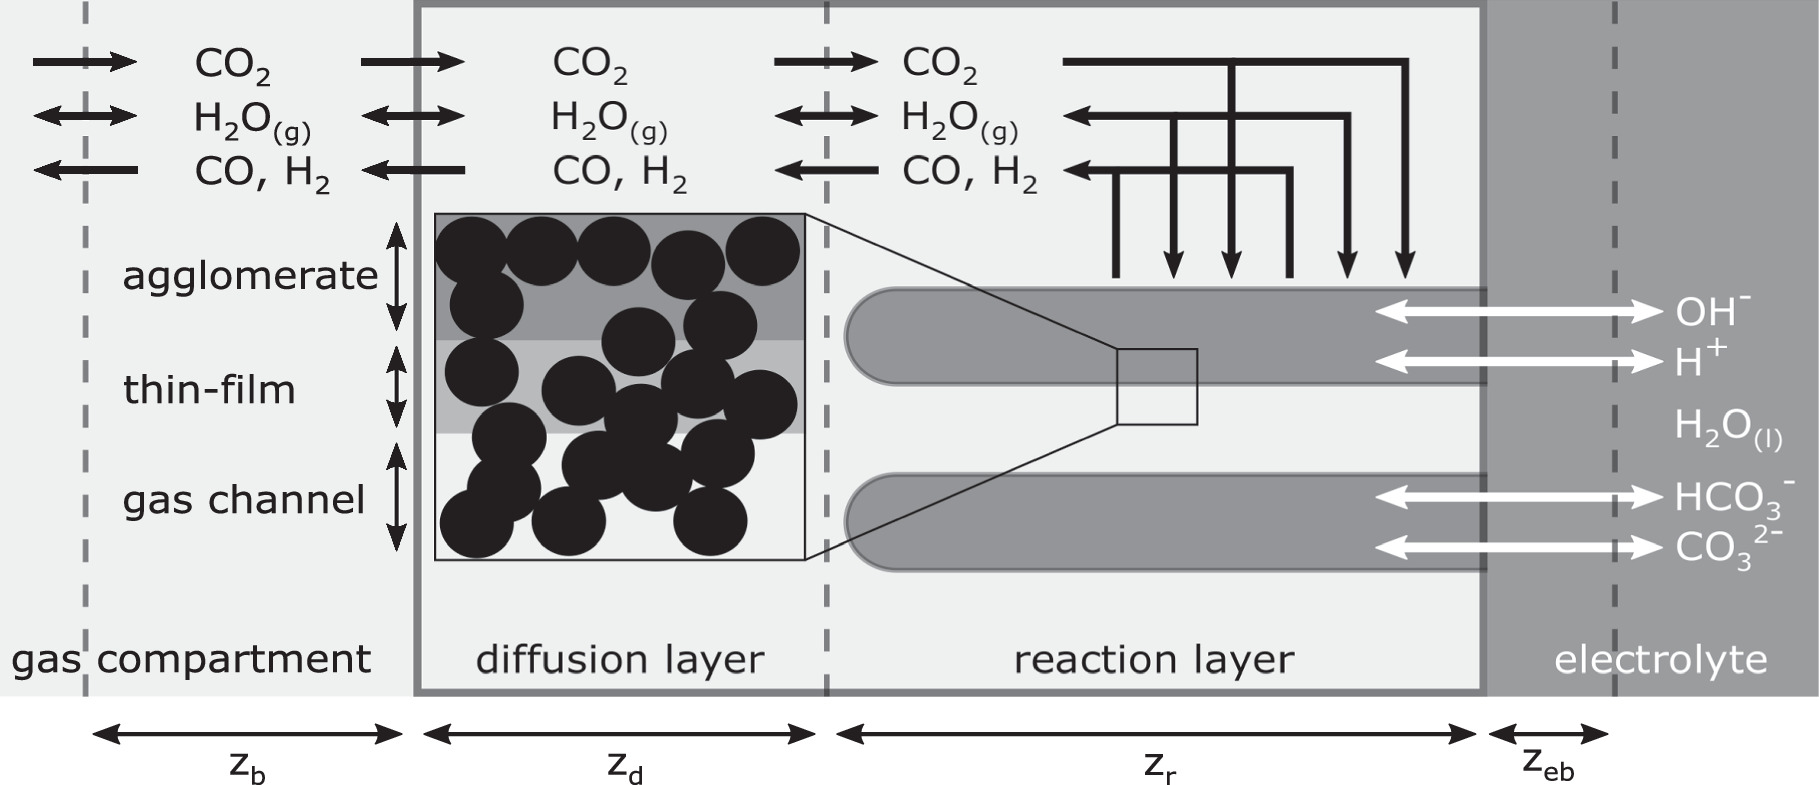
Figure 1. Schematic of the TFFA model for electrochemical CO2 reduction. Reprinted from Löffelholz et al. 39 with permission from Elsevier.
Download figure:
Standard image High-resolution imageTable II. Overview of electrochemical and homogeneous reactions considered in the model.
| CO2RR | CO2 + H2O + 2e− | → | CO + 2OH− | [R1] |
| HER (alkaline) | 2H2O + 2e− | → | H2 + 2OH− | [R2] |
| HER2 (acidic) | 2H+ + 2e− | → | H2 | [R3] |
| EQ1 | CO2 + H2O |

| H+ + 
| [R4] |
| EQ2 |

|

|

| [R5] |
| EQ3 | H2O |

| H+ + OH− | [R6] |
| EQ4 | CO2 + OH− |

|

| [R7] |
| EQ5 |

|

|

| [R8] |
Moreover, the model is modified to enable a more precise calculation of the carbon efficiency:
- Dissolved CO2 is included as additional species in the electrolyte boundary layer, including Fickian diffusion 39,45 and involvement in reactions R4 and R7.
- The electrolyte chamber beyond the stagnant film is assumed to be ideally mixed with the balance for component i given by Eq. 4 including the inlet concentration ci,ec,in, the concentration in the chamber ci,ec and the molar flow across the boundary of the stagnant film
 . The dimensions of the electrolyte chamber are defined by its gap width zec and the electrode area AGDE, resulting in the residence time τec when combined with the electrolyte flow rate (see Eq. 5).


The carbon efficiency is calculated according to Eq. 6, taking into account CO formed by CO2RR, as well as CO2 consumed in electrochemical and homogeneous reactions, based on the respective fluxes at the edge of the boundary layers on both sides of the electrode. In Eq. 6,  and
and  are the fluxes at the edge of the gas boundary layer and
  is the CO2 flux at the edge of the electrolyte boundary layer.

Numerical solution
gProms® ModelBuilder (Siemens Process Systems Engineering) is used to calculate the numerical solution of the partial differential equations included in the model. The modeling domain is divided into four subdomains, corresponding to the sections of the model (see Fig. 1) which are connected to each other via boundary conditions. The discretization of all subdomains is accomplished by the second order central difference method (CFDM). A compromise between computation time and accuracy is obtained by investigating the influence of discretization points, ensuring numerical stability by avoiding large local gradients. As gas boundary and gas diffusion layer only include model equations for diffusive transport of gaseous species, they are not subject to such gradients and therefore require few discretization points. Contrarily, a higher number of discretization points is required in the reaction and electrolyte boundary layer (see Table III). To achieve an accurate resolution of the steep gradients occuring at the electrolyte side of the GDE, a very fine discretization with 60 points is applied for the 0.3% of the reaction layer closest to the electrolyte. The partial differential equations are integrated using the DAEBDF solver based on a variable order backward differentiation formula with variable time step. 46 Due to the complexity of the model, the solver requires appropriate starting values. These are obtained by initializing with a simplified version and stepwise increasing complexity until a solution for the full model is found. 47
Table III. Overview of the discretization method and number of discretization points for each model section. The GDE is divided in gas diffusion and reaction layer, with the reaction layer being further split in two sections to increase numerical robustness.
| Model section | Domain length | Discretization (order) | Points |
|---|---|---|---|
| Gas boundary layer | zb | CFDM (2) | 10 |
| Gas diffusion layer (GDE) | zd | CFDM (2) | 10 |
| Reaction layer (GDE) | 0.997·zr | CFDM (2) | 30 |
| 0.003·zr | CFDM (2) | 60 | |
| Electrolyte boundary layer | zeb | CFDM (2) | 100 |
For parameter estimation, the MAXLKHD solver based on the Maximum-Likelihood method is used. 46
Results and Discussion
Experimental results
Faradaic efficiency
Galvanostatic experiments were conducted for several acidic bulk pH levels between 1 and 3, as well as neutral buffer electrolyte to investigate the feasibility of using acidic electrolytes in combination with silver GDEs for CO2 electroreduction. The results for Faradaic and carbon efficiency as a function of current density are given in Fig. 2. A significant influence of bulk pH on the Faradaic efficiency was observed in the lower current density range. While the Faradaic efficiency is close to 100% at very low current densities for the reference case of neutral KHCO3 buffer, it is almost zero for the acidic cases. This is due to the much faster kinetics of acidic HER when the proton concentration is high. With increasing current density, the Faradaic efficiency becomes higher in the acidic cases, with the onset current density of CO2RR being higher for lower pH values. For the pH values of 1.5–3, a maximum is reached in the medium current density region, where the Faradaic efficiency is equal to the reference case of 1 M KHCO3. In this region, the local pH inside the GDE becomes alkaline due to the formation of hydroxide ions in the electrochemical reactions, preventing acidic HER and causing local reaction conditions similar to the operation with buffer electrolyte. At high current densities, the Faradaic efficiency decreases in accordance with the reference case. This decrease is caused by CO2 mass transfer limitations, mostly determined by the GDE structure and thus independent of the bulk electrolyte. 39 For pH 1, no distinct maximum can be identified, with the Faradaic efficiency being almost constant in the range from 300 to 800 mA cm−2 This behavior is presumably caused by a superimposition of fast GDE degradation, which was confirmed by extended galvanostatic measurements for several cases as depicted in Fig. 3. Here, a very fast degradation could be observed for pH 1, while the degradation was much slower for less acidic cases. For neutral buffer electrolyte, no degradation was observed within 5 h. A possible explanation for the degradation of GDEs when operating in acidic media even at elevated current densities could be the very thin boundary layer between silver electrode and electrolyte. While the local pH in the pore system becomes alkaline, the fast transport of protons from the bulk electrolyte causes the surface of the GDE to be in contact with the acidic electrolyte. Silver is not stable in this environment and can therefore be dissolved into the electrolyte, changing the structure of the GDE surface and thus causing degradation of the electrode. 48 To prevent excessive contact of the GDE with the acidic medium, the potential was applied shortly before the electrolyte was cycled through the cell. This allows for immediate formation of hydroxide ions in the boundary layer when contact through the electrolyte is established, therefore mitigating degradation of the electrode. In future work, further strategies to minimize degradation should be explored. One approach could be the use of neutral buffer electrolyte for the start of the experiment with a subsequent switch to acidic electrolyte, preventing the contact of the GDE with acidic electrolyte before the formation of an alkaline boundary layer. Furthermore, more stable catalysts could be applied. As the transport effects influencing the local pH are mostly independent of the catalyst, other materials that are more resistant to acidic environments may be employed, while maintaining the aforementioned benefits of an acidic electrolyte.
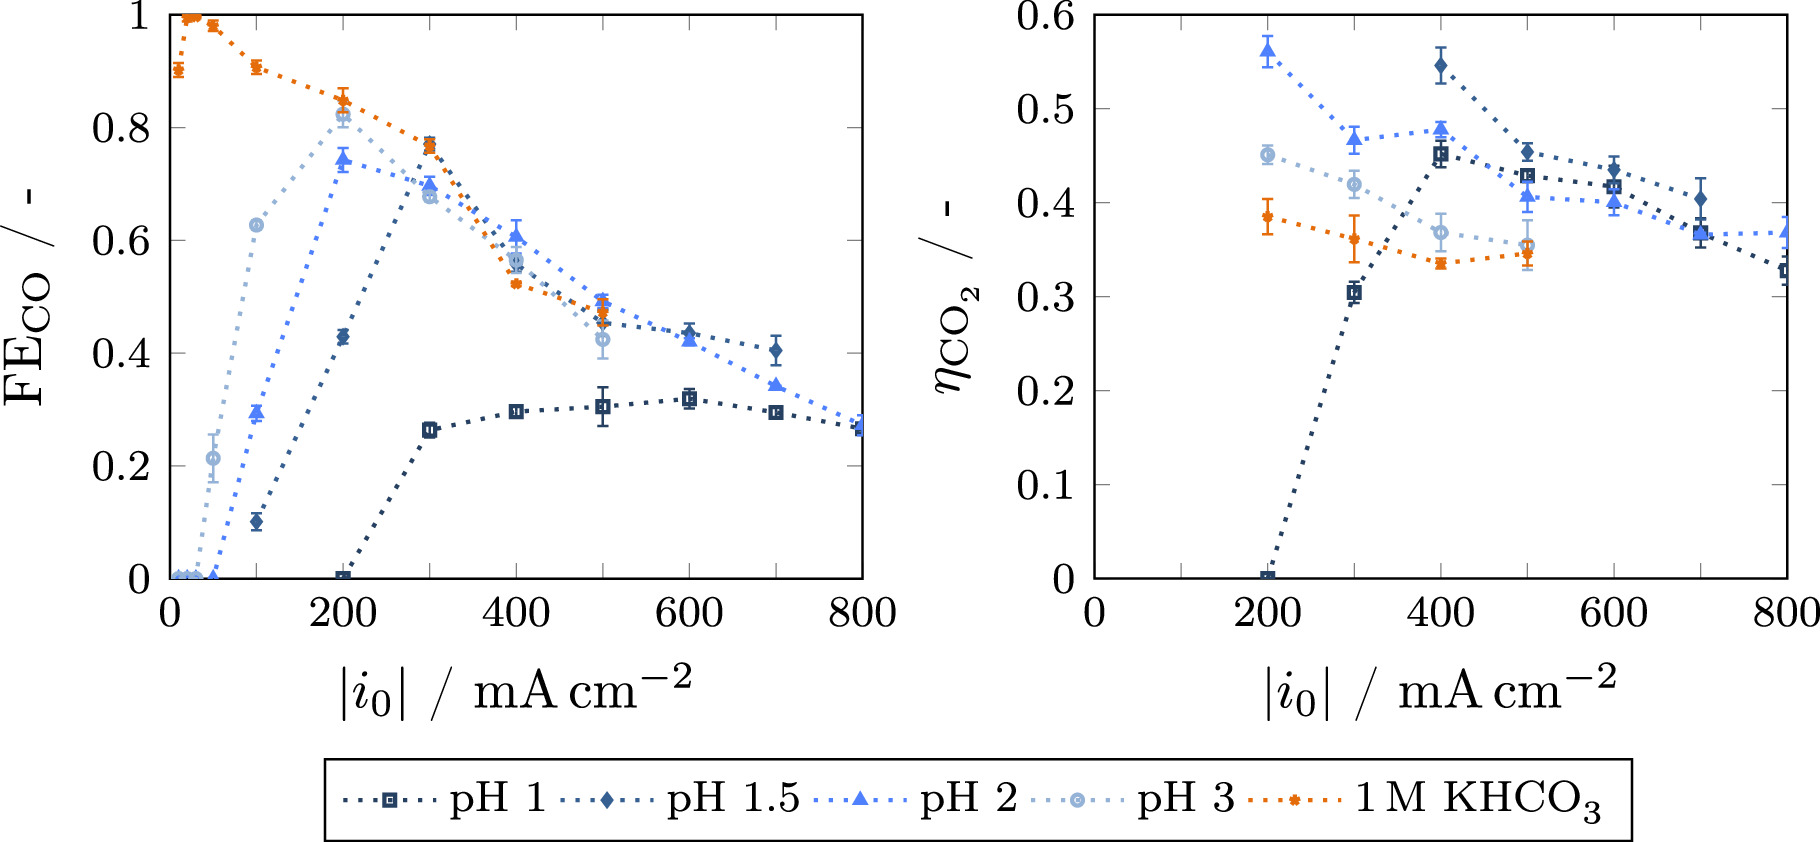
Figure 2. Experimental Faradaic (left) and carbon efficiency (right) in dependence of current density for different bulk electrolytes (K2SO4 at pH 1–3 and 1 M KHCO3). A fresh GDE is employed for every current density. Error bars have been calculated from multiple injections of the gas chromatograph for each current density. Dotted lines are used to guide the eye.
Download figure:
Standard image High-resolution image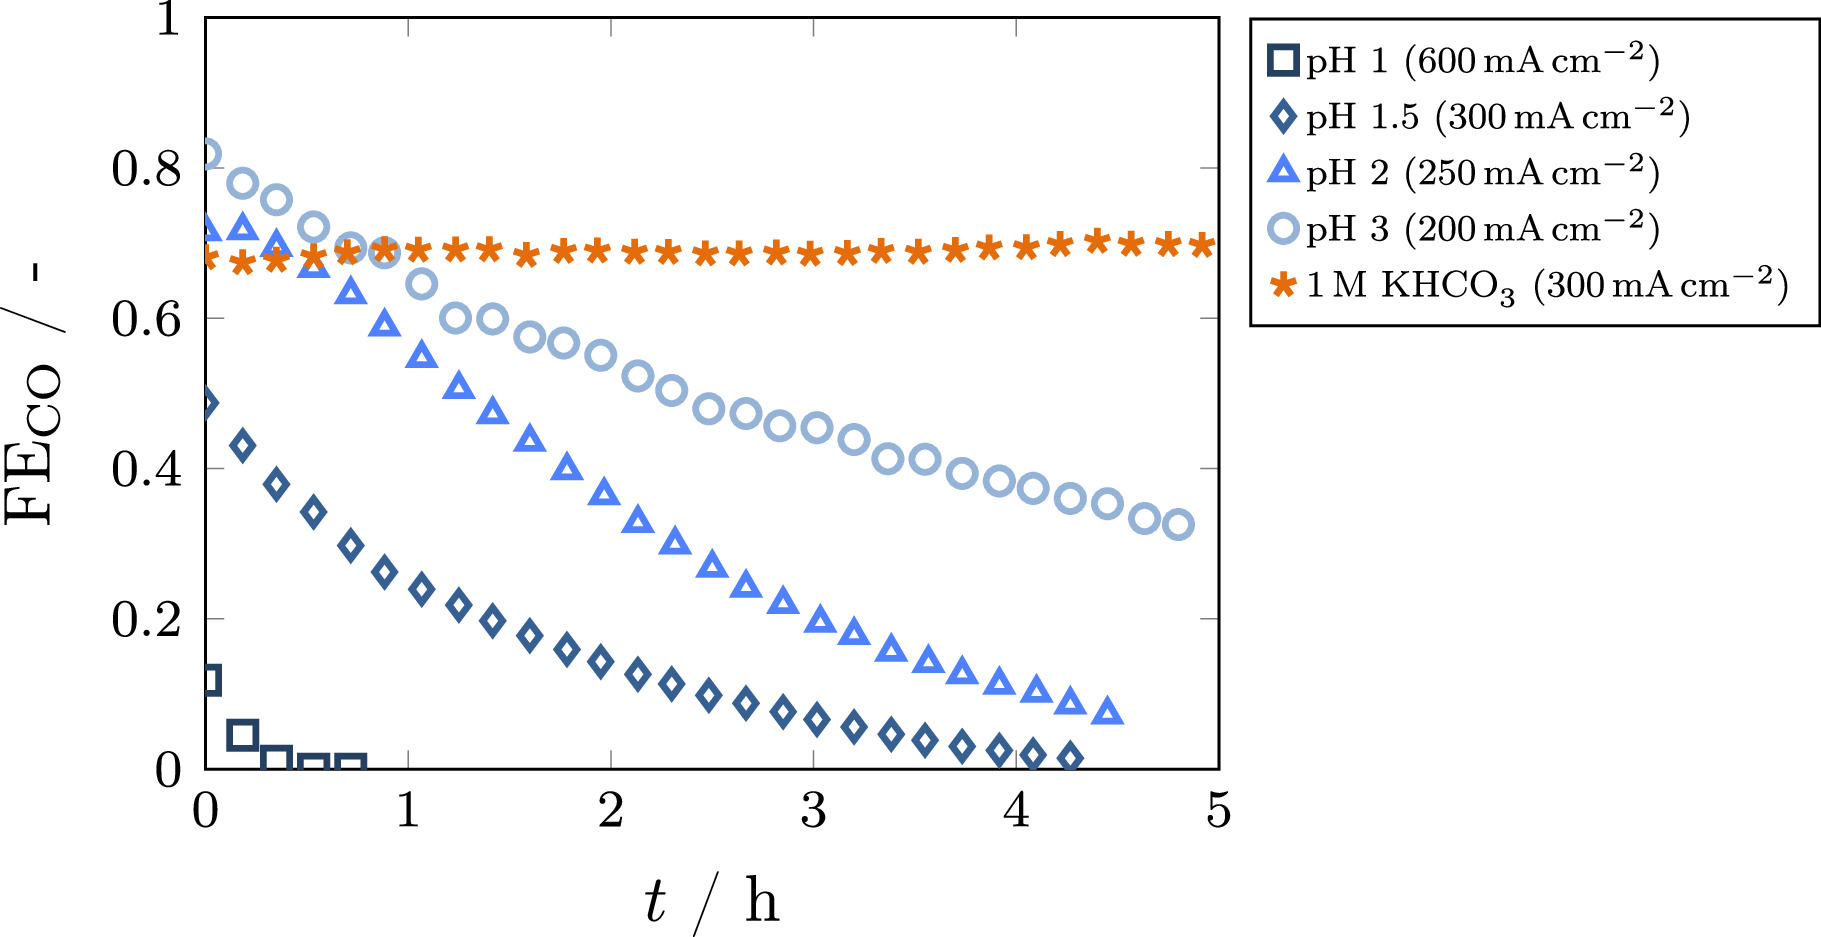
Figure 3. Faradaic efficiency over time for different bulk electrolytes (K2SO4 at pH 1–3 and 1 M KHCO3). The current density at which the highest initial Faradaic efficiency has been observed in the respective electrolyte (see Fig. 2) is shown.
Download figure:
Standard image High-resolution imageCarbon efficiency
The experimental results for the carbon efficiency are given in Fig. 2(right). Due to the measurement error associated with the outlet concentrations, the carbon efficiency is only given for current densities ≥200 mA cm−2. As relatively small deviations in the concentration of CO2 have to be measured for the determination of carbon efficiency (see Eq. 7), the corresponding signal-to-noise ratio becomes too high when measuring at lower current densities at which the amount of consumed CO2 is small.

The measured values show a clear trend toward higher carbon efficiencies with increasing acidity. Especially for pH 1.5 and 2, a significantly higher carbon efficiency was observed when compared to the reference case of 1 M KHCO3. An increase in carbon efficiency without Faradaic efficiency being affected is in line with literature findings for other CO2RR catalysts like Cu 33 and SnO2. 34 This phenomenon can be explained by the effect of the acidic bulk electrolyte on the local pH in the electrode. Fast transport of protons from the bulk can prevent excessive alkalinization, impeding the formation of bicarbonate and carbonate according to Eqs. R7 and R8. This effect is discussed in detail in the model results section. A similar effect can be provided by the buffering effect of KHCO3, but only at low current densities before the buffering capacity is surpassed. 39 For the most acidic electrolyte at pH 1, the carbon efficiency is much lower at 200–300 mA cm−2 as result of the low rate of CO production in the strongly acidic environment. Even at higher current densities, the carbon efficiency does not surpass the values for pH 1.5 caused by fast degradation of the electrode and overall low Faradaic efficiency.
Additionally, the utilization of acidic electrolytes is advantageous due to a decrease in overall cell voltage (see Fig. SI 3). This results from the higher conductivity of acidic electrolytes, lowering the Ohmic losses in the electrolyte chambers between membrane and electrodes. A beneficial effect of acidic electrolytes on the cell voltage has also been reported for CO2RR on Au GDEs by Monteiro et al. 31 As the flow cell used in the experiments is not optimized with regard to small electrolyte gaps, these Ohmic losses significantly contribute to the cell voltage, limiting the maximum achievable current density within the compliance voltage of the potentiostat. This limit is extended by employing better conducting acidic electrolytes, which is also the reason why higher current densities were investigated in these cases.
Model results
Faradaic efficiency
The experimental data shown in Fig. 2 is used to validate the model regarding the Faradaic efficiency in dependence of current density for different bulk pH values in the range of 1.5 to 3, as well as 1 M KHCO3 as a reference (Fig. 4). These measurements have been performed using a fresh GDE for each current density, minimizing degradation effects to enable an accurate validation of the steady-state model. Therefore, pH 1 is not used for model validation as the electrode performance shows rapid degradation for this case (see Fig. 3). As the model has already been validated for 1 M KHCO3 electrolyte, 39 only two parameters majorly affecting the Faradaic efficiency in acidic bulk electrolytes are estimated to fit the model to the experimental data – specifically, the thickness of the stagnant electrolyte film zeb which directly corresponds to the amount of protons transported to the electrode surface, and the mass transfer resistance factor qb accounting for a changing mass transport behavior at elevated current densities. Besides these, the Faradaic efficiency is majorly affected by the kinetic parameters of the electrochemical reactions. However, these have already been determined in other studies. Therefore, this work uses the parameters from the original model 39 for CO2RR and alkaline HER as well as the parameters from Weng et al. 44 for acidic HER to minimize the number of unknown parameters. The influence of the parameters for acidic HER is shown in Fig. SI 5.
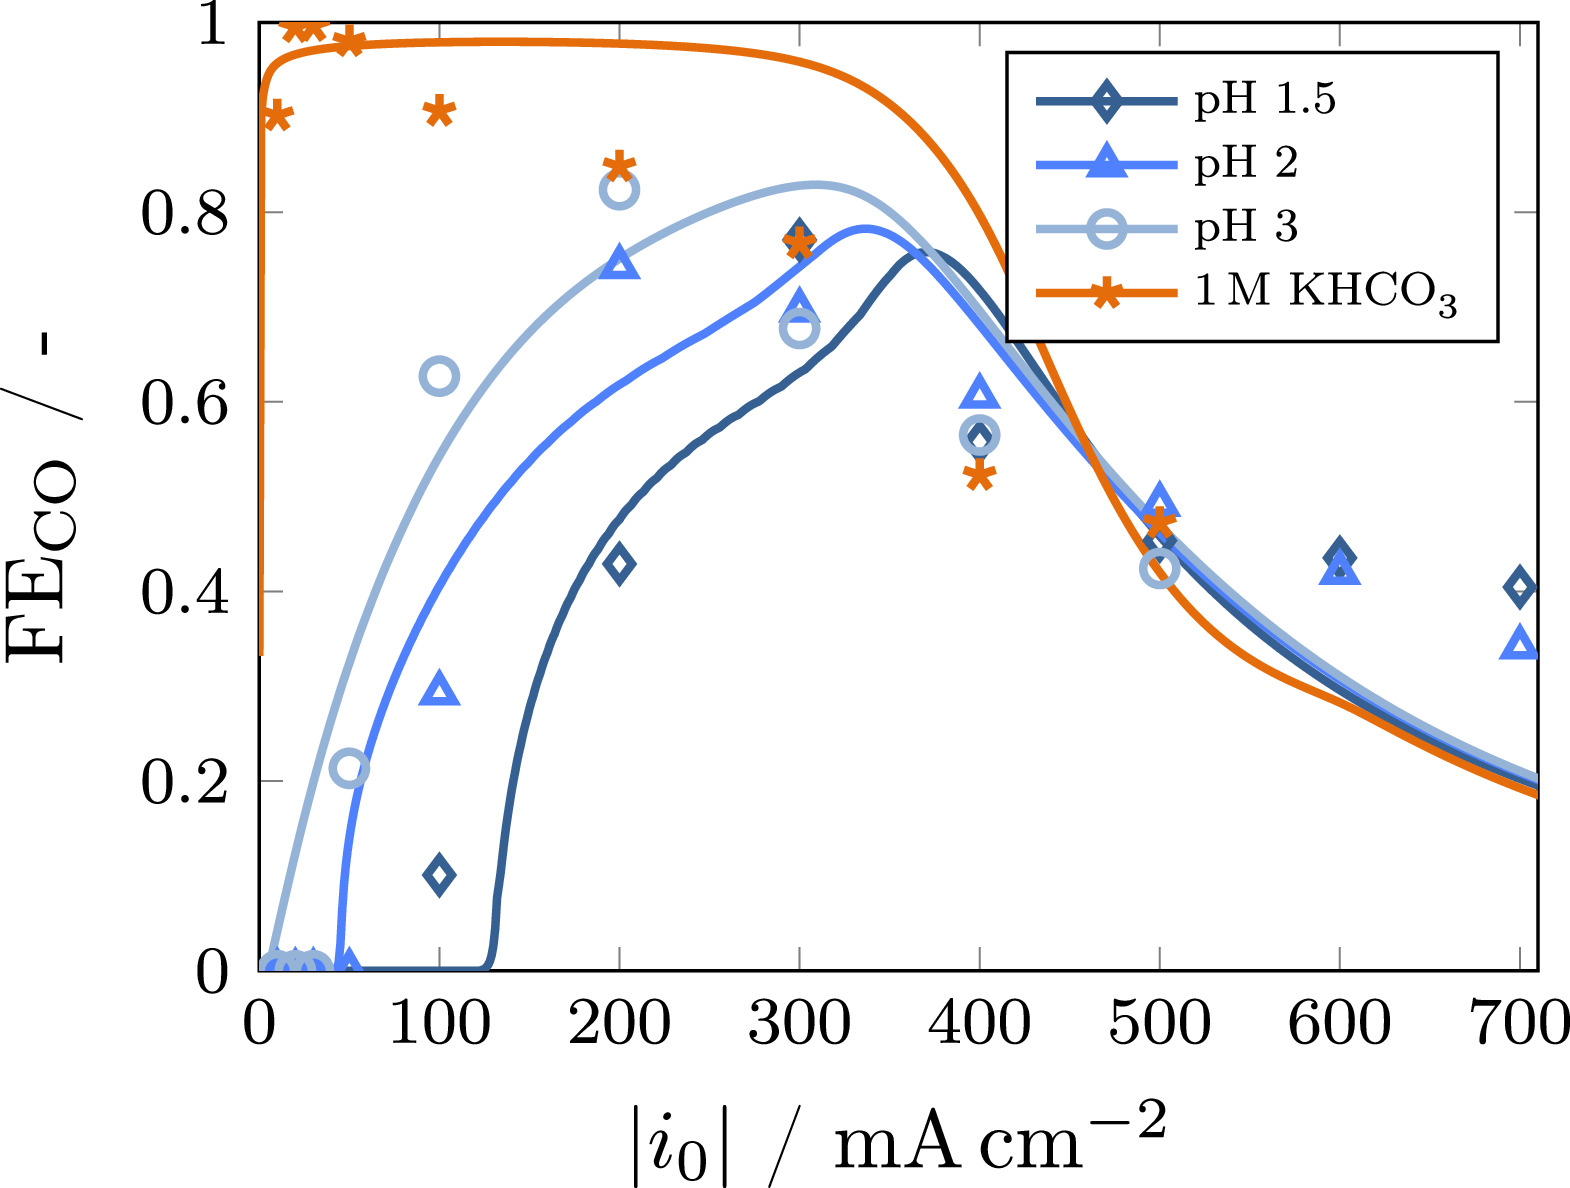
Figure 4. Model results (lines) for the Faradaic efficiency in dependence of current density using different bulk electrolytes (K2SO4 at pH 1.5–3 and 1 M KHCO3) in comparison to the experimental data shown in Fig. 2 (symbols). The estimated parameters are given in Table IV.
Download figure:
Standard image High-resolution imageWith the estimated parameters summarized in Table IV, model and experimental results agree reasonably well. Clearly, three regimes can be identified as shown in Fig. 5. At low current densities, the local H+ concentration in the electrode is high, causing acidic HER to dominate. When raising the current density, protons are consumed and the local pH increases. In this range, CO2RR is the dominant electrochemical reaction. Further elevation of the current density leads to CO2 mass transport limitation and alkaline HER becomes predominant. The shift between these regimes strongly depends on current density and bulk electrolyte pH, which has also been demonstrated by Kim et al. 49 Figure 4 shows that the shift from acidic HER to CO2RR occurs at higher current densities with lower pH, as the amount of available protons increases. For the same reason, the maximum Faradaic efficiency for CO is reached at higher current densities. This behavior is very well described by the model. Beyond this maximum, the Faradaic efficiency is no longer depending on the bulk pH as the local pH is highly alkaline (see Fig. 5) and the processes within the electrode are governed by mass transport limitations. Similar results were obtained for Cu electrodes by Huang et al. 33 with a simplified reaction-diffusion model, showing that the local pH in the GDE is converging toward the same value at high current density regardless of bulk pH. For current densities above 500 mA cm−2, the Faradaic efficiency is slightly underestimated by the model. This probably results from the simplified approach for the description of several effects leading to CO2 mass transport limitations by the constant mass transfer resistance factor qb. 39 The resulting value (qb = 4.2) highlights the importance of these limitations, which may be attributed to the formation of droplets or crystals on the gas side of the GDE. 39,50 However, the value is lower than the one obtained for 1 M KHCO3 electrolyte at varying CO2 feed concentrations, 39 suggesting that these limitations become more impactful when the CO2 availability is already lower due to dilution of the gas feed. A comprehensive analysis of how the mass transfer resistance factor impacts the Faradaic efficiency is given in the supporting information (Fig. SI 4).

Figure 5. Faradaic efficiency for all electrochemical reactions in dependence of current density (left) and local pH as a function of the dimensionless position in the reaction layer of the GDE at different current densities (right) for a bulk pH of 1.5. Three regimes can be identified: At low current densities, the local pH is acidic and hydrogen evolution via proton reduction dominates (Regime A). With increasing current density, the pH becomes more alkaline, causing CO2RR to take over (Regime B). At high current densities, CO2RR becomes hindered by CO2 mass transport limitations, resulting in decreasing FE (Regime C).
Download figure:
Standard image High-resolution imageTable IV. Overview of model parameters obtained by fitting the model to experimental data (see Fig. 2) for the Faradaic efficiency.
| Parameter | Value | Unit | Description |
|---|---|---|---|
| zeb | 23.1 | μm | Thickness of the stagnant electrolyte film |
| qb | 4.2 | — | Mass transfer resistance factor |
Besides the mass transfer resistance factor, the thickness of the stagnant electrolyte film is of major importance to achieve a proper description of the experimental results by the model. It directly influences the transport of protons to the electrode and therefore the reaction rate of the acidic HER which depends on the local proton concentration (see Eq. 3). This correlation is shown in Fig. 6. The onset current density for CO2RR increases as the concentration of protons in the electrode rises with decreasing film thickness, favoring HER. In order to represent the experimental behavior, a rather thin film of 23.1 μm is predicted by the model. This can be understood by having a detailed look at the local H+ concentration in the electrolyte film (see right side of Fig. 6). Assuming a film thickness of 100 μm, the protons are already fully depleted at a current density of 50 mA cm−2, resulting in a steeper increase of the Faradaic efficiency for CO because the rate of acidic HER becomes limited by proton availability. The predicted film thickness is slightly lower than values predicted in literature, typically around 100 μm. 51–53 However, there is evidence that the boundary layer thickness can be decreased by changing the experimental conditions. 52 The conditions used in this work favor the formation of a very thin stagnant film, as the electrolyte flow rate is very high (see Table I). Additionally, the turbulence of the electrolyte flow is further increased by turbulence promoters and the high rate of bubble formation. Considering this, the value reported here is reasonable. For a more precise estimation of the boundary layer thickness, a computational fluid dynamics simulation of the flow through the electrolyte compartment of the cell would be necessary, which is beyond the scope of this work.
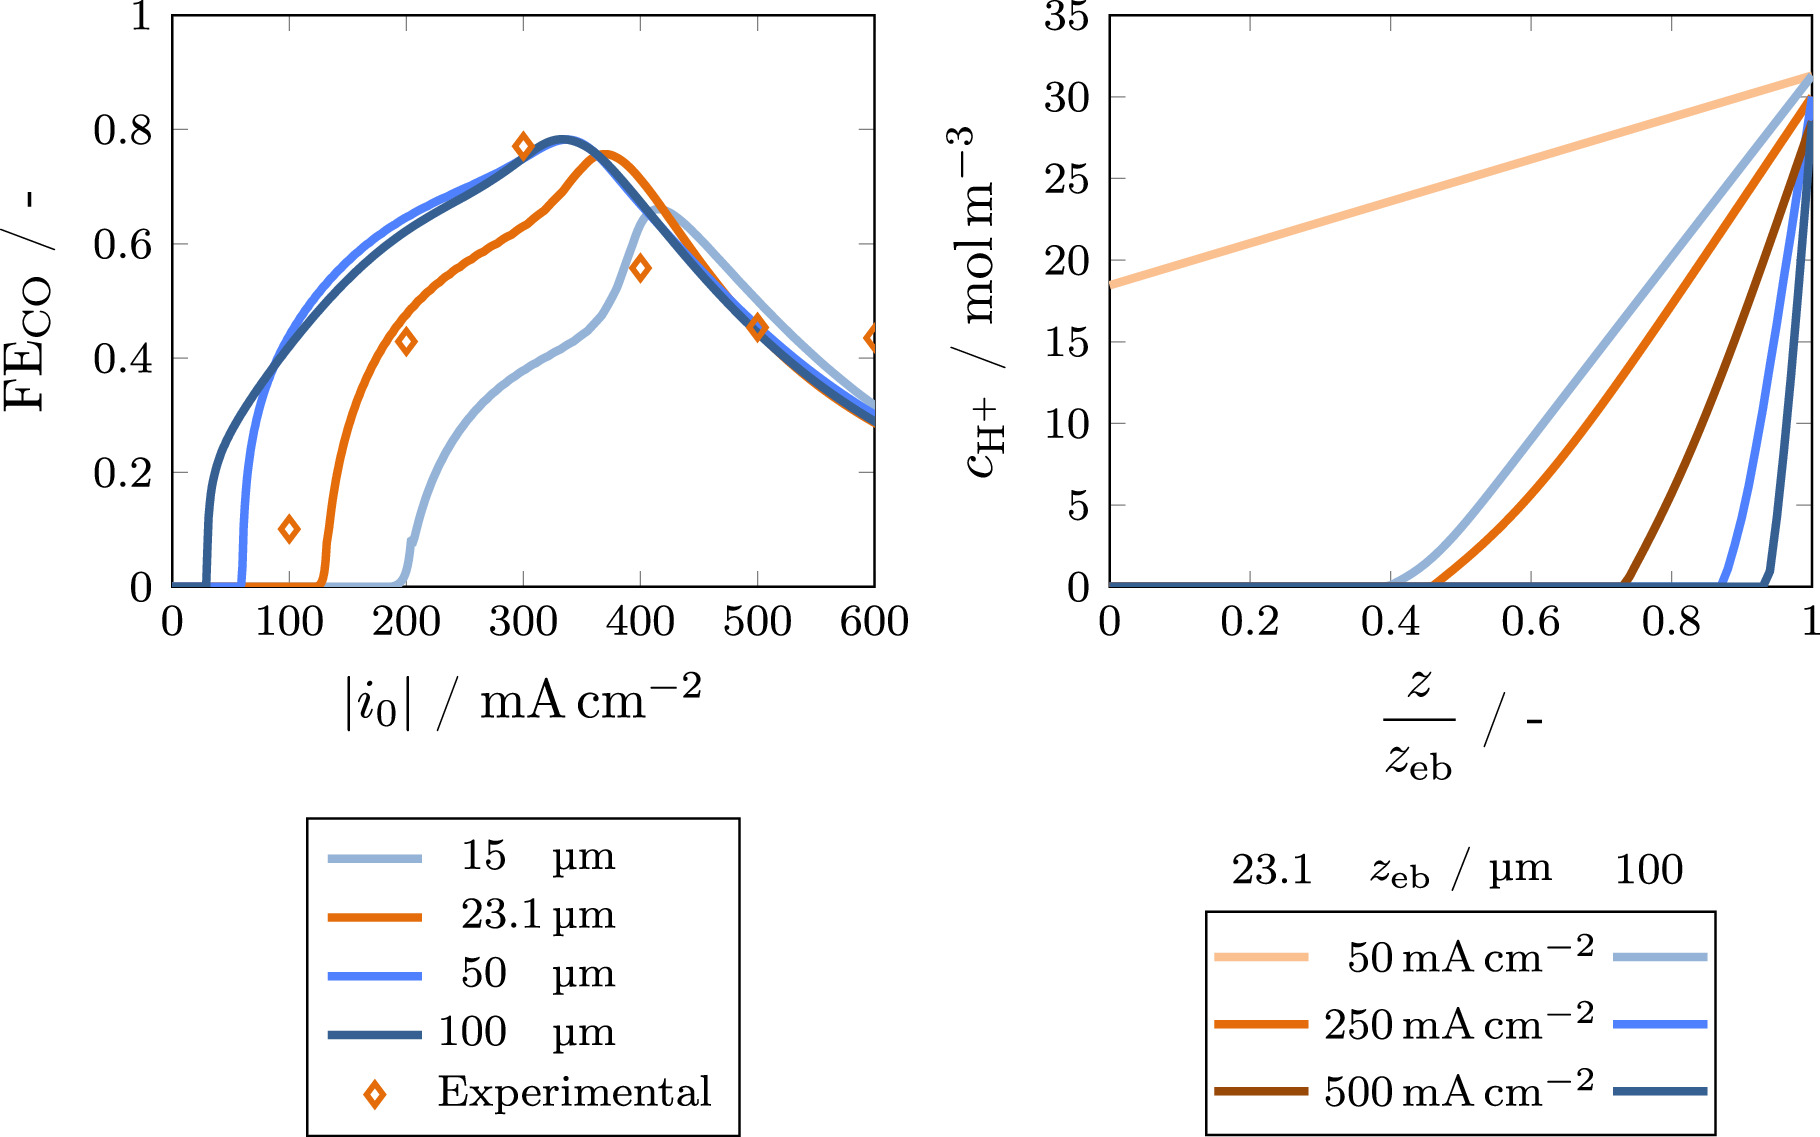
Figure 6. Influence of the stagnant electrolyte film thickness on the Faradaic efficiency (left) and local H+ concentration as a function of the dimensionless position in the electrolyte film for a film thickness of 21.3 μm and 100 μm (right) at a bulk pH of 1.5. The experimental data for the Faradaic efficiency is shown as a reference.
Download figure:
Standard image High-resolution imageWhile experimental data and model results agree well for acidic electrolyte, there is a deviation for the 1 M KHCO3 electrolyte when using the estimated set of parameters (see Fig. 4). Especially in the range from 100 to 400 mA cm−2, the Faradaic efficiency for CO is overestimated by the model. This is probably caused by an overestimation of the CO2 supplied to the electrode from bicarbonate in the electrolyte. Due to the very thin electrolyte film, this amount is higher than reported in previous work on 1 M KHCO3. 39 Consequently, there is a second source of CO2 besides the gas side supply. However, the mass transfer resistance factor qb only affects the gas side supply. Similar effects, such as blocked pores and channels, 50 will also affect the transport of CO2 supplied from the electrolyte within the electrode. As this effect is neglectable for electrolytes not containing bicarbonate, such as the acidic K2SO4 electrolytes used in this work, these differences cannot yet be captured by the model with the same set of parameters.
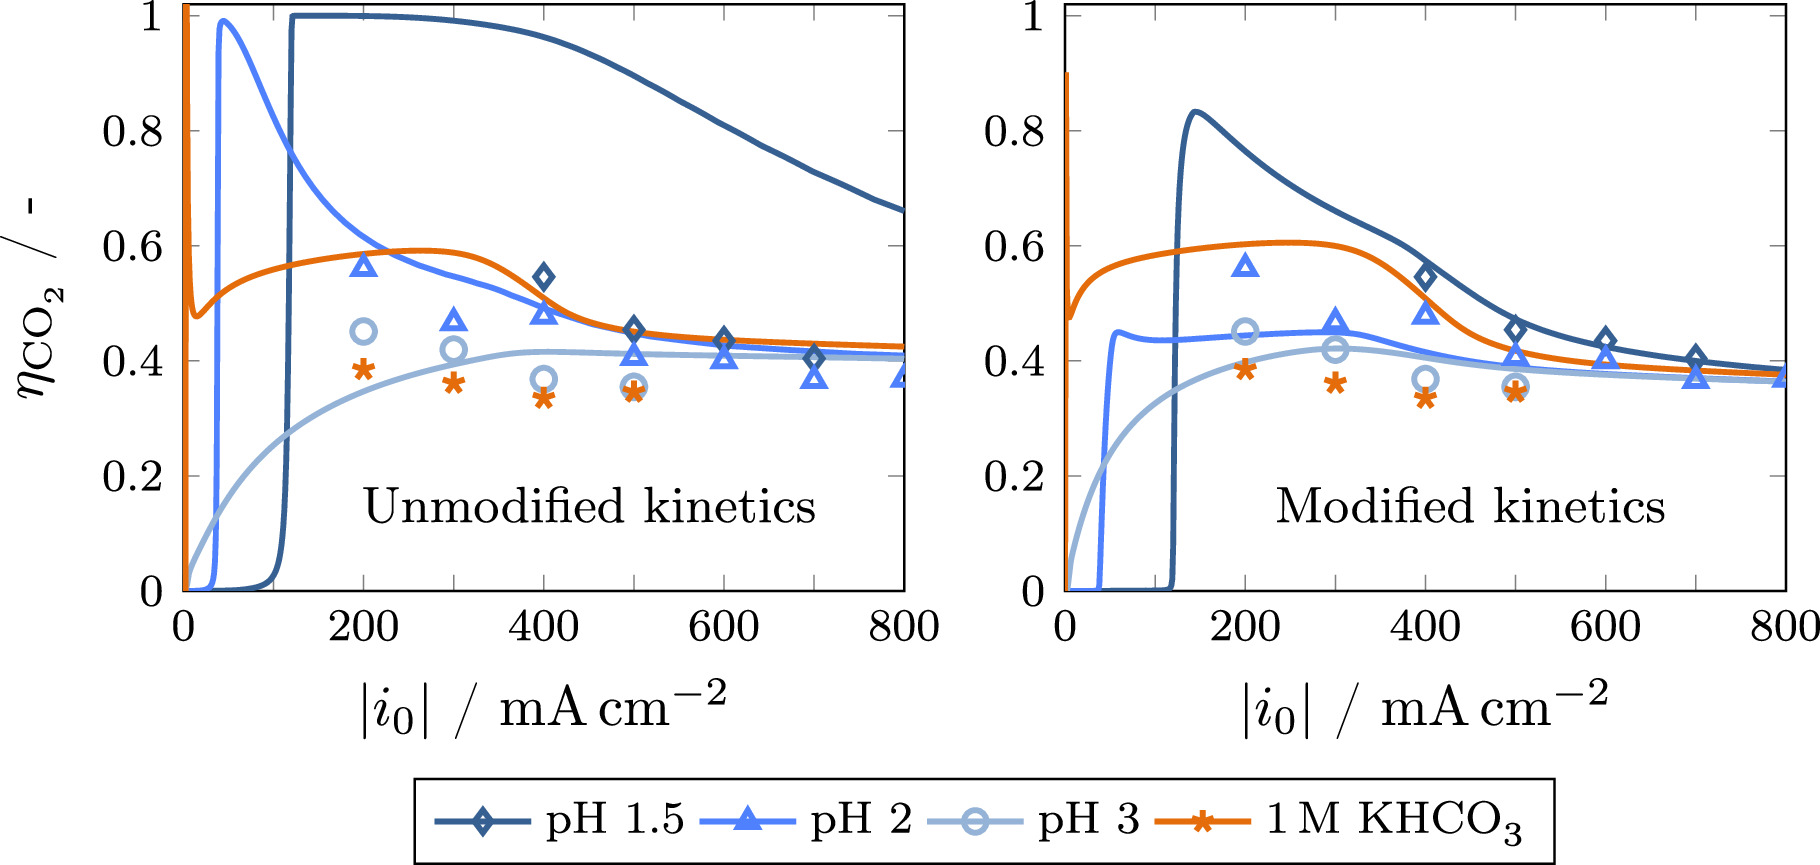
Carbon efficiency
The carbon efficiency shows a weak dependence on the parameters discussed before in the investigated current density range, especially for acidic electrolytes (see Fig. SI 6), and is therefore regarded separately. The left side of Fig. 7 shows the model results for the carbon efficiency in dependence of current density and pH. Clearly, the carbon efficiency in highly acidic electrolyte (pH = 1.5) is overestimated by the model. As the carbon efficiency is directly correlated to the equilibrium of CO2 reacting to bicarbonate, 18,44 a detailed investigation of this interdependence is beneficial to understand the deviations between experimental and model results.
Figure 7. Calculated carbon efficiency (lines) in dependence of current density using different bulk electrolytes (K2SO4 at pH 1.5–3 and 1 M KHCO3) in comparison to the experimental data shown in Fig. 2 (symbols). The results using the correlations by Schulz et al. 54 (left) are compared to the results using modified kinetic parameters given in Table V, which have been obtained by fitting the model to the experimental data (right).
Download figure:
Standard image High-resolution image
Most eCO2R models in literature use the correlations published by Schulz et al.
54
to calculate the rate and equilibrium expressions of the homogeneous reactions.
39,51,53,55–63
However, these have been obtained experimentally in seawater at varying NaCl concentrations.
54
The validity of this data in typical eCO2R electrolytes (mostly KHCO3 or KOH) and in acidic electrolytes is unknown, as very high local concentrations of carbonate, bicarbonate and hydroxide ions can occur in this system at elevated current densities. To the best of our knowledge, there are no kinetic investigations available at these conditions. As the effect of these kinetic parameters on Faradaic efficiency and potential is minor, especially in the case of commonly applied buffer electrolytes (see Fig. SI 10), the parameters obtained by Schulz et al.
54
are a reasonable approximation in most scenarios. Nonetheless, the shift of equilibrium has a major effect on carbon efficiency depending on the choice of electrolyte.
44
According to expectations, the most influential constants include the rate and equilibrium constants of reaction R4 (CO2 to  via H+), the rate constant of reaction R7 (CO2 to
  via OH−) and the equilibrium constant of reaction R6 (autoprotolysis of water). A detailed analysis of the influence of all constants on the carbon efficiency is given in the supporting information (Figs. SI 7 and SI 8).
Modifying the aforementioned parameters allows for an accurate representation of the experimental data for acidic electrolytes (see right side of Fig. 7). This is accomplished by fitting the model to the data with the resulting constants given in Table V. Compared to the values from the correlations by Schulz et al., 54 reaction R4 is significantly slower, while the rate of reaction R7, which is the dominant route for CO2 reacting to bicarbonate at elevated current densities, is approximately doubled. Furthermore, the equilibrium of reaction R4 is shifted toward bicarbonate. While this seems counterintuitive at first, the effect of the equilibrium shift is mitigated by the slower reaction rate. Additionally, the equilibrium of water autoprotolysis is shifted toward water. These findings highlight the importance to experimentally determine rate and equilibrium constants of the homogeneous reactions in the actual electrolytes used in eCO2R to enable a proper assessment of carbon efficiency by mathematical modeling.
Table V. Forward rate constants and equilibrium constants for homogeneous reactions at a temperature of 25 °C. The values obtained by fitting the model to the experimental data (see Fig. 7) are compared to the values published by Schulz et al. 54 Only the parameters with major influence have been modified.
| Reaction | Schulz et al. 54 | Fit value | Unit |
|---|---|---|---|
| Forward rate constants kf,j | |||
| EQ1 (R4) | 0.037 | 0.0051 | s−1 |
| EQ2 (R5) | 20.586 | s−1 | |
| EQ3 (R6) | 1.4 | mol m−3 s−1 | |
| EQ4 (R7) | 7.442 | 16.742 | m3 mol−1 s−1 |
| EQ5 (R8) | 6 | 106 m3 mol−1 s−1 | |
| Equilibrium constants Kj | |||
| EQ1 (R4) | 1.068 | 2.885 | 10−3 mol m−3 |
| EQ2 (R5) | 4.117 | 10−7 mol m−3 | |
| EQ3 (R6) | 10.714 | 2.18 | 10−9 mol2 m−6 |
| EQ4 (R7) | K1/K3 | ||
| EQ5 (R8) | K2/K3 | ||
Figure 7 shows that the carbon efficiency for 1 M KHCO3 electrolyte is not accurately described by the model, regardless of the kinetic parameters chosen. While the experiments clearly show a lower carbon efficiency compared to acidic electrolytes, a higher carbon efficiency is predicted by the model, especially at current densities up to 400 mA cm−2. This behavior can be attributed to a couple of superimposing factors: Firstly, the Faradaic efficiency in this current density range is overestimated, as explained earlier. Consequently, the inflated CO production rate results in a higher carbon efficiency. Moreover, the thin boundary layer in combination with the assumption of a constant concentration in the free electrolyte causes an oversupply of bicarbonate to the electrode, shifting the equilibrium of reactions R4 and R7 toward CO2 and therefore increasing carbon efficiency. An additional effect not well represented by the model may be differences in flooding behavior of the GDE between different electrolytes. As the modeling approach used for the determination of the electrolyte distribution relies on data from synchrotron radiographies. 39,43 As these are only available for the reference case, a more accurate adaption to the respective electrolytes is not possible at this time. The aforementioned factors show that the disparity between a neutral buffer electrolyte, such as potassium bicarbonate, and acidic electrolytes cannot yet be adequately represented by the model, resulting from a combination of model assumptions and the difference in buffer capacity.
Conclusions
In this study, eCO2R at silver GDEs in acidic electrolyte environment was investigated experimentally, focusing on Faradaic and carbon efficiency. For acidified 0.5 M K2SO4 electrolyte at pH levels ranging from 1.5 to 3, a significant increase in carbon efficiency was observed in comparison to the conventionally employed 1 M KHCO3 electrolyte. Concurrently, the choice of electrolyte had no impact on the Faradaic efficiency. Moreover, the higher conductivity of the acidic electrolytes results in a significantly lowered cell potential. Nonetheless, the usage of acidic electrolytes comes with the drawback of strong electrode degradation, especially at very low pH.
A mathematical model was adapted to account for the acidic environment. The model was validated using the experimental data and subsequently applied to analyze local effects that are experimentally unavailable, particularly the local pH. The model results demonstrate that the electrode behavior can be categorized into three distinct regimes depending on current density. At low current densities, only acidic HER occurs as a result of the acidic environment. In the medium current density range, a shift toward CO2RR is evident as hydroxide generated in the electrochemical reactions increases the local pH within the GDE. At high current densities, the behavior across all bulk pH values converges toward the same characteristics, with the local pH being highly alkaline, while CO2RR becomes increasingly limited by CO2 mass transfer. The model results also assist the understanding of the increased carbon efficiency when using acidic electrolytes, as the alkalinity in the electrolyte boundary layer is decreased, mitigating carbonate formation. Furthermore, the model insights highlight the need to reexamine the kinetics of the carbonate equilibrium in conditions as they are present in eCO2R to accomplish a proper assessment of the carbon efficiency by mathematical models.
Although GDE stability still needs to be improved, these results demonstrate how acidic electrolytes are an effective tool to address the issue of low carbon efficiency, which is one of the major challenges in eCO2R.
Acknowledgments
The authors thank the Covestro Deutschland AG and the German Research Foundation (DFG) within the frame of the research unit "Multi-scale analysis of complex three-phase systems: oxygen and CO2 reduction" (FOR 2397) for funding this study.
Supplementary data (1.7 MB PDF)