

Abstract
Foreign particles unintentionally embedded in the membrane electrolyte assembly may be detrimental to polymer electrolyte fuel cell durability by dissolution of contaminants or puncture of the membrane. The presence of incidental particles may also affect the fuel cell production cost by imposing more stringent and costly quality control equipment and cleanroom facilities to the manufacturers. The present work aims to understand the impact of foreign particles deposited at the membrane—catalyst layer interface on the decal transfer process and the quality of the resulting catalyst coated membrane. Additionally, this work explores process related opportunities to mitigate material damage from said particles. Several samples are fabricated by specifically placing representative silica particles on the membrane surface subsequently laminated with catalyst layer using different decal transfer procedures. Non-destructive 3D X-ray computed tomography reveals that the model particles substantially penetrate the membrane during regular decal transfer conditions, leading to a vulnerable membrane state or even complete puncture. However, a tuned decal transfer method with modified pressure application rate and optimized supporting layers is shown to reduce membrane damage up to 69%. Additionally, finite element modeling shows that the tuned method can reduce membrane stress during fuel cell operation and thus benefit durability.
Export citation and abstract BibTeX RIS

This is an open access article distributed under the terms of the Creative Commons Attribution 4.0 License (CC BY, http://creativecommons.org/licenses/by/4.0/), which permits unrestricted reuse of the work in any medium, provided the original work is properly cited.
Polymer electrolyte fuel cells (PEFCs) are a promising solution to reduce greenhouse gas emissions in the transportation sector. Although fuel cells have historically been more costly than incumbent internal combustion engines, the cost per kW is expected to decrease considerably with increasing production volume as the commercialization and implementation of fuel cell electric vehicles progresses. 1,2 For heavy duty vehicle applications, hydrogen fuel cells have been projected to reach cost parity with diesel and eventually become the most economical option based on the total cost of ownership. 3
According to the United States Department of Energy, cleanrooms and quality control equipment are responsible for a considerable portion of the total costs of fuel cell production. 4 This equipment is designed to detect fuel cell components defects that can potentially result in reduced performance or lifetime of the system and to do this, an extensive list of equipment and measures needs to be implemented. 5 Furthermore, the disposal of defective products imposes an additional production cost. By gaining an understanding of the harmful non-uniformities, manufacturers can reduce costs by targeting specific processes and optimizing inspection techniques to minimize the occurrence of such defects.
The membrane electrolyte assembly (MEA) is the key component of a fuel cell and usually consists of a catalyst coated membrane (CCM) sandwiched between two gas diffusion layers (GDL). There are two main approaches to fabricating CCMs: direct coating and decal transfer. In the direct coating method, the catalyst layer is applied directly onto the membrane in the form of an ink. This method is relatively fast and suitable for high-throughput CCM fabrication. However, polymer membranes tend to absorb the catalyst ink solvent and swell or wrinkle during the process. 6 Addressing this issue is possible at the lab-scale fabrication level by mechanically constraining the membrane or modifying the solvent, 7,8 but it tends to be impractical on an industrial scale and many manufacturers therefore opt to use the decal transfer approach. 9 In this method, the catalyst ink is first coated onto a decal substrate to form a catalyst coated film (CCF), to prevent direct contact of the membrane with the liquid solvent, then it is transferred to the membrane using a hot press. 10
Extensive studies on the procedure of catalyst decal transfer, substrate material, catalyst ink solvent and preparation, and other factors have enhanced the reliability of decal transfer and increased the transfer yield to over 95%. 11 This method has been shown to yield high power density fuel cells while being more robust against catalyst Pt content variations when compared to direct methods like roll-to-roll coating. 12–14 However, the membrane is a soft and thin polymer and experiences local stresses during the hot pressing method, 15 and as a result, pinholes, cuts, tears, and other defects can appear. Despite this, there are no dedicated studies reported in the literature on possible membrane damage or degradation resulting from decal transfer. Related works have investigated the effects of artificially created CCM subcomponent defects on fuel cell performance and durability. For example, Kreitmeier et al. showed that a pinhole of 10 μm diameter can elevate local membrane degradation and make adjacent regions fragile and vulnerable to mechanical stress. 16 In another study, Phillips et al. demonstrated that bare catalyst layer spots near the inlet can cause early membrane failure during stress cycling. 17 Similarly, Tavassoli et al. reported that certain CCM imperfections such as anode CL delamination or iron powder at the membrane-CL interface can increase the rate of membrane thinning. 18 Other related studies assessed performance implications of membrane casting irregularities 19 and pinholes 20 but did not address durability effects. The purpose of the present work is to improve the understanding of the interactions between foreign contaminants and the manufacturing process, with the goal of developing a robust MEA production method with reduced quality control requirements and cost. The specific objectives are to i) understand the impact of foreign particles on the CL decal transfer process and ii) improve the robustness of the decal transfer method in the presence of foreign particles. More specifically, this work investigates the impact of incidental solid foreign particles that may be found on the membrane surface or the CCF prior to hot pressing. In order to do this, silica microspheres were chosen as a representative of the particles that are significantly harder than MEA components and retain their shape during the fabrication and operation of the fuel cell. CCMs with purposely introduced silica microspheres (Si-M) are fabricated and several decal transfer methods and support materials are tested and imaged using a non-invasive 3D X-ray computed tomography (XCT) based inspection technique to analyze the impact on the fuel cell integrity and operation at the presence of the Si-M. In addition to experimental methods, a 3D finite element model based on constitutive relations for the membrane is developed to gain more insight into the mechanical effects of the particles.
Methodology
Materials
The CCM materials in this work are composed of industrially relevant reinforced membrane and anode and cathode catalyst layer materials with Pt/C catalyst particles and perfluorosulfonic acid (PFSA) ionomer. The polymer membrane is a GORE-SELECT® with a thickness of 15 μm, containing an expanded-PTFE reinforcement layer at its center, which increases its mechanical strength compared to its non-reinforced counterparts. In-house fabricated catalyst layers are uniformly coated on 127 μm PTFE film and are smooth; without any cracks. The cathode catalyst layer has a Pt loading of 0.4 mg cm−2 while the anode catalyst layer has a Pt loading of 0.2 mg cm−2 having thicknesses of 12 and 5 μm, respectively.
Materials used in the decal transfer procedure are 127 μm thick PTFE sheets, silicone rubber sheets with a thickness of 1.59 mm and 30 A durometer hardness, Grafoil flexible graphite sheets, and 3M 467 MP Kapton adhesive polyimide film. Two 25 μm Kapton adhesive films are attached together to have the 70 μm acrylic adhesive glue at the center with a total thickness of 120 μm.
60 μm silica microspheres manufactured by Corpuscular are selected as representative foreign particles in this work. The intent is that this material is representative of possible external objects that may deposit on the membrane or catalyst layer surfaces during CCM manufacturing and does not deform throughout the fabrication process due to being much harder than the other MEA components.
CCM preparation and inspection
Two different methods are followed to prepare the foreign particle laden CCMs. In the first method, the particles are placed on the cathode side of the membrane and then the cathode catalyst layer (CCL) is decal transferred onto the membrane followed by decal transferring the anode catalyst layer (ACL) to create the full CCM. This method is referred to as PCA throughout this article because of the fabrication order of particle-CCL-ACL. In the second method, the ACL is first decal transferred onto the membrane, followed by particles placement on the surface of the cathode side of the membrane and CCL decal transfer. Considering the implementation order of ACL-particle-CCL, this method is referred to as APC throughout this article. A third method, where the ACL, particles, and CCL are transferred onto the membrane simultaneously is also possible. However, considering the small-sized CCMs and the similarity of the contributing layers to the APC method, only the APC and PCA methods are tested in this work. All membrane samples have dimensions of 8 × 16 mm2 with five silica microspheres located on each membrane with a minimum separation distance of 500 μm to prevent possible confounding effects. The location of the particles inside the CCM and with regards to the test cell channels is shown in Fig. 1a. As the membrane damage occurs exclusively during the decal transfer process, the positioning of particles in relation to the channel and land locations does not impact the final result.
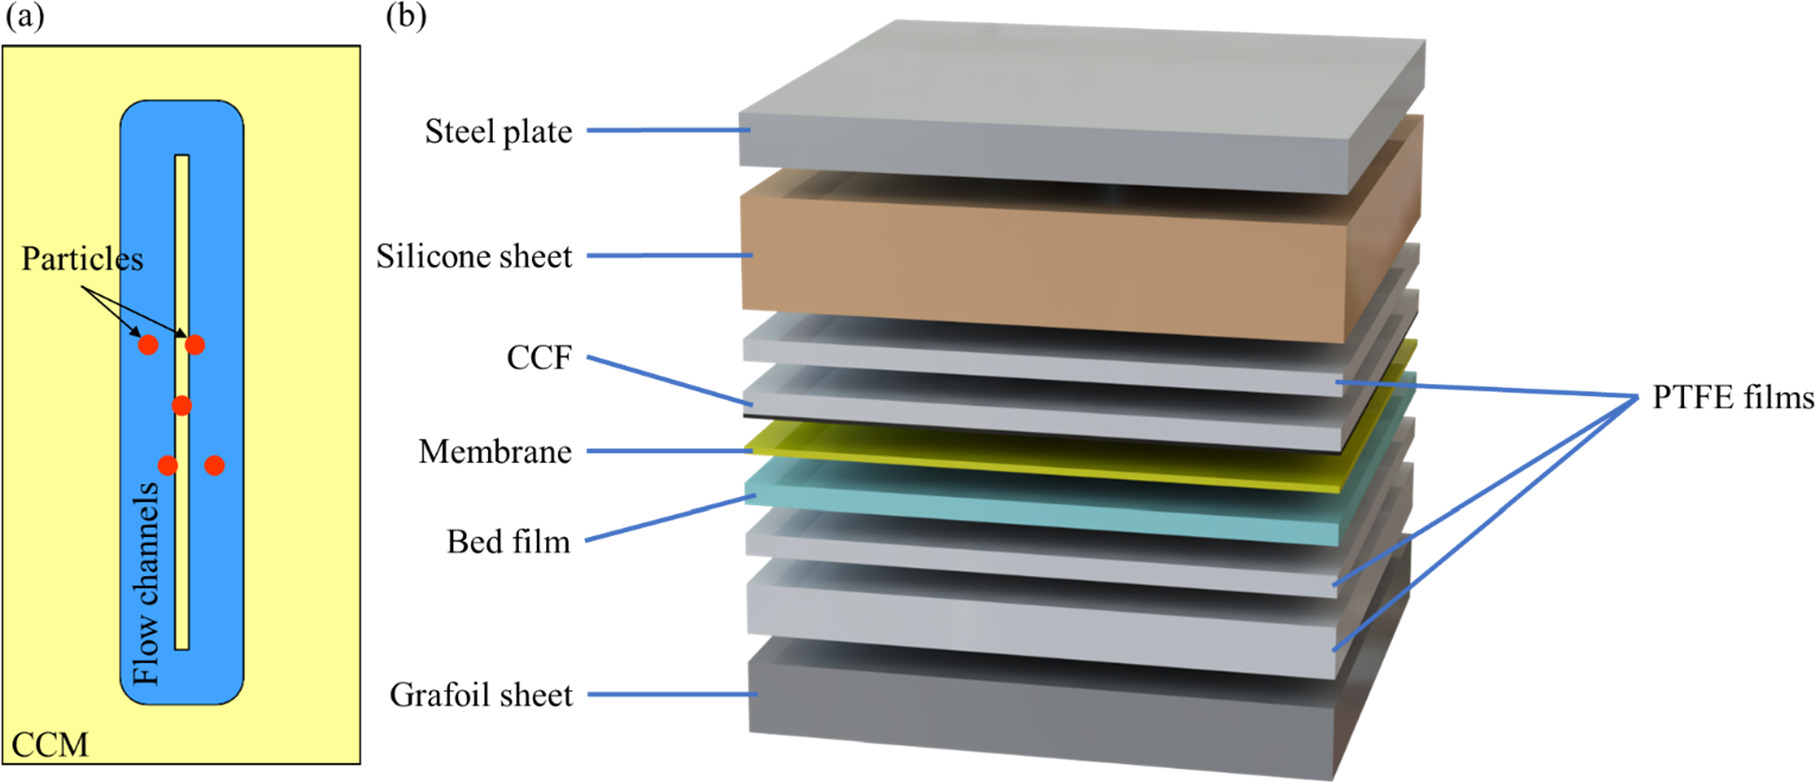
Figure 1. (a) The location of the particles with regard to the CCM and flow channels and (b) layers used during the decal transfer of CL (from the CCF) onto the membrane. Thicknesses are not to scale.
Download figure:
Standard image High-resolution imageThree different decal transfer procedures are used to apply the catalyst layer (CL) on the bare membrane. In each method, the bare membrane or the half-coated membrane is sandwiched between the catalyst coated film (CCF) and the bed material which can be a layer of 127 μm PTFE, Kapton adhesive double layer (KDL), or the original backing layer (OBL) that comes with the membrane. Next, these layers are placed between two PTFE films to facilitate the relative movement of the layers which may occur due to temporary dimensional changes during the hot press. Then they are covered with a silicone sheet in order to have uniform pressure distribution. All the layers are then sandwiched between a Grafoil sheet and a metal plate to ease the heat transfer and prevent sticking to the platens of the hot press. The arrangement of these layers is shown in Fig. 1b.
For all samples, the decal transfer is performed at 150 °C and ultimate pressure of 1.4 MPa, but the rates of pressure application are different. In rapid press mode, the pressure increases from zero to 1.4 MPa in less than two seconds whereas in the gradual press mode, the pressure increases gradually at the rate of 20 kPa s−1. After reaching the ultimate pressure in both methods, the sample remains under constant pressure for 180 s making the decal transfer with rapid pressure application take about 180 s and the one with gradual pressure application take about 250 s. A list of the samples being tested and the nomenclature used are shown in Table I.
Table I. Samples being tested and their corresponding abbreviation.
| Order | Particle-cathode-anode (PCA) | Anode-particle-cathode (APC) | |||
|---|---|---|---|---|---|
| Hot press rate | Rapid | Gradual | Rapid | Gradual | |
| Bed material | Original backing layer | PCA-R-OBL | PCA-G-OBL | — | — |
| PTFE | PCA-R-PTFE | PCA-G-PTFE | APC-R-PTFE | APC-G-PTFE | |
| Kapton double layer | PCA-R-KDL | PCA-G-KDL | APC-R-KDL | APC-G-KDL | |
To inspect the CCMs, they are clamped between two Sigracet 22BB GDLs to provide mechanical support and scanned using a ZEISS Xradia 520 Versa X-ray computed tomography (XCT) scanner. Given the high X-ray attenuation of the CLs and particles relative to the membrane, the CLs and particles are occasionally removed using adhesive tape to improve the resolution of the membrane at the particle regions. The preference for XCT over alternative visualization methodologies, such as electron microscopy, stems from its unique capability to render particles in 3D, enabling precise inspection of the membrane damage under the center of a given particle. This facilitates a detailed examination of the region exhibiting the highest degree of damage.
Fuel cell testing
In-situ fuel cell testing is performed using a custom small-scale fuel cell 21–23 and MEAs with an active area of 3 × 13 mm2. MEAs are prepared by sandwiching CCM between two GDLs and sealing them with adhesive polyimide film and PTFE film. More details about this procedure can be found elsewhere. 24 The cells are then tested mechanically for external and internal leaks by submerging the cell in water and applying an overpressure of 20 kPa to the anode and cathode, one by one, and measuring the amount of gas transfer at room temperature over the course of 10 min.
The cells that are tested electrochemically are conditioned prior to the testing in order to improve the performance of the CLs and the contact between the MEA components. This procedure is done by first applying five air starve cycles by flowing hydrogen and air for 2 min and then replacing the air with nitrogen while applying a 25 mA cm−2 load until the cell voltage drops below 0.2 V. This step is followed by 80 cyclic voltammetry scans from 0.1 to 1.2 V at the scan rate of 50 mV s−1 and continued with a 20 h steady state fuel cell operation under hydrogen/air at a constant load of 900 mA cm−2. 24
After conditioning, the fuel cell performance is characterized by measuring the polarization curve at a cell temperature of 70 °C and relative humidity of 100% under hydrogen and air flow rates of 0.3 and 0.6 slpm, respectively. Throughout the polarization recording, the current density is increased in steps of 25 mA cm−2 with 10 s stabilization at each step before measuring the stabilized cell voltage. The fuel cell is also characterized using electrochemical impedance spectroscopy (EIS), which is conducted at the same condition as for the polarization curve with a DC voltage of 0.45 V and a 10 mV AC perturbation with a frequency sweep from 75 kHz to 0.1 Hz.
Tensile test
The tensile stress-strain properties of the membrane material are characterized using a TA Instruments Q800 dynamic mechanical analyzer (DMA) equipped with a temperature-controlled sample chamber and a relative humidity control unit attachment. GORE-SELECT® membrane samples are cut into 2 mm strips in the transverse direction and mounted to the film tension clamp. The initial length of all specimens is set to 10 mm to provide a suitable aspect ratio for the samples to prevent stress concentration near the clamp. 25 After loading each specimen in the DMA, a small preload of 0.009 N is applied to eliminate initial slack and deformations due to temperature and humidity variations before the main test. Then, the temperature and humidity are set and upon reaching the desired test condition, a system dwell time of 30 min is used to reach equilibrium before applying tension. The tests are performed at three different temperatures (60 °C, 70 °C, and 85 °C) and two different engineering strain rates (0.1 and 0.01%/s). Additionally, a single test at 50 °C and strain rate of 0.1% to gain more data on the effect of lower temperature is performed. Relative humidity is kept constant at 60% as the membrane showed relative-humidity-independent behavior in the first tests which was also previously reported by Khattra et al. for GORE-SELECT® reinforced membranes. 26,27 The strain and stress results are averaged over three different tests in each condition to ensure statistical relevance.
Finite element model
An in situ finite element model of the fuel cell is used to predict the effect of the microsphere on the mechanical stress distribution inside the CCM throughout the cell assembly and operational environment of the fuel cell. The membrane is modeled as an elastic-viscoplastic material to capture the complex behavior of the components and semi-empirical relations are used to simulate the effect of cell compression. All simulations are conducted using COMSOL Multiphysics® employing PolyUMod® as the external solver for constitutive relations.
Constitutive relations
The polymer membrane used inside the fuel cell has a complex mechanical response due to the simultaneous effect of intermolecular and molecular network mechanisms. 28,29 The intermolecular mechanism is mostly effective under low strain where the deformation of polymer chains is still small, while at higher strain the molecular network effect dominates as the polymer chains start to deform and interact with each other. The current model is based on those previously used by Singh et al. 30 and Bergstrom and Boyce 31,32 with a few modifications to reduce the computational cost since it is being used in a 3D geometry. In these models, the material behavior is modeled by two interacting mechanisms with temperature and humidity dependent variables. Here, as in Singh's work, the intermolecular mechanism is modeled as a linear spring in series with a dashpot, and the network mechanism is modeled as a single linear elastic spring in parallel to the intermolecular mechanism. In the current model, the effect of temperature on the mechanical properties is reflected using a temperature adjustment function which will be explained later in this chapter. Furthermore, in order to align with the observations from tensile tests, the model's response is assumed to be unaffected by changes in relative humidity. In the remainder of this section, the parameters of the intermolecular and network mechanisms are denoted with A and B subscripts, respectively.
Considering the rheological representation of the model, the deformation in both mechanisms is equal, as shown in equation below:

Where F is the deformation matrix. The deformation in the intermolecular branch consists of the deformations of the linear elastic spring and the time-dependent dashpot and can be expressed as:

In which e and p superscripts indicate the elastic and plastic deformation of the network.
Since the elastic elements were assumed to be a linear spring, their stress can be calculated as:

In which μ is shear modulus, ε is strain, λ is Lame's constant, and δ is Kronecker delta which returns one if i and j are equal and zero otherwise.
While the response of elastic components is not time-dependent, the velocity gradient in the time-dependent component can be calculated using the derivation of its deformation matrix:

This velocity gradient is the result of plastic stretching and plastic spin. However, it can be assumed that the plastic spin is negligible compared to the stretching. Therefore:

The stretching rate is a function of the shear stress inside the material and can be calculated as:

Where  is the deviatoric stress tensor and
  is the Frobenius norm of it, whereas
  is the plastic flow and can be obtained using the Bergstrom-Boyce model:
32
is the plastic flow and can be obtained using the Bergstrom-Boyce model:
32

Where  is the chain stretch,
  is the stretch adjustment factor, C is the strain exponent,
  is the shear flow resistance, and m is the shear flow exponent.
  is the temperature adjustment function which is assumed to be in exponential form and can be expressed as:

Where q is the temperature scaling factor,  is the base temperature, and
  is the system working temperature. This equation is also used to predict the temperature effect on the elastic components by multiplying it by Eq. 3.
Having all the equations above, we can now calculate the plastic deformation of the material by combining Eqs. 5 and 6:

Since the effect of humidity is negligible on the mechanical response of the utilized reinforced membrane, the constitutive model does not have any dependency on the water content of the membrane. However, the effect of relative humidity on membrane swelling is seen using the simplified equation proposed by Kusoglu et al: 33

Where  is the system temperature,
  is the reference temperature which is 298 K in this simplified equation, and δ is the Kronecker delta.
  is the anisotropy ratio which is considered equal to 1/12 for in-plane directions,
  and
and  and 10/12 for through-plane direction as the reinforcement layer limits in-plane deformations.
33
and 10/12 for through-plane direction as the reinforcement layer limits in-plane deformations.
33
 is the volume fraction of the polymer which can be estimated using:

In this equation EW and  are the equivalent weight and density of the dry polymer, respectively, considered to be 1100 g mol−1 and 1.970 g cm−3 in this work. λ is the membrane water content defined as the number of water molecules per sulfonic acid group. This value can be obtained using the Brunauer–Emmett–Teller equation:
34
are the equivalent weight and density of the dry polymer, respectively, considered to be 1100 g mol−1 and 1.970 g cm−3 in this work. λ is the membrane water content defined as the number of water molecules per sulfonic acid group. This value can be obtained using the Brunauer–Emmett–Teller equation:
34

Where λm is the water loading at monolayer coverage, equal to 1.8,  is water activity, and n and C are model parameters defined to fit experimental data. Since the water uptake of the reinforced membrane was shown to be equal to the water uptake of non-reinforced membranes, the values of n and C are assumed to be 13.5 and 150, respectively.
35
is water activity, and n and C are model parameters defined to fit experimental data. Since the water uptake of the reinforced membrane was shown to be equal to the water uptake of non-reinforced membranes, the values of n and C are assumed to be 13.5 and 150, respectively.
35
Thermal strain is also estimated using a linear function:

Where T and T0 are the system and reference temperature, α is the thermal expansion coefficient, and δ is the Kronecker delta. Thermal expansion is assumed to be isotropic and therefore equal in all directions.
The material model is calibrated with experimental data obtained from the DMA at 60 °C and 85 °C using MCalibration® and the other measured data are used for model validation. The constitutive model response is able to confirm the experimental data with a root mean square deviation of less than 3% and a coefficient of determination of 0.996. Figure 2 shows the prediction of the model versus the real response of the material in the new conditions that were not used to calibrate the model. It can be seen that a good agreement is achieved in all cases. All model parameters are listed in Table II.

Figure 2. Membrane tensile true stress vs true strain data obtained from ex-situ experiment and model prediction. The model was calibrated with measured data at 60 °C and 85 °C and this plot shows how it is capable of predicting the material behavior under new conditions.
Download figure:
Standard image High-resolution imageTable II. Material properties of the membrane and CLs.
| Material | Material parameter | Value | Description |
|---|---|---|---|
| Reinforced membrane |

| 56 MPa | Young's modulus |

| 0.4 | Poisson's ratio | |

| −8.4 | Temperature factor | |

| 350 K | Reference temperature | |

| 0.5 | Strain adjustment factor | |

| −1.35 | Strain exponent | |

| 5.3 MPa | Shear flow resistance | |

| 3.7 | Shear flow exponent | |

| −9.7 | Temperature factor | |

| 350 | Reference temperature | |

| 34.6 MPa | Young's modulus | |

| 0.4 | Poisson's ratio | |

| −2.2 | Temperature factor | |

| 372 K | Reference temperature | |
| Catalyst layers |

| 30 MPa | Young's modulus |

| 0.3 | Poisson's ratio |
Model description
A 3D geometry is used to simulate the behavior of the cell as the dimensions of the spherical particle and its indentation on the membrane are not suitable for a 2D approximation. The model represents a single particle implanted at the membrane—cathode CL interface under the channel. However, by capitalizing on symmetry, only a quarter of the particle is physically implemented in the corner of the model domain, as shown in Fig. 3, spanning a half-channel/half-land region of the small-scale fuel cell used in this experiment. The depth of the model in the third dimension is merely 200 μm, which is wide enough to prevent the stress reflections from the edges while facilitating computational efficiency for the 3D model. The thickness of the respective MEA layers is according to their real thickness. The GDL is not physically included in the model, but its presence is simulated in the form of spring foundations on the surfaces of the CCM. The stiffness of the spring foundation is calculated using the non-linear mechanical response of the utilized GDL provided by the manufacturer and its compression after assembly is empirically obtained using an XCT image of the cell and implemented in the model as a pre-compressed spring foundation at the beginning of each simulation. This boundary condition is equivalent to a clamping force with fixed displacement that exerts a 0.95 MPa pressure on the MEA, similar to the real condition of the small-scale fuel cell. This type of loading allows the CCM to move freely in the horizontal direction, simulating a no-friction interface between the CCM and the GDL while increasing the stability and keeping the computational cost drastically lower compared to a contact simulation. The particle is also located at the center of the channel and is assumed to have no movement relative to the CCM. The model geometry as well as its boundary conditions are shown in Fig. 3. A tetrahedral mesh is employed with a finer structure near the microsphere. Different grid sizes are tested to obtain grid independency, and a mesh size of 150,000 elements is deemed sufficient.
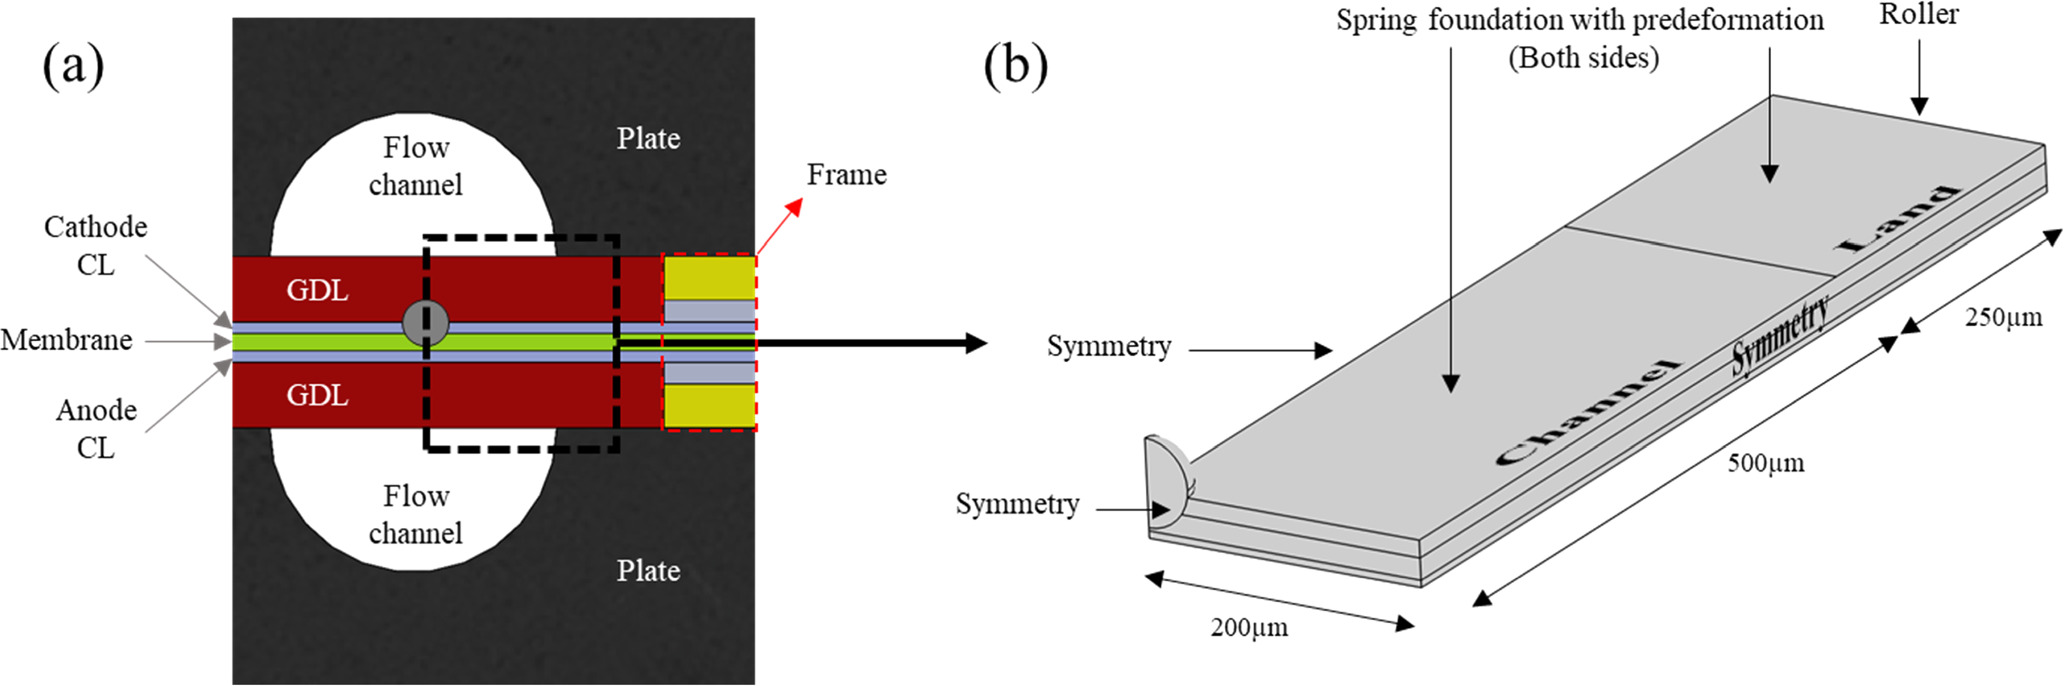
Figure 3. (a) Schematic of small-scale fuel cell with a particle in the MEA cross-section and (b) model geometry with its boundary conditions.
Download figure:
Standard image High-resolution imageSince the CCM experiences a high temperature during the decal transfer, it is assumed that there is no residual stress remaining inside the membrane. Therefore, the simulation starts from a relaxed condition where there is no internal stress in any of the CCM components. Throughout the simulation, the CCM goes into full compression in the first 10 s at a relative humidity of 30%. The cell then goes into a fully saturated state and dries after that to reach the fully dehumidified condition at the rate of 1.5%/s. The temperature of the model remains constant at 85 °C during the simulation.
Results and Discussion
Performance of regular MEAs without particles
The effect of pressure application rate on the quality of decal transfer for regular MEAs without microspheres as foreign particles is tested by comparing two single cells with CCMs fabricated using two different protocols of rapid (R-cell) and gradual (G-cell) pressure application. Since the bed material does not affect the overall pressure distribution or transfer quality for regular, smooth CCM materials, PTFE is used as a representative bed material for all regular MEAs. It is confirmed by visual inspection of the decal substrate after the fabrication that the transfer of both catalyst layers with both methods is almost perfect without any catalyst residuals remaining on the substrate. After assembly, mechanical leak test shows a negligible internal leak rate of 0.00 (±0.01) mL min−1 for both cells. In addition, using the CV data, the hydrogen crossover current density can be estimated to 2 mA cm−2 for pristine R-sample and 3 mA cm−2 for pristine G-sample as visible in Fig. 4a. The small difference in crossover current density is within the normal variability of the regular small-scale fuel cells used in this work.
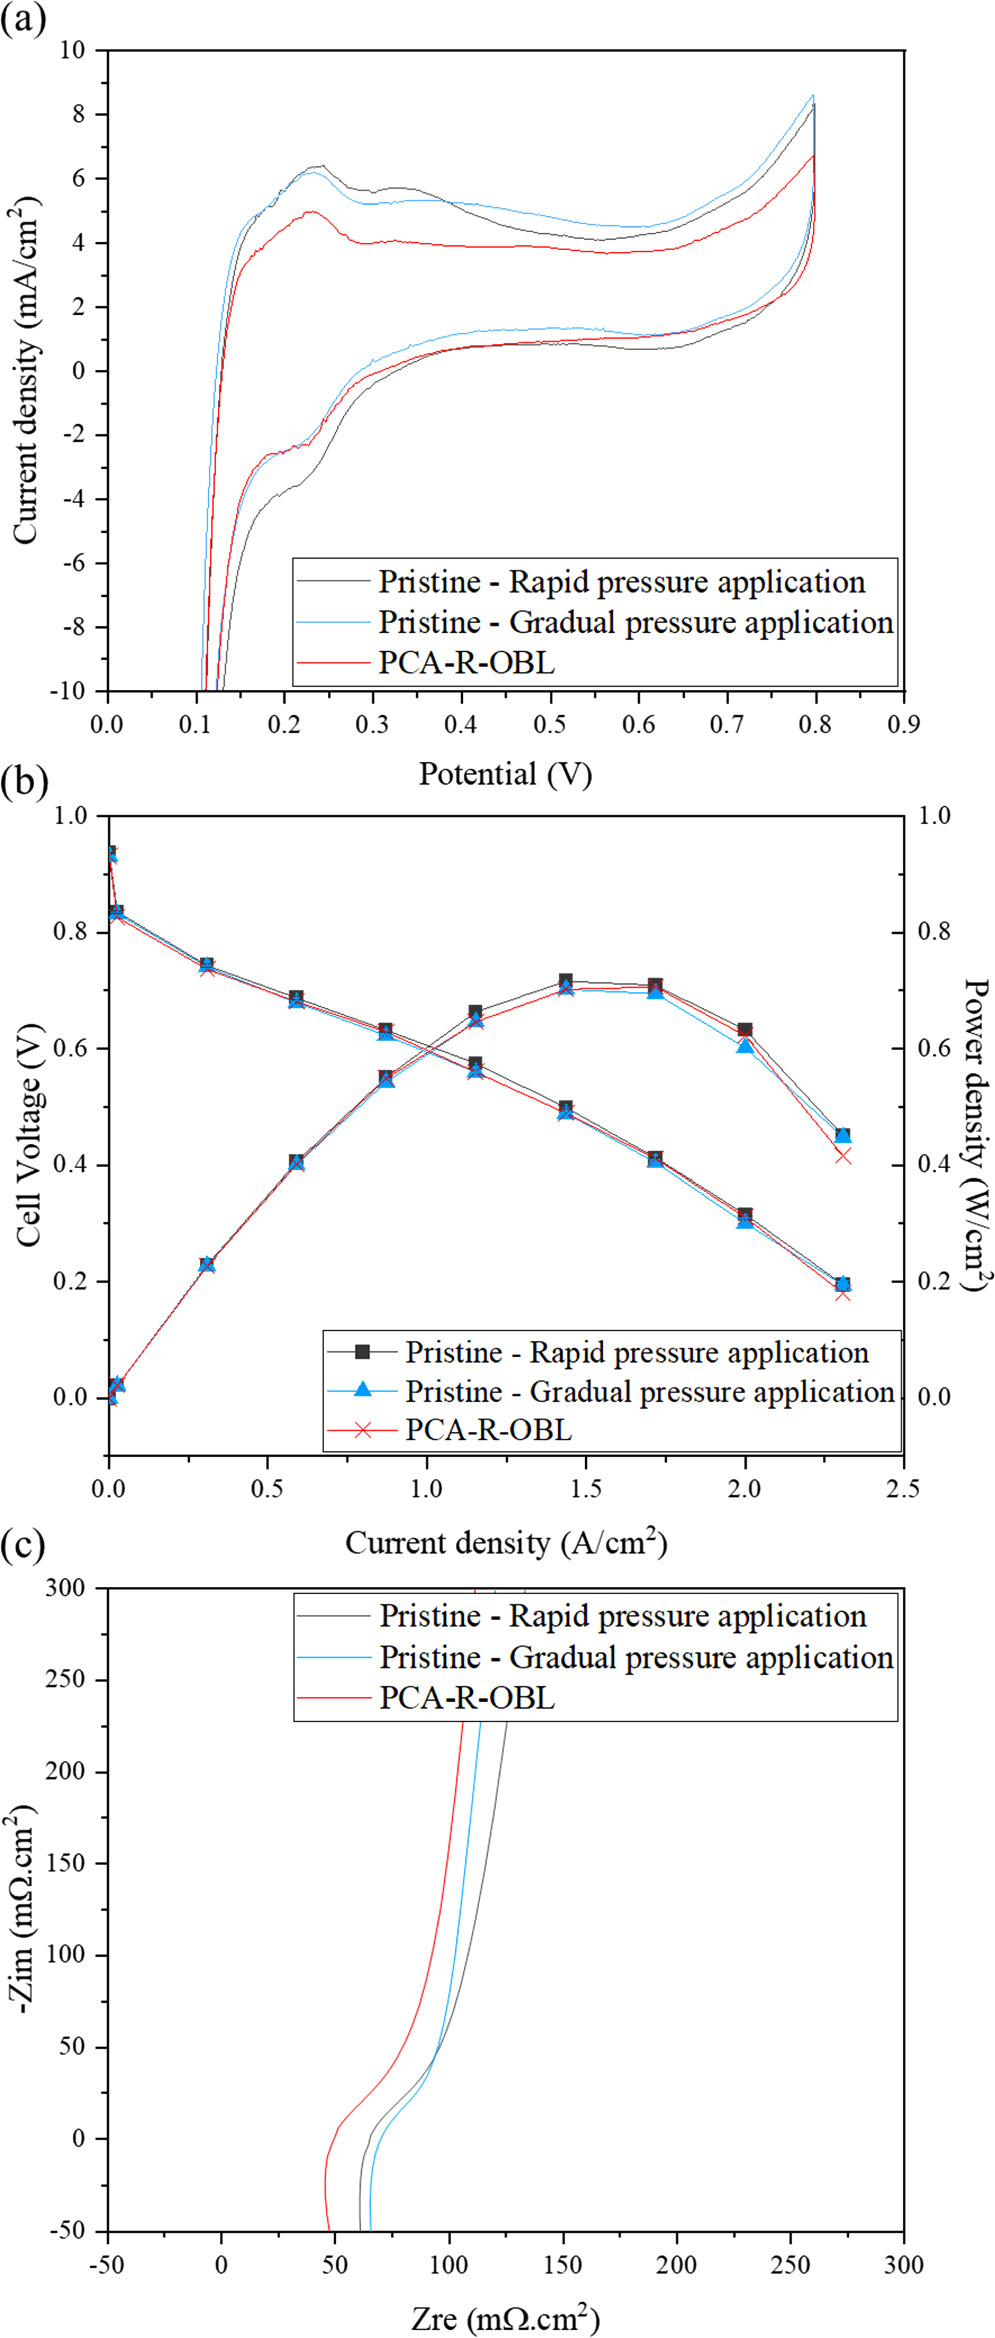
Figure 4. (a) H2/air polarization and power density curves and (b) high frequency electrochemical impedance spectra of fuel cells with CCMs fabricated via rapid and gradual decal transfer without foreign particles (pristine samples) and PCA-R-OBL sample with foreign particles.
Download figure:
Standard image High-resolution imageFigure 4b shows a comparison of the polarization and power density of the two particle-free baseline cells. It can be observed that the pristine R-cell has marginally higher performance and delivers a maximum power density of 0.72 W cm−2 while the G-cell delivers 0.71 W cm−2, both at a current density of 1.56 A cm−2. The slight disparity in cell performance at this current density is mainly attributed to differences in ohmic resistance, as the activation loss in the cells is almost identical. However, the pristine G-cell shows lower mass transfer loss at high current densities. Therefore, both cells produce the same current density of 2.3 A cm−2 at 0.2 V.
Figure 4c shows the EIS data of the cells between the frequencies of 40 kHz and 80 Hz. In these curves, the high frequency resistance (HFR) of the pristine R-cell is 65 mΩ.cm2 and that of the pristine G-cell is 70 mΩ.cm2. This small difference as well as the marginally lower polarization performance of the pristine G-cell can be attributed to the test condition and assembly quality of the cells. This range of variation is expected and common among the small-scale fuel cells used in this study. These results show negligible effect of gradual pressure application and extended hot pressing time on cell performance, which is an expected observation since the difference between the protocols is insignificant.
CCMs with silica microspheres as foreign particles
Silica microspheres with Young's modulus of about 70 GPa are much harder than all other components used during the decal transfer. They also have a high melting temperature of 1710 °C which guarantees their shape stability during the hot press procedure. During the decal transfer, the microspheres tend to penetrate the adjacent layers; i.e. the catalyst layer and membrane. However, since the combined thickness of these layers is less than the diameter of the microsphere (60 μm), the layers behind them also get affected. For the used decal transfer methods, the affected layers are the CL and its PTFE substrate as well as the membrane and its bed material which can be the original backing layer (OBL), PTFE, or Kapton adhesive double layer (KDL). Figure 5 shows a sample XCT image of a microsphere laden CCM after the completion of the dual CL decal transfer. Both anode and cathode CLs are seen to wrap around the surface of the particle, which protrudes more into the cathode side given its placement at the cathode CL—membrane interface, while the membrane is situated on the anode side of the particle and bent outwards to accommodate the particle within the CCM. The upcoming sections elaborate on the differences between the CCMs fabricated using different decal transfer procedures and the effect of the microspheres.
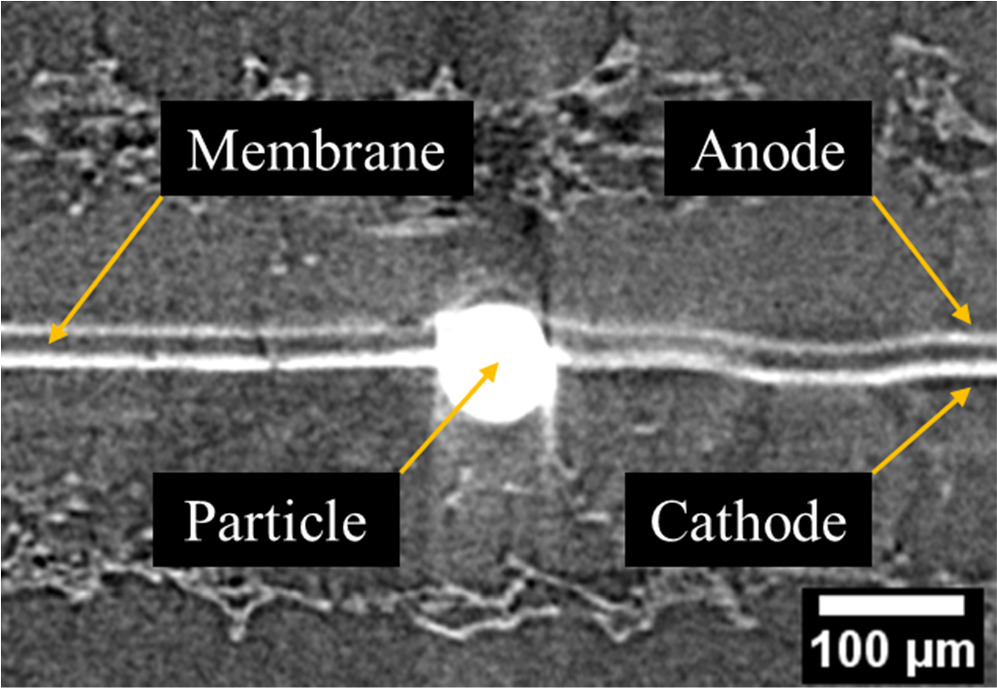
Figure 5. Sample cross-sectional XCT view of a CCM with a microsphere particle implanted at the membrane and cathode catalyst layer interface. The CCM sample is sandwiched between two GDLs to provide mechanical support during imaging.
Download figure:
Standard image High-resolution imageParticle-Cathode-Anode (PCA) CCMs
The PCA assembly method is first assessed, wherein the particles are placed on the membrane followed by dual decal transfer of cathode and anode CLs. After placing the particles on the membrane surface and decal transferring only the cathode CL onto the bare membrane, the form of membrane damage is similar to what is shown in Fig. 6a. In all cases, regardless of the backing layer used, the microspheres are found to dent the membrane but not pierce it, such that the membrane surface at the anode side remains almost flat. However, delamination of the cathode CL in the vicinity of the microspheres is observed, which is due to the bending of the CCF near the microsphere and the lack of local contact pressure during the decal transfer. Interestingly, this delamination appears to vanish after the subsequent decal transfer of the anode CL, and as shown in Fig. 6b, both CLs adhered to the membrane even near the microsphere upon complete PCA based CCM assembly.

Figure 6. Cross-sectional XCT views of particle laden PCA CCMs after (a) decal transfer of only the cathode catalyst layer and (b) decal transfer of both catalyst layers.
Download figure:
Standard image High-resolution imageXCT images representative of each CCM sample after decal transferring both sides are shown in Fig. 7. In these images, the cathode CL and microspheres were removed from the fabricated samples to enhance the image quality. As can be seen, in all cases, the membrane is punctured or extremely thin underneath the microsphere. With the bed materials of PTFE and Kapton, the microspheres are able to substantially penetrate the membrane and deform the remaining membrane and anode CL into a protruded blister shape on the anode side of the CCM, while also forming a wider thinned region. This wider thin region could potentially affect the membrane durability in the presence of foreign particles, since the remaining membrane appears vulnerable to both mechanical and chemical stress. 18
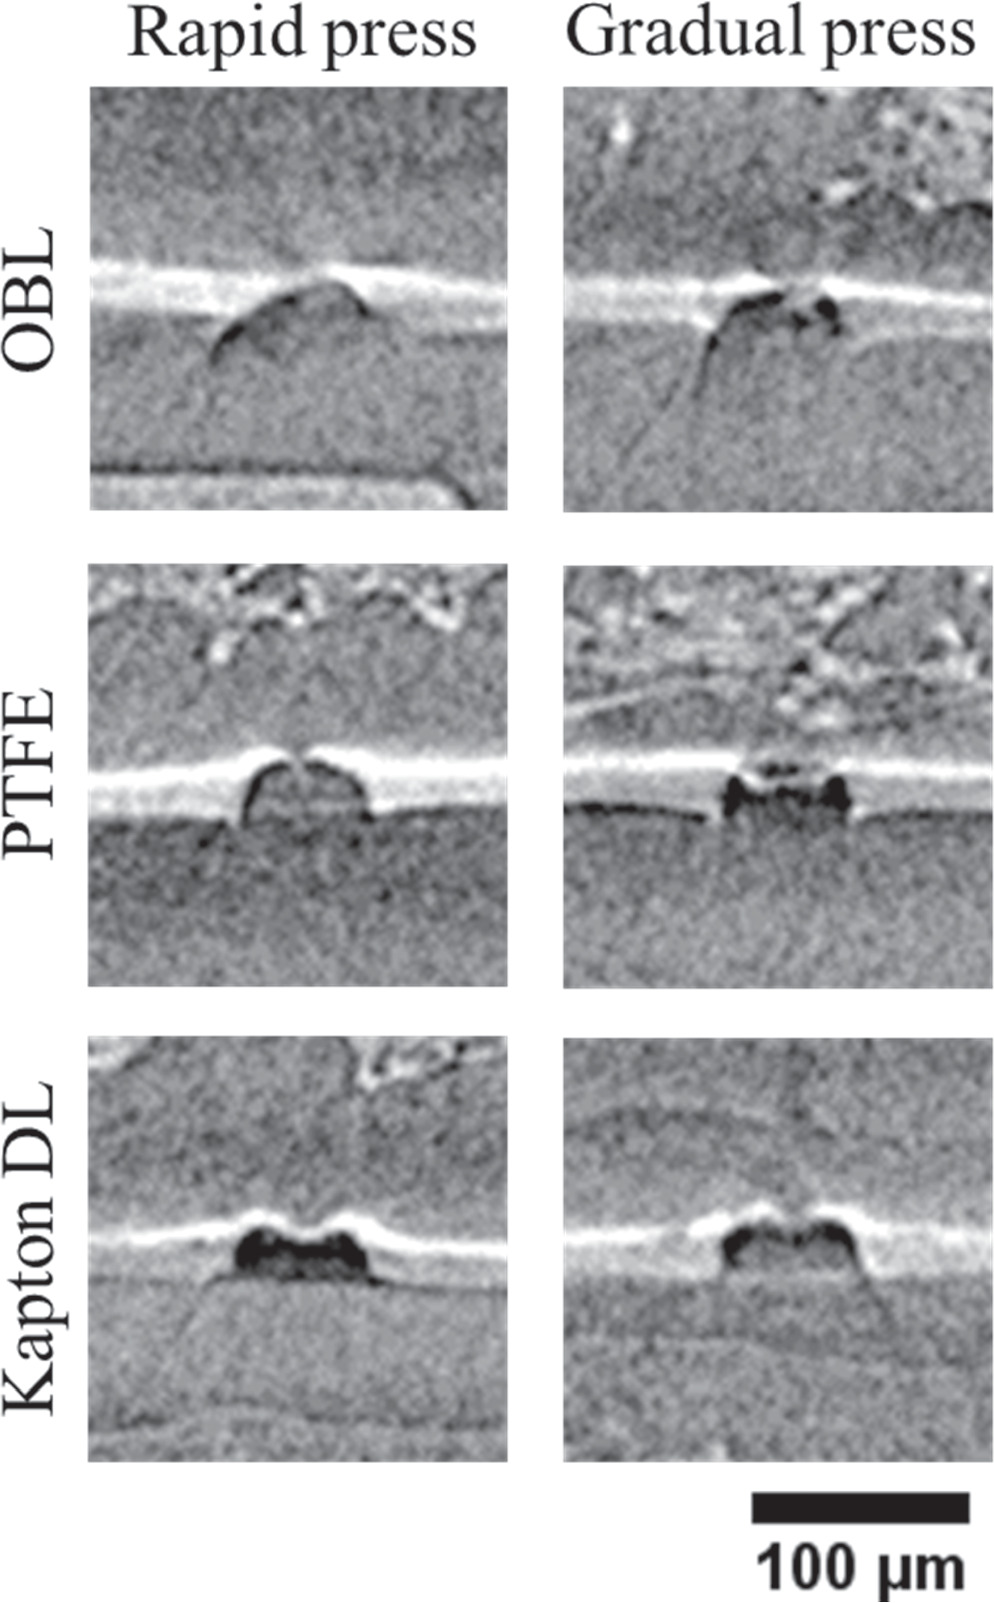
Figure 7. Cross-sectional XCT view of the remaining half-CCM of the six PCA samples following removal of the microsphere particles and cathode catalyst layer for enhanced clarity and contrast.
Download figure:
Standard image High-resolution imageNext, the PCA fabricated CCMs are assembled into a small-scale fuel cell for further analysis. Despite the significant damage to the membrane underneath the microsphere, none of the samples show any internal gas crossover under anode overpressure up to 20 kPa in the dry state, as per the leak test conditions. However, as the microspheres are removed, the PCA-R-PTFE and PCA-G-PTFE samples show an internal crossover of 2.00 (±0.01) mL min−1 and 0.75 (±0.01) mL min−1, respectively. This shows that the microspheres effectively blocked the local gas transfer across the membrane and their physical removal opened a passage for gas permeation through the sample. This also indicates partial piercing of the membrane during CCM fabrication and that the extent of such piercing may vary between samples despite them being visually similar.
Since the samples used for imaging in the previous steps are heavily manipulated by removing the particles and cathode CL, they are not suitable to be used inside a cell for electrochemical testing. However, a duplicate PCA-R-OBL sample is used to investigate the electrochemical performance of a particle-containing MEA. Similarly to the previous sample, using the mechanical leak test this sample shows a negligible internal crossover of 0.00 (±0.01) mL min−1 and an approximate crossover current density of 2 mA cm−2 observable in Fig. 4a. These values are identical to the values obtained for the particle-free baseline MEAs which shows that the particles did not cause any increase in internal gas crossover. The polarization curve and EIS data of this cell are also illustrated in Fig. 4. It can be seen that the performance of this cell is comparable to the particle-free cells, which is expected as the particles do not cause any damage that can affect the performance at the beginning of life. It is noted that the lower HFR of the particle-containing cell is within the normal experimental variability of the small-scale fuel cells used for this study.
Anode-Particle-Cathode (APC) CCMs
The APC CCM fabrication method is then assessed, in which particles are placed on a half-CCM with previously decal transferred anode CL, followed by decal transfer of the cathode CL.
Figure 8 shows a representative cross-sectional XCT view of the particle location of an APC sample after removal of the microsphere and anode CL for image clarity. Compared to the PCA samples, the membranes in these CCMs appear to be thicker albeit with some variation depending on the decal transfer procedure. Figure 9 shows the normalized thickness of the thinnest section of the membrane under the microspheres in each sample, measured using XCT and averaged for at least four particles. According to this data, APC-R-PTFE is able to maintain 0.26 of its initial thickness while APC-R-KDL preserves 0.32 of it, which indicates a 23% increase in the average thickness of the remaining membrane by only changing the bed material. This increase is more significant between APC-R and APC-G samples. The APC-G-PTFE and APC-G-KDL samples retained 0.34 and 0.44 of the initial thickness, which are 31% and 38% thicker than their APC-R counterpart. In general, the modified APC-G-KDL procedure shows a significant improvement of 69% in the thickness of the membrane underneath the particle compared to the conventional APC-R-PTFE method. A two-way ANOVA assessment based on these data also confirms the statistically significant effect of both bed material and press rate on the extent of membrane damage with p-values of 3 × 10⁻⁶ and 3 × 10⁻⁷, respectively, which also confirms that the press rate is the most significant factor.
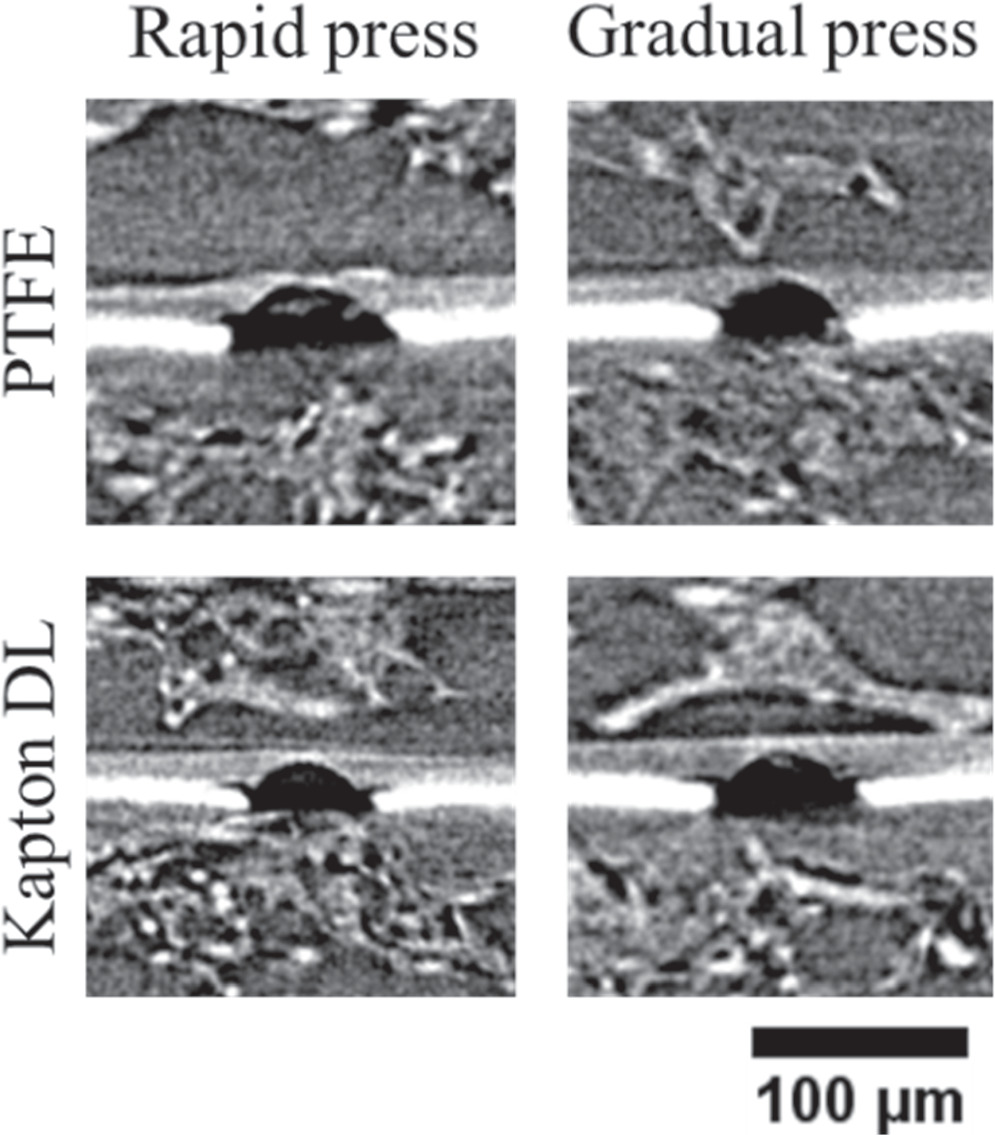
Figure 8. Cross-sectional XCT view of the remaining half-CCM of the four APC samples following removal of the microsphere particles and anode catalyst layer for enhanced clarity and contrast.
Download figure:
Standard image High-resolution image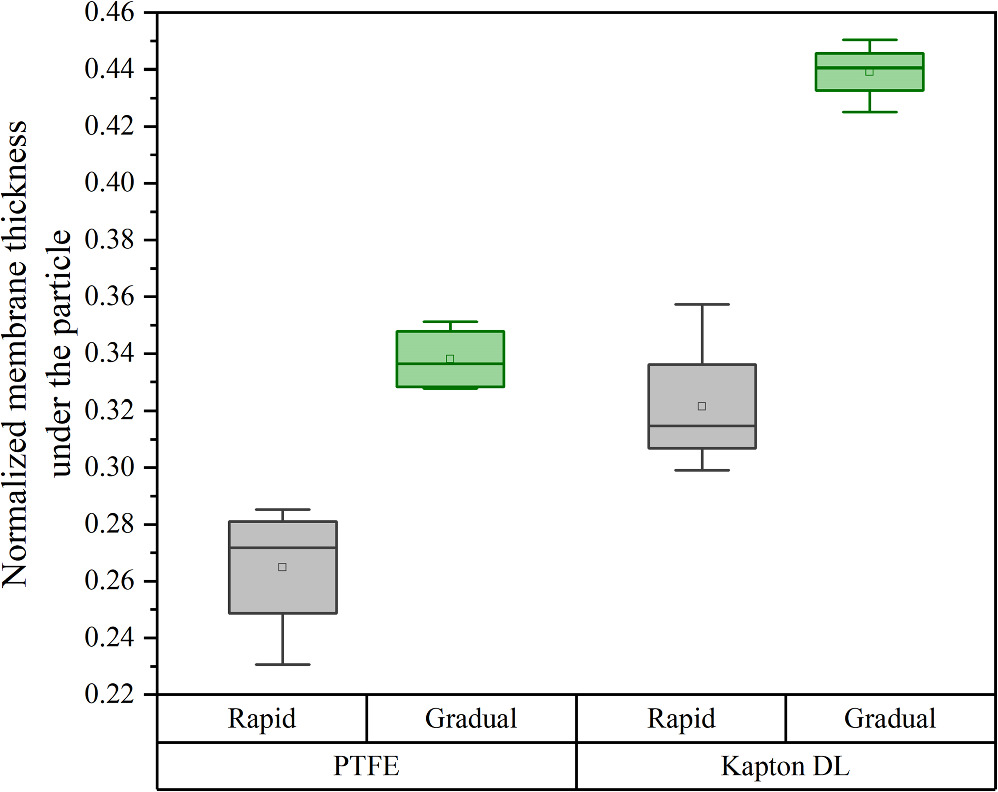
Figure 9. Normalized local membrane thickness underneath the microsphere particles in the APC samples as measured from XCT images.
Download figure:
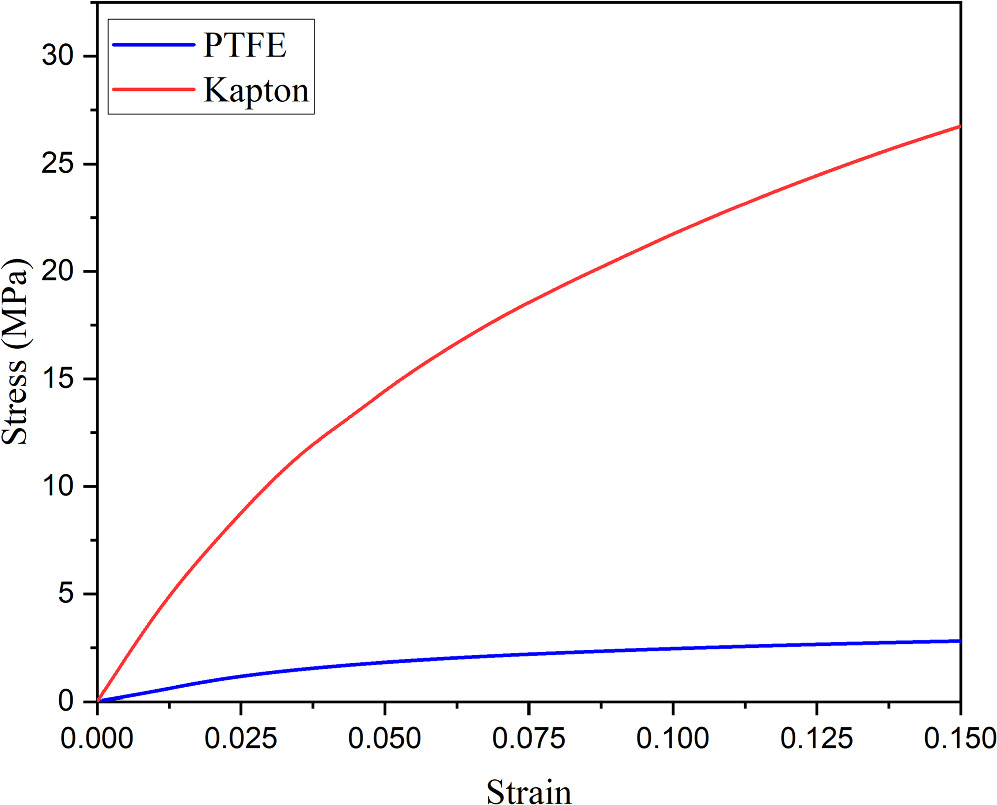
Standard image High-resolution imageWhile the polyimide is considerably stiffer than PTFE, as shown by the tensile properties reported in Fig. 10, the improved robustness of the KDL samples can be attributed to the low thickness of the two polyimide layers and the presence of a 70 μm adhesive layer between them. When KDL is used as bed material, the polyimide layers deform under the particle and bend toward the adhesive layer to distribute the stress over a wider area. The reduced pressure application rate further benefits both KDL and PTFE samples due to the viscoelastic behavior of the bed material. However, the adhesive in the KDL samples moves more slowly and therefore faces less internal shear stress and can flow more easily to open up space for the more rigid polyimide layer. In contrast, the PTFE needs to get compressed or bend another PTFE layer beneath it to provide space for the membrane underneath the microsphere.

Figure 10. Uniaxial tensile test results of Kapton and PTFE at 150 °C and strain rate of 1%/min
Download figure:
Standard image High-resolution imageIn addition, the membrane thickness under the microspheres in the APC-G samples has a standard deviation of only 0.15 μm compared to a standard deviation of more than 0.31 μm in the APC-R samples, which indicates a more consistent membrane thinning with gradual pressure application during decal transfer. This consistency can reduce the risk of early membrane failures and help facilitate more uniform lifetime across the MEAs fabricated through this method. Also, none of the samples show any gas cross-over under anode overpressure up to 20 kPa with or without microspheres, which is an expected observation considering the relatively thick layer of membrane that remains under the microspheres.
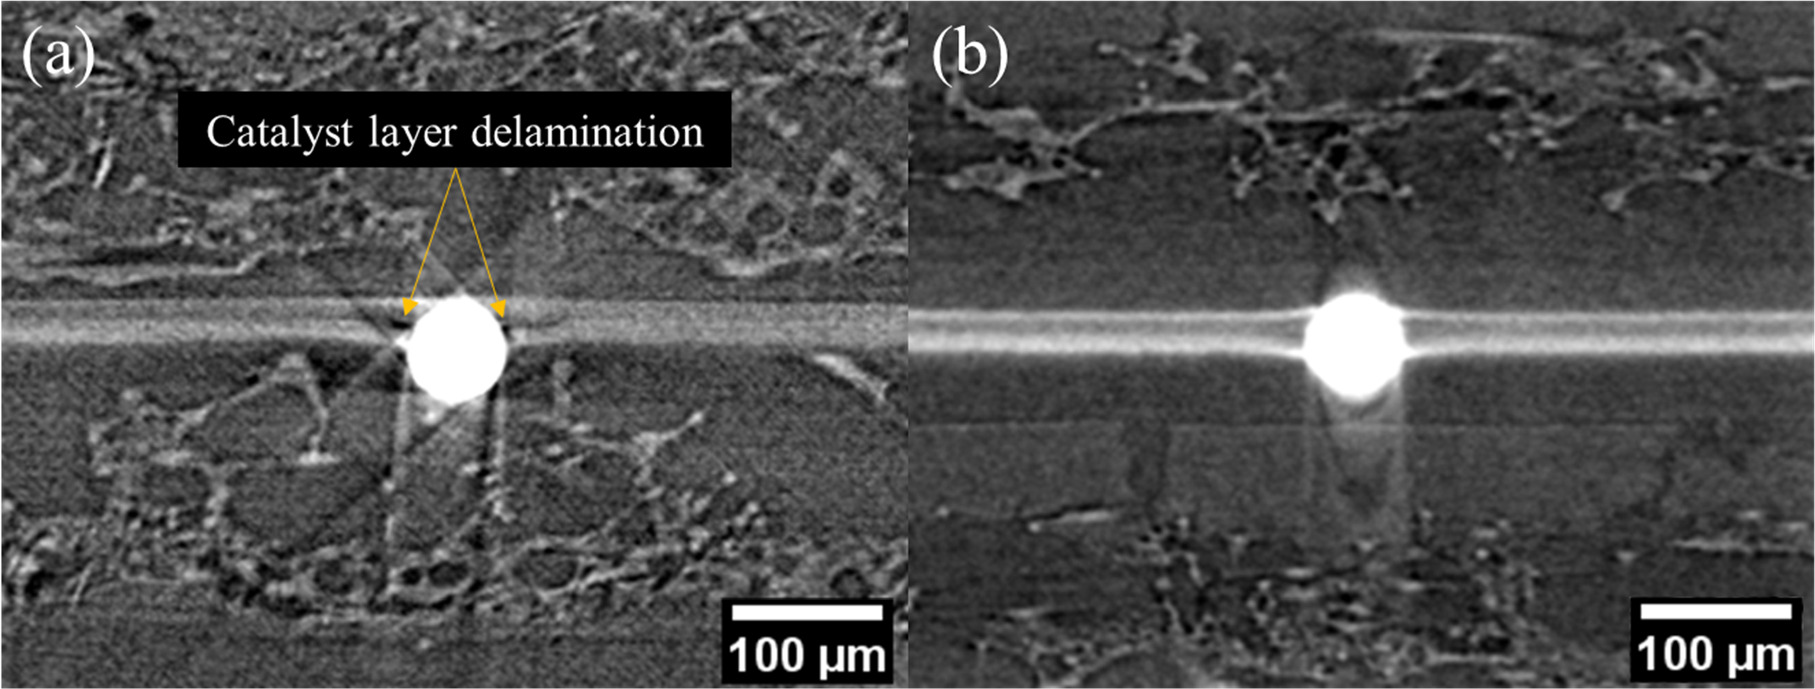
Another observation on the effect of pressure application rate can be seen in Fig. 11 which shows cross-sectional XCT views of APC-R-KDL and APC-G-KDL samples (with particles and ACL removed for image clarity) taken in the machine and transverse directions of the membrane. Evidently, the membrane deformation differs in the two orientations for both samples, and for one of them, a step-like vertical membrane deformation is observed adjacent to the microsphere along the machine direction. This deformation is most observable as a step-change in the transverse cross-sectional view of the APC-R-KDL sample. This disparity is related to the anisotropic mechanical properties of polymer electrolyte membranes which is more significant in reinforced membranes 36 typically having lower tear resistance in the machine direction compared to the transverse direction. 37,38 In this specific case, the shear stress imparted by the particle on the membrane during pressure application was not sufficient to tear the membrane in the transverse direction, but large enough to tear the membrane along the machine direction on both sides of the particle. These tears could create a mechanically vulnerable spot in the CCM that may lead to early membrane failure. However, this type of deformation was only visible in the APC-R-KDL sample where the membrane was able to move rapidly with low resistance from the bed film.

Figure 11. Cross-sectional XCT views of (a) R-KDL (left) and G-KDL (right) in the machine direction (MD; top) and transverse direction (TD; bottom). The vertically displaced membrane is visible in the transverse direction of R-KDL and its magnified view is shown in (b) with the residuals of the initial tear marked.
Download figure:
Standard image High-resolution imageDelamination of the cathode CL in the vicinity of the microsphere is also observable in all APC samples. This is similar to what happened after the decal transfer of the cathode CL onto the PCA samples and is because of insufficient contact pressure during the decal transfer in this region. However, in the APC samples, the CCM is fully prepared at this step and there is no secondary hot press to improve the interface between the membrane and the cathode CL. Therefore, this delamination might increase the local rate of membrane degradation, for instance by accumulating water near the microsphere and adjacent to the membrane. 18 Similar to the membrane damage, this delamination is anisotropic in nature with respect to the membrane machine direction.
Finite element analysis
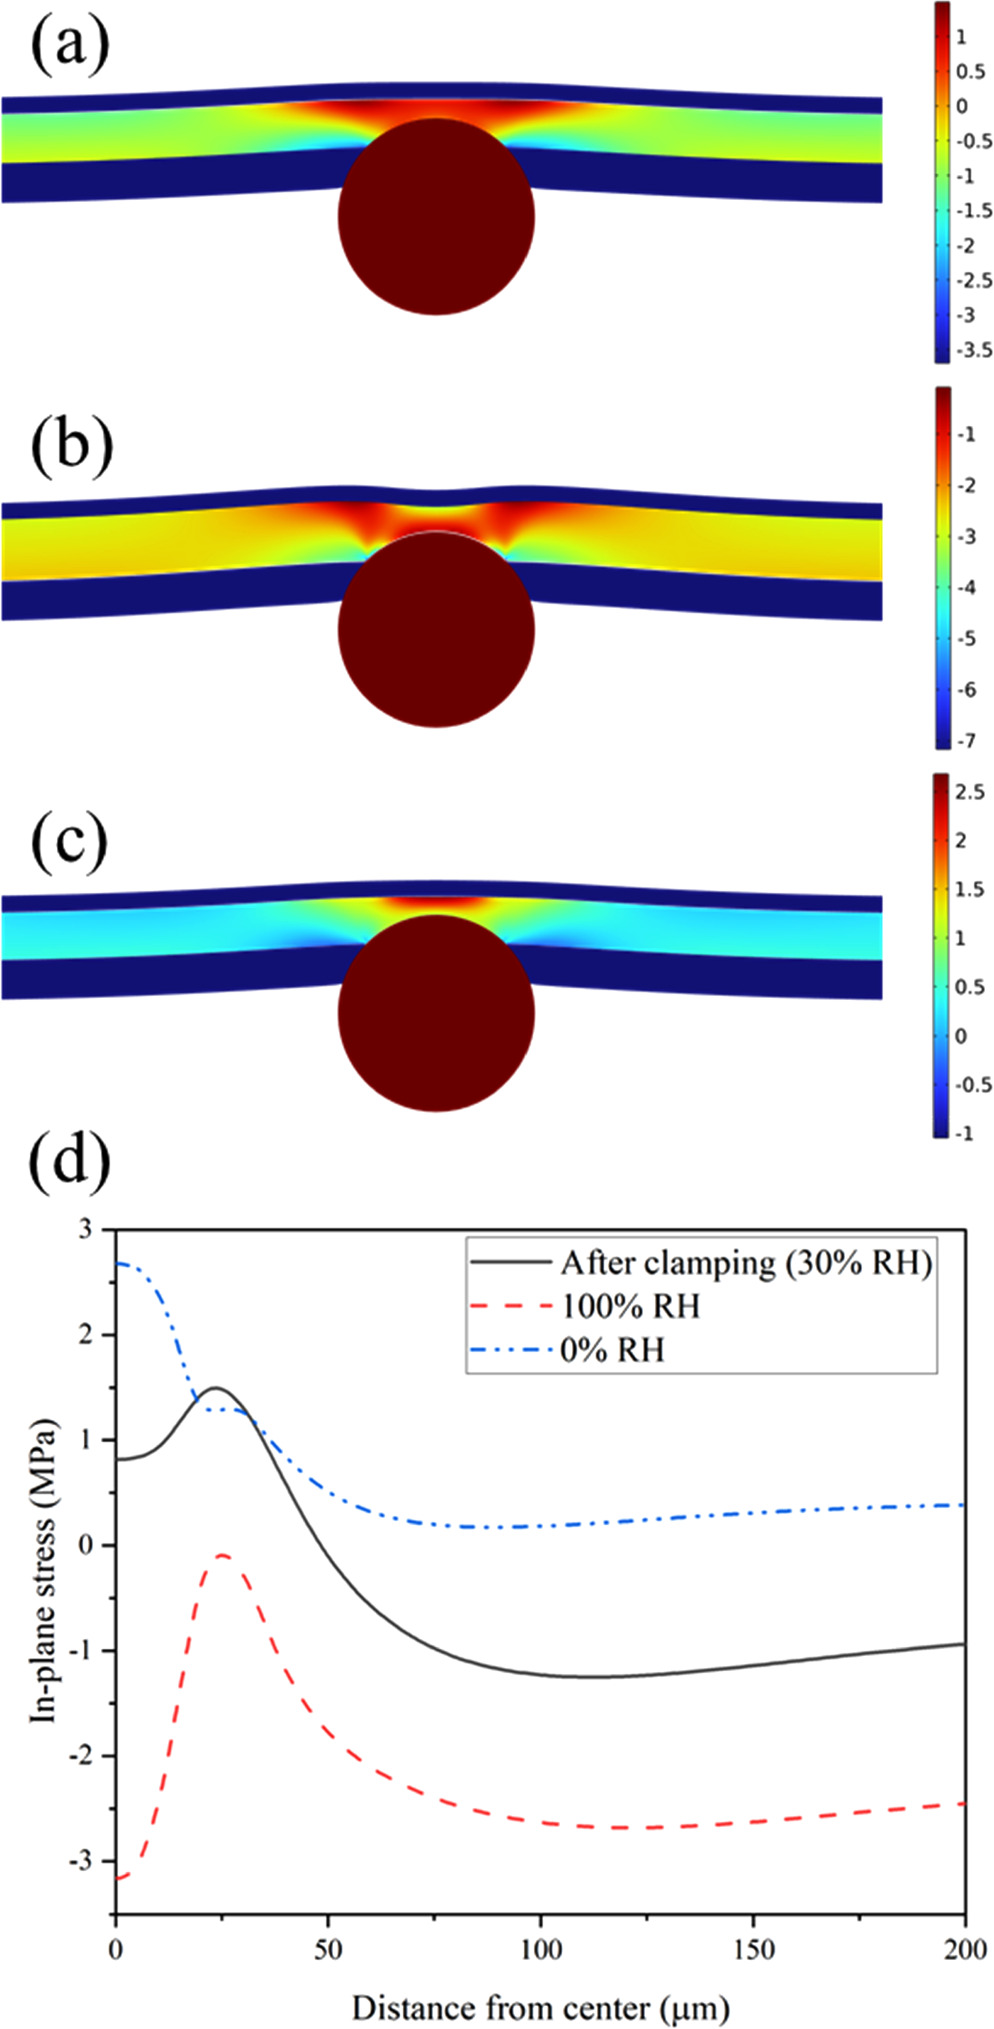
A finite element analysis using a constitutive model for the membrane is performed to further understand the effect of the microsphere on the stress distribution inside the membrane in a simulated fuel cell environment. In this model, similar to the samples tested, a particle is located at the interface of the membrane and cathode CL and depending on the depth of penetration of the particle into the membrane, this model can represent the outcome of any of the studied cases. The simulation starts with the gradual application of clamping force on the CCM for 10 s at a relative humidity of 30% and temperature of 85 °C. At this step, normally and in the absence of the particle, the whole membrane goes into compression. However, in this case, the particle starts to bend the membrane toward the anode side, creating a circular tensile stress region under the particle as shown in Fig. 12a. As the relative humidity increases and reaches 100%, the membrane experiences greater compressive stress due to its swelling in a constrained geometry. At this condition, the tension that appeared on the membrane surface after the clamping of the MEA cancels out the compressive effect of the membrane swelling and creates an almost neutral stress condition on the surface of the membrane as shown in Fig. 12b. When the water content of the membrane drops to zero during subsequent drying, the membrane shrinks and goes into tension; as visible in Fig. 12c. In this condition, the thinness of the membrane under the microsphere coupled with a downward force from the particle creates highly concentrated tensile stress underneath the microsphere. Therefore, a region with a high stress fluctuation appears under the particle at the thinnest point of the membrane. To illustrate this effect, an example of the distribution of the in-plane stress on the membrane surface in different conditions is shown in Fig. 12d. The results indicate that the presence of a particle can lead to the formation of a region that experiences significant stress cycling between compression and tension.

Figure 12. Finite element simulation of the stress distribution inside the membrane in the presence of a silica microsphere that penetrated the membrane by 6 μm during the fabrication of the CCM. The images show the stress contours (a) after the cell assembly, (b) in the wet state, and (c) in the dry state. Part (d) shows the stress on the lower (anode) surface of the membrane in these states.
Download figure:
Standard image High-resolution imageFigure 13 shows the maximum local in-plane compression and tension of the membrane under the particle in wet and dry states as a function of the thickness of the membrane remained there. The tensile stress in the dry state is found to be nearly constant regardless of the depth of particle penetration. This is because of the trade-off between the thickness of the compressed membrane and the amount of GDL compression on top of the microsphere. As the particle penetrates further into the membrane, the thickness of the membrane layer underneath it decreases, which elevates the local stress. However, at the same time, the combined thickness of the CCM and microsphere decreases when the particle is pressed further into the membrane. Therefore, the normal force of the GDL is reduced and neutralizes the effect of membrane thinning. Nevertheless, this is exactly the opposite of what happens in the case of membrane compression in the wet state when it swells. In this condition, similar to the tension in the dry state, the magnitude of compressive stress increases since a thinner layer of the membrane should absorb the stress. However, at the same time, a reduction in the combined thickness of the CCM and particle reduces the compression of the GDL and therefore its tensile effect on the membrane, so the compression of the membrane increases even more. Therefore, the simulation shows that it is possible to reduce the domain of stress fluctuation inside the membrane by reducing the maximum compression stress the membrane experiences during the operation.

Figure 13. Maximum local stress in the membrane due to the presence of the microsphere in fully wet and dry states using finite element analysis.
Download figure:
Standard image High-resolution image
In summary, the findings indicate that the depth of particle penetration into the membrane plays a crucial role in determining the mechanical stress experienced by the membrane during fuel cell operation. Based on the earlier experimental results discussed in this article, it is evident that decal transfer methods that result in minimal particle penetration, such as the approach employed in the fabrication of APC-G-KDL, have the potential to partially mitigate the adverse mechanical effects caused by foreign particles.
Conclusions
In this work, X-ray computed tomography (XCT) and finite element analysis (FEA) were implemented to investigate the impact of different decal transfer fabrication procedures on the catalyst-coated membrane (CCM) in the presence of silica microspheres as representative incidental foreign particles. It was shown that in the presence of foreign particles at the membrane—cathode catalyst layer interface, the order of fabrication steps, the bed material, and the rate of pressure application during the decal transfer process can potentially affect the extent of membrane damage. The results show that if the particle deposits on the membrane before the decal transfer of the cathode and anode catalyst layers, it can fully pierce the membrane during hot pressing regardless of the material of the bed film. On the other hand, it was observed that when the particle deposits on the membrane after the coating of the anode catalyst layer, it imposes lesser damage to the membrane during the decal transfer of the cathode catalyst layer. In this case, at least 26% of the membrane thickness was retained after CCM fabrication in the worst case with PTFE bed material and rapid pressure application. Notably, it was observed that both the bed film material and pressure application rate can provide effective mitigation of the extent of membrane damage. In this regard, compared to the worst case, a 30% increase in membrane thickness was achieved by gradual pressure application and a 69% improvement was obtained by implementing the novel method of using Kapton double layer (KDL) as the bed material and gradual pressure application. In addition, it was observed that the gradual pressure application led to more consistent results with about 50% lower standard deviation than for rapid pressure application, which could reduce the risk of early membrane failures at particle locations. The 3D XCT investigation of the particle sites also revealed anisotropic behavior with respect to the machine direction of the membrane, which can affect the extent and nature of local membrane damage. Lastly, an in situ finite element fuel cell model was used to analyze the effect of particle penetration on the stress distribution inside the membrane and it was shown that although the penetration depth is ineffective on the tensile stress in the dry state, it can largely reduce the magnitude of the compression stress during the wet state and therefore, reduce the stress fluctuation domain. These results illustrate the effect of the fabrication process on the membrane damage in the presence of incidental foreign particles and demonstrate the robustness of the proposed decal transfer procedure.
The outcomes of this study have advanced the understanding of the impact of foreign particles on the membrane and how the fabrication process influences membrane damage in their presence. Additionally, the findings have underscored the dependability and robustness of the proposed decal transfer procedure. By utilizing the appropriate decal transfer method, there is potential to minimize the extent of membrane damage caused by foreign particles. This, in turn, can result in more relaxed quality control measures, reduced waste, and ultimately, decreased production costs. Nevertheless, it is important to note that even with the implemented mitigation strategies, there is still a possibility of unforeseen effects of particles on the membrane during long-term operation. To mitigate this risk, it is crucial to conduct experimental durability tests on cells that contain foreign particles. Exploring the long-term performance and durability of such cells can be a valuable area for future research endeavors. By investigating the behavior and impact of foreign particles over extended periods, we can gain a deeper understanding of their effects and develop more comprehensive mitigation strategies.
Acknowledgments
This research was supported by the Natural Sciences and Engineering Research Council of Canada, Canada Foundation for Innovation, British Columbia Knowledge Development Fund, Western Economic Diversification Canada, Ballard Power Systems, and W.L. Gore & Associates. This research was undertaken, in part, thanks to funding from the Canada Research Chairs program.