
Abstract
Employment of electrochemical energy devices is being expanded as the world is shifting toward more sustainable power resources. To meet the required cost efficiency standards for commercialization, there is a need for optimal design of the electrodes. In this study, a topology optimization method is proposed to increase the performance of an electrochemical reaction-diffusion system. A dimensionless model is developed to characterize the transport and rate processes in the system. Two optimization strategies are introduced to improve system performance using a heterogeneous distribution of constituents. In addition, an entropy generation model is proposed to evaluate the system irreversibilities quantitatively. The findings show that the system performance could be enhanced up to 116.7% with an optimal tree-root-like structure. Such a heterogeneous material distribution provides a balance among various competing transport and rate processes. The proposed methodology could be employed in optimal design of electrodes for various electrochemical devices. This study also offers a fundamental comprehension of optimal designs by showing the connection between the optimal designs and the entropy generation. It is revealed that a less dissipating system corresponds to a more uniform current and entropy generation. Some recommendations are also made in choosing a proper optimization approach for electrochemical systems.
Highlights
An electrochemical reaction-diffusion system is modeled mathematically.
The system layout is topologically optimized.
An entropy generation model is used to assess the irreversibilities of the system.
The optimization process is explained from a physicochemical standpoint.
Two different optimization strategies are investigated and compared with each other.
Export citation and abstract BibTeX RIS

This is an open access article distributed under the terms of the Creative Commons Attribution Non-Commercial No Derivatives 4.0 License (CC BY-NC-ND, http://creativecommons.org/licenses/by-nc-nd/4.0/), which permits non-commercial reuse, distribution, and reproduction in any medium, provided the original work is not changed in any way and is properly cited. For permission for commercial reuse, please email: permissions@ioppublishing.org.
List of Symbols
| Aox | Oxidizing agent |
| Ared | Reducing agent |
| Eeq | Equilibrium potential (V) |
| F | Faraday constant (96485 C mol−1) |
| Fobj | Objective function |
| i0 | Exchange current density (A m−2) |
| j | Current density (A m−2) |
| L | Characteristic length (m) |
| N | Number of moles (mol) |
| n | Number of electrons |
| P | Total entropy (W K−1 m−1) |
| p | Pressure (Pa) |
| Q | Electric charge (C) |
| q | Charge densities (C m−3) |
| R | Gas constant (8.3145 J mol−1 K−1) |
| RC | Reaction source term (mol m−3 s−1) |
| S | Entropy (J K−1); source term |
| s | Entropy density (J k−1 m−3) |
| T | Temperature (K) |
| U | Internal energy (J) |
| V | Volume (m3) |
| α | Charge transfer coefficient |
| β | Penalty exponent |
| η | Activation overpotential (V) |
| Γ | Domain boundary |
| μ | Chemical potential (J mol−1) |
| Ω | Domain |
| ϕl | Electrolyte phase potential (V) |
| f | Generic flux |
| Js | Entropy flux (W K−1 m−2) |
| a | Specific surface area (m2 m−3) |
| C | Concentration (mol m−3) |
| D | Diffusivity (m2 s−1) |
| ϕs | Solid phase potential (V) |
| ρ | Generic quantity |
| σ | Entropy generation rate (W K−1 m−3) |
| σl | Ionic conductivity (S m−1) |
| σs | Electric conductivity (S m−1) |
| θ | Dimensionless group |
| ε | Volume fraction |
| 0 | Characteristic properties |
| * | Dimensionless parameter |
| a | Anode |
| bnd | Boundary condition |
| c | Cathode |
| eff | Effective |
| et | Electron transport |
| it | Ion transport |
| l | Electrolyte phase |

| Maximum |

| Minimum |
| mt | Mass transport |
| ref | Reference |
| rx | Reaction |
| src | Source term |
| s | Solid phase |
| tot | Total |
| v | Void phase |
Using renewable energies is a shortcut to combating environmental and energy security issues. 1,2 Electrochemical energy conversion and storage devices, including secondary batteries and fuel cells (FCs), play an essential role in the transition from fossil fuel-based societies to ones that rely heavily on renewable resources to respond human energy needs. 3,4 Despite recent advancements in the research and development of these technologies, 5,6 more work has to be done before they can be widely commercialized. Electrodes are vital components of any electrochemical device since they facilitate the electrochemical reactions that produce electricity. They serve as a bed for several transport and rate processes, and play a significant role in determination of the performance and efficiency of the electrochemical devices. Electrodes are typically porous medium that are made of an electrically conductive material, such as carbon, and coated with a catalyst. The catalyst promotes the desired electrochemical reaction at the electrode by increasing the reaction rate. In FC applications, for instance, the fuel and oxidant are supplied to the cell through channels in the electrodes. As the fuel and oxidant react at the electrodes, the released electrons flow through the external circuit to power an electrical load. The movement of reactant species and electric charges is essential for generating power in these systems. The performance of an electrochemical cell is mainly determined by the processes that are occurring at the electrode. Several research works 7–9 addressed these processes via electroanalytical methods. These transport processes (including mass diffusion, electric charges transfer, and heat transfer) and rate process (electrochemical reaction) are competing with each other. From an electrochemical standpoint, catalytic activity of the catalyst material and the electrochemical surface area are crucial factors that specify the rate of reactant consumption. However, the overall rate of an electrochemical reaction depends on the transport characteristics of the system as well. In other words, the speed of reactant delivery and product discharge are likewise influential in electrode performance. Hence, the design of the electrodes is an important consideration in the development of electrochemical technologies, and researchers are constantly working to improve the efficiency and durability of this component. 10
The electrochemical factors are dominantly hinged on the choice of catalyst material (or electrochemically-active material). Various catalysts come with different catalytic activity. However, the transport properties and effective utilization of the catalyst material strongly depend on the structural design of the porous electrode. 11,12 A better design solution might improve the transport phenomena and consequently lead to a more effective utilization of the catalyst material. Modifying the composition of an electrode is an approach used by previous researchers 13–15 to get an appropriate compromise between various processes. Depending on the application, composition modification includes, but is not limited to, changing the porosity, catalyst loading, and electrolyte loading. Mathematical optimization can be utilized to search for the optimal composition. So far, the studies in the literature focused on controlling the composition in a global level. A heterogeneous design, however, can provide a superior control of the transport and rate processes by extending the degree of freedom to a local level. In this regard, topology optimization (TO) 16 is a mathematical technique that can provide innovative design solutions for a variety of engineering applications. In this approach, the goal is to find the best shape and layout of structure or system that improves one or several performance criteria. This is typically conducted by using iterative mathematical procedures to test different material distribution until finding the one that best meets the desired performance criteria. TO outperforms other categories of mathematical optimization, such as parametric optimization, thanks to its higher degree of freedom. It has been successfully applied to a wide range of engineering applications, including mechanical, 17 chemical, 18,19 thermal, 20 and fluid 21 systems. In electrochemical devices, TO can be used to design efficient and high-performing electrodes, 22–24 flow channels, 25,26 and other components. To date, only a few studies addressed the employment of TO for designing electrodes with heterogeneous structures. For instance, Roy et al. 22 used this technique to find the best porosity distribution layout in the electrode of a redox flow battery. Their results show that a non-uniform distribution of porosity could increase the cell performance by reducing the ohmic losses in the system. However, this study does not account for the effect of concentration depletion. Reviewing the literature shows that TO has a significant potential for designing better porous reactors for electrochemical applications. It is worth noting that recent advancements in additive manufacturing and 3D printing technologies have made it possible to fabricate complex structures. 27 For instance, in a recent study, 28 researchers introduced a grooved electrode structure for FCs, which improved cell performance by enhancing ionic conductivity and mass diffusion. As a result, the development of innovative designs necessitates the application of rigorous mathematical approaches, such as TO.
In power generating electrochemical devices (e.g. a fuel cell), a better design is referred to the increment in the output power. In this sense, design enhancement might be gained by controlling either the current density or the system overpotential. This give a rise to two strategies in optimization of electrochemical systems: (1) maximizing the current density at a given overpotential and (2) minimizing the total overpotential at a given current density. Both these approaches will lead to a higher output power in the case of power generating system. The same approaches could be applied for a power consuming electrochemical system (e.g. electrolyzers). However, in such devices, optimization will reduce the power consumption or increase the output products. From a physicochemical standpoint, however, the above-mentioned approaches are different. Despite promising results reported by previous researchers in the employment of TO for designing better system, they usually overlook investigation of optimization process from a physical basis. Such elucidation is crucial because it might open new room for further improvement of system performance beyond the capabilities of existing mathematical schemes. To obtain a physical understanding, one can investigate the changes in system irreversibilities over the course of optimization. The irreversibilities of a system could be expressed quantitatively in the form of entropy generation. Non-equilibrium thermodynamics (NET), 29,30 a branch of thermodynamics that deals with the systems that are not in a global equilibrium conditions, could be used to determine the local and global rate of entropy generation in a system. Previously, it has been extensively used for analysis of thermofluid systems. 31–41 In a recent study by Charoen-amornkitt et al. 18 the authors used NET to describe entropy generation in a chemical reactor. The entropy production approach based on NET of physical processes at the interfaces has been applied for efficiency improvement in PEM fuel cells with porous electrodes. 42 Entropy generation is known as an index of power dissipation in a system. Therefore, it is desirable to reduce the rate of entropy generation (if and only if the system duty is not changed). This idea led to a so-called Entropy Generation Minimization (EGM) principle. 43 It is noteworthy that EGM only works when a certain system duty is guaranteed. Since under a finite time/size condition, any system is doomed to generate some amount of entropy, the two aforementioned optimization strategies may have different behaviors in terms of entropy production. These differences will be comprehensively discussed in the subsequent sections.
Research objectives and gaps
In this study, a mathematical optimization process is employed to seek the optimal architecture for a porous electrochemical reactor. Such an engineered structure obtained by TO is shown to be capable of enhancing the system performance substantially. This enhancement is obtained by improving the utilization of the constituents materials that is achieved thanks to a heterogeneous layout. This research work introduced a general framework for optimization of constituents placement in an electrochemical reactor. Hence, similar procedure might be used for real applications, such as catalyst layer of a FC. By revisiting the definition of performance enhancement in an electrochemical system, the present work compares two different strategies in optimizing electrochemical systems.
While previous optimization studies (e.g. 13,14,22 ) predominantly concentrated on the comparative analysis of designs pre- and post-optimization, this research takes a deeper dive into the physical aspects driving design improvements. To achieve this, the entire course of optimization is thoroughly explored, rather than just looking at the starting and ending designs. Furthermore, this study introduces two distinct electrode optimization strategies and examines their physicochemical differences. To the best of the authors' knowledge, such distinctions have not been observed in prior research. As previously highlighted, the full-scale commercialization of electrochemical energy devices hinges on advancing their performance and cost efficiency. In this context, the application of topological optimization to electrode structures may yield highly efficient designs. Furthermore, a more comprehensive understanding of the optimization process through NET analysis could pave the way for uncovering the upper limits of performance achievable with current materials. This insight could also shed light on areas ripe for further improvement through research and development efforts.
Methods
In this study, a 2D electrochemical porous reactor involving reactant diffusion, electric charges transport, and a redox reaction is inspected. The porous reactor is considered being composed of three phases. A reactant is diffused into the system according to the Fick's law of diffusion. This reactant is converted to the products through an electrochemical reaction in the presence of a catalyst material. The rate of this reaction is described using the Butler-Volmer relationship. A non-dimensional mathematical model is developed to characterize the performance of this system. Two sets of boundary conditions are assumed to analyze the system, including a given current density and a given total overpotential. By solving the governing equations together with a given current density as the boundary condition (B.C.), the total overpotential of the reactor is calculated. On the other hand, when the total overpotential is given as the B.C., the numerical simulation provides the system current density. An entropy generation model is also developed to evaluate the rate of irreversibilities in the system by various mechanisms. The entropy generation rate is also non-dimensionalized to generalize the applicability of the results and discussions. Next, a TO method is used to find the optimal distribution of constituents in a given design domain. The local volume fractions of constituents are controlled to obtain the best performance. For this purpose, two different optimizations, including maximization of current density and minimization of total overpotential, are performed. The local and global entropy production is calculated in each iteration. The trend of entropy generation is compared for the two optimization approaches to explain the differences from a physical viewpoint. The methods are described in details as follows.
Mathematical Modeling
In the present study, a continuum model is employed to describe the behavior of various rate and transport phenomena occurring in a 2D electrochemical reactor. The schematic of the representative porous reactor is depicted in Fig. 1. As it can be seen in this figure, the reactor is assumed to consist of three phases, including void, electrolyte, and solid phases. This reactor design with triple phases is not common in electrochemical systems. For instance, in lithium-ion batteries and redox flow batteries, the pore is filled with electrolyte solution, resulting in a double-phase system (solid and electrolyte). In this study, however, we modeled the system in a way to be applicable to both double- or triple-phase systems, with the aims of covering FCs that are triple-phase systems. The reactant species is diffused through pores and the produced ion is transferred by the electrolyte material. The solid phase is responsible not only for transport of exchanged electrons but also for increase in reaction rate. In electrochemical energy devices, such as FCs, the solid phase is typically composed of a catalyst material (e.g. platinum) and a supporting material (e.g. carbon). In this study, it is assumed that the reactant species Ared is oxidized in the presence of a solid phase (catalyst material) as follows:

where Ared and Aox are reducing and oxidizing agents, respectively, and n is the number of electrons involved in this reaction. For simplicity, n is assumed to be unity (n = 1). It is noteworthy that choice of an oxidation reaction over a reduction reaction may not affect the generality of methods and discussions drawn in this paper. In fact, a reversed redox reaction, i.e. reduction reaction, might be obtained by using the same formulations proposed in the present paper and a slightly different choice of B.C.s. This issue is explained in the subsequent parts, where B.C.s are discussed. It is assumed that the investigated system in this study is working under a steady-state and isothermal conditions. The equations governing the transport and production/consumption of reacting agent and electric charges are given in the following subsection.
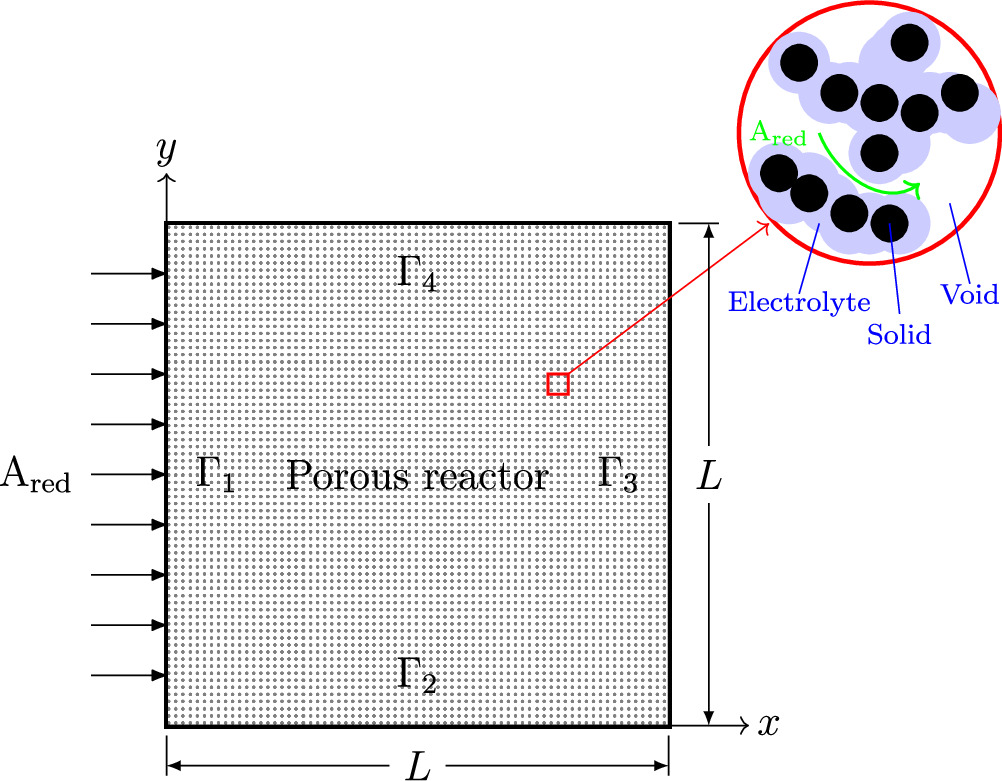
Figure 1. Schematic of electrochemical porous reactor.
Download figure:
Standard image High-resolution imageGoverning equations
The governing equations presented here are based on a volume-averaged approach. The generic differntial form of any balance equation (e.g. mass, energy, and charge) on a control volume is expressed as:

where ρ is any quantity of interest, such as mass, energy, and charge. Moreover, f and S represent the flux and source terms of the relevant quantity. In the present study, it is assumed that the distribution of the reactant concentration throughout the porous reactor is controlled by the Fick's second law of diffusion 44–46 and electrochemical reaction rate. Therefore, conservation of species in this ERD system reads as: 44

in which C is reactant species concentration (mol m−3), Deff is effective diffusivity (m2 s−1), and RC is the reaction source term (mol m−3 s−1). This source term is defined as  for an oxidation reaction and
  for a reduction reaction. Also, jsrc is current density source (A m−2), aeff is effective active specific surface area (m2 m−3), and F is Faraday constant (96485 C mol−1). Under a steady-state condition, the term on the left-hand side of Eq. 3 is zero. Therefore, in the calculations of the present study, the species accumulation term is disregarded. However, since the unsteady form of this equation is used for derivation of entropy production rate in the subsequent section, it is shown in this form. The conservation of electric charges in electrolyte and solid phases follows Ohm's law and is expressed as follows for an electroneutral system:
47
for a reduction reaction. Also, jsrc is current density source (A m−2), aeff is effective active specific surface area (m2 m−3), and F is Faraday constant (96485 C mol−1). Under a steady-state condition, the term on the left-hand side of Eq. 3 is zero. Therefore, in the calculations of the present study, the species accumulation term is disregarded. However, since the unsteady form of this equation is used for derivation of entropy production rate in the subsequent section, it is shown in this form. The conservation of electric charges in electrolyte and solid phases follows Ohm's law and is expressed as follows for an electroneutral system:
47


where q+ and q− are positive and negative charge densities (C m−3),  and
and  are effective electrolyte and solid phases charge conductivity (S m−1), and ϕl and ϕs are electrolyte and solid phases potentials (V), respectively. It should be emphasized that the left-hand side of Eqs. 4 and 5 represent accumulation rate of electric charge in the system. In electrochemical reactors (e.g. electrode of batteries or FCs), no charge is accumulated and therefore, this term is usually not shown in the literature. Moreover, since this study assumes a steady-state condition, these terms are zero (similar to what exists in the literature). However, as aforementioned, the unsteady form of governing equations is used for derivation of local entropy generation rate. The current density source, jsrc, might be expressed by well-known Butler-Volmer equation as follows.
47
are effective electrolyte and solid phases charge conductivity (S m−1), and ϕl and ϕs are electrolyte and solid phases potentials (V), respectively. It should be emphasized that the left-hand side of Eqs. 4 and 5 represent accumulation rate of electric charge in the system. In electrochemical reactors (e.g. electrode of batteries or FCs), no charge is accumulated and therefore, this term is usually not shown in the literature. Moreover, since this study assumes a steady-state condition, these terms are zero (similar to what exists in the literature). However, as aforementioned, the unsteady form of governing equations is used for derivation of local entropy generation rate. The current density source, jsrc, might be expressed by well-known Butler-Volmer equation as follows.
47
In Eq. 6, i0, Cref, αa, αc, η, R, and T are exchange current density (A m−2), reference concentration (mol m−3), anodic charge transfer coefficient, cathodic charge transfer coefficient, activation overpotential (V), gas constant (8.3145 J mol−1 K−1), and temperature (K). The correction term  is considered to include the effect of mass transport limitations. In this study, one of the terms on the right-hand-side of Eq. 6 is neglected by assuming a largely-polarized condition. The activation overpotential is measured based on the local electrolyte and solid phases potentials as follows:
47
is considered to include the effect of mass transport limitations. In this study, one of the terms on the right-hand-side of Eq. 6 is neglected by assuming a largely-polarized condition. The activation overpotential is measured based on the local electrolyte and solid phases potentials as follows:
47

where Eeq is equilibrium potential (V). As indicated in Eq. 6, in such an ERD system, current density and overpotential are correlated through two rate mechanisms, including: (1) charge transfer rate and (2) mass transport rate. The former mechanism dictates how fast the reactant species is consumed (or likewise, the speed at which the products are produced). On the other hand, the mass transport rate determines the pace of reactant supply and products discharge from the reaction site. The overall process kinetics depends on the slowest mechanism. In electrochemical applications, sluggish mass transport is a serious challenge when the device is working at a high current density and causes a huge drop in output power. Therefore, not only sufficient supply of reactant species but also adequate discharge of products is vital to improve the performance. While thanks to previous experimental studies, the bulk magnitude of mass diffusivity and electric charges conductivity are known for many substances, estimating the effective values of these transport properties in porous media is a long-running dispute among researchers. 48–50 The Bruggeman equation is an enduring correlation relating the effective properties to the material volume fraction through a power-law. Despite numerous arguments around its validity, 51,52 the simplicity of the Bruggeman equation led to frequent utilization and recognition of this model in various disciplines, including electrochemistry applications. 53–57 Therefore, in this study, the effective properties are computed based on the Bruggeman model with a different exponent from that of the original equation as follows:

in which D0,  ,
,  , and a0 are bulk mass diffusivity (m2 s−1), bulk electrolyte ionic conductivity (S m−1), bulk solid phase electric conductivity (S m−1), and bulk active specific surface area (m2 m−3), respectively. These bulk values are corrected according to the volume fractions of void (εv), electrolyte phase (εl), and solid phase (εs) together with the relevant given penalty exponents, β1 to β4.
Boundary conditions
The system of partial differential equations (PDEs) given by Eqs. 3 to 5 might be solved in the calculation domain, Ω, if sufficient B.C.s are provided on the boundary of the domain, ∂Ω. While the proposed model could work with any set of sufficient B.C.s, two of them are our interest in this study. The chosen B.C.s, according to Fig. 1, are given by:
and
where Cbnd,  ,
,  , and jbnd are constant concentration (mol m−3), electrolyte potential (V), solid potential (V), and ionic current density (A m−2) on boundary, respectively. Also,
  denotes the outward unit normal vector. In the first set specified by Eq. 9, a combination of Dirichlet and homogeneous Neumann B.C.s are introduced for all variables. The values of all variables (concentration, electrolyte potential, and solid potential) are given on one of the system boundaries. This means that the system total overpotential (i.e., the difference of solid and electrolyte phases potentials on the boundaries that the current density is flowing) is given. Based on these settings, the total electric current that passes the system boundaries is computed by solving the system of PDEs. This current represents the total electrochemical reaction rate that is taking place within the ERD system. In Eq. 10, the B.C.s for reactant concentration and solid phase potential are kept the same as in previous conditions. In contrast, the ionic current density passing Γ3 is prescribed. Accordingly, the total electrochemical reaction rate, that is happening the entire porous reactor, is known. As a result, in such kind of setup, the system overpotential would be determined as a solution of governing equations.
The reason behind these choices for B.C.s are explained as follows. As stated previously, one of the aims of this study is to elucidate the best material distribution (structure) in the porous reactor that enhances the system performance. Hence, it is essential to clearly interpret the meaning of "performance". In electrochemical systems, performance enhancement is achieved either by: (1) maximization of total reaction rate (or likewise, the current that is flowing through the system boundaries) at a given overpotential level or, (2) minimization of system overpotential (which represents the energy loss) for a given total reaction rate. Although the combination of both these strategies might be a third alternative for performance improvement, it is out of the scope of this study. Based on the given definitions of "performance" in an ERD system, the optimization is formulated as both maximization and minimization problems. The B.C.s given by Eqs. 9 and 10 are chosen in a way to fulfill the aforementioned optimization goals. Using the first set of B.C.s, the solution of governing equations (i.e., total current density flowing the system boundaries), might be used as the objective function for the maximization problem. On the other hand, by employment of B.C.s given in Eq. 10, the system overpotential could be used as the objective function for minimization formulation. The details of maximization and minimization problems are comprehensively discussed in Optimization algorithm section. To distinguish the two formulations described above, hereinafter, the governing equations (Eqs. 3 to 5) together with B.C.s of Eq. 9 are called "overpotential-based ERD system" and the combination of the governing equations and B.C.s of Eq. 10 are called "current-based ERD system". The names are assigned based on the electrolyte phase condition on boundary Γ3 that is given as the model input. Thus, "overpotential-based ERD system" is associated with the maximization optimization and "current-based ERD system" is associated with the minimization optimization. It is also noteworthy that by a proper choice of values for B.C.s given in Eqs. 9 and 10, the electrochemical reaction might be switched between oxidation and reduction. For instance, a positive value for jbnd in B.C.s of Eq. 10, provides an oxidation reaction. A negative value will result in a reduction reaction.
Entropy generation model
A system is at an equilibrium state if all macroscopic flows, such as heat or mass fluxes, are zero within its boundaries. Equilibrium thermodynamics, as part of contemporary thermodynamics, successfully handles the systems at an equilibrium state as well as those involving low equilibrium, relatively slow, quasiequilibrium processes. Non-equilibrium thermodynamics (NET) extends conventional equilibrium thermodynamics to characterize the systems which are not in an equilibrium state. 29,30 The concept has been widely used in the literature to analyze the entropy generation in various engineering applications and thermofluid systems. 58–64 Since the ERD system in this study is in a non-equilibrium condition from a global standpoint, the concept of NET is recruited to develop a model for evaluation of local and global entropy generation rate. A lower entropy production is only favorable if the output of the system (in ERD system, the total reaction rate) is kept at a certain amount. If a system is working under a finite time/size thermodynamics, doing more (i.e. a higher electrochemical reaction rate in the case of ERD system) will inevitably result in a higher amount of entropy production. Therefore, maximization of current in the "overpotential-based ERD system" is expected to increase the total amount of entropy generation rate. However, at a same level of reaction rate (i.e. happening in "current-based ERD system"), an optimized design solution will minimize the system losses and consequently reduce the total entropy generation of the system. The difference between the two optimization approaches, including maximization and minimization formulations, might be recognized in terms of entropy generation. This contrast is highlighted in Results and discussion section where the results of both strategies are discussed. Development of entropy generation model starts with the extended form of Gibbs equation, which is a fundamental thermodynamics equation and reads as follows: 29,65,66

where U, S, V, N, Q+ and Q− are internal energy (J), entropy (J K−1), volume (m3), the number of moles (mol), positive electric charge (C), and negative electric charge (C) respectively. Also, T, p, and μ are temperature (K), pressure (Pa), and chemical potential (J mol−1), respectively. It is assumed that the reactant substance is an ideal gas, and the system is working under a constant temperature (isothermal) condition. Since the internal energy of an ideal gas is a function of temperature and the volume of the porous reactor is not changing, dU and pdV are zero. By dividing Eq. 11 by the volume, it is simplified into:

where s = S/V is the entropy density (J k−1 m−3). Given the fact that the system does not have any convective flow, the time derivative of the entropy is given by:

By substituting the partial derivatives on the right-hand-side of Eq. 13 with Eqs. 3 to 5, the rate of entropy accumulation is as follows:
in which plus and minus signs of term  are related to oxidation and reduction reactions, respectively. By comparing the general form of entropy balance
  29,30
with Eq. 14, the entropy flux (W K−1 m−2) and entropy generation rate per unit volume (W K−1 m−3) are respectively given by:
29,30
with Eq. 14, the entropy flux (W K−1 m−2) and entropy generation rate per unit volume (W K−1 m−3) are respectively given by:

and
The first three terms on right-hand-side of entropy generation rate equation, σ, are related to the entropy produced by the transport processes. The other three terms correspond to the source terms in the governing equations (Eqs. 3 to 5). To quantify the individual contribution of each process to the entropy generation rate, the terms are split into four contributions as follows:
where σmt, σit, σet, and σrx correspond to the entropy production by mass diffusion, ion transport, electron transport, and reaction (W K−1 m−3), respectively. Moreover, to evaluate the total amount of entropy production throughout the entire system (W K−1 m−1), the local entropy generation rate, σ, should be integrated as:

Likewise, the total entropy production is also broken into four parts, including Pmt = ∫Ω σmt dΩ, Pit = ∫Ω σit dΩ, Pet = ∫Ω σet dΩ, and Prx = ∫Ω σrx dΩ, each of which is associated with the integral of corresponding local term over the entire domain. The chemical potential of an ideal gas at a constant temperature is computed by: 29
in which μref and R are chemical potential at the reference point (J mol−1) and universal gas constant (8.314 J K−1 mol−1), respectively. For a given electrochemical reaction, the reference chemical potential correlated to the equilibrium potential by the following equation. 67

Non-dimensional analysis
To generalize the applicability of this study, the governing equations are converted into a dimensionless form. Non-dimensionalization might reduce the number of model parameters, expand the applicability of the obtained results, increase the stability and accuracy of the simulated results, and make the comparison between various scenarios easier. 68,69 The system of governing equations, as well as the B.C.s, are non-dimensionalized by substitution of proper dimensionless variables to remove the units. The dimensionless form of Eqs. 3 to 5 at a steady-state condition reads as:


in which C*,  , and
, and  are dimensionless concentration, electrolyte potential, and solid potential, respectively. Moreover, ∇* is differentiation with respect to dimensionless coordinates x* and y*. The dimensionless dependent and independent variables are given by:
In addition, the dimensionless groups are expressed as:
where L, C0 and ϕ0 are the characteristic length (m), characteristic concentration (mol m−3), and characteristic potential (V) of the system, respectively. Based on these definitions, θ1 is the dimensionless conductivity. This dimensionless number could be interpreted as the ratio of species intrinsic diffusivity and system exchange diffusivity (Dexchange = L2
a0
i0/(C0
F)). From another perspective, θ1 is attributed to inverse of Damköhler number (or inverse square Thiele modulus) in chemical engineering literature,
70–73
which indicates the ratio of the bulk diffusion rate and reaction rate. Moreover, θ2 represents the ratio of intrinsic conductivity and system exchange ohmic conductivity ( ). In electrochemistry literature, dimensionless parameter θ2 is known as Wagner number,
47,67
which shows the proportion of kinetic resistance to ohmic resistance. Finally, θ3 represents the ratio of solid and electrolyte phases conductivity. In many real electrochemical applications, such as polymer electrolyte membrane fuel cell (PEMFC), this ratio is relatively large (θ3 ≫ 1). While there might be different alternatives for the characteristic parameters of the system, a reasonable choice is given:
). In electrochemistry literature, dimensionless parameter θ2 is known as Wagner number,
47,67
which shows the proportion of kinetic resistance to ohmic resistance. Finally, θ3 represents the ratio of solid and electrolyte phases conductivity. In many real electrochemical applications, such as polymer electrolyte membrane fuel cell (PEMFC), this ratio is relatively large (θ3 ≫ 1). While there might be different alternatives for the characteristic parameters of the system, a reasonable choice is given:

Based on Eq. 26, the characteristic concentration is assumed to be the constant concentration on the inlet boundary. This way, the concentration B.C. would be easily scaled to unity. Also, characteristic potential is chosen to be the thermal voltage of the system that is correlated to the temperature at which the system is working. The characteristic length is considered to be equal to the length of the domain, as shown in Fig. 1, for the sake of simplicity. Using the dimensionless parameters introduced before, the B.C.s of "overpotential-based ERD system" and "current-based ERD system" are non-dimensionalized as follows:
and
in which, the boundary values are converted to a dimensionless form according to:
Furthermore, the dimensionless entropy generation rate, σ* might be determined through diving the left-hand-side of Eq. 16 by the exchange entropy generation rate (W K−1m−3) and is formulated as:
in which the exchange entropy generation rate is defined as σexchange = a0
i0
ϕ0/T. The individual contributions, σmt, σit, σet, and σrx, could be non-dimensionalized to  ,
,  ,
,  , and
, and  after dividing by the exchange entropy production. Finally, the total dimensionless entropy generation is computed as:

where Ω* represents the non-dimensional domain. The related dimensionless breakdowns,  ,
,  ,
,  , and
, and  , are evaluated by a similar integration.
Optimization Algorithm
In the present study, a TO technique is used to seek the best spatial distribution of constituent, including solid phase, electrolyte phase, and voids, in the given design domain. By controlling the local volume fraction of each constituent, the local effective properties of the system (i.e., diffusivity, ionic conductivity, electric conductivity, and active specific surface area) might be adjusted in a way that provides the best compromise between the transport and rate processes. Such a balance could result in a better system performance. As aforementioned, a better performance might be interpreted in two ways: (1) in an "overpotential-based ERD system", an optimized system should have a higher total electrochemical reaction rate and (2) in a "current-based ERD system", an optimized system should lead into a lower energy loss (or lower total overpotential). Hence, for each system setting, a unique formulation is used as the optimization objective. However, the optimization procedure for both problem formulations are same. Therefore, in this section, first, the two problem formulations are described and next the common TO algorithm is briefly explained.
TO outperforms other mathematical optimization methods, such as parametric optimization, because of higher degrees of freedom provided by this technique. 74–76 Although such a substantial increase in degrees of freedom makes the algorithm more sophisticated, it possibly allows obtaining a much better result. Advantages of TO over conventional optimization methods are comprehensively studied in the literature and interested readers may refer to a previous publication of our group 77 or the works of other research groups. 22,78,79 According to TO formalism, the optimization is defined as a material allocation problem in a prescribed design domain. A so called "density method" 16 is used to describe the local volume fractions. Pursuant to this method, at any position, x, in the design domain, Ω, the volume fraction of each constituent is a continuous function changing between 0 and 1 (0 ≤ εl(x) and εs(x) and εv(x) ≤ 1) with the restriction that εl(x) + εs(x) + εv(x) = 1.
Problem formulation: Current-based ERD system
Since the current density that passes the system boundaries is given in a "current-based ERD system", the total rate of electrochemical reaction is prescribed in this system setting as an input. In this formulation, the goal is to minimize the system total overpotential for a certain reaction rate. Total overpotential indicates the excess required potential to drive a Faradaic reaction at a specific current density. Hence, it is favorable to reduce the total overpotential in an electrochemical system for a given current density. Minimization of total overpotential will lead to maximization of output power for a power generating system and will reduce the input power for a power consuming system. Based on these explanations, the optimization problem is defined as:
in which Fobj, 1 is the objective function and  is non-dimensional equilibrium potential. Knowing that the total overpotential for a reduction reaction is negative, the absolute value of overpotential is used in the objective function definition. It is noteworthy that in an ideal condition, the reactor potential (i.e.,
  ) should be as close as possible to the thermodynamic equilibrium potential (
 ). Volume fractions of electrolyte and solid phases are considered as design variables in this optimization problem. These volume fractions are the system parameters that are required for solving the system of governing equations. Since the summation of all volume fractions should be equal to unity, by knowing two of them, the third one might be calculated automatically. Hence, the porosity (volume fraction of voids) is calculated based on the values of two design variables. Moreover, the optimization problem is constrained by the governing equations of the system. As an additional constraint, it is assumed that the local volume fractions of the electrolyte and solid phases could only alter within a predefined range. These ranges are given by
  ,
,  ,
,  , and
, and  that are minimum and maximum allowed volume fractions of electrolyte and solid phases, respectively.
Problem formulation: Overpotential-based ERD system
In an "overpotential-based ERD system", the total overpotential ( ) is given as the problem input through the B.C.s and the total electrochemical reaction rate might be calculated by solving the governing equations. Total electrochemical reaction rate is equivalent to the total current that passes the system boundary. Since the system is electroneutral, the total amount of negative and positive electric charges that leaves (or come into) the system is equal. Hence, in this system setting, the aim is to maximize the total electrochemical reaction rate. Increasing the electrochemical reaction rate (or system current) at a given overpotential is equivalent to maximizing the output power of the system (for a power generating system). Improving the active specific surface area and discharge of products from the reaction sites will boost the reaction rate. This could be obtained by increasing the volume fractions of electrolyte and solid phases. However, to keep the reaction rate high, it is necessary to assure sufficient reactant delivery to the reaction sites through pores. By increasing the volume fractions of electrolyte and solid phases, the volume fraction of voids will consequently be reduced. This means that the mass transport resistance will be increased and the delivery of reactant spices will be more complicated. Therefore, there should be a trade-off between reactant consumption and delivery rates. This trade-off leads to an optimization problem that might be addressed by controlling the local composition of the porous reactor. This optimization problem is mathematically indicated in a non-dimensional form as:
where Fobj, 2 is the objective function. Given the fact that  is negative in case of a reduction reaction, the absolute value of reaction rate is used in this equation to generalize the applicability of the objective function for any kind of electrochemical reaction. As represented in Eq. 33, the goal is to maximize the overall dimensionless rate of electrochemical reaction over the entire domain. The term
  is the local dimensionless rate of reaction and by integrating it over the non-dimensional domain, the overall value might be computed. Evidently, this objective function could be expressed in a dimensional form with the corresponding dimensional parameters. However, since this study focuses on a non-dimensional analysis of the ERD system, the objective function is also expressed in a dimensionless form.
Numerical implementation
In this research work, COMSOL Multiphysics ® (version 5.6) is used to solve the governing equations and to implement the optimization procedure. The calculation domain, system parameters, governing equations, and B.C.s are specified in the software. In the first step of the optimization process, the design variables are initialized and Eqs. 21 to 23 are solved using a finite element method. By solving these equations, the distribution of concentration, electrolyte potential, and solid potential are obtained. Next, the objective function is evaluated according to Fobj, 1 or Fobj, 2. The choice of objective function depends on the system of interest. Afterward, the sensitivity (or gradient) of objective function is computed with respect to the design variables using an adjoint state method. 80 Since the adjoint method is independent of the number of the design variables, it is computationally much cheaper than other approaches, such as the forward method. Therefore, it is very useful for optimization problems which contain numerous decision variables. Next, the design solutions are regularized using a Helmholtz filter 81 and hyperbolic tangent project. 82 These regularization helps to prevent checkerboard pattern, 16 which is a common challenge in TO. This problem has been addressed in the literature comprehensively and the readers are referred to the papers in this field, such as Refs. 81, 83, 84, for further information. In the next step, the design variables are updated locally in throughout the entire calculation domain. The updating procedure is conducted using a globally convergent method of moving asymptotes (GCMMA) algorithm. 85 GCMMA is an efficient algorithm for handling problems with abundant design variables. As a post-processing step, the local and total entropy production rate are also calculated. This step is separate from the optimization process and the entropy generation is assessed in each iteration of optimization to track the changes. The explained process is repeated until the convergence criterion (in this case, maximum number of iteration) is reached. The optimization procedure is summarized as follows:
- Step 1:The calculation domain, governing equations, and B.C.s are defined and the design variables are initialized.
- Step 2:
- Step 3:The gradient of objective function with respect to the design variables is evaluated using the adjoint method.
- Step 4:The design solutions are regularized using a Helmholtz filter and a hyperbolic tangent projection to obtain smoothed solutions.
- Step 5:The design variables are updated using the GCMMA algorithm.
- Step 6:
- Step 7:If the convergence criteria are met, the iteration is stopped. Otherwise, steps 2 to 6 are repeated.
Results and Discussion
This section presents the results of numerical calculations. The design domain is a square with a 1 × 1 non-dimensional size (see Fig. 1). The optimization process is conducted under several conditions, as indicated in Table I for both minimization and maximization problems. 10,000 structured quad meshes are used for numerical calculations. Given that the volume fractions of electrolyte and solid phases are controlled at each grid in the optimization process, the total number of design variables is 20,000. Each optimization is carried out for 300 iterations and necessary measures are taken to guarantee sufficient convergence with this number of iterations.
Table I. Values/ranges of system dimensionless parameters.
| Parameter | Value/Range | Parameter | Value/Range |
|---|---|---|---|
| θ1 | 2–5 |

| 0 |
| θ2 | 20–50 |

| 0 |
| θ3 | 5–10 |

| 1–9 |
| β1, β2, β3 | 2 | jbnd,* | 5–30 |
| β4 | 1 |

| 0 |
| α | 1 |

| 0.5 |
Current-based ERD system
As explained before, in this problem setting, the objective is to reduce the total overpotential of the system. The total overpotential refers to the amount of energy necessary for an electrochemical reaction to proceed at a given conversion rate (current density). Figures 2 and 3 depict the optimized distribution of constituents under various system settings. The optimal spatial distribution of electrolyte, solid, and void phases are illustrated for two different dimensionless current densities (jbnd,*). In each figure, the optimized results for four different combinations of dimensionless numbers (θ1 to θ3) are shown to reflect the impact of each number on the final optimization outcome. Analyzing and contrasting the results from each system configuration elucidates the impact of diverse transport, rate, and characteristic parameters on the ultimate optimal structure. Under all conditions, the optimization process led to complex tree-root-like shapes. Comparing the final objective function values of each scenario across Figs. 2 and 3 shows that in general, a higher working current density corresponds to a higher total overpotential. For instance, as jbnd,* is changed from 30 to 5 at the first θs settings (Figs. 2a vs 3a), the non-dimensional total overpotential is altered from 4.64 to 0.589. This is due to the intrinsic relationship between current density and overpotential in an electrochemical system. The higher the working current density of the system, the higher total overpotential. The initial layout used for all the cases reported in these two Figures are the same (uniform εl = 0.25 and εs = 0.25). However, it is evident that the solid volume fraction in final layouts of Fig. 3 (jbnd,* = 5) is higher than those of Fig. 2 (jbnd,* = 30). At a low current density, the activation overpotential is the major contributor to the total overpotential. Therefore, it is favorable to increase the average volume fraction of the solid phase. On the contrary, at a high current density(jbnd,* = 30), where sluggish mass transport is dominant, larger diffusion channels are preferred to assure a sufficient reactant delivery. As it can be understood from Eq. 25, the system mass transport is controlled by dimensionless number θ1. Therefore, changing the value of this parameter should affect the optimized distribution of voids. As it can be seen in Fig. 2, decreasing the value of this parameter influences the optimized porosity distribution in the ERD system. However, this impact is more significant at a high current density because of a serious mass transport limitation under this operational condition. The same changes in θ1 at a low current density cause a slight change in the final void distribution. This is due to the fact that at jbnd,* = 5, the concentration overpotential is small and a variation of θ1 could be compensated by a tiny change in the optimized layout (see Figs. 3a and 3b).
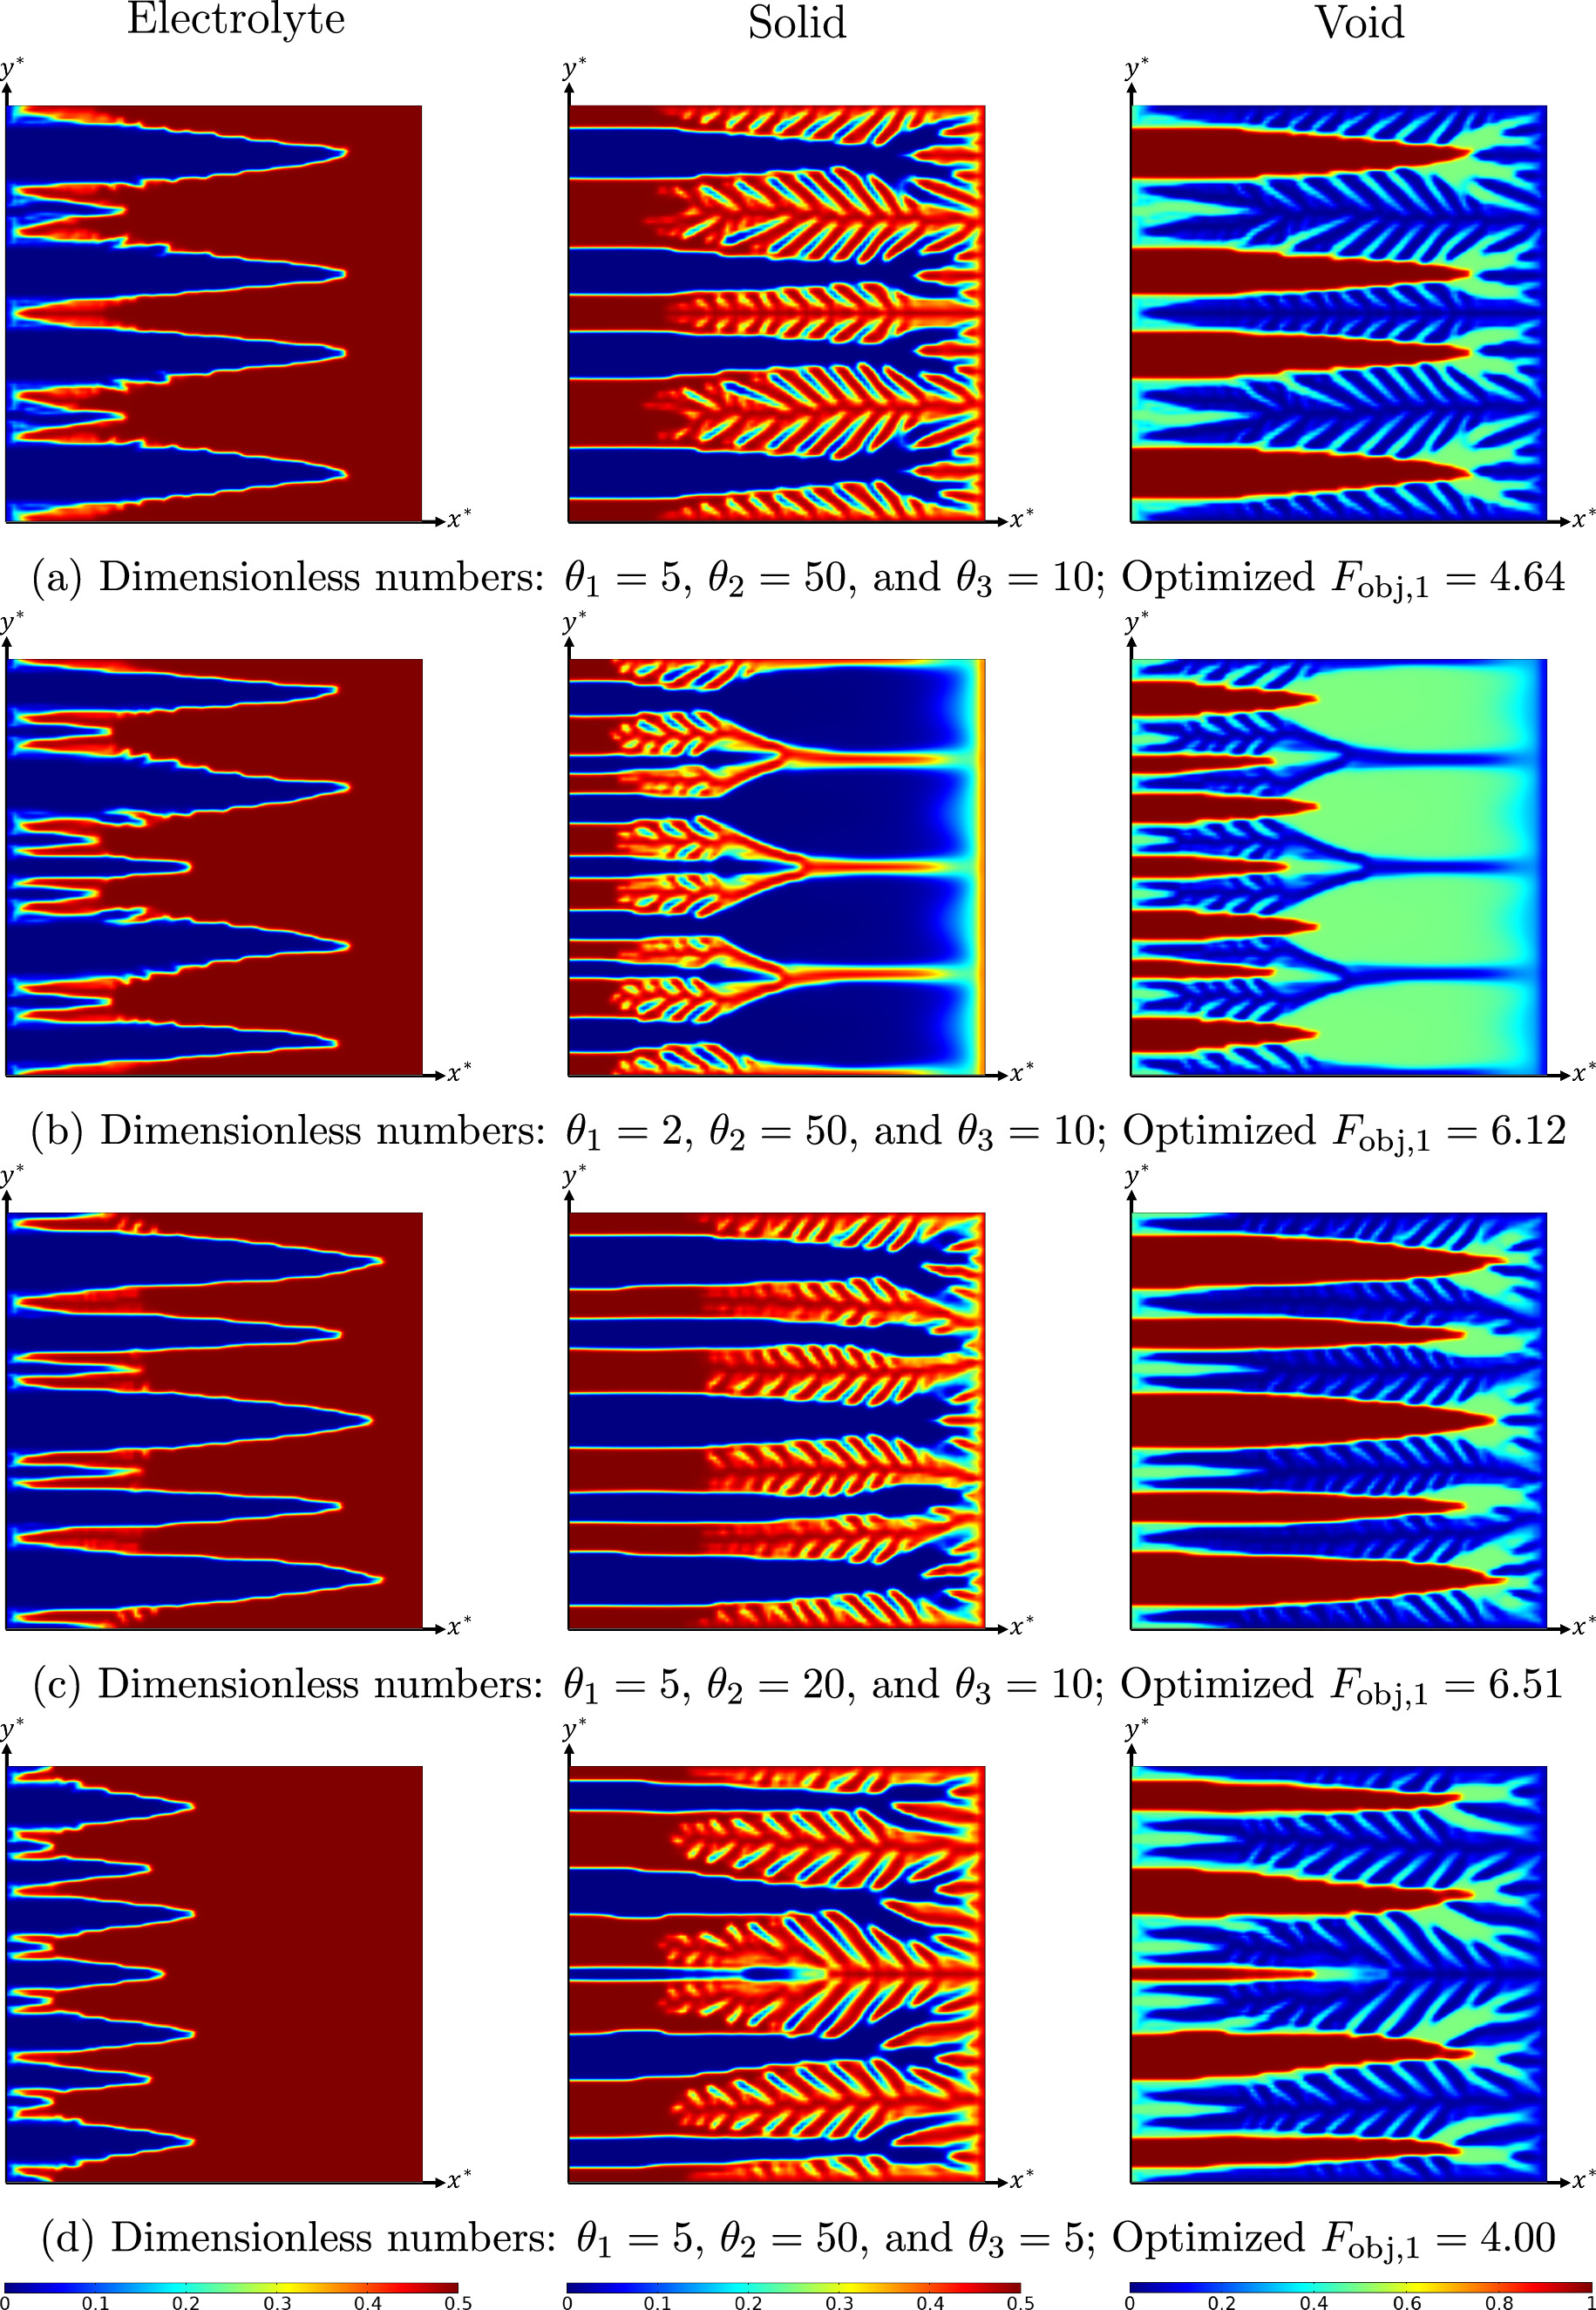
Figure 2. Optimized volume fraction distribution of electrolyte, solid, and void phases under various system settings at jbnd,* = 30; Improvement of optimized layout compared to initial uniform distribution is: (a) 49.5%, (b) 52.5%, (c) 64.2%, and (d) 39.6%.
Download figure:
Standard image High-resolution image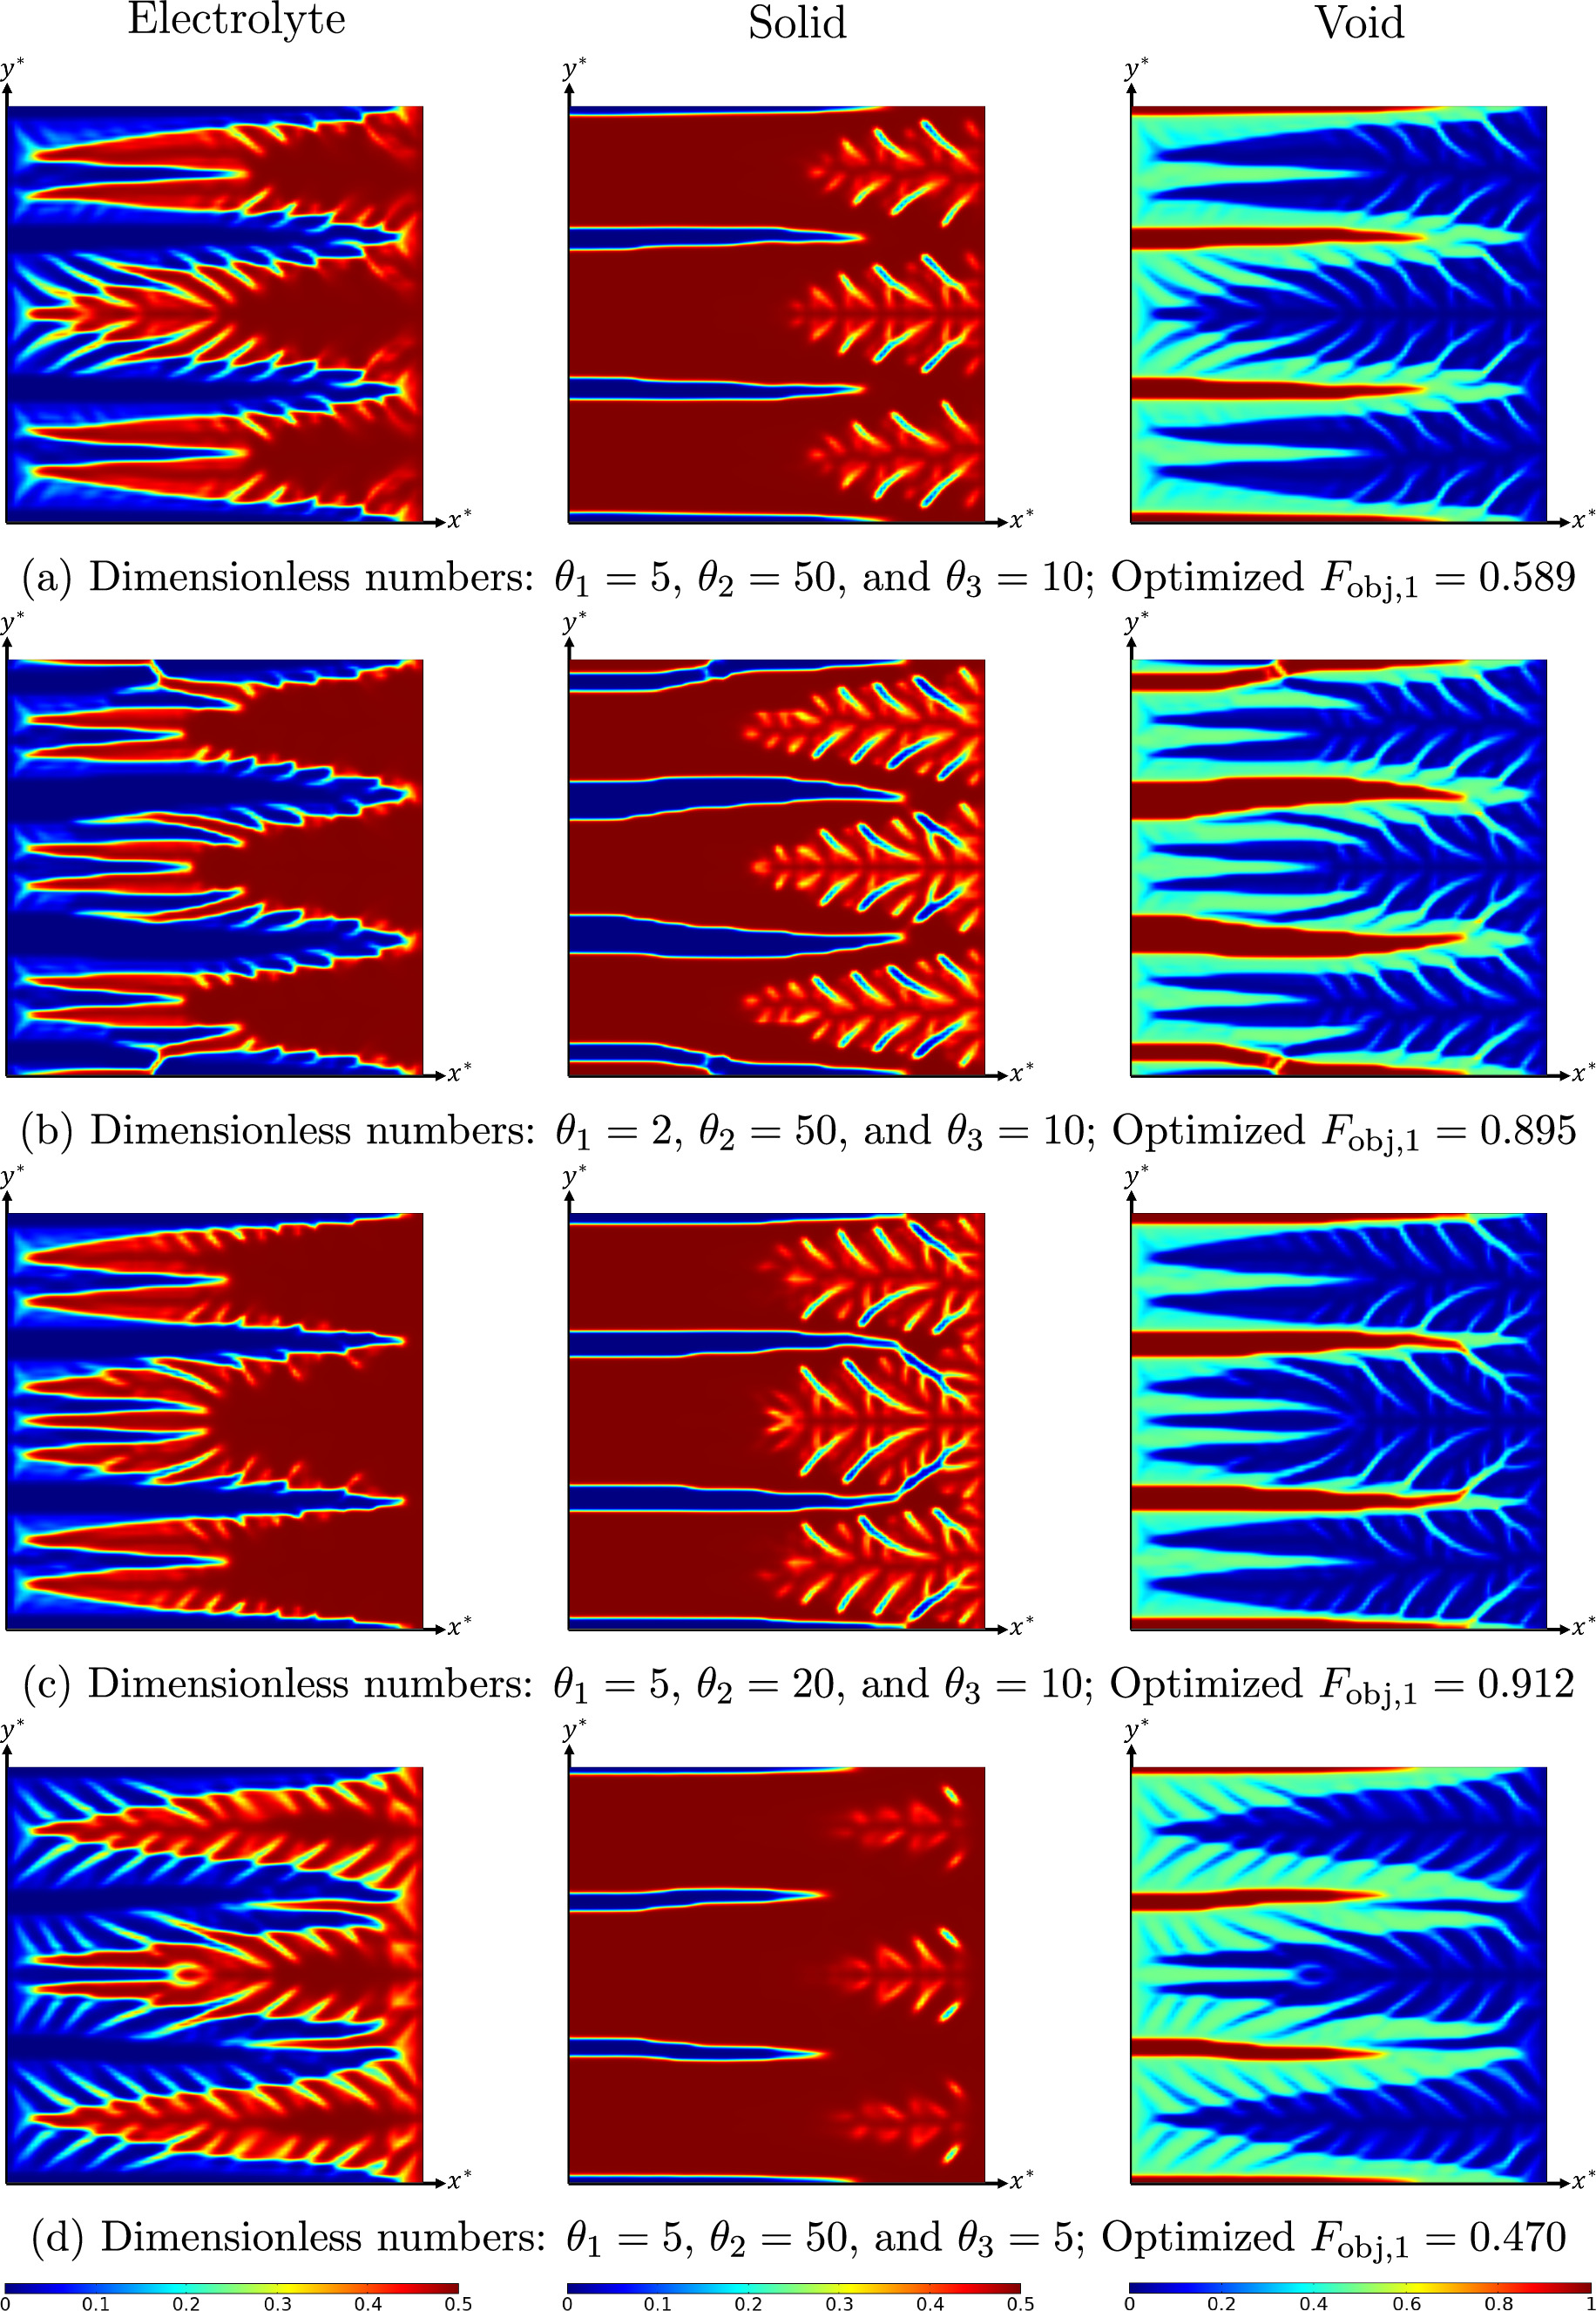
Figure 3. Optimized volume fraction distribution of electrolyte, solid, and void phases under various system settings at jbnd,* = 5; Improvement of optimized layout compared to initial uniform distribution is: (a) 59.1%, (b) 48.8%, (c) 57.6%, and (d) 61.4%.
Download figure:
Standard image High-resolution imageIn addition, dimensionless number θ2 dictates the ohmic conductivity of the system. Hence, diminishing this parameter is associated with new layouts (Figs. 2c and 3c) which provide a better pathway for conduction of electric charges. Finally, decreasing parameter θ3 boosts the ionic conductivity of the system in comparison to the electric conductivity. In many real applications, the electrochemical devices suffer from a high ionic resistance, but not electric one. Therefore, decreasing θ3 (by keeping θ2 constant) improves the balance between electron and cation transport in the ERD system. Consequently, a lower total overpotential could be achieved after optimization with a smaller θ3. For jbnd,* = 5, this means a less requirement for the electrolyte phase (see Fig. 3d). The optimized layouts shown in Figs. 2 and 3 reduce the overpotential of the ERD system between 39.6% and 64.2% compared to the initial uniform configuration (before optimization). The improvements owe to the heterogeneous structures obtained from TO. These tree-root-like structures facilitate diffusion of reactant species and electric charges while augmenting the reaction rate throughout the system. For instance, in the case of mass diffusion, all optimized structures involve some primary diffusion channels together with secondary channels. The primary channels are extended throughout the system in x-direction, which facilitates the delivery of the reactant material to the regions far from the inlet boundary (∂Ω1). Evidently, the system of interest in this study is symmetrical with respect to the y-axis (see Fig. 1). Therefore, it is necessary to direct the reactant in x-direction, especially at a high jbnd,*, which mass transport limitation is more severe. Additionally, the secondary channels connected to the primary ones help a better dissemination of the reactant over the entire porous reactor. On a similar note, the electrolyte and solid phases are also arranged in a way that give a greater access to electric charge currents. Since the left boundary is isolated to the transport of ions, the electrolyte phase is more concentrated on the right half of the reactor. It is notable that the solid phase not only transfers the produced electrons to the outside but also provides the necessary surface area for the reaction. Therefore, both these roles are reflected in the optimal layout. The heterogeneous distribution of materials within the ERD system strikes a balance between multiple transport and rate processes, consequently leading to enhanced overall performance.
To further analyze the optimization process, the scenario with θ1 = 5, θ2 = 50, and θ3 = 10 is assessed in details. The convergence history of the optimization process is plotted in Fig. 4a along with the system layout at two intermediate iterations (iteration number 20 and 70). As expected, during the optimization, the objective function monotonically decreased. A sharp decline is observed at the beginning, which is due to the higher sensitivity (or gradient) of the objective function in these iterations. As the optimization proceeds, the change rate slows down. The objective function (total overpotential) reaches a constant value of 4.64 after around 125 iterations, where the changes in objective function drops under 0.01% afterwards. This assures a confident convergence. Figure 4b demonstrates the current density-overpotential (I-V) relationship of the system before and after optimization. Indeed, an I-V curve shows the performance of the system for a wide range of current densities. To demonstrate how the results of optimization at various current densities are different, the I-V curves are plotted for two structures obtained from optimization at jbnd,* equal to 30 (point A on the plot) and 5 (point A on the plot). From the first optimization, point A is shifted to  and the structure shown in Fig. 2a is obtained. Then, this optimal layout is used to plot the I-V curve over a range of 5 ≤ jbnd,* ≤ 30. A similar procedure has been conducted for optimization at point B. In both cases, the optimal I-V curve is vertically shifted downward (vertical optimization). However, the final I-V characteristics of the two optimal structures are different. Evidently, at medium and high current densities (jbnd,* ≥ 15), I-V curve of
  is superior. However, in low current density regions (jbnd,* ≤ 5), the I-V characteristics of
  surpasses that of the other optimization. The reason for this difference is when the optimization is performed at a high current density, the optimal layout comes with large diffusion channels (see Fig. 2a). At jbnd,* ≥ 15, the concentration depletion is the prevailing mechanism. Hence, larger diffusion channels (higher average porosity) is beneficial to make a compromise between the competing processes. On the other hand, at jbnd,* ≤ 10, sufficient reactant is supplied to the reaction site. Hence, a higher volume fraction of the solid phase is needed to increase the effective electrochemical surface area and consequently decrease the system total overpotential. What stands out in this figure is that when optimizing an electrochemical system at a specific working point, the optimal result might not be equally good over the entire I-V curve. Therefore, the optimization point should be adjusted according to the application and purposes. The average effective transport coefficients of the system before and after optimization are compared in Table II. The transport properties after optimization are divided by the relevant exchange properties (Dexchange and
  ) to obtain the dimensionless properties. As it can be seen in this table, all transport properties are considerably enhanced after optimization. The only exception is average diffusivity after optimization at jbnd,* = 5. Since the overall reaction rate is low at jbnd,* = 5, the reactant delivery is sufficient even at a relatively lower effective diffusivity. Therefore, TO favors to reduce the porosity (effective diffusivity) and instead increases the volume fraction of solid phase to augment the electrochemical surface area.

Figure 4. (a) Convergence history and (b) I-V curves for θ1 = 5, θ2 = 50, and θ3 = 10.
Download figure:
Standard image High-resolution imageTable II. Average values of dimensionless transport properties and volume fractions before and after optimization for θ1 = 5, θ2 = 50, and θ3 = 10; the values in parentheses shows the changes with respect to the before optimization case.
| Optimization | D*, ave |

|

|

|

|

|
|---|---|---|---|---|---|---|
| Before | 1.25 (−) | 0.284 (−) | 2.84 (−) | 0.25 | 0.25 | 0.5 |
| After - jbnd,* = 30 | 1.62 (+29.6%) | 0.679 (+139%) | 5.05 (+77.8%) | 0.264 | 0.313 | 0.423 |
| After - jbnd,* = 5 | 0.766 (−38.7%) | 0.537 (+89.1%) | 9.78 (+244%) | 0.274 | 0.446 | 0.280 |
To clarify the benefits of a heterogeneous structure, the optimal layout (obtained from optimization of θ1 = 5, θ2 = 50, and θ3 = 10 at jbnd,* = 30) is compared to two uniform distributions. As aforementioned, the optimization process started with a homogeneous material distribution in which volume fractions of both electrolyte and solid phases were 0.25. In this case, the non-dimensional total overpotential is 9.18. After optimization, this value is declined to 4.64, which shows a 49.5% reduction in system losses. Such a substantial improvement proves the advantage of the topologically-optimized layout over the uniform distribution. In the final optimum layout, the average volume fraction of various phases are  ,
,  , and
, and  as shown in Table II. Considering these average values with a uniform distribution gives a total overpotential of
  , which is considerably higher than 4.64. In fact, it is even higher than that of before optimization. This reveals that the placement of constituents is as important as their overall average amounts. In other words, TO adjusts the overall volume fraction of constituents as well as their distribution in a manner to reduce the total overpotential.
A closer inspection of system evolution is required to obtain a deeper grasp about how TO lead to a better design solution. To do so, some of the system parameters are traced during optimization. Since the system is symmetrical, the parameters of interest are projected on x-axis to reduce their distribution to 1D for the sake of simplicity. The projected dimensionless concentration (C*) and current source ( ) along with entropy production evolution are set out in Fig. 5. What stands out in Fig. 5a is during the optimization process, the reactant concentration is elevated in the system. The concentration at x* = 1 is increased by two orders of magnitude after the optimization. This is attributed to a better porosity distribution that assist delivery of reactant to the regions far from the system inlet. The emerged diffusion channels in x-direction prevent significant concentration overpotential. This is especially essential for high operational current densities where mass transport limitation is dominant. What is striking about these results is that the increase in concentration occurs in a condition where the average porosity in the optimal structure (0.423) is lower than the initial one (0.5). Checking the general trend of projected current source, that is depicted in Fig. 5b, shows that the optimization algorithm favors design solutions with a more uniform current source distribution. This means that to lessen the total overpotential, it is necessary to scatter the electrochemical reaction all over the ERD system. From a global standpoint, spreading the reaction throughout the design domain assists to reduce the entropy that is generated in the system. Figure 5a illustrates the changing progress of dimensionless total entropy generation, P*, in the course of optimization along with local distribution at some selected iteration numbers. As it can be confirmed by both local and global analysis, the total entropy generation rate is decreasing as the optimization proceeds. This observation is in full agreement with the principle of Entropy Generation Minimization (EGM).
43
Hence, for a minimization problem set-up, the total overpotential could be substituted with the total entropy generation as an objective function. It will be later discussed that this replacement does not hold for a maximization formulation. Since the entropy generation rate is reduced after optimization, it can be concluded that the second law efficiency of the system is increased. To understand how the entropy production reduced by TO, the distribution of projected entropy is plotted in Fig. 5b for some iterations. It can be seen that the entropy curve at iteration zero is at a higher level than other iterations. After some early changes in the system layout, the entropy curve shifted downward considerably. This huge drop in entropy generation happened thanks to an improvement in transport processes. In the subsequent steps, the optimization algorithm attempted to further reduce entropy generation rate by providing a more uniform distribution of entropy production throughout the system (see the curves for iterations 35, 50, and 300 in Fig. 5b). A more uniform distribution of entropy production might (but not necessarily) be helpful in reducing the total entropy production and consequently increasing the system efficiency. This principle is known as Equipartition of Entropy Production (EoEP)
86,87
in the literature. It has been applied to many heat exchanger and membrane systems.
88–95
) along with entropy production evolution are set out in Fig. 5. What stands out in Fig. 5a is during the optimization process, the reactant concentration is elevated in the system. The concentration at x* = 1 is increased by two orders of magnitude after the optimization. This is attributed to a better porosity distribution that assist delivery of reactant to the regions far from the system inlet. The emerged diffusion channels in x-direction prevent significant concentration overpotential. This is especially essential for high operational current densities where mass transport limitation is dominant. What is striking about these results is that the increase in concentration occurs in a condition where the average porosity in the optimal structure (0.423) is lower than the initial one (0.5). Checking the general trend of projected current source, that is depicted in Fig. 5b, shows that the optimization algorithm favors design solutions with a more uniform current source distribution. This means that to lessen the total overpotential, it is necessary to scatter the electrochemical reaction all over the ERD system. From a global standpoint, spreading the reaction throughout the design domain assists to reduce the entropy that is generated in the system. Figure 5a illustrates the changing progress of dimensionless total entropy generation, P*, in the course of optimization along with local distribution at some selected iteration numbers. As it can be confirmed by both local and global analysis, the total entropy generation rate is decreasing as the optimization proceeds. This observation is in full agreement with the principle of Entropy Generation Minimization (EGM).
43
Hence, for a minimization problem set-up, the total overpotential could be substituted with the total entropy generation as an objective function. It will be later discussed that this replacement does not hold for a maximization formulation. Since the entropy generation rate is reduced after optimization, it can be concluded that the second law efficiency of the system is increased. To understand how the entropy production reduced by TO, the distribution of projected entropy is plotted in Fig. 5b for some iterations. It can be seen that the entropy curve at iteration zero is at a higher level than other iterations. After some early changes in the system layout, the entropy curve shifted downward considerably. This huge drop in entropy generation happened thanks to an improvement in transport processes. In the subsequent steps, the optimization algorithm attempted to further reduce entropy generation rate by providing a more uniform distribution of entropy production throughout the system (see the curves for iterations 35, 50, and 300 in Fig. 5b). A more uniform distribution of entropy production might (but not necessarily) be helpful in reducing the total entropy production and consequently increasing the system efficiency. This principle is known as Equipartition of Entropy Production (EoEP)
86,87
in the literature. It has been applied to many heat exchanger and membrane systems.
88–95

Figure 5. (a) Projected concentration, (b) projected current source, (c) entropy convergence history, and (d) projected entropy during optimization process for θ1 = 5, θ2 = 50, and θ3 = 10 at jbnd,* = 30.
Download figure:
Standard image High-resolution imageThese behaviors can be observed in the individual entropy contribution by each process. Figure 6 illustrates the breakdown of entropy production by various processes, including mass diffusion, ion transfer by electrolyte phase, electron transfer by solid phase, and electrochemical reaction. The projected distribution of entropy production by each mechanism is shown in this figure. From these breakdowns, one can understand that the entropy curves of transport processes (Figs. 6a to 6c) lay quickly down hinged at one boundary. Especially, the entropy production by ion transport (Fig. 6b) shows a significant drop. This is because of the enhanced pathways formed by TO for transport of reactant, ion, and electron. Meanwhile, the flattening of these entropy curves causes a sharp decrease in total entropy production, as shown in Fig. 5a. The behavior of entropy contribution by the electrochemical reaction is, however, different from that of transport phenomena. According to the curves of Fig. 6d, the entropy production distribution becomes more equipartitioned during the optimization. This is mainly because of a more uniform distribution of the current source that is discussed before. To achieve this flatness, the entropy production in part of the system is reduced, while it is increased in the other part. Therefore, the total amount of entropy production by the reaction does not change very much. This could be confirmed from the column chart demonstrated in Fig. 6e. This chart compares the total entropy production by each process. It can be seen that the contribution by electrochemical reaction stays almost constant during the optimization process. The slight reduction is related to the more equipartitioned distribution of entropy generation, which prevents excess dissipation caused by non-uniformity of thermodynamics driving force in the system. 86,87 Since the total reaction rate is given by the system current density, most entropy production by the reaction is the inevitable entropy generation that cannot be prevented in a finite time/size context. 18,77 Based on the data of Fig. 6e, the electron transport has the smallest contribution to the total entropy compared to other transport phenomena. This is because of the high intrinsic electronic conductivity of the system.
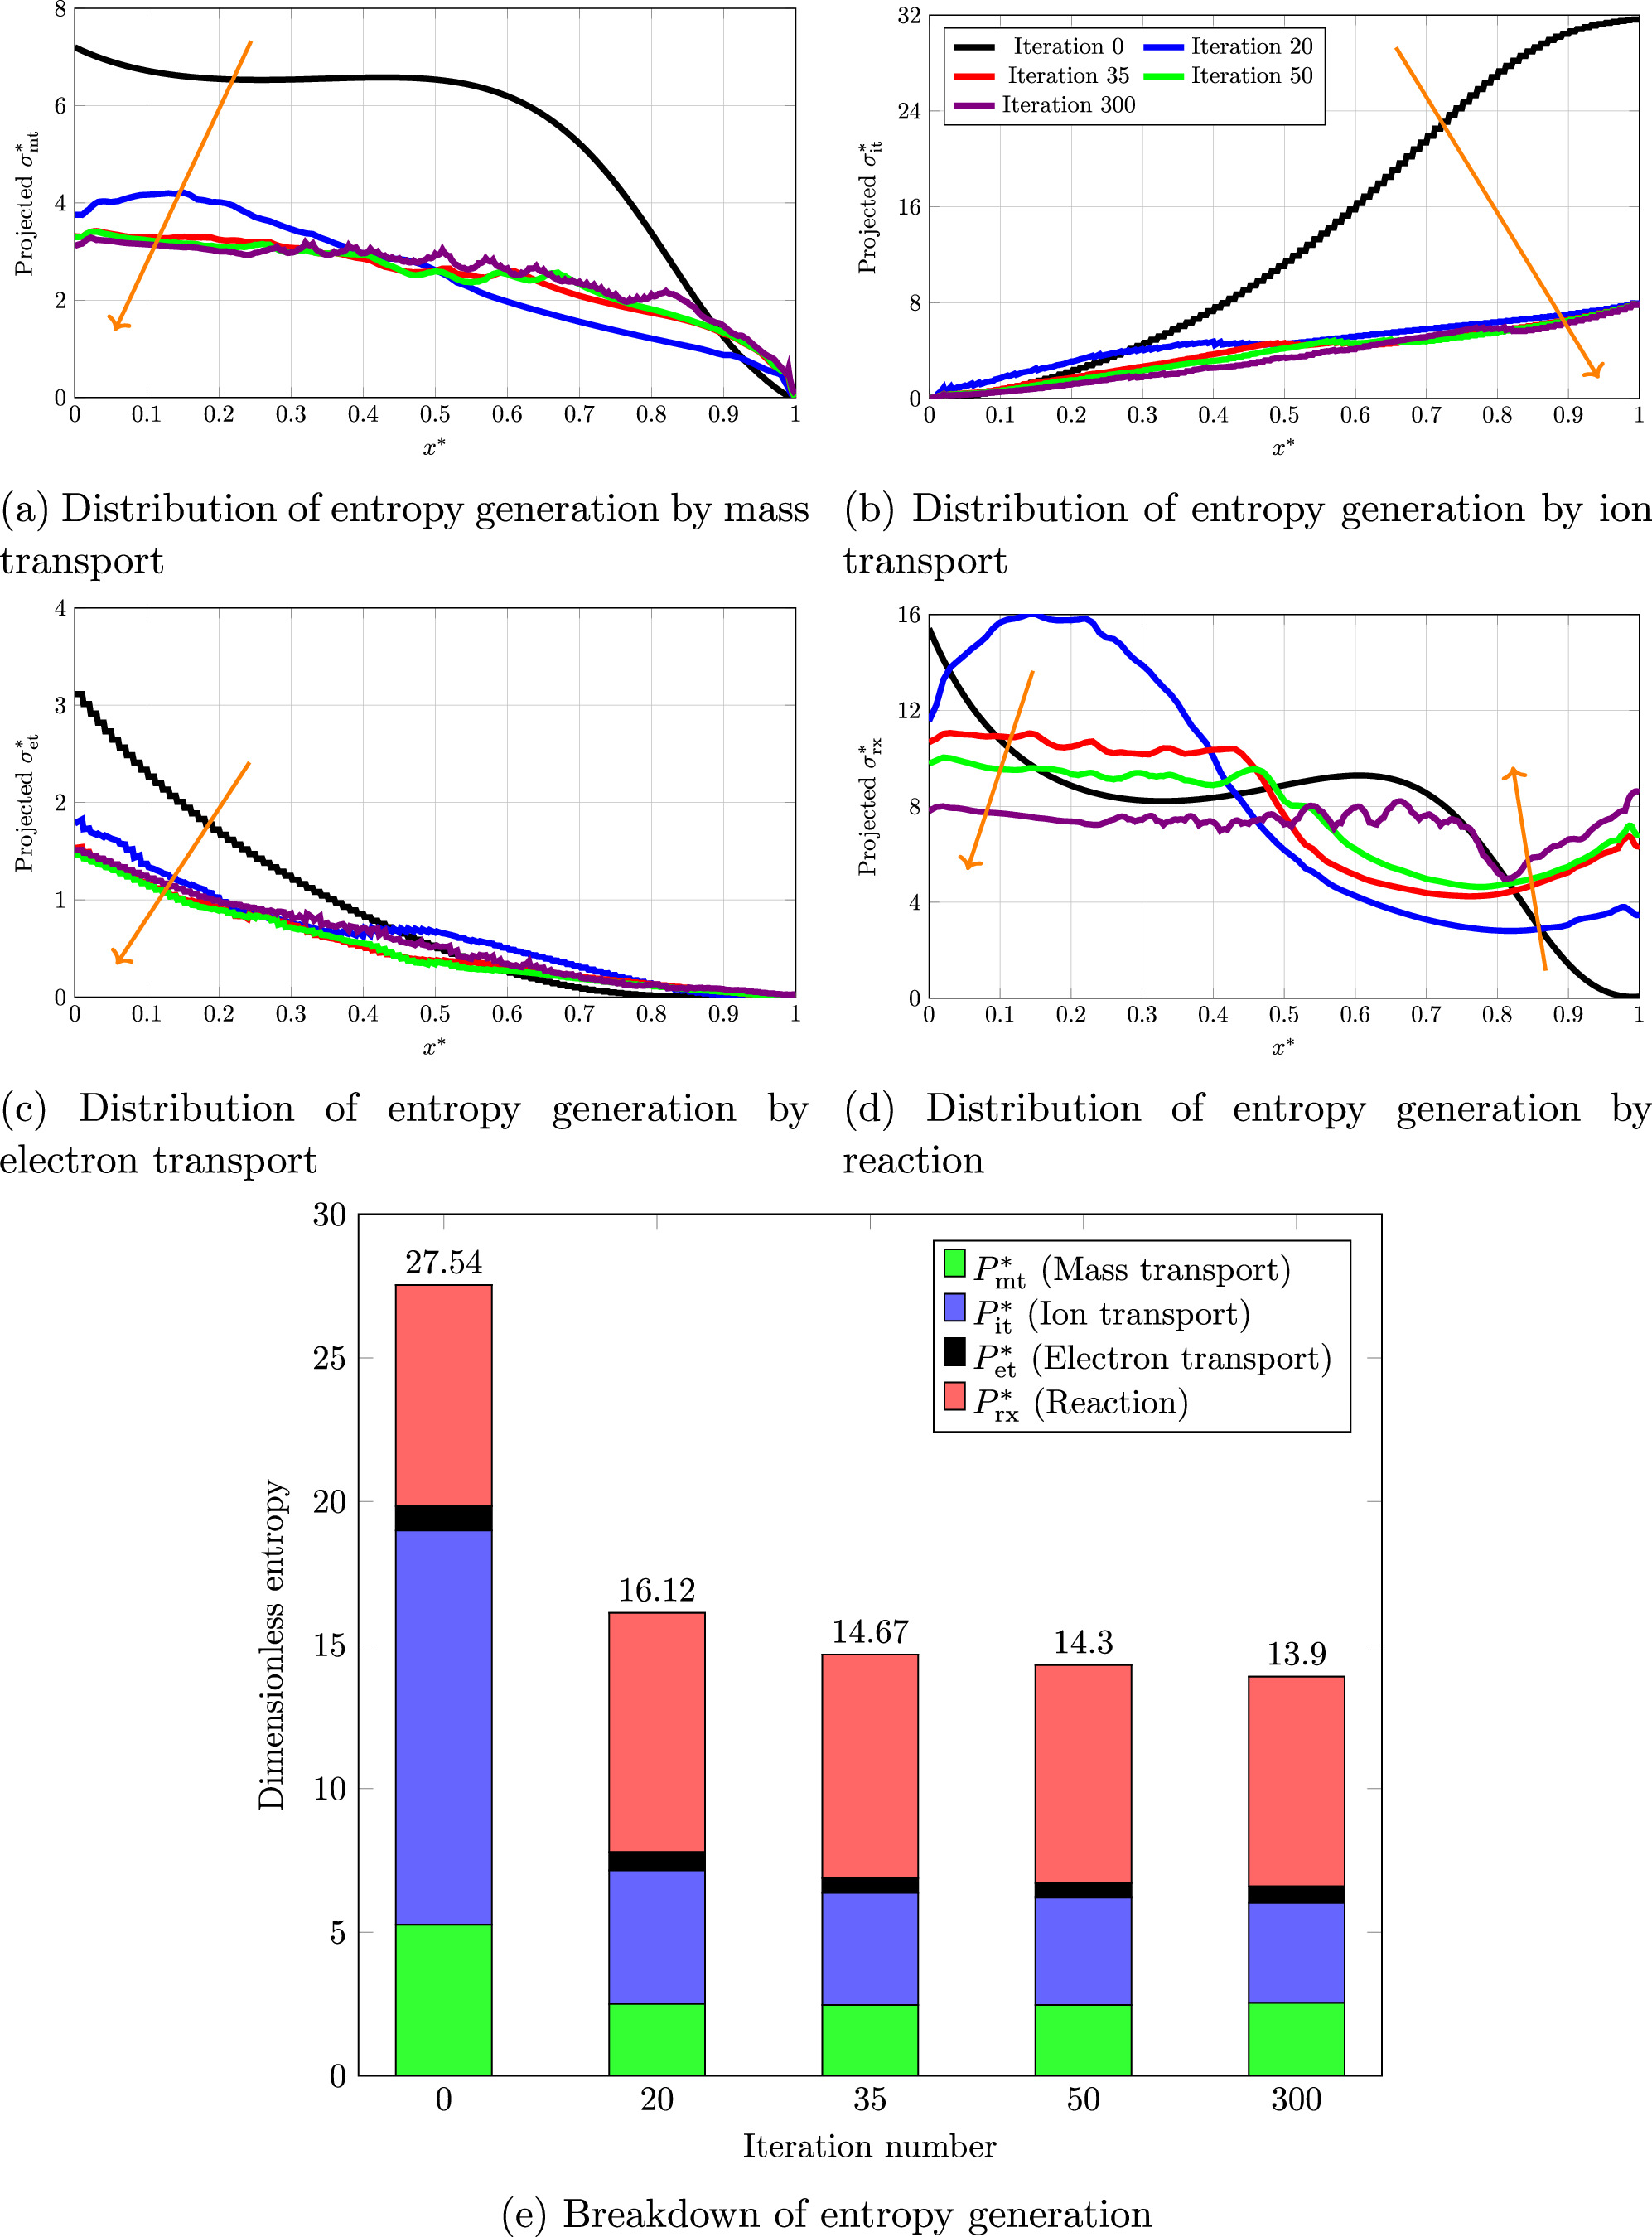
Figure 6. (a)–(d) Distribution of entropy generation by various processes and (e) total entropy breakdown during optimization for θ1 = 5, θ2 = 50, and θ3 = 10 at jbnd,* = 30.
Download figure:
Standard image High-resolution imageOverpotential-based ERD system
In this section, the optimization results of the overpotential-based ERD system are briefly discussed. In contrast to the previous strategy, the goal of this optimization is to increase the current density that is passing the system boundary at a given overpotential level. The optimized system layout for an ERD system with θ1 = 5, θ2 = 50, and θ3 = 10 are demonstrated in Fig. 7 for two different overpotentials ( and 9). The structure obtained for
  (Fig. 7a) increased the system current density by 116.7%. A closer look at this optimal layout reveals that it is pretty similar to Fig. 2b. While the exact distributions are different in the two figures, the overall shapes look alike. However, the system settings (θ1) are different. The reason for this similarity is as follows. The value of θ1 in the optimized system of Fig. 2b has a small value, meaning that the system is diffusion-controlled (diffusion-limited) by nature. Therefore, the optimization algorithm attempts to compensate for the weak reactant delivery by forming a distributed high porosity region in half of the reactor (far from the inlet boundary). On the other hand, the system in Fig. 7a is not diffusion-limited by nature. However, increasing the current density necessitates a faster reactant delivery to the reaction sites. As stated before, the output power of a power-generating electrochemical system could be increased in two ways, including reduction of total overpotential and increment of current density. The latter comes at the cost of a higher overall electrochemical reaction rate. To increase the reaction rate, it is required to supply more reactant. This explains why the optimized layouts in Fig. 2b and Fig. 7a are similar despite their different settings (different θ1). The results of optimization at a lower overpotential (
 ) are presented in Fig. 7a. At a lower overpotential level, the activation overpotential prevails. As a result, a higher volume fraction of the solid phase is beneficial to increase the current density.

Figure 7. Optimized volume fraction distribution of electrolyte, solid, and void phases for θ1 = 5, θ2 = 50, and θ3 = 10 at different overpotential levels; Improvement of optimized layout compared to initial uniform distribution is: (a) 116.7% and (b) 70.5%.
Download figure:
Standard image High-resolution imageFrom the convergence diagram shown in Fig. 8a, it is understandable that the objective function reaches a constant maximum value after around 115 iterations. The insets in Fig. 8a illustrate how the distributions of decision variables are changing over the optimization course before fully converging. The I-V curves obtained from the optimized systems for the two cases ( and 9) are plotted in Fig. 8b. Opposed to a minimization problem, this optimization approach shifted the initial I-V curve horizontally to the right (horizontal optimization). Performing an optimization at a high overpotential point (
 , point C in Fig. 8b) leads to a significant improvement in terms of I-V characteristics for medium and high overpotentials (
 ). However, this optimization is mainly focused on the improvement of reactant deficit as a result of increased reaction rate. Since the volume fraction of solid phase is relatively low in the optimized structure, the I-V performance of this structure is comparatively weak at low overpotentials (
 ). In addition, optimizing the system at a lower overpotential (
 ) increases the current density by 70.5%. However, it is not as beneficial when the system is working at a high overpotential level.
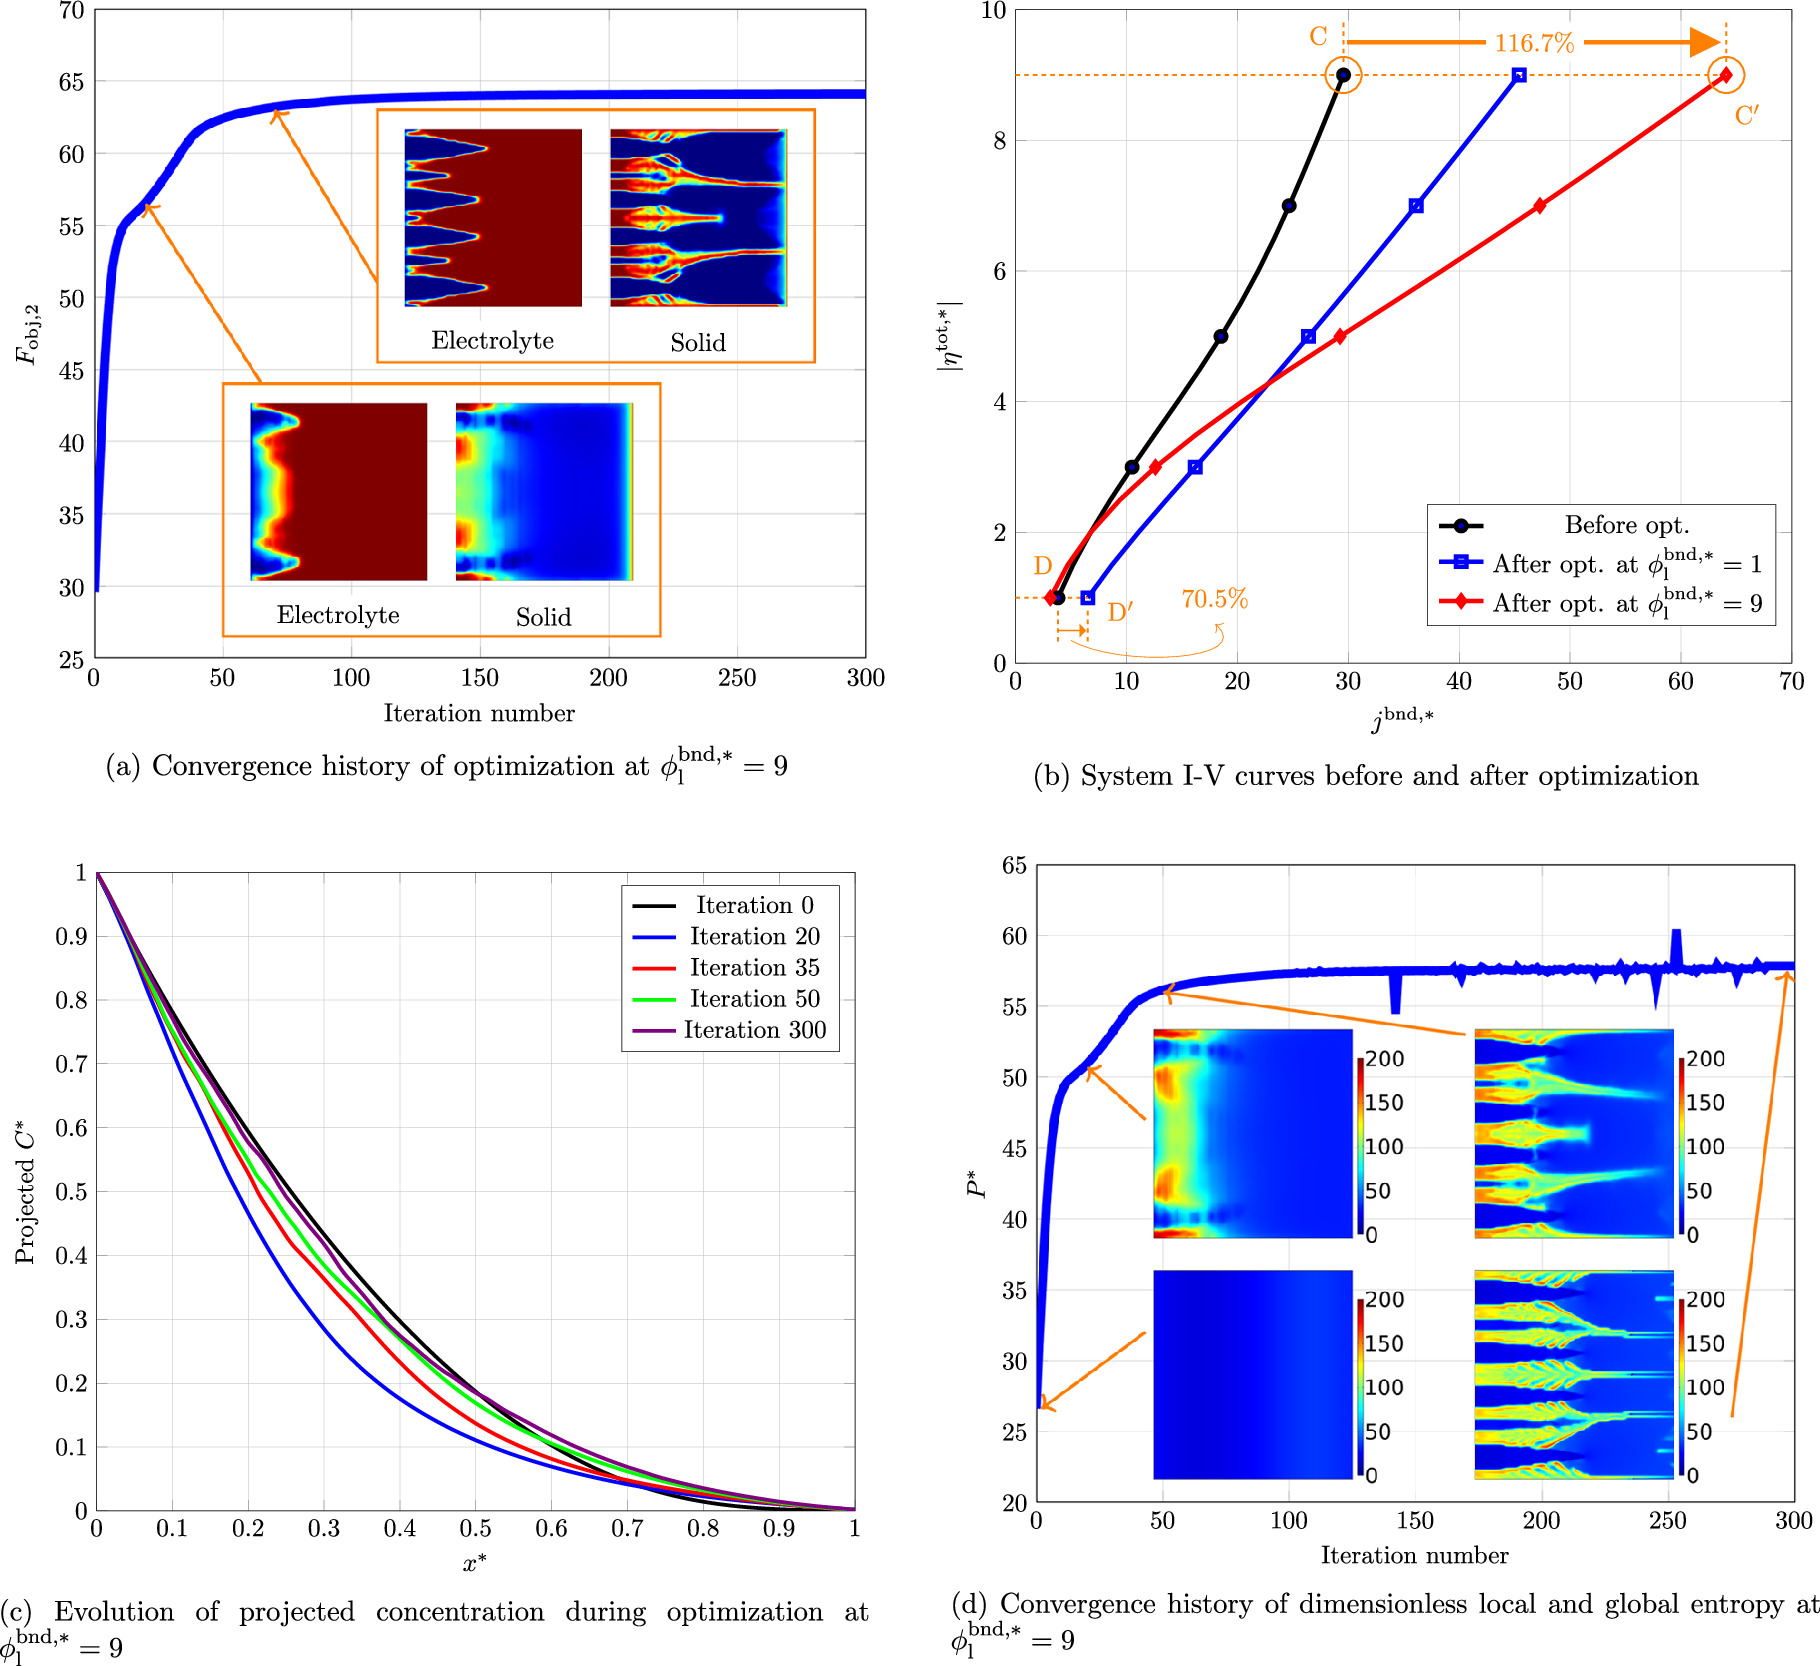
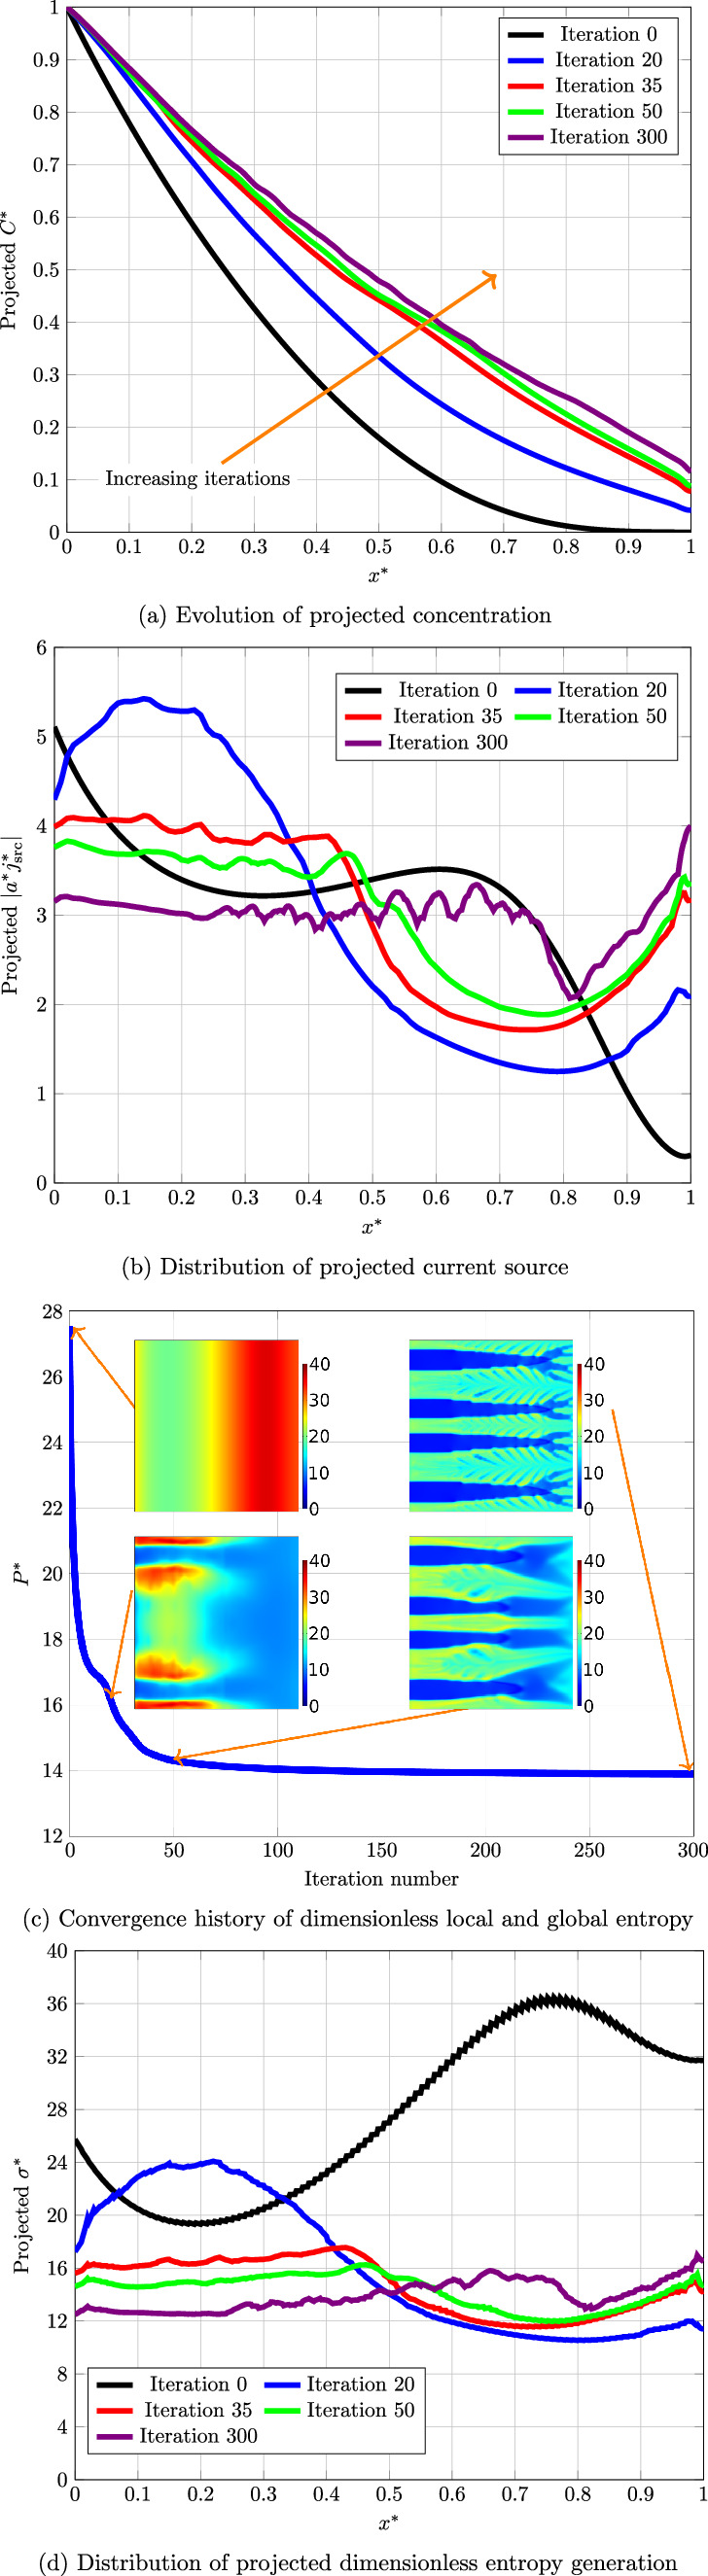
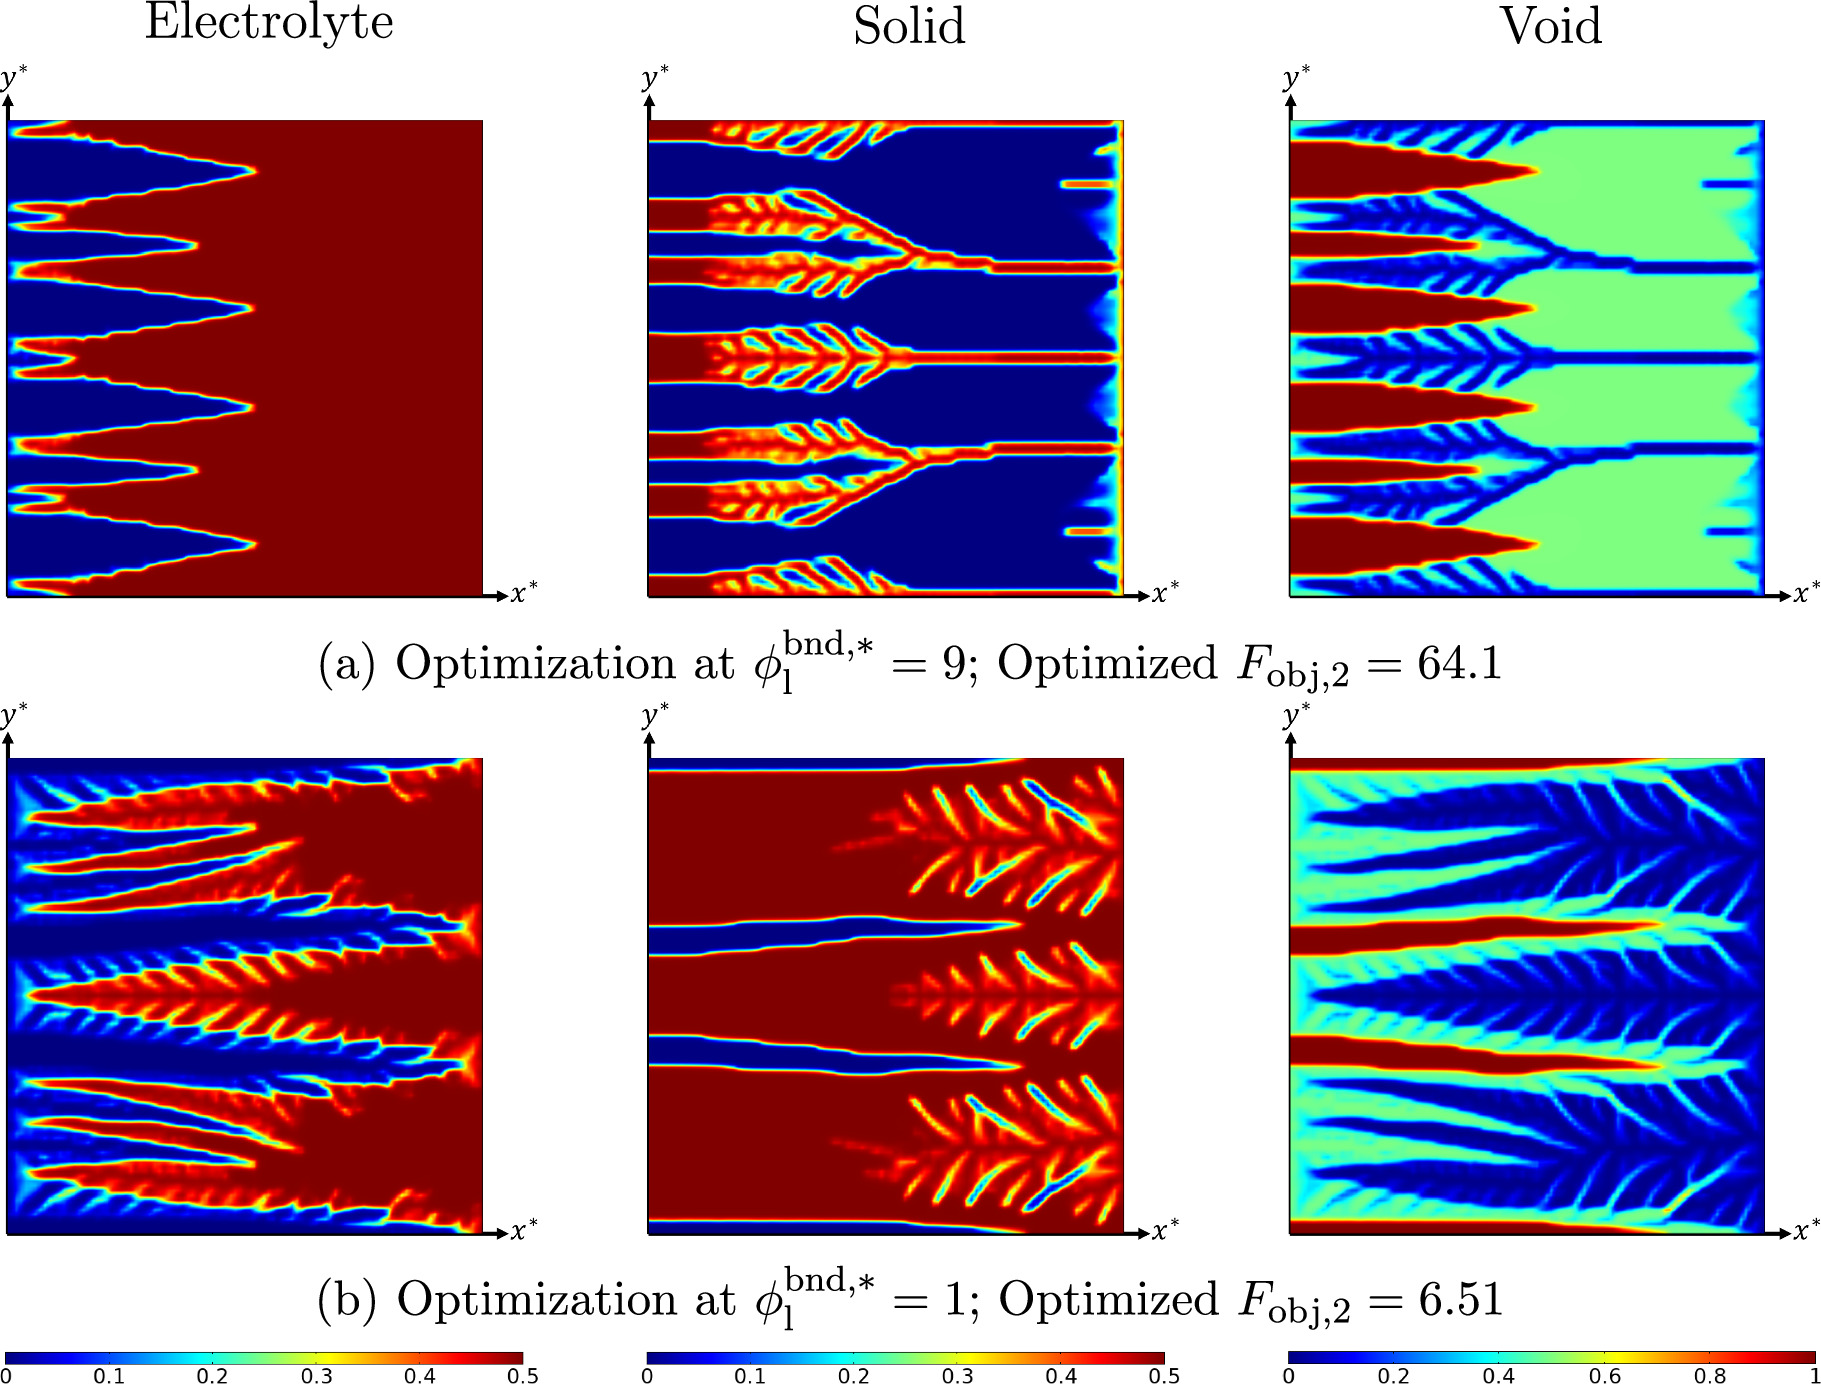
Figure 8. (a) Convergence history of objective function, (b) I-V curves, (c) projected concentration, and (d) convergence history of entropy for optimization of system with θ1 = 5, θ2 = 50, and θ3 = 10.
Download figure:
Standard image High-resolution image
To obtain some insight about maximization approach and identify the differences with the previous formulation, the evolution of projected concentration and convergence of entropy production are investigated for optimization at  . As it can be seen in Fig. 8c, the concentration changes non-monotonically during the optimization process. In the primary iterations, when there is an increase in the reaction rate as a result of an increase in ionic conductivity, the reactant concentration suddenly drops. To compensate for the concentration depletion and raise the reaction rate, TO forms some diffusion channels, which helped the concentration to be almost retrieved to the value before optimization. Increasing the concentration through facilitated mass transport helps the system to work at a higher reaction rate without experiencing any reactant shortage. The behavior of dimensionless entropy generation differs from that of the minimization approach. As shown in Fig. 8d, the total entropy production is increasing during the optimization. Before the optimization, the local distribution of entropy generation was relatively uniform and its quantity was also low. However, the final optimized solution comes with a higher entropy generation rate, especially in areas with a high volume fraction of the solid phase. This behavior might be assigned to the fact that the electrochemical reaction occurs in those areas. In a finite time/size thermodynamics context, any system that is "doing" something is doomed to produce some amount of entropy. Therefore, when the "doing" of a system is increased (in this case the reaction rate is increased), it is expected that total entropy production to rise. As discussed in Refs. 18, 77, this increase is associated with the "inevitable entropy production". Another striking point in Fig. 8d is that despite the objective function shows a monotonic convergence behavior (see Fig. 8a), the convergence curve of total entropy production shows some noises. This means that the maximization formulation may produce some design solutions that are desirable in terms of objective function but are not completely favorable from the perspective of the second law of thermodynamics. Hence, maximization of current density is not equivalent to the maximization entropy production and the objective function cannot be substituted. To rephrase it, a lower entropy production corresponds to a lower dissipation; nonetheless, a higher entropy production does not imply a higher reaction rate. This is the major difference between the two optimization strategies. A vertical optimization attempts to reduce the losses in the system; however, a horizontal optimization aims to increase the conversion capacity of the system. Therefore, the results obtained from the latter approach might not have the highest possible second law efficiency. In summary, the findings of this study proves that introducing a heterogeneous material distribution within an electrode can effectively enhance material utilization, thereby improving overall performance. Thisenhancement is achieved through a balance among competing transport and rate processes. Unlike parametric optimization, which primarily controls design variables globally, TO fine-tunes material distribution locally, thus surpassing conventional optimization methods. Moreover, the results of this study show that a proper choice of optimization approach depends on the application of interest. In principle, both strategies might be used for any application by sufficient considerations. Yet, a vertical optimization may be recommended in power generating systems (e.g. FCs) where there is a need to reduce the energy losses. Moreover, a horizontal optimization may be employed for power consuming systems (e.g. electrolyzers) in which the conversion rate is a major challenge. It is also important to choose the optimization point on I-V curve in accordance with the practical working conditions. Although the optimized design enhances the performance at the chosen optimization point, it might not be beneficial for other working conditions. In the case of an ERD system, the I-V characteristic does not improve equally over a wide operating range.
Conclusions
The present study investigates a 2D electrochemical porous reactor that involved mass transport, electric charge transfer, and a redox reaction. A dimensionless mathematical model is developed to describe the performance of the system, and a TO method is employed to find the optimal distribution of constituents in the reactor. Since any mathematical optimization algorithm, including TO, is confined to some extent by their tuning parameters and employed mathematical schemes, a more fundamental understanding of optimal design may pave a path beyond the computational limitations. With this goal, the present study also proposes an entropy generation model to evaluate the rate of irreversibilities in the system. Hence, the methodology presented in this study holds potential appeal for researchers engaged in electrode design and optimization as well as those seeking a deeper, fundamental comprehension of optimal designs. Two different optimization approaches, including minimization and maximization formulations, are used to enhance the system performance. The final optimal layouts are complex root-like structures that facilitate the transport processes while improving the conversion rate. The optimized structures are obtained for various combinations of dimensionless numbers and the differences are discussed. The process that leads into a better design solution is explained using the proposed entropy generation model. By comparing the entropy generation trends for two different optimization approaches, this study provided a framework for optimizing the distribution of constituents in porous electrochemical reactors and offered insight into the relationship between TO and the entropy generation rate. The results are shown to be in line with the EGM and EoEP principles. The findings of this study could have potential applications in the optimization of the electrode structure for various electrochemical technologies, such as FCs and electrolyzers. Moreover, the two optimization approaches (vertical and horizontal optimizations) are compared. It is shown that the choice of proper optimization approach and optimization point depends on the practical application. There is, therefore, a definite need for more studies on real devices. Given the generic form of the presented optimization and entropy generation analysis, the proposed framework may be applied to other electrochemical systems. This research sheds new insights on how topology optimization relates to the reduction of entropy generation, offering promising pathways for the development of optimization strategies that are both more efficient and firmly rooted in theoretical principles. Future research might also explore a mixed optimization strategy that is a combination of vertical and horizontal ones.
Acknowledgments
This work was supported by Grant-in-Aid for JSPS Fellows number 22KJ2198, JSPS KAKENHI Grant number 21H04540, and the National Science, Research and Innovation Fund (NSRF) via the Program Management Unit for Human Resources & Institutional Development, Research and Innovation [grant number B40G660039].