

Abstract
Application of corrosion inhibitors in production systems containing oil and water is an economic method to protect carbon steel against internal corrosion. This study investigates how intermittent oil/water wetting of such a steel surface, simulating multiphase flow phenomena, impacts corrosion inhibition in exploration-production (high salinity with CO2) and refinery (low salinity without CO2) environments. The employed corrosion inhibitor was a pyrimidinium-type model compound, its effectiveness against corrosion being characterized using linear polarization resistance measurements and electrochemical impedance spectroscopy. Experimental results demonstrated that the presence of an aliphatic oil promotes corrosion inhibition in the exploration production condition, but failed to do so in the refinery condition. Electrochemical impedance spectroscopy revealed two different protection mechanisms in the presence of oil between the two environments. The inhibitor layer in refinery condition with oil was different from in the simulated exploration production environment after oil wetting. Results also demonstrated that the inhibitor in this study was physically adsorbed on the surface steel via electrostatic attraction. Anions, identified as chloride ions, played a critical role in inhibitor adsorption.
Export citation and abstract BibTeX RIS

This is an open access article distributed under the terms of the Creative Commons Attribution 4.0 License (CC BY, http://creativecommons.org/licenses/by/4.0/), which permits unrestricted reuse of the work in any medium, provided the original work is properly cited.
Long-distance transmission of crude oil, as well as petroleum products, is usually carried out in large-diameter carbon steel pipelines. Oil and gas production involves the flow of a mixture of hydrocarbons and water in a variety of flow patterns, 1–3 specifically stratified with globules, stratified with mixing layer, and semi-dispersed. Due to the variety of possible flow patterns, intermittent surface wetting inevitably occurs. The presence of water in the oil can result in severe corrosion of inner pipes wall in such transmission systems. 4 An effective method of corrosion control is to continuously inject corrosion inhibitors into pipelines conveying oil-water mixtures. As corrosion occurs on water-wetted metal surfaces, corrosion inhibitor molecules form protective layers that retard electrochemical corrosion reactions at the water-metal interface, 5 thereby protecting mild steel tubulars against acidic corrosion.
Understanding the relationships between molecular structures of organic corrosion inhibitors, how they adsorb on metal surfaces, and their inhibitive effectiveness remains a focus for many investigators. 6,7 Among corrosion inhibitor compounds, heterocyclic molecules containing nitrogen atoms have been demonstrated to be excellent corrosion inhibitors for many metals and alloys in various aggressive media. 8–10 Their adsorption behavior is dependent on the following factors: structure of the molecule, solution chemistry, characteristics of the metal surface, and electrochemical potential at the interface. 11
Corrosion inhibition and contact angle results obtained by Li et al. indicated that amphiphilic fatty amine inhibitors easily form a hydrophobic layer on steel. 12 The hydrophilic head groups of such molecules adsorb on the surface, with their hydrophobic tail pointing into the bulk solution. When the steel surface was further exposed to an aliphatic model oil, alkane molecules (C12–C17) align with the hydrocarbon tails of fatty amine molecules on the surface, thereby further enhancing the self-assembled inhibitor layer, decreasing the corrosion rate. However, Li et al. found that their quaternary ammonium compound did not form a hydrophobic layer as readily as their fatty amine. 12 The authors speculated that the quaternary ammonium structure of their inhibitor could exhibit steric effects that prevent ready formation of a hydrophobic layer, and that exposing this layer to the oil phase did not significantly improve inhibition performance as introduced alkane molecules could not be adequately anchored between inhibitor tails. This may explain why exposing the steel surface to the model oil does not decrease the corrosion rate.
In theoretical work, Ko et al. studied the entrainment of oil molecules in corrosion inhibitor films using molecular modeling. 13 The authors conducted a computational study and built up a model for equilibrium configurations with hydrocarbon species. The simulations showed that the alkane molecules that made up the oil phase readily aligned with the alkyl tails of corrosion inhibitor molecules on the surface. This change in the adsorption morphology resulted in a significant increase in the adsorbed amount. Thus, the presence of oil molecules could help in improving the adsorption characteristics of inhibitors and was postulated to enhance corrosion efficiency.
Impedance measurements are of importance in electrochemical and corrosion studies. Electrochemical impedance spectroscopy (EIS) has proven to be a powerful technique to study corrosion processes and inhibitor performance in different environments. 14,15 The response of the measurements is influenced by the corrosion process from the substrate as well as the impact of inhibitor performance. Inhibitor adsorption and film growth can be characterized by fitting EIS data to equivalent electric circuits. 7 Belarbi et al. studied decanethiol as a model corrosion inhibitor for carbon steels exposed to aqueous CO2. 16 The EIS data confirmed the formation of an inhibitor film on the carbon steel surface immersed in the CO2 saturated aqueous solution, resulting in a decrease in corrosion rates as determined by LPR measurements. Tan et al. used EIS to study the inhibitor film and associated corrosion electrochemical kinetics in CO2 environment. 17 EIS data were used to calculate corrosion-related electrochemical parameters, with imidazoline as an effective CO2 corrosion inhibitor that formed a film on the metal surface. However, the application of EIS for the evaluation of corrosion inhibition in the oil/water intermittent wetting process is rarely reported in the literature. Sonke and Bos studied the performance of an imidazoline-type corrosion inhibitor on fine-grain carbon steel (A36) using EIS. 18 The authors proposed mechanisms of corrosion protection under specific test conditions by film-forming corrosion inhibitors, with corresponding responses from EIS analysis; including corrosion, corrosion reduced by adsorption (decrease of active surface area), protective film formations by corrosion inhibitor interaction with hydrocarbons, and one mechanism that overshadows the impact of the other. However, this work only gave an outline of the experimental conditions as well as results, limiting the analysis and interpretation of the data.
At present, there is no specific explanation reported for the performance of pyrimidine-type corrosion inhibitors in contact with mild steel in CO2 or N2 saturated media when oil is present. Consequently, there is particular interest in conducting such a systematic study. Herein, this was performed on a C1018 carbon steel immersed in a NaCl electrolyte saturated with CO2 or N2 using a corrosion inhibitor model compound with a pyrimidine head group, specifically tetradecyl-1,4,5,6-tetrahydropyrimidinium (THP-C14), found in particular commercial inhibitor formulations for downstream processing. The objective of the research described herein is to further characterize the behavior of THP-C14 at 25 °C in simulated exploration-production environment (EP), with high salinity and saturated with CO2, and in refinery condition (RC), of low salinity and lacking CO2 in the presence of hydrocarbon. The current work utilizes electrochemical techniques, including linear polarization resistance and EIS, to describe the effect of hydrocarbon on corrosion inhibition. This paper focuses on the development of experimental procedures to study how intermittent wetting, simulating multiphase flow phenomena, impacts corrosion inhibition. The scope of the work does not explore the influence of flow regimes and minimum flow velocities on the observed phenomena or investigate whether certain flow regimes or flow velocities are necessary to activate the corrosion inhibition mechanisms and achieve the desired protective effects in oil/water systems. Therefore, simple glass cell experiments, largely omitting complex multiphase flow effects, focusing on diverse but representative chemical environments were undertaken.
Experimental Methodology
Materials and chemicals
UNS G10180 a carbon steel (C1018) specimens with a ferritic-pearlitic microstructure were used for the electrochemical measurements. The composition of this carbon steel is shown in Table I. LVT 200 is a clear, light paraffinic distillate consisting of aliphatic hydrocarbons. The physical properties of the LVT 200 model oil are shown in Table II. The inhibitor model compound employed in this work, tetradecyltetrahydropyrimidinium (THP-C14), was synthesized in-house as described in a prior paper, 19 with a chemical structure where the positive charge of the head group delocalizes between two nitrogen atoms as shown in Fig. 1. The product THP-C14 is of ca. 99%+ purity, as determined by 1H-NMR, and was synthesized with a near 100% yield.
Table I. Composition (wt%) of carbon steel C1018.
| Element | Cr | Mo | S | V | Si | C | Ni | Mn | P | Fe |
|---|---|---|---|---|---|---|---|---|---|---|
| Weight % | 0.076 | 0.015 | 0.026 | 0.001 | 0.21 | 0.15 | 0.027 | 0.63 | 0.011 | Balance |
Table II. Physical properties of LVT 200 model oil (values at 25 °C).
| Composition | Viscosity | Density | |
|---|---|---|---|
| Hydrotreated light distillate C9–C16 | 2.3 cSt | 823 kg m−3 |
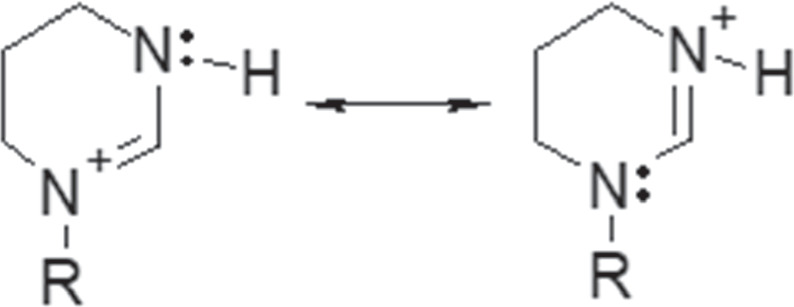
Figure 1. Resonance structure for the THP-C14 inhibitor model compound (R: -C14H29).
Download figure:
Standard image High-resolution imageElectrochemical measurements
Baseline pure water wetting
For pure water wetting experiments, a three-electrode setup was used to perform electrochemical experiments, equipped with a C1018 rotating cylinder electrode (RCE) as a working electrode (exposed area 2.89 cm2), a platinum-coated titanium mesh counter electrode, and an Ag/AgCl (KCl saturated) reference electrode; a similar configuration was introduced in previous work 19 and is also shown as a part of the setup shown in Fig. 2. Before each experiment, the RCE was sequentially polished with 240, 400 and 600 grit silicon carbide abrasive papers, cleaned with isopropanol in an ultrasonic bath, and air-dried. The solution was sparged with CO2 or N2 for 2 h before the introduction of the working electrode, this facilitated deoxygenation and, in the case of the former, solution saturation with carbonic species. After the RCE was inserted into the glass cell, a 20-min pre-corrosion test was conducted to determine whether the initial corrosion rate (CR) was close to the blank test, and to ensure no contamination from the previous experiment. To minimize noise and avoid foaming during electrochemical measurements caused by CO2 or N2 sparging in the presence of THP-C14, the sparge tube was retracted into the headspace during data acquisition. The solution was sparged with CO2 or N2 throughout the test to prevent air ingress and to ensure electrolyte saturation with CO2 or N2. The pH was adjusted by adding deoxygenated hydrochloric acid or sodium bicarbonate solution as appropriate. In this pure water wetting experiment, the baseline corrosion rate (without oil) was determined. The polished specimen was immersed in the aqueous electrolyte, and specimen rotation was set to 1000 rpm using a modulated speed rotator (Pine Research Instrumentation, Durham, NC). A potentiostat (Reference 600™, Gamry Instruments, Warminster, PA) was used for electrochemical measurements. The corrosion rate was assessed by measuring linear polarization resistance (LPR) with a scan range from −5 mV to + 5 mV vs OCP, a scan rate of 0.125 mV s−1, and a B value of 26 mV. The B value for these experiments was taken from previous research conducted on mild steel in a CO2 environment 20 and was used in the analysis of all the experimental data reported herein. Each experiment was replicated at least twice. The EIS measurements were carried out at OCP with a frequency range of 10 kHz to 0.1 Hz. The amplitude of perturbation was 10 mV (rms). The obtained EIS data were fitted in Gamry Echem Analyst® software using the simplex method.
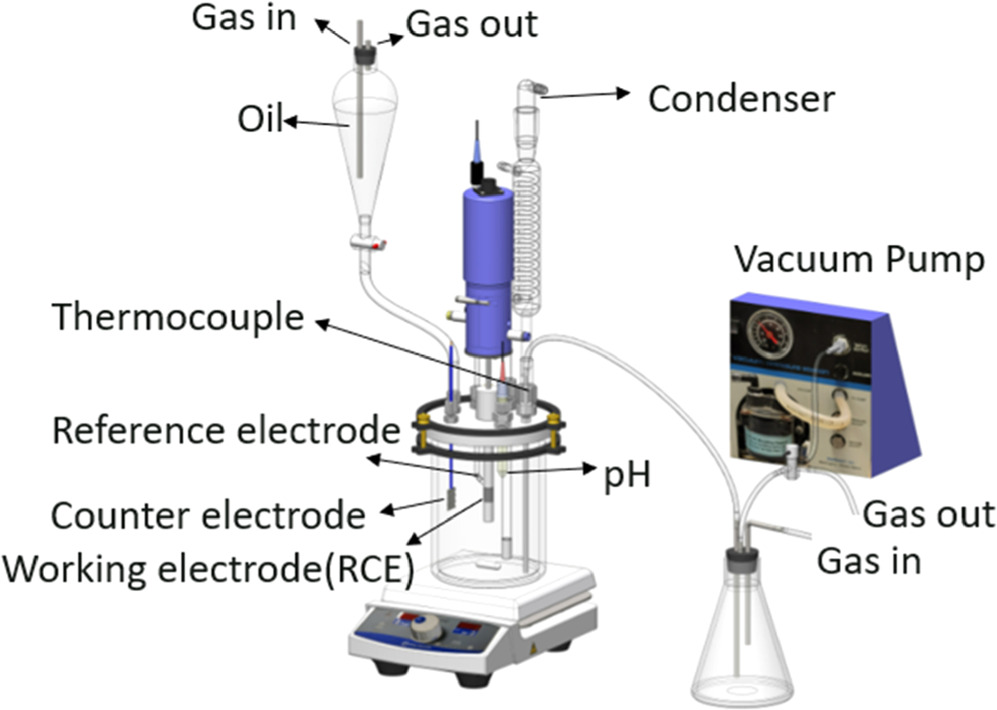
Figure 2. Schematic of apparatus for intermittent wetting experiments. Pure water wetting experiments were conducted in the same setup without external connection to the separatory funnel, 1 l volumetric flask, and vacuum pump.
Download figure:
Standard image High-resolution imageIntermittent wetting
For water/oil intermittent wetting experiments, the 2 l glass cell was connected to a separate 1 l flask as a container for the removal or introduction of brine during the experiment. A schematic representation of this setup is shown in Fig. 2. The brine was extracted by a vacuum pump creating a negative pressure in the 1 l flask, and the brine was introduced creating a positive pressure in the 1 l flask by adding CO2 or N2 gas; hence, the level of the brine phase in the 2 l glass cell could be controlled to alternately immerse the steel specimen in the oil and water phases. The oil phase was prepared in a separatory funnel and deoxygenated for 2 h by sparging with CO2 or N2 before the introduction of the working electrode. Each experiment was replicated at least twice.
Experiments were performed with the following steps. A schematic of the procedure is shown in Fig. 3.
- 1Pre-corrosion: the polished specimen was immersed in the aqueous phase. An initial corrosion rate of the RCE specimen was measured and an EIS spectrum was collected over a 20 min duration.
- 2#1 water-wetting stage: a 0.4 l of LVT 200 model oil layer was added on top of the aqueous phase, at the same time, the inhibitor was injected into the bulk of the aqueous phase using a long-needled syringe. The polished specimen was immersed in the aqueous phase and the rotation continued at 1000 rpm. The corrosion rate was measured every 20 min. An EIS spectrum was collected at the end of the stage.
- 3#1 oil-wetting stage: an appropriate volume of the aqueous phase was extracted to the flask as shown in Fig. 2 to lower the oil phase. This exposed the polished specimen to the oil phase, in which it was rotated for 1 h at 1000 rpm.
- 4#2 water-wetting stage: after immersion in the oil phase, the extracted aqueous electrolyte was returned to the glass cell to again expose the specimen to the aqueous phase. The corrosion rate was measured every 20 min until a steady state value was achieved. An EIS spectrum was collected at the end of the stage.
- 5#2 oil-wetting stage: the specimen was immersed in the oil phase and rotated for 1 h at 1000 rpm as in step 3.
- 6#3 water-wetting stage: after immersion in the oil phase, the specimen was returned to the aqueous phase. The corrosion rate was measured every 20 min. An EIS spectrum was collected at the end of the stage.
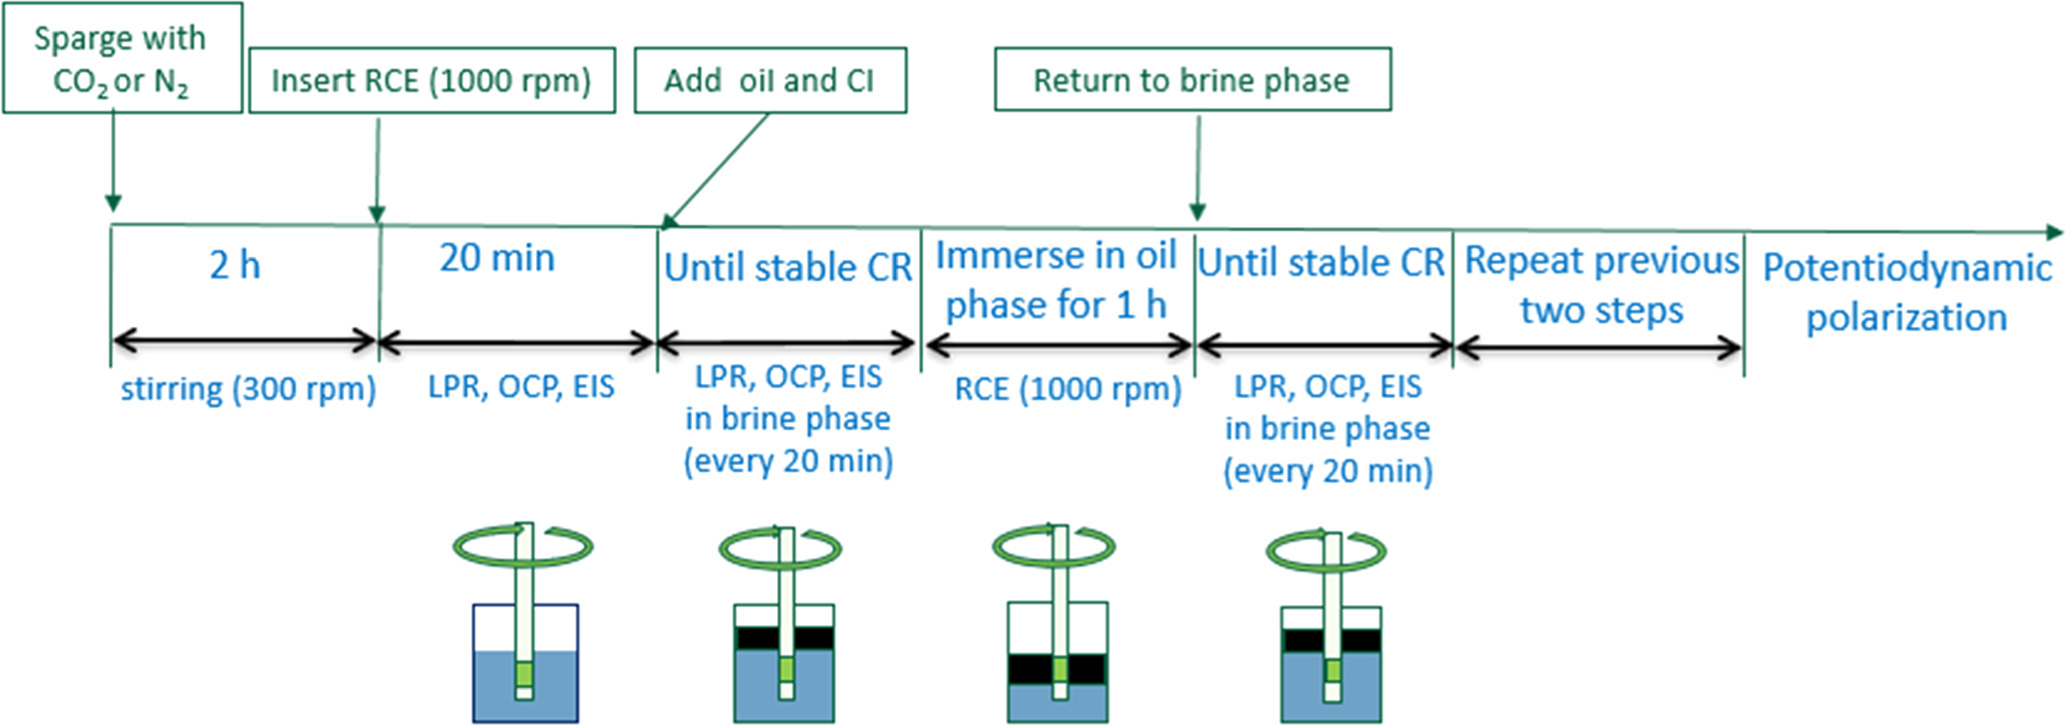
Figure 3. Schematic of the procedure to study the effect of intermittent wetting on corrosion inhibition. Corrosion inhibitor abbreviates to CI in the figure.
Download figure:
Standard image High-resolution imageThe corrosion inhibitive effects of THP-C14 were evaluated at different concentrations. For intermittent wetting experiments, the LVT 200 model oil was added on top of the brine phase after the injection of the corrosion inhibitor into the glass cell. The volume ratio of model oil to brine was 1:4. During experiments, the working electrode was periodically immersed and remained in the oil phase (oil wetting) for 1 h keeping the 1000 rpm rotation. Corrosion rates during the oil-wetting stage were not monitored since the specimen was immersed in a non-conductive model oil where the electrochemical assessment was not readily conducted. Then the specimen was immersed in the brine phase (water wetting) where electrochemical measurements were carried out. At the end of each experiment, the glass cell and other equipment were carefully cleaned with tap water, deionized water and isopropanol to avoid inhibitor contamination in future experiments. The compositions of the EP and RC environments were selected in consultation with our industrial partner. Table III shows the matrix for experimental conditions.
Table III. Matrix for electrochemical experiments.
| Experimental conditions | |
|---|---|
| Temperature | 25 °C |
| Brine composition | Exploration production (EP) a) and refinery condition (RC) b) |
| Oil composition | LVT200 model oil |
| Inhibitor | THP-C14 |
| Material | C1018 |
| Techniques | Linear polarization resistance and electrochemical impedance spectroscopy |
a)EP: 50 g l−1 NaCl, pH 4.5. b)RC: 1 g l−1 NaCl, 30 mg l−1 (of 37%) HCl, 10 mg l−1 NH4OH, 50 mg l−1 acetic acid, pH 3.8
Results and Discussion
Comparison of corrosion rate in exploration production and refinery condition environments
Figure 4 shows the corrosion rates in the exploration production (EP) and refinery condition (RC) environments at 25 °C with and without LVT 200. For experiments without inhibitor, the final corrosion rate did not change significantly after two oil-wetting stages, which is fully expected. However, in the presence of 20 ppm of THP-C14 inhibitor (above the surface saturation concentration 19 ) in EP condition (Fig. 4a), the corrosion rate decreased significantly by one order of magnitude after the #1 oil wetting stage. After the #2 oil-wetting stage, CR was stabilized. Compared with the condition without oil (20 ppm inhibitor pure water wetting), the final corrosion rate with the intermittent wetting of oil was lower than in the absence of oil. This indicated that the presence of oil did promote corrosion inhibition.
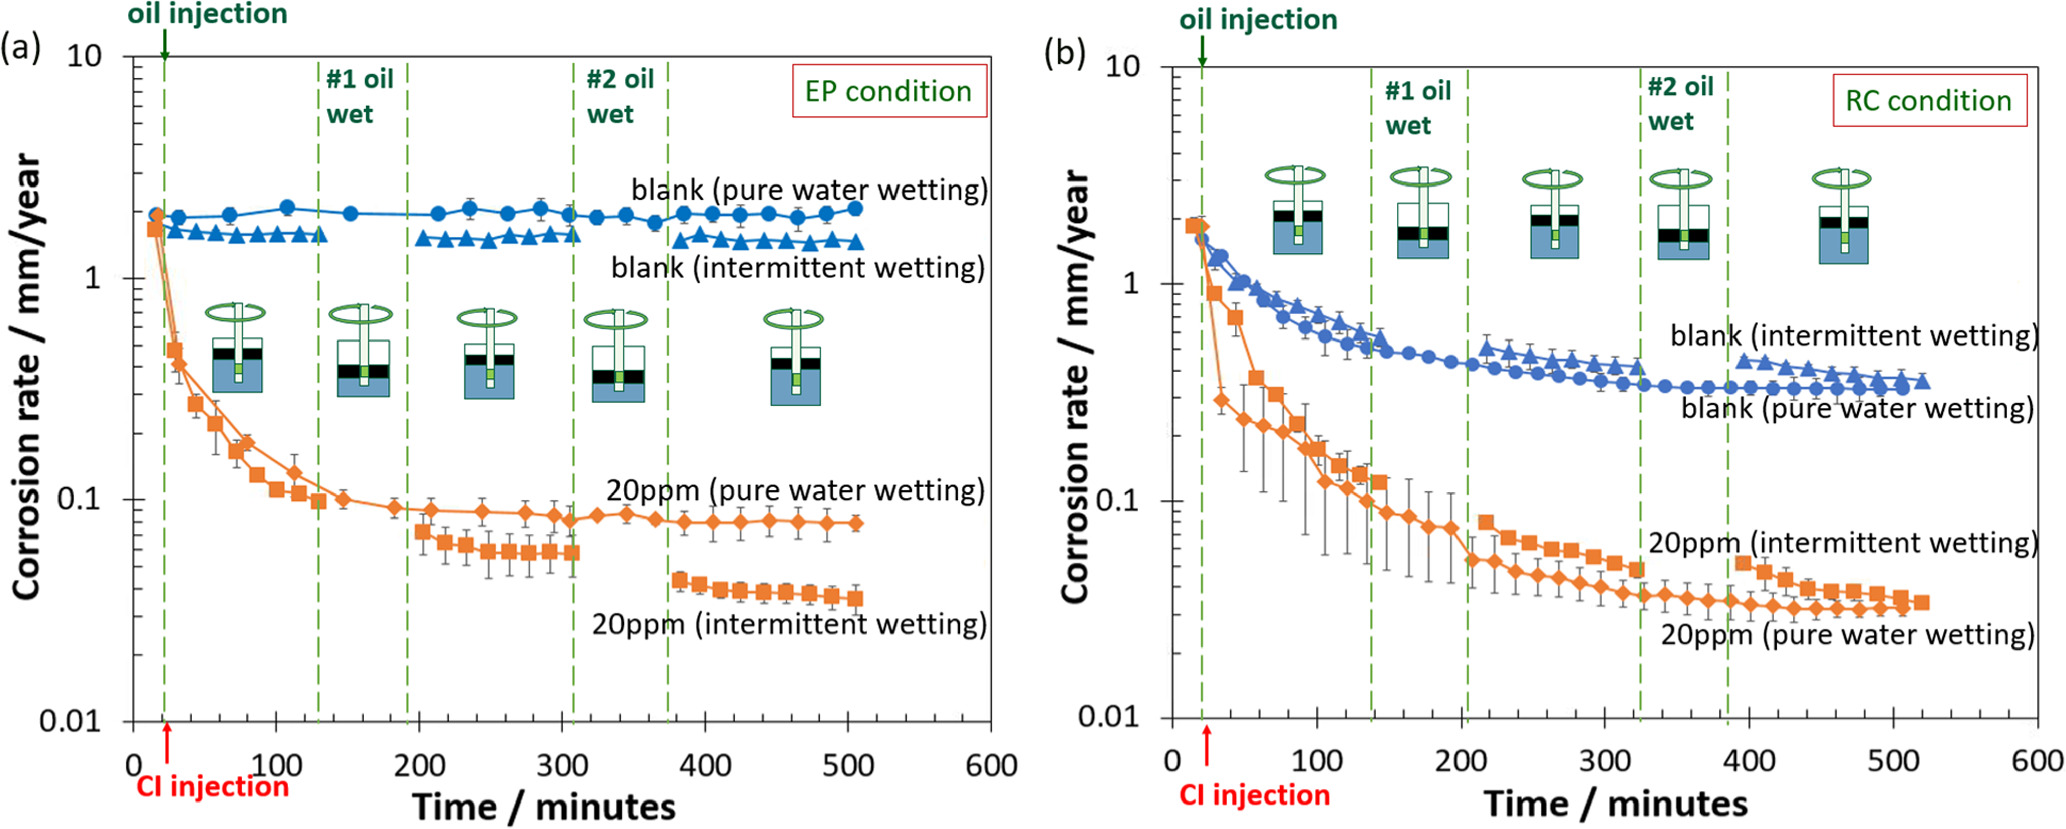
Figure 4. The corrosion rate at 25 °C with and without LVT 200 in (a) EP condition with blank (no inhibitor) and 20 ppm THP-C14; and (b) RC condition with blank (no inhibitor) and 20 ppm THP-C14. Corrosion inhibitor abbreviates to CI in the figure.
Download figure:
Standard image High-resolution imageFigure 4b shows the corrosion rate in the RC condition. For the 20 ppm THP-C14 inhibitor, CR gradually decreased after the #1 and #2 oil-wetting stages. However, the final corrosion rate was close to the experiment conducted without oil (20 ppm inhibitor pure water wetting). This indicated that the presence of oil did not significantly change the overall corrosion inhibition.
EIS data analysis for exploration production environment
In order to understand what leads to the different inhibitor performance in EP and RC environments, the inhibition evolutions for pure water wetted surfaces and intermittent wetted surfaces were monitored using electrochemical impedance spectroscopy.
Figure 5 illustrates Bode plots of experiments with blank (no inhibitor) and 20 ppm of inhibitor THP-C14 with and without intermittent wetting of oil for different immersion times in the EP environment. For the experiments without oil (pure water wetting), as shown in Fig. 5a, there was only one time constant at the mid-frequency range throughout the experiment. The increase of impedance at the low-frequency range during the experiment indicated that the presence of the inhibitor strongly retarded the electrochemical reaction rates on the electrode surface. The impedance data for pure water wetting are fitted into an electrical equivalent circuit, taking into account the contribution of each phenomena such as polarization resistance, double layer, film formation, etc. Constant phase elements (CPEs) are generally used instead of a real capacitance because of the roughness of a solid metal electrode, the inhomogeneous reaction rate on the electrode surface, or the varying thickness of the adsorbed inhibitor layer. 21 The corresponding electrical equivalent circuit model is given in Fig. 6a, where Rs is the electrolyte resistance, Rct is the charge transfer resistance.
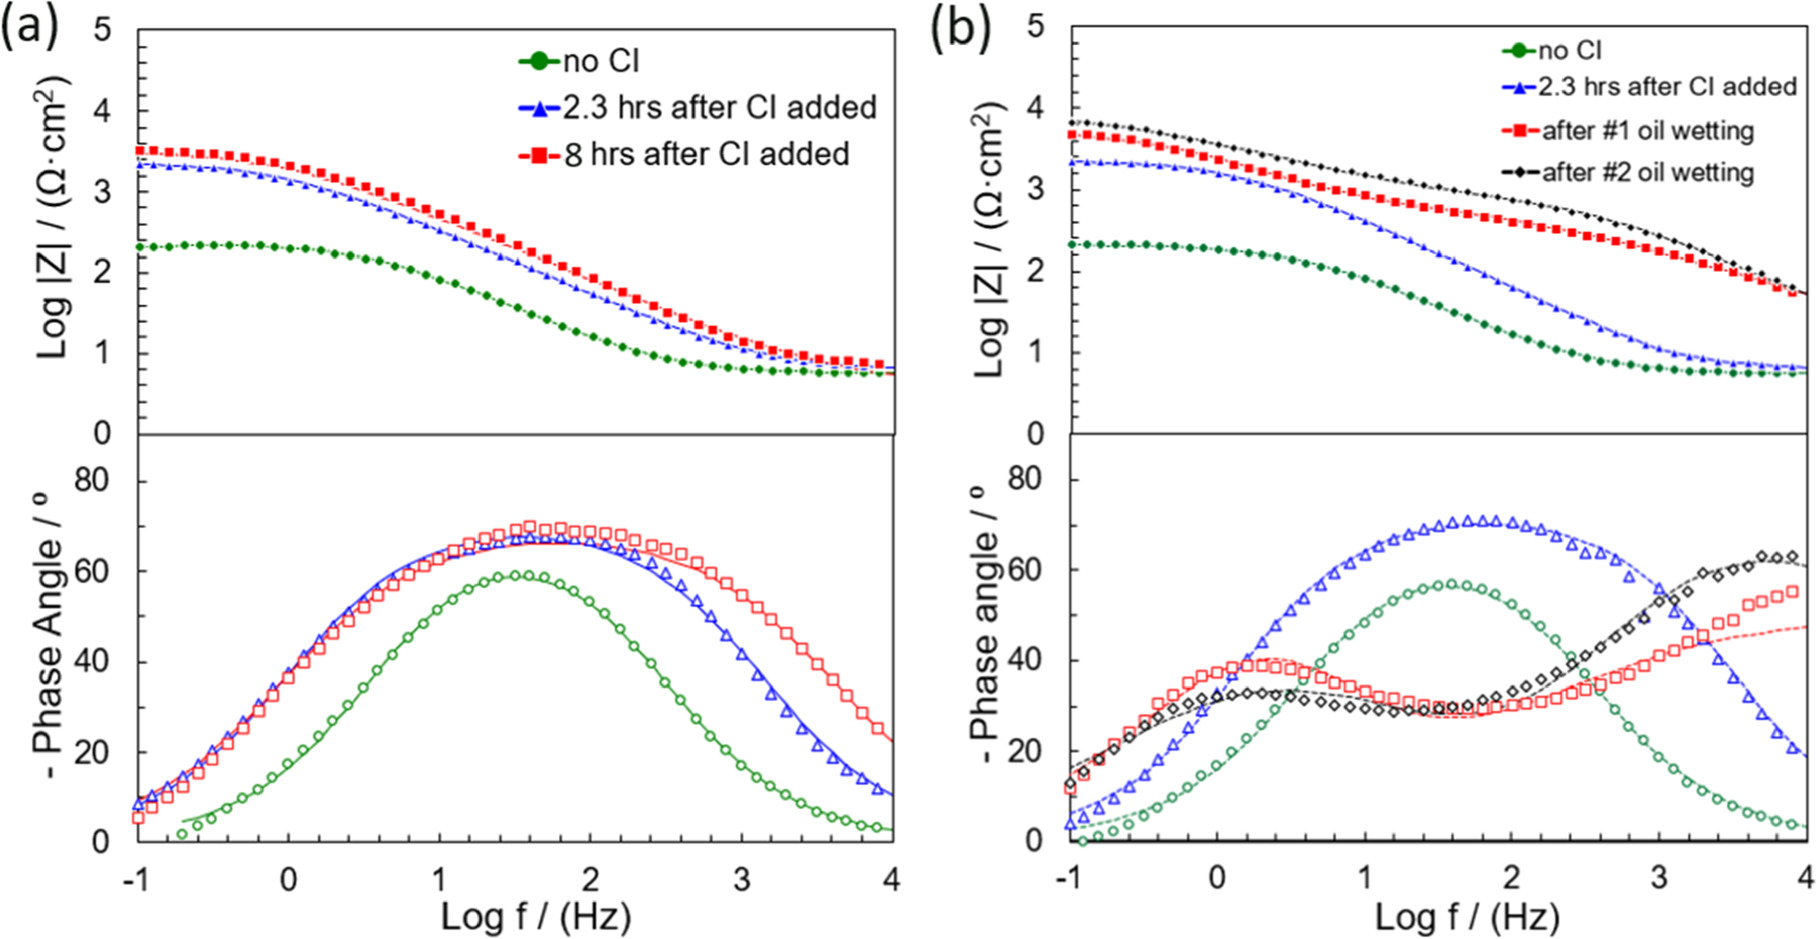
Figure 5. Bode plots of EIS collected with C1018 exposed in a CO2 saturated 50 g l−1 NaCl electrolyte: (a) without oil at different immersion time (•) no inhibitor, (▴) 2.3 h after inhibitor added, (▪) 8 h after inhibitor added; (—) fitting results; (b) with oil at different immersion time: (•) no inhibitor, (▴) 2.3 h after inhibitor added, (▪) after #1 oil wetting, (♦)after #2 oil wetting; (—) fitting results. Corrosion inhibitor abbreviates to CI in the figure.
Download figure:
Standard image High-resolution image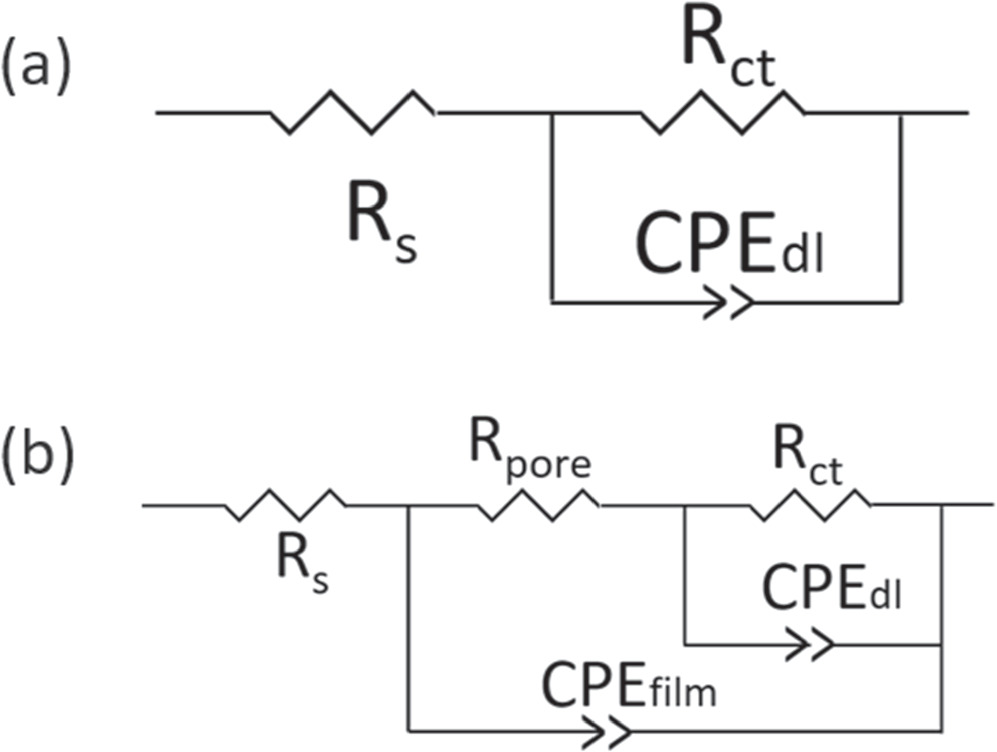
Figure 6. Equivalent circuits used for the modeling of the impedance data (a) before oil wetting and (b) after oil wetting in Fig. 5.
Download figure:
Standard image High-resolution imageConsidering the intermittent wetting experiments, as shown in Fig. 5b, a very low total resistance and only one time constant were detected in the experiment without inhibitor. The impedance at the low-frequency range increases after inhibitor addition. The corresponding electrical equivalent circuit model is given in Fig. 6a. After the #1 as well as the #2 oil-wetting stage, an additional time constant emerged. This indicated that the formed inhibitor film incorporated with hydrocarbon changed the electrode-electrolyte interfacial structure and resulted in the extra time constant. According to the literature, 18 the formed film of adsorbed inhibitors and other molecules (hydrocarbons) acts as a barrier against the diffusion of corrosive species/ions. This barrier influences the EIS response, especially in the high-frequency range (Fig. 5b). The presence of the two time constants suggests that there are two kinetic processes on the electrode surface. The experimental results for this situation could be modeled by an equivalent circuit representing a porous inhibitor film (Fig. 6b), where Rpore is the resistance of the surface film pores and CPEfilm is the capacitance of the film. 22
The proposed models are representative of phenomena which may occur in the investigated system, both in the high frequency and the low-frequency part of the spectrum. The effective double layer capacitance associated with the CPEdl was calculated using the following equation: 23
where Qdl is the magnitude of CPEdl, αdl is the exponent of CPEdl, and Rs and Rct are the bulk solution and charge transfer resistances, respectively. The effective film capacitance associated with the CPEfilm was calculated using the following equation: 24
Where Qfilm is the magnitude of CPEfilm, αfilm is the exponent of CPEfilm, and Rs is the solution resistance. The fitted values of impedance parameters are listed in Tables IV and V.
Table IV. Circuit parameters of the modeling of impedance spectra for mild steel in CO2 saturated 50 g l−1 NaCl electrolyte (EP) for water wetting containing THP-C14 with different immersion times at 25 °C.
| Time (min) | Rs (Ω) | Rct (Ω·cm2) | Qdl (sα /(Ω·cm2)) | αdl | CPEdl (μF/cm2) | χ2 (×10−4) |
|---|---|---|---|---|---|---|
| 15 | 2.0 | 119 | 3.72 × 10⁻⁴ | 0.82 | 276.3 | 7.9 |
| 132 | 1.9 | 2285 | 1.71 × 10⁻⁴ | 0.81 | 92.5 | 7.1 |
| 296 | 1.9 | 2793 | 1.14 × 10⁻⁴ | 0.81 | 58.4 | 12.7 |
| 502 | 1.8 | 3814 | 9.53 × 10⁻⁵ | 0.80 | 41.1 | 22.2 |
Table V. Circuit parameters of the modeling of impedance spectra for mild steel in CO2 saturated 50 g l−1 NaCl electrolyte (EP) for intermittent wetting containing THP-C14 with different immersion times at 25 °C.
| Time (min) | Rs (Ω) | Rct (Ω·cm2) | Qdl (sα/(Ω·cm2)) | αdl | CPEdl (μF/cm2) | Rpore (Ω·cm2) | Qfilm (sα /(Ω·cm2)) | αfilm | CPEfilm (μF/cm2) | χ2 (×10−4) |
|---|---|---|---|---|---|---|---|---|---|---|
| 15 | 1.9 | 158 | 3.28 × 10⁻⁴ | 0.83 | 257.9 | — | — | — | — | 39.1 |
| 134 | 1.9 | 2232 | 1.71 × 10⁻⁴ | 0.80 | 86.5 | — | — | — | — | 28.6 |
| 308 | 1.9 | 4603 | 2.93 × 10⁻⁴ | 0.65 | 26.5 | 765 | 2.86 × 10⁻⁵ | 0.69 | 1.6 | 2.9 |
| 506 | 1.9 | 7299 | 3.89 × 10⁻⁴ | 0.61 | 22.1 | 1068 | 3.54 × 10⁻⁶ | 0.76 | 0.33 | 1.4 |
For pure water wetting experiments, as can be seen in Table IV, Rct obtained with EIS fittings are consistent with the linear polarization resistance method. The values of Rct increased after the injection of THP-C14, and then did not significantly change. On the other hand, CPEdl decreased after the THP-C14 injection and then became stable. This phenomenon could be attributed to the adsorption of the inhibitor molecules which modified the metal surface and thereby decreased the corrosion rate. Rct and CPEdl did not significantly change after the initial drop of corrosion, which indicated that the system reached steady state and the surface became fully covered. For intermittent wetting experiments, as shown in Table V, Rct increased after the injection of inhibitor. After the #1 oil-wetting stage (at ca. 308 min), Rct increased significantly. After the #2 oil-wetting stage (at ca. 506 min), CPEdl did not change appreciably whereas CPEfilm decreased by almost one order of magnitude. Considering that the effective area of the electrode surface (A) is constant throughout the experiment, capacitance values are directly proportional to the dielectric constant of the film (εf) and inversely proportional to the thickness of the layer (d) following the relationship: 25

where ε0 is the permittivity of the vacuum (9 × 10⁻¹⁴ F cm−1). 25 The trend of CPEfilm is related to the evolution of film structure. Concerning the evolution of CPEfilm with time, the inhibitor may interact with the hydrocarbon, thus causing an increase in the thickness of the film. 18
EIS data analysis for refinery condition environment
Figure 7 shows Bode plots of a test with blank (no inhibitor) and 20 ppm of THP-C14 inhibitor with and without oil for different immersion times in the RC environment. Data were fitted using the electrical equivalent circuit as shown in Fig. 6a. The values of impedance parameters obtained by fitting the impedance data are listed in Table VI. Only one time constant was observed during the experiments with and without oil. The adsorbed inhibitor layer may not be packed or thick enough to show an additional time constant. This indicated that the inhibition protection mechanism in RC with oil could be different from that in EP after the oil-wet stages.
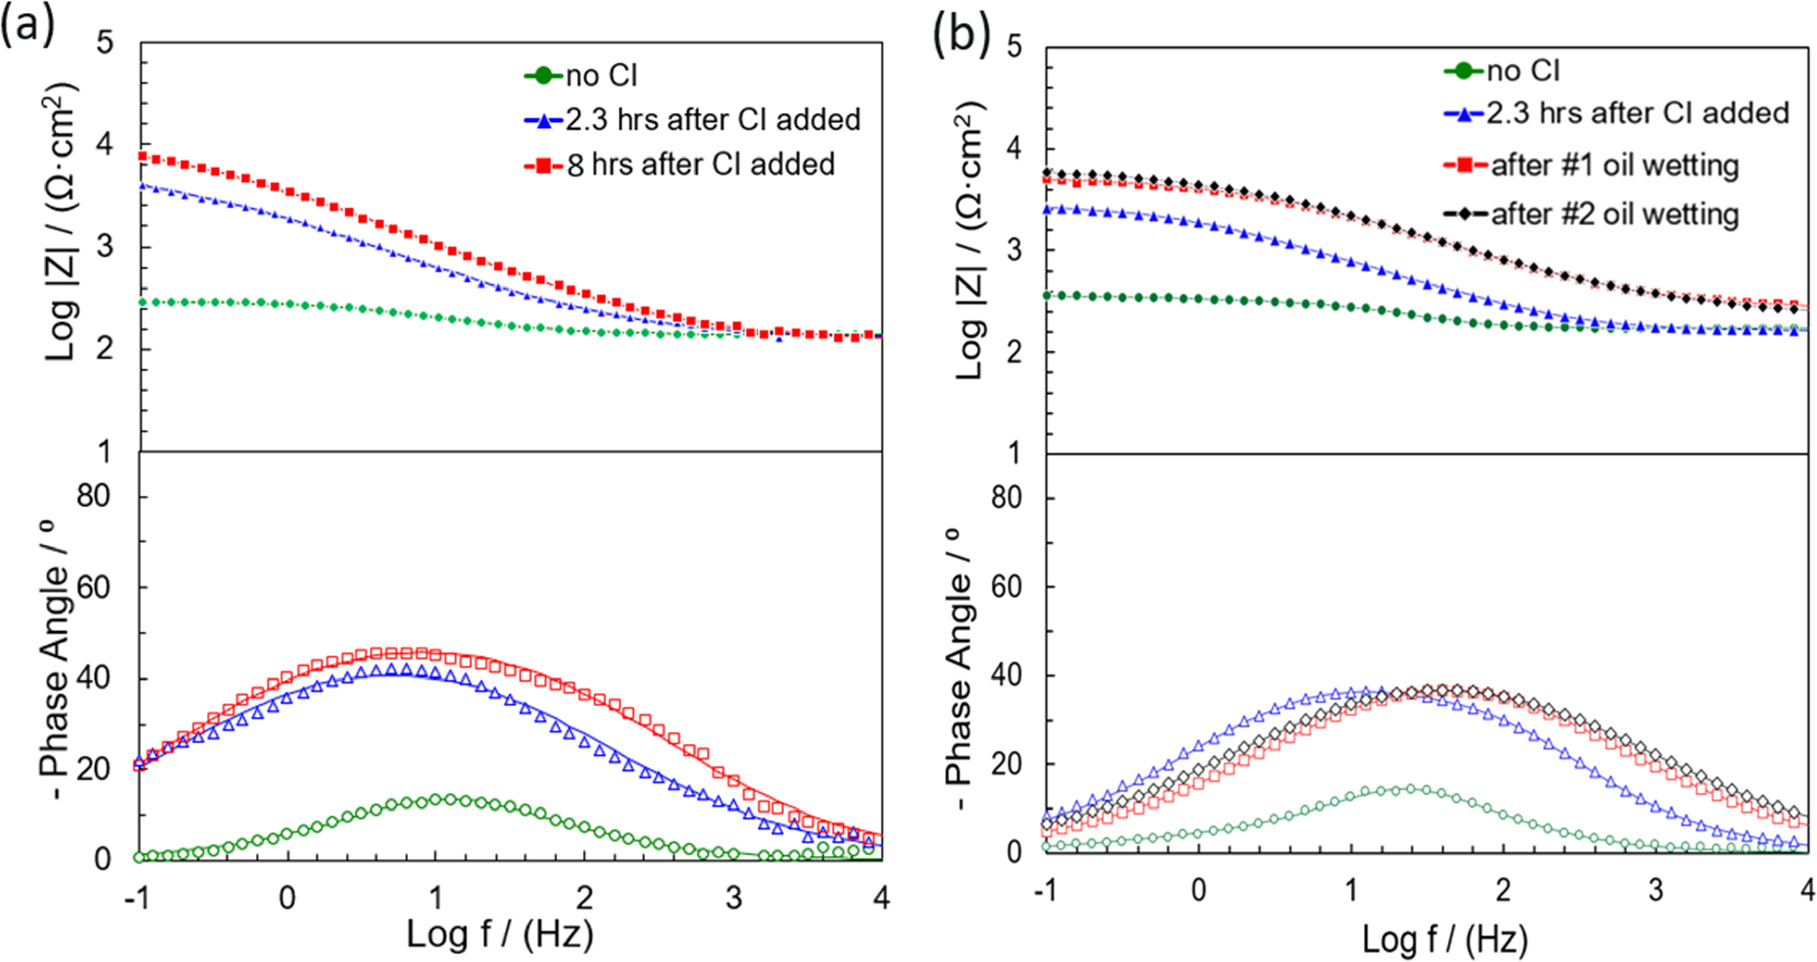
Figure 7. Bode plots of C1018 exposed in an N2 saturated 1 g l−1 NaCl (RC) solution: (a) without oil at different immersion time (•) no inhibitor, (▴) 2.3 h after inhibitor added, (▪) 8 h after inhibitor added; (—) fitting results; (b) with oil at different immersion time: (•) no inhibitor, (▴) 2.3 h after inhibitor added, (▪) after #1 oil wetting, (♦)after #2 oil wetting; (—) fitting results. Corrosion inhibitor abbreviates to CI in the figure.
Download figure:
Standard image High-resolution imageTable VI. Circuit parameters for impedance spectra modeling of mild steel in N2 saturated 1 g l−1 NaCl electrolyte containing THP-C14 for different immersion times at 25 °C.
| Specimen exposure | Time (min) | Rs (Ω) | Rct (Ω·cm 2 ) | Qdl (sα /(Ω·cm2)) | αdl | CPEdl (μF/cm2) | χ2 (×10−4) |
|---|---|---|---|---|---|---|---|
| Pure water wetting | 15 | 58.7 | 193 | 1.84 × 10⁻⁴ | 0.81 | 202.7 | 6.4 |
| 142 | 56.2 | 3227 | 1.61 × 10⁻⁴ | 0.78 | 164.7 | 5.7 | |
| 316 | 57.2 | 6224 | 1.38 × 10⁻⁴ | 0.67 | 61.3 | 12.9 | |
| 502 | 56.9 | 8736 | 1.33 × 10⁻⁴ | 0.64 | 44.5 | 2.32 | |
| Intermittent wetting | 15 | 59.3 | 179 | 1.90 × 10⁻⁴ | 0.82 | 223.5 | 0.47 |
| 140 | 54.8 | 2889 | 2.33 × 10⁻⁴ | 0.72 | 182.4 | 1.81 | |
| 318 | 60.8 | 5592 | 6.31 × 10⁻⁵ | 0.64 | 14.3 | 0.32 | |
| 502 | 62.0 | 6415 | 1.03 × 10⁻⁴ | 0.60 | 20.8 | 1.42 | |
In the RC environment, the solution resistance was ca. 60 Ω, which was much higher than that in the EP environment, mainly because of the drastically lower sodium chloride concentration in the RC environment. For the pure water wetting experiments, as in Table VI, the CPEdl showed a trend similar to that of the EP condition, with a decrease over the initial several hours and then becoming stable. The adsorption of the inhibitor molecules modified the metal surface and decreased the corrosion rate. For intermittent wetting experiments, after the #1 oil-wet stage (at ca. 318 min), and the #2 oil-wet stage (at ca. 502 min), both CPEdl and Rct did not significantly change, which indicated that the sample characteristics displayed no evolution under the hydrocarbon.
Effect of chloride concentration on the adsorption of inhibitor
One difference between RC and EP environment was their chloride concentrations, of 1 g l−1 and 50 g l−1, respectively. Previous research showed that chloride (Cl−) could act as a linkage between the positively charged surface and cationic inhibitor heads. 20,26,27 Therefore, a set of inhibition experiments using non-coordinating ClO4 − ions was carried out to investigate the role of coordinating Cl− in inhibitor adsorption, although real field conditions always contain sodium chloride, even at concentrations as low as 1 g l−1.
Figure 8 shows the corrosion rate results obtained with different concentrations of NaCl in a CO2 environment. For the baseline experiment, as shown in the blue curve, the electrolyte only contained 0.86 M NaClO4 (no NaCl); this corresponds to the same anion concentration in mol/L as a 50 g l−1 NaCl solution, creating the same ionic strength in both solutions. It was shown that after about 24 h, the corrosion rate did not significantly change and was also comparable with the pure water wetting experiment in 0.86 M (50 g l−1) NaCl solution without inhibitor (Fig. 4a).
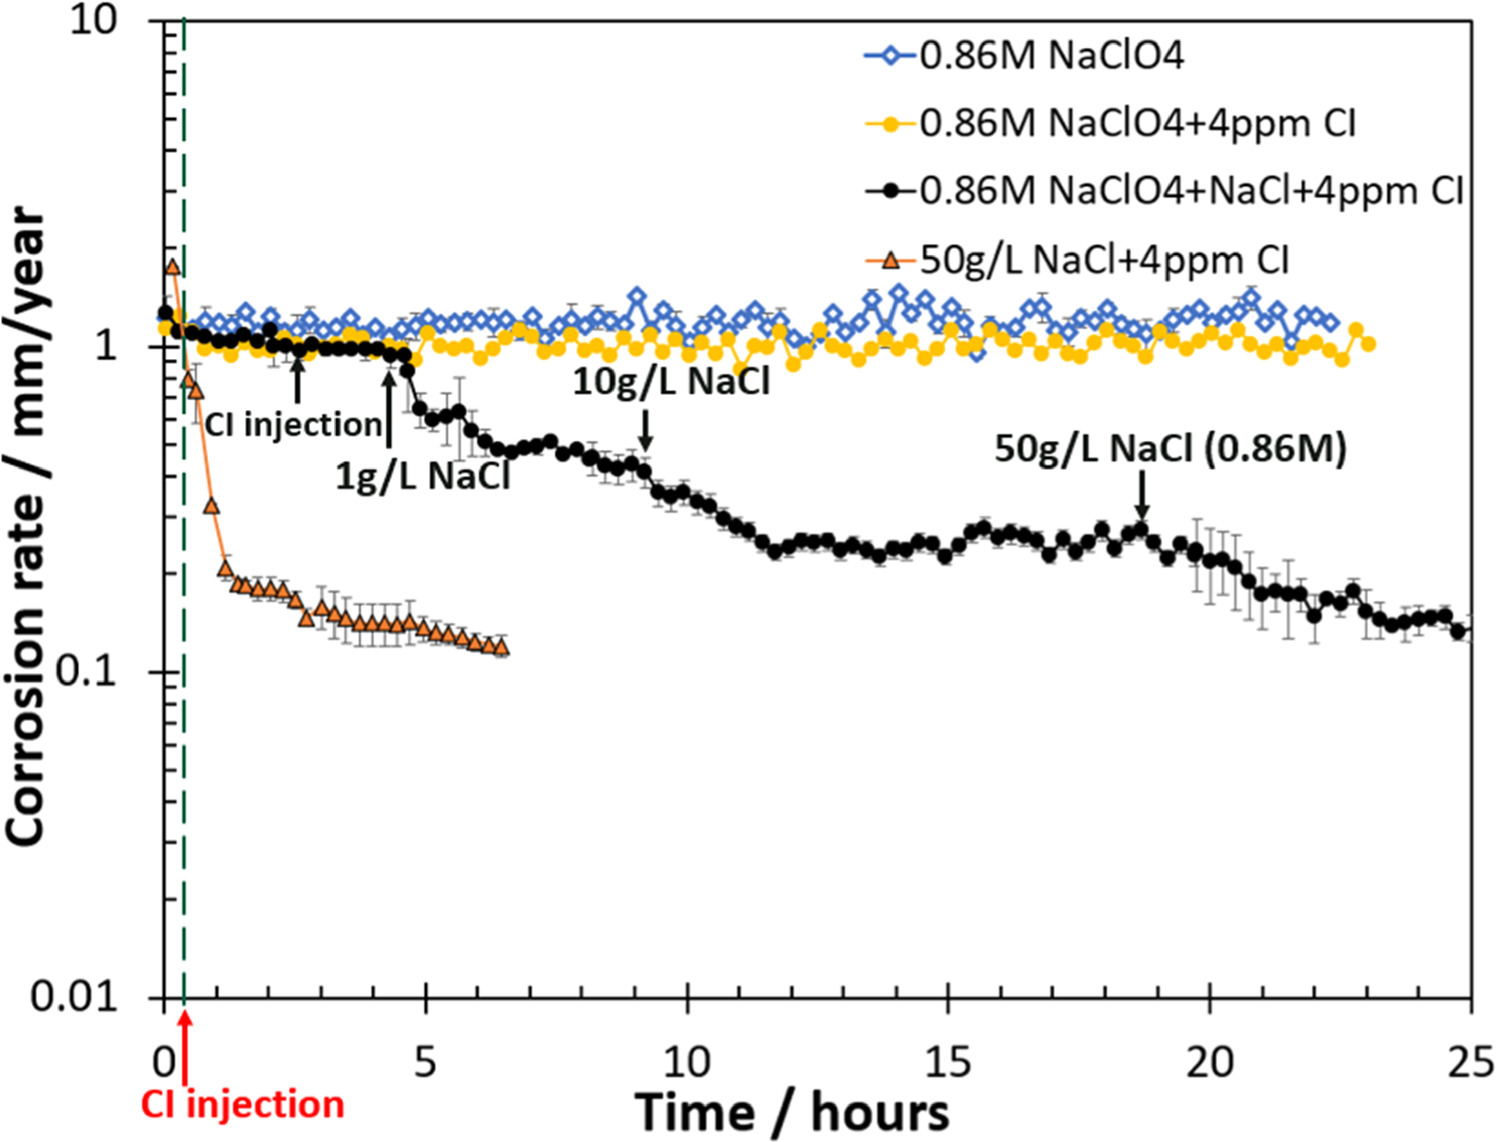
Figure 8. The corrosion rate results obtained with NaClO4 and different concentrations of NaCl in CO2 environment. The dash line indicated the inhibitor injection for 0.86 M NaClO4 + 4ppm inhibitor experiment and 50 g l−1 NaCl + 4 ppm inhibitor experiment. Corrosion inhibitor abbreviates to CI in the figure.
Download figure:
Standard image High-resolution imageFor the pure water inhibition experiment, as shown in yellow, the test solution was initially 0.86 M NaClO4. Then, 4ppm THP-C14 was injected after ca. 20 min. The results showed that the injection of corrosion inhibitor in the NaClO4 solution did not significantly change the corrosion rate, its final value being close to that recorded in the absence of THP-C14. This indicates that ClO4 − did not effectively enhance the performance of inhibitor molecules, this is likely because ClO4 − does not significantly coordinate on the metal surface. 28,29
The objective of the last experiment using NaClO4, shown by the black curve, was to add a certain amount of NaCl sequentially during the inhibition experiment to verify the role of chloride. The test electrolyte was initially only aqueous NaClO4. After ca. 2.5 h, 4 ppm THP-C14 was injected into the solution and the corrosion rate did not significantly change. However, when 1 g l−1 NaCl was then added (at ca. 4.5 h), a decrease in corrosion rate was observed. A further increase in NaCl concentration to 10 g l−1, which was added at ca. 9 h, resulted in a more pronounced decrease in corrosion rate. When even more salt was added, sufficient to achieve 50 g l−1 NaCl (at ca. 19 h), a further decrease in corrosion rate was observed before its stabilization was achieved at ca. 0.15 mm/year. The final steady state corrosion rate of the NaClO4 adding NaCl experiment was close to the NaCl experiment, for which the test solution was 50 g l−1 NaCl (0.86 M) and THP-C14 was added after 20 min, as shown in the orange curve. The result indicated that the presence of Cl− was crucial for the adsorption of corrosion inhibitor molecules.
Consequently, it can be postulated that the presence of sodium ions is unlikely to lead to any significant corrosion rate change. It is hypothesized that THP-C14 inhibitor model compound is physisorbed to the surface steel via electrostatic attractions between the charged inhibitor molecules and the charged metallic surface, with Cl− playing a critical role in inhibitor adsorption. The adsorption of Cl− facilitates the subsequent physisorption of cationic inhibitors, by acting as the linkage between the positively charged surface and the positively charged cationic inhibitor molecule. With more Cl− in the solution, more corrosion inhibitors will adsorb on the metal surface and form a protective layer, thus further decreasing the corrosion rate.
Corrosion rate and EIS data analysis in CO2 environment with low chloride concentration
Key differences between EP and RC environments are the nature of the gas they are saturated with (CO2 vs N2) and their different pH values. Both affect hydrogen ion availability for the cathodic reduction reaction on the carbon steel surface and can potentially play a role in the inhibition process. Therefore, a set of inhibition experiments with 1 g l−1 NaCl (matching RC environment) was carried out in the CO2 environment with pH 4.5.
Figure 9 shows the corrosion rate in EP condition with 1 g l−1 NaCl at 25 °C with and without LVT 200. For experiments without THP-C14, i.e., blank (intermittent wetting) and blank (pure water wetting), the final corrosion rate did not change significantly after two oil-wetting stages and their final corrosion rates were very close to each other. When the THP-C14 inhibitor concentration was 20 ppm (above surface saturation concentration 19 ), CR gradually decreased after the #1 and #2 oil-wetting stage for the intermittent wetting experiment. Compared with blank tests without oil (pure water wetting), the final corrosion rate was close to that determined in the experiment conducted without oil. This agrees with the previous observations in the RC environment (Fig. 4b). However, with experiments conducted in 50 g l−1 NaCl with THP-C14 present above its surface saturation concentration, 19 the final corrosion rate was much lower than in the absence of oil (Fig. 4a). Therefore, the chloride concentration does influence the interaction between the inhibitor and the hydrocarbon regardless of saturating gas or pH.
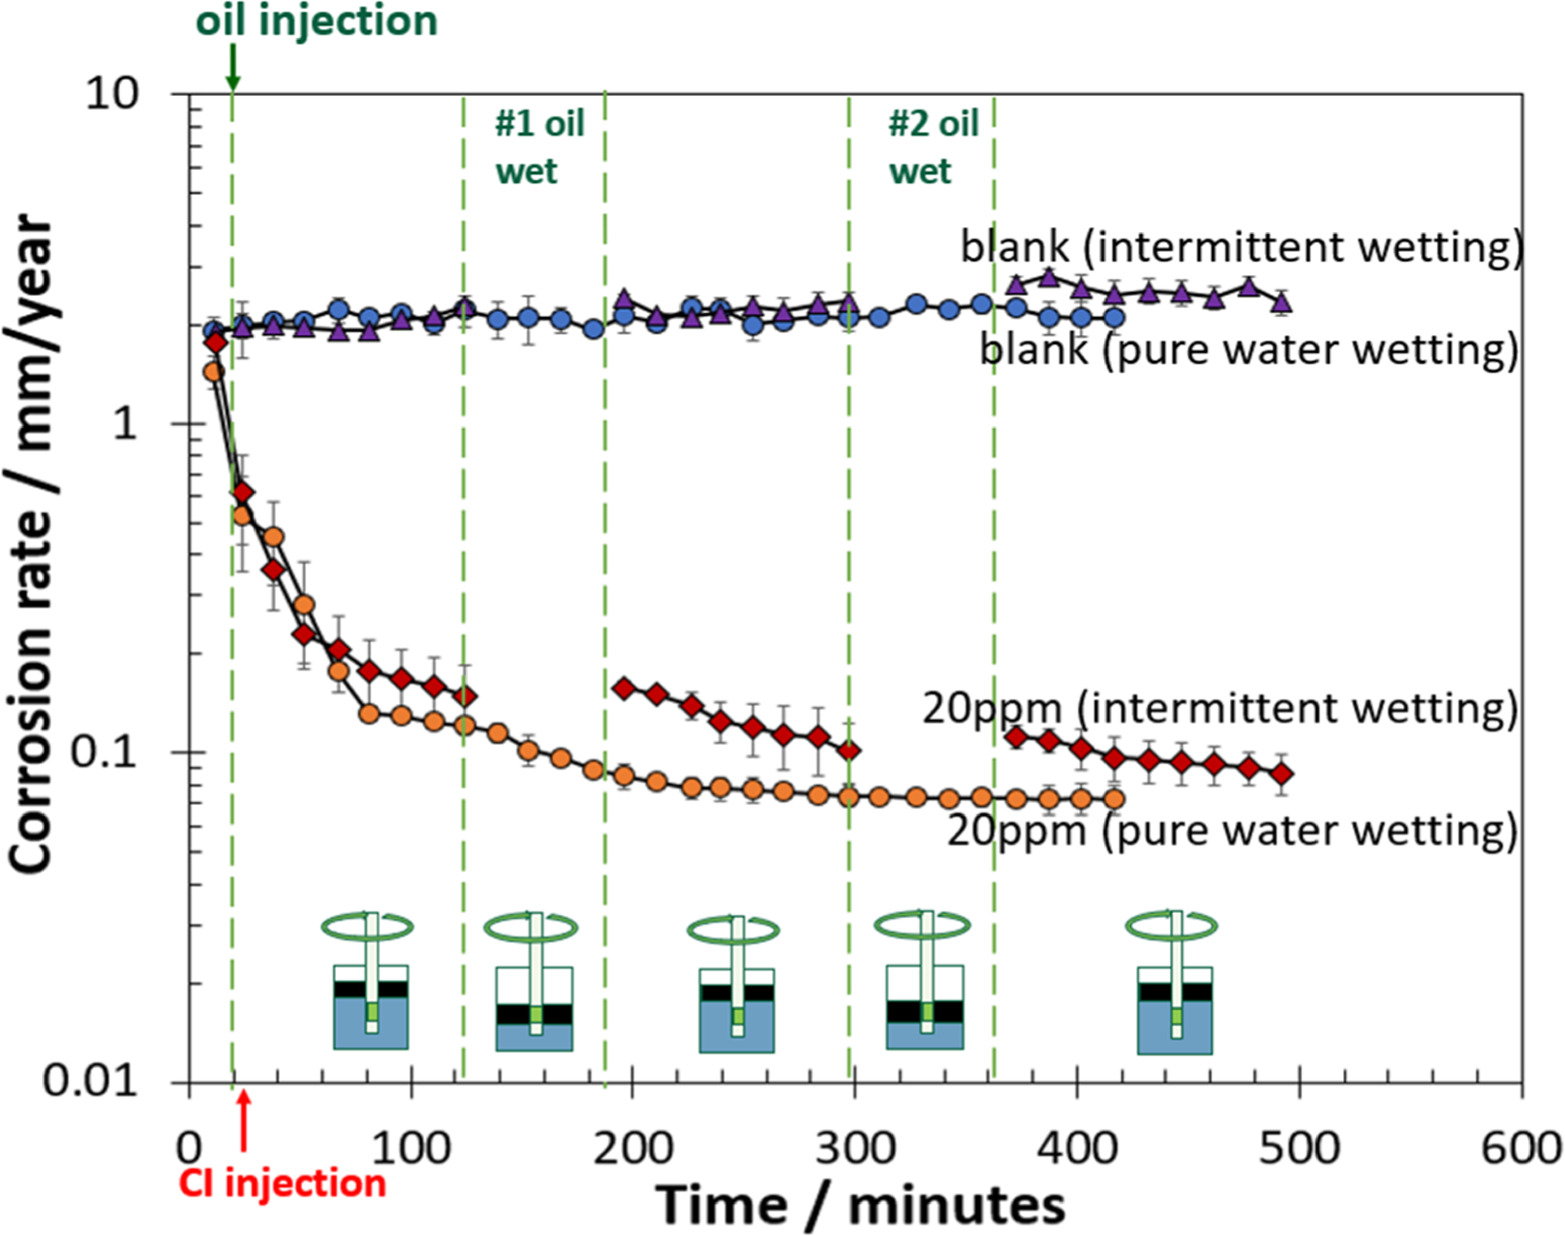
Figure 9. The corrosion rate at 25 °C with and without LVT 200 in pH 4.5 CO2 environment with 1 g l−1 NaCl with blank (no inhibitor) and 20 ppm THP-C14. Corrosion inhibitor abbreviates to CI in the figure.
Download figure:
Standard image High-resolution imageFigure 10 shows Bode plots for an experiment with 20 ppm of THP-C14 inhibitor with and without oil at different immersion times in the pH 4.5 CO2 environment with 1 g l−1 NaCl. Data were fitted using the equivalent circuit as shown in Fig. 6a. The values of impedance parameters obtained by fitting the impedance data are listed in Table VII. From Fig. 10 and Table VII, the solution resistance is much higher than that in the 50 g l−1 NaCl electrolyte (Tables IV and V). Moreover, compared with the result in the EP environment with 50 g l−1 NaCl (Fig. 5), only one time constant was detected during the experiments with and without oil. With lower chloride concentration, the inhibitor film may not be sufficiently molecularly packed or thick enough to show a different time constant, which was similar to the RC environment. Besides, the Bode plot (Fig. 10b) did not change significantly between the two oil-wetting stages, which indicates that the sample surface characteristics did not change significantly after immersion in the oil phase.
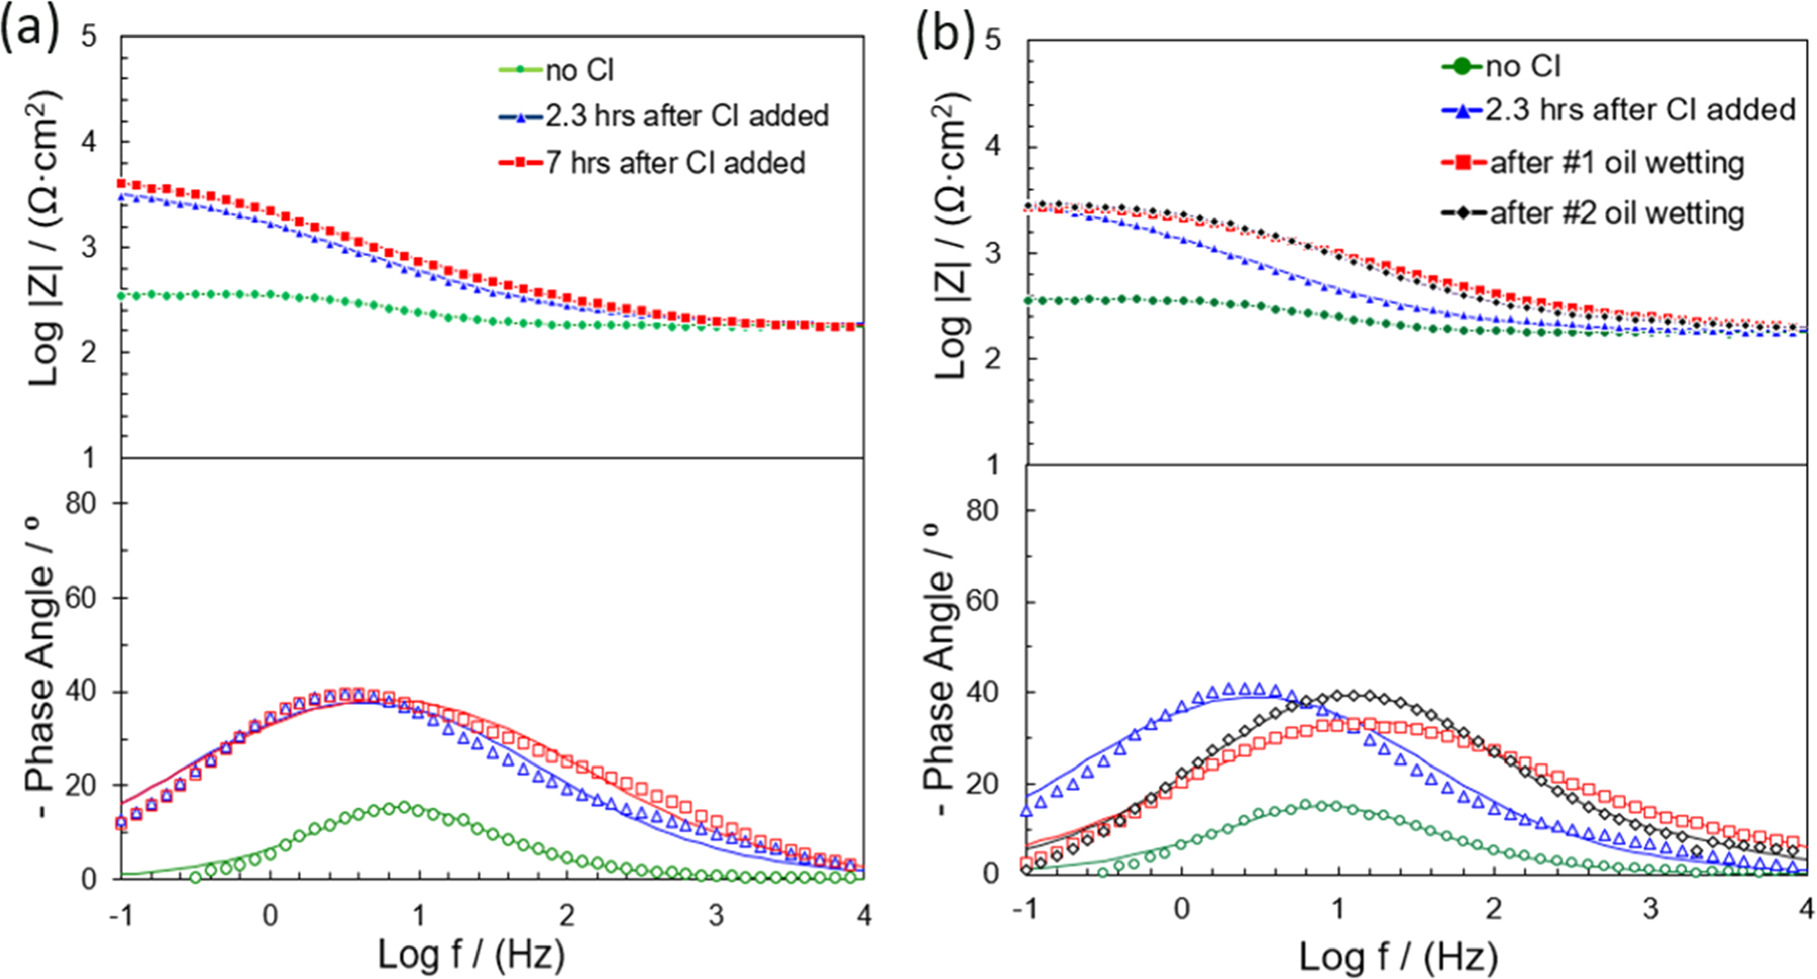
Figure 10. Bode plots of C1018 exposed in a CO2 saturated 1 g l−1 NaCl solution: (a) without oil at different immersion time (•) no inhibitor, (▴) 2.3 h after inhibitor added, (▪) 7 h after inhibitor added; (—) fitting results; (b) with oil at different immersion time: (•) no inhibitor, (▴) 2.3 h after inhibitor added, (▪) after #1 oil wetting, (♦)after #2 oil wetting; (—) fitting results. Corrosion inhibitor abbreviates to CI in the figure.
Download figure:
Standard image High-resolution imageTable VII. Circuit parameters of the modeling of impedance spectra for mild steel in 1 g l−1 NaCl solution containing 20 ppm of the inhibitor with different immersion time at 25 °C.
| Specimen exposure | Time (min) | Rs (Ω) | Rct (Ω·cm2) | Qdl (sα /(Ω·cm2)) | αdl | CPEdl (μF/cm2) | χ2 (×10−4) |
|---|---|---|---|---|---|---|---|
| Pure water wetting | 15 | 63.2 | 187 | 4.11 × 10⁻⁴ | 0.76 | 422.4 | 12.2 |
| 128 | 65.4 | 3900 | 1.32 × 10⁻⁴ | 0.65 | 50.8 | 15.3 | |
| 296 | 65.6 | 4519 | 1.39 × 10⁻⁴ | 0.61 | 38.1 | 20.8 | |
| 418 | 61.6 | 5276 | 1.26 × 10⁻⁴ | 0.59 | 25.3 | 14.5 | |
| Intermittent wetting | 15 | 62.8 | 197 | 3.39 × 10⁻⁴ | 0.79 | 391.9 | 0.82 |
| 126 | 67.6 | 3046 | 1.62 × 10⁻⁴ | 0.73 | 127.4 | 0.93 | |
| 298 | 68.3 | 3746 | 7.94 × 10⁻⁵ | 0.59 | 12.3 | 3.99 | |
| 489 | 68.3 | 3945 | 6.56 × 10⁻⁵ | 0.65 | 17.7 | 2.32 | |
In the CO2 environment with 1 g l−1 NaCl, for the pure water wetting experiments, as can be seen from Table VII, the CPEdl showed a trend very similar to the previous solely water wetting experiments in both EP and RC environments, with a decrease in the first several hours then becoming stable. As described previously, the adsorption of the inhibitor compound modifies the metal surface and decreases the corrosion rate. For intermittent wetting experiments, CPEdl decreased but was still very close to the CPEdl for solely water wetting. After the #1 oil-wetting stage (at ca. 298 min) and the #2 oil-wetting stage (at ∼489 min), both CPEdl and Rct did not change significantly, which indicates that the metal surface characteristics remained the same.
Proposed mechanisms for the effect of intermittent wetting on corrosion inhibition in EP and RC environments
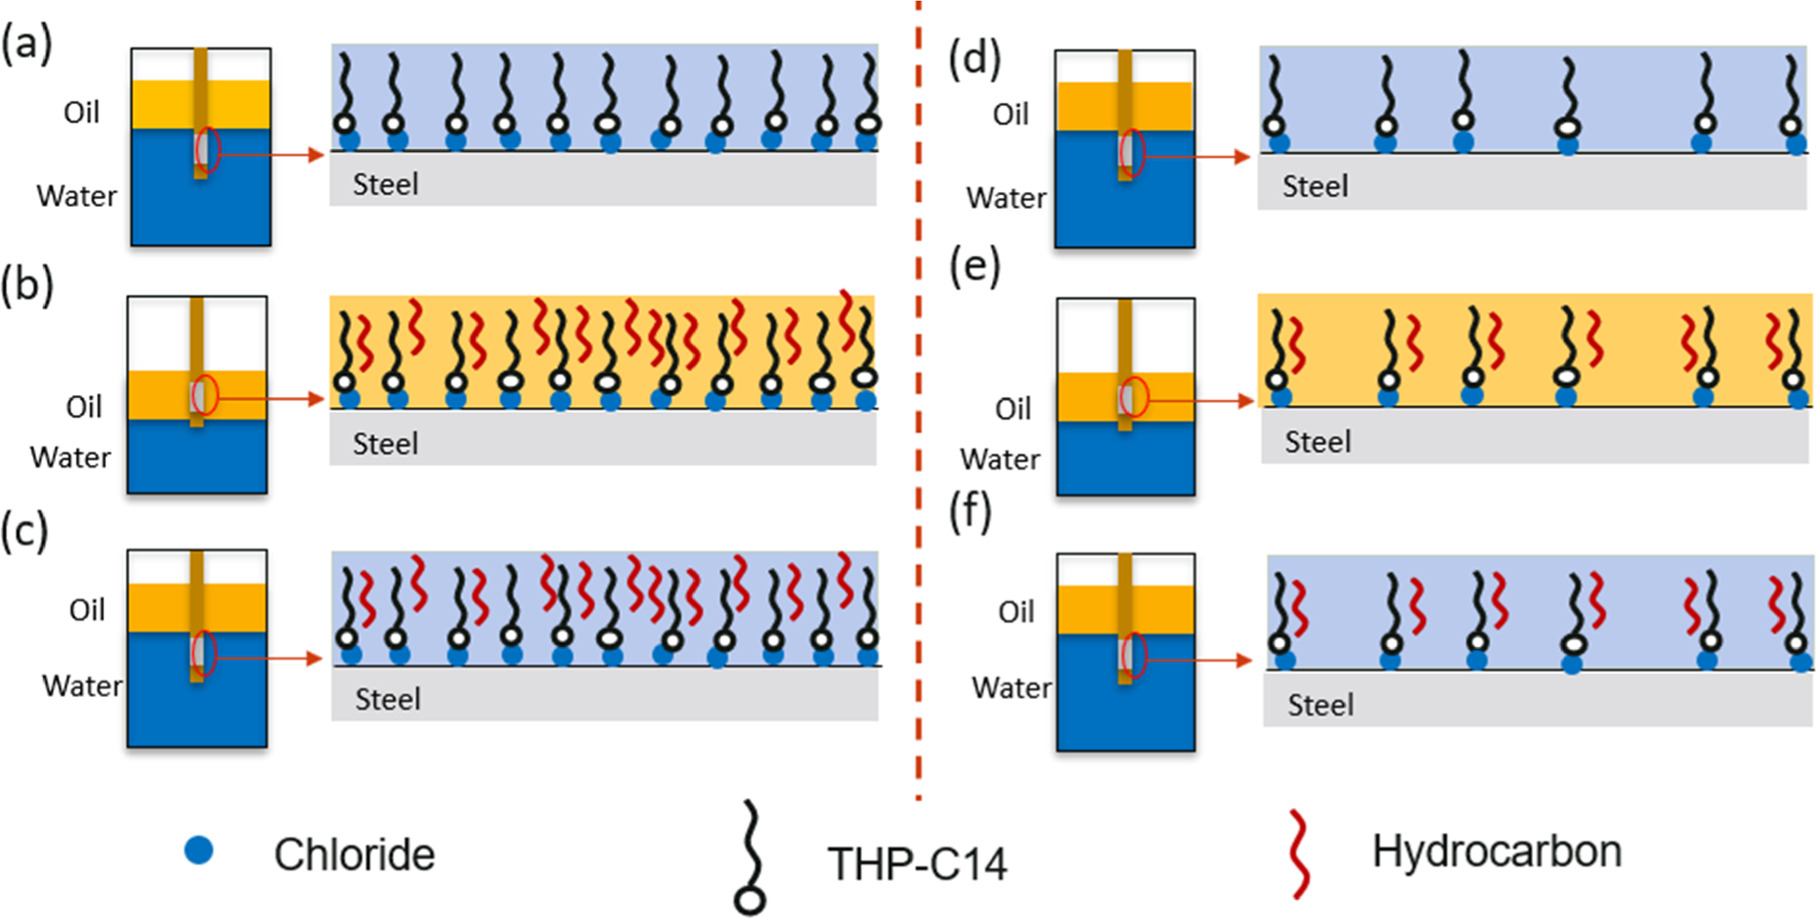
Belarbi et al. investigated the role of the potential of zero charge (PZC) and found that the corroding steel surface is positively charged relative to the PZC in acidic media; therefore, the adsorption of anions (e.g., ubiquitous Cl−) or of inhibitor molecules with a negative structural moiety is favored through electrostatic attraction. 20 The chemical structure of the corrosion inhibitor model compound in this work, THP-C14, is one in which the positive charge is delocalized between the two nitrogen atoms separated by a single carbon atom. 19 Chloride ions will act as bridging species between the metal surface and THP-C14 molecules. In this case, THP-C14 molecules can absorb on the metal surface through electrostatic interactions. In the EP environment, there is a large amount of Cl− ions in the solution (50 g l−1 NaCl). After the corrosion inhibitor injection, the introduced THP-C14 molecules will adsorb to the metal surface mainly through electrostatic interactions (Fig. 11a). This will cause a decrease in the surface area of active sites and an increased impedance. When the sample is immersed in the oil phase during the #1 oil-wet stage (Fig. 11b), some of the THP-C14 molecules will still adsorb on the sample with other THP-C14 molecules remaining in the aqueous phase. The alkane molecules that make up the oil phase could then readily align with the hydrophobic tails of the corrosion inhibitor molecules on the surface. After the specimen is returned to the aqueous phase (Fig. 11c), the corrosion efficiency will be enhanced because of the presence of alkane molecules within the inhibitor film structure. The "enhanced" film of adsorbed inhibitor molecules incorporating hydrocarbons then forms a diffusion barrier between the steel and any aqueous medium, which impedes the access of corrosive ions to the metal surface. It is important to note that, in the absence of hydrocarbon, a THP-C14 film by itself does not form a mass transfer barrier.
Figure 11. Proposed mechanisms for EP environment with 50 g l−1 NaCl: (a) THP-C14 molecules adsorb on the initially water wetted metal surface; then (b) the alkane molecules align with the hydrophobic tails of corrosion inhibitor during oil wetting; (c) when metal surface is rewetted by water, an enhanced surface film remain on the surface as the alkane molecules are incorporated with the inhibitor film structure. For RC environment with 1 g l−1 NaCl: (d) less THP-C14 molecules adsorb on the initially water wetted metal surface; (e) less tail-alkane interaction during oil wetting; (f) when metal surface is rewetted by water, the amount of incorporated oil does not provide an enhanced barrier to electrolyte.
Download figure:
Standard image High-resolution image
However, in the RC environment, Cl− concentration in the solution was comparatively very low (1 g l−1 NaCl). After the injection of corrosion inhibitors, less THP-C14 molecules adsorb on the metal surface through electrostatic interactions, as shown in Fig. 11d. However, if the corrosion inhibitor concentration was higher than the surface saturation concentration, maximum coverage would be obtained on the metal surface. When the sample was immersed in the oil phase during the #1 oil-wet stage (Fig. 11e), THP-C14 molecules would still adsorb on the sample. The alkane molecules that made up the oil phase would align with the hydrophobic tails of the small amount of corrosion inhibitor molecules on the surface. However, since less THP-C14 is on the surface, the available tail-alkane interaction in RC condition would be less than the EP condition. After the specimen was returned to the aqueous phase (Fig. 11f), the corrosion inhibition efficiency would not change significantly, since the maximum coverage had been achieved, and the amount of incorporated oil did not result in a diffusion barrier.
More work will be undertaken to assess the observed phenomena with different corrosion inhibitors and the threshold limit of chloride ions, including their formulations in packages, that possess different inhibitive effects for oil/water systems. Small scale techniques, such as atomic force microscopy and quartz crystal microbalance mass change determinations, should be useful to confirm the mechanism. The mechanisms proposed herein provide useful guides to model development for the study of the effect of intermittent wetting on corrosion inhibition in oil/water systems, with THP-C14 representing a useful experimental proxy.
Conclusions
In this work, electrochemical impedance spectroscopy and linear polarization resistance were used to study the behavior of THP-C14 as a corrosion inhibitor model compound at 25 °C in EP and RC conditions in the presence of hydrocarbon. Mechanisms were investigated by studying inhibitor interaction with hydrocarbon. As a result of this study, the following conclusions were drawn:
- LVT 200 model oil present by itself did not exhibit inhibitory properties on the corrosion behavior of carbon steel in both EP and RC conditions.
- In EP condition, the presence of oil will promote corrosion inhibition. However, in the RC condition, the presence of oil did not significantly diminish corrosion inhibition compared with THP-C14 only.
- EIS has been shown to be a valuable technique for studying the mechanism of inhibitor protection. It can be used to measure corrosion-related electrochemical parameters such as the resistances and capacitances of inhibitor layers, charge transfer resistance, and double layer capacitance. These parameters can be used to explain the inhibition mechanism.
- EIS revealed two different protection mechanisms conferred by THP-C14 in the presence of oil between EP and RC environments. The surface property in RC with oil was different in EP after the second oil-wet stage.
- In the EP environment, results show that after the oil-wet stage, the inhibitor interacted with the hydrocarbon and changed the electrode-electrolyte interface, thus causing an increase in the thickness of the surface film.
- In the RC environment, with lower chloride concentration than in EP environment, the presence of oil did not significantly change corrosion inhibition. EIS results indicated that the sample surface properties did not change significantly after immersion in the oil phase twice.
- The THP-C14 inhibitor model compound was physiosorbed to the surface steel via electrostatic attractions between the charged inhibitor molecules and the charged metallic surface. Chloride ions played a critical role in inhibitor adsorption. With more Cl− in the solution, more corrosion inhibitors were adsorbed on the metal surface and formed a protective layer, thus further decreasing the corrosion rate.
Acknowledgments
The authors would like to thank TotalEnergies for their financial support, as well as for ongoing discussions. We would also like to express our gratitude to Cody Shafer for providing Fig. 2 and Alexis Barxias for his technical support.
Footnotes
- a
UNS numbers are listed in Metals and Alloys in the Unified Numbering System, published by the Society of Automotive Engineers (SAE International) and cosponsored by ASTM International.