

Abstract
This report focuses on evaluating the influence of structural and physical properties of MoS2 material on electrochemical behaviors as well as sensing performance toward the detection of targeted chloramphenicol (CAP) molecules. The various MoS2 samples were fabricated via a simple ultrasonication route at different experimental times. Through using X-ray diffraction (XRD), Raman, and scanning electron microscopy (SEM), structural and chemophysical characterizations were analyzed and discussed. Furthermore, from electrochemical measurements such as CV, EIS, DPV, and CA, the recorded results exhibited strong differences in the current response and the kinetic parameters of redox reactions among the proposed electrodes. It is also interesting to note that the proposed possible hypotheses and suitable mechanisms are particularly necessary to explain in more detail the important changes in kinetic parameters and sensing performance at MoS2-modified electrodes. Among them, the MoS2-3 sample with good crystallinity, high purity, low intrinsic thickness, and particularly, a defect-rich structure offered remarkable advances compared with that of other materials. As a result, this electrode exhibited an extended linear range (0.5 − 50 μM), a lower detection limit (0.1 μM), good repeatability, and high selectivity.

Highlights
Studying the influence of ultrasonication treatment time on the formation, structural, and chemophysical characterizations of MoS2 material
Proposing the mechanism and hypothesis for the impacts of the structural and physical characterizations on the changes in kinetic parameters and sensing performance at MoS2-modified electrodes
Export citation and abstract BibTeX RIS
Molybdenum disulfide (MoS2) is known as one of the most studied layered transition-metal dichalcogenides, which owns many unique features such as tunable crystal structure, extraordinary electrical, great optical properties, and high specific surface area owing to layered forms. 1 Benefiting from a flexible electronic structure, hydrophilicity, and promising 2D layered structure, MoS2 has been studied and widely employed in many different fields, for example, energy storage and conversion, catalysis, and particularly, for electrochemical sensor applications. It has been widely used in the modification process of commercial electrode surfaces to improve electrochemical behaviors and detection performance. 2,3 Studying the structural aspect, due to the existing of the weak van der Waals interactions between S layers within the MoS2 layered packed structure, promotes more efficient charge/electron transfer and the access of the electrolyte, as well as provides more conductive channels for charge and electron transportation. 3,4 Furthermore, its abundant active edge sites, high conductivity, and hydrophilicity compared to other materials are evaluated to be beneficial to the catalytic activities, charge transfer, and contact/exposure between active electrode surface and electrolyte. 5 Unlike 2D-carbonaceous materials (graphene, graphene oxides), the presence of Mo atoms sandwiched between S layers not only brings unique structural features and strong catalytic active sites but also enables the changes in structures toward boosted performance. In fact, both theoretical and experimental evidence have demonstrated that the addition of MoS2 could greatly increase the electrochemical performance owing to these characteristics. 6–10 Indeed, Dinh et al. 11 chose 2D-MoS2 nanomaterial as an essential factor for the development of working electrodes in electrochemical sensor applications toward the sensitive determination of chloramphenicol (CAP). As expected, the MoS2-modified electrode offered a wider concentration linear range (0.5–50 μM) and a smaller LOD value (61 nM). Specifically, Rinky Sha et al. 12 used MoS2 to develop an advanced electrode for the highly selective detection of uric acid molecules in human urine samples. As a result, with the unique features of MoS2, the proposed electrode showed a wide linear concentration range from 10 × 10−6 to 400 × 10−6 mol l−1, excellent reproducibility, selectivity, and low detection limit of 1.169 × 10⁻⁶ mol l−1. Likewise, Shang Gao et al. 13 demonstrated the promising potential of using MoS2-GO composites to modify the working electrode surface for sensitive detection of CAP. In this case, the sensing performance of the MoS2-rGO-based sensor was remarkably improved, including a low sensitivity (4.566 μA μM−1 cm−2), a wide concentration linear range (1–55 μM), and a low LOD value of 0.6 μM.
Unfortunately, to the best of our knowledge, most of such efforts just focused on investigating, evaluating, and comparing performance enhancements or even somehow finding synthetic methods/technique approaches to optimize the unique features of MoS2, aiming to create material structures having the best electrochemical performance. 12,14 According to that, the accurate understanding of the effect of the structural and physical properties of MoS2 material on electrochemical characteristics and the sensitive response to targeted molecules has not been still fully exploited. While, it is a crucial basis approach to further investigate its physicochemical properties, particularly for electrochemical behaviors. Indeed, some of our previous reports also demonstrated that the electrochemical properties of 2D materials in general, and graphene in particular, not only depend on morphology, size, and active surface area but also on the layer number, exposed active edge sites, defect density, and even active surface functional groups. 4,11,15–17 Hence, to further understand whether the structural and physical properties of MoS2 materials impact the electrochemical behaviors as well as sensor performance towards targeted molecule detection, herein, the various MoS2 samples were fabricated by a simple ultrasonication method at different experimental conditions. The first proposed strategy in evaluating the influence of the structural and physical properties on the electrochemical characteristics was to compare their electrochemical response as well as kinetic parameters together. This included the modification of the working electrode surface with the various MoS2 samples and evaluating the electrochemical response in the addition of a redox probe (K3/K4) and CAP molecules, respectively. With the change in the ultrasonication time, it is evident that the layer number, morphology, size, thickness, distribution, and defect density observed had remarkable differences via evaluating SEM images, XRD results, and Raman spectrum. Electrochemical measurements such as EIS, CV, DPV, and CA measurements were used and showed significant differences in the redox current response and the kinetic parameters among the electrodes modified with various MoS2 samples. It is also interesting to note that the possible hypotheses and suitable mechanisms were proposed to confirm further the strong differences in kinetic parameters and sensing performance toward the modified electrodes. An insight into the influence of the structural and physical properties of MoS2 material will help to orient the sustainable development to new electrode materials and offer more suitable approaches to enhance sensing performance.
Experimental
Chemicals
All chemicals used in this study, such as K3[Fe(CN)6], K4[Fe(CN)6]•3H2O (98%), chloramphenicol (CAP, >99%), and molybdenum (IV) sulfide (MoS2) (98%, <2 μm) were obtained from Sigma-Aldrich (USA). NaCl (99%), KCl (>98%), Na2HPO4, and KH2PO4 (99%), were of reagent grade and purchased from Sigma-Aldrich, Merck KgaA (USA), and Xilong Scientific Co., Ltd. (Shantou, China), were also used to prepare phosphate buffer saline (PBS-pH 7.4) as a potential supporting electrolyte. The pH value of this buffer solution was adjusted by using 0.1 M of H3PO4 and NaOH (>98% was obtained from Xilong Scientific Co., Ltd. China) solutions by IC-PH60 pH tester kit. Furthermore, the commercial screen-printed electrodes (SPEs) utilized, herein, were provided by DS Dropsens, Spain.
Methods
Preparation of MoS2 nanosheets
In the first step, 10 mg powder of molybdenum sulfide (MoS2) was added into 100 ml double distilled water (DI water) along with 3 mg polyvinylpyrrolidone (PVP) and then stirred at room temperature for 30 min. In the second step, the ultrasonication process of 100 ml each obtained mixture solution was performed using the UWave 2000 instrument at 560 W for durations of 1, 2, and 3 h, respectively. The samples collected after ultrasonic vibration for different periods were labeled as MoS2-1, MoS2-2, and MoS2-3 samples, respectively.
Preparation of MoS2/SPEs
The working electrode surface was modified through a facile drop cast technique. First, 10 mg of each above MoS2 sample was homogeneously dispersed into 10 ml of DI water with the support of the sonication process for 30 min. As expected, the aqueous suspensions with a concentration of 1 mg ml−1 of both three MoS2 samples were prepared. Next, commercial SPEs were carefully washed several times with ethanol and dried at room temperature. Afterward, 6 μl of each above MoS2 suspension (1 mg ml−1) was gradually dropped on the electrode surface. This step ensured a controlled and uniform modification of the proposed electrodes. Finally, after drying at 45 °C, the modified electrodes were carefully kept for the subsequent electrochemical measurements.
Shrimp sample preparation
3g real shrimp sample was prepared and purchased from a local supermarket. A vortex mixer was used to homogenize the shrimp sample with 10 ml PBS buffer (0.1 M), then the mixture was sonicated for 30 min. The resulting solution was centrifuged for 5 min at 10,000 rpm, the clear liquid phase was collected. Finally, different known amounts (5, 10, and 20 μM) of standard CAP were added into the above liquid phase.
Apparatus
Physical measurements
In this study, scanning electron microscope (SEM) images were used to observe the surface morphology and size of the various MoS2 samples by a JEOL JEM 1010 (Vietnam Academy of Science and Technology). Also, by using Bruker D5005 X-ray diffractometer (CuKa radiation with a wavelength of λ = 0.154056 nm, Vietnam National University), the purity, phase, and structural characteristic was identified. Raman results obtained from Raman spectroscopy (Horiba MacroRAM™ −785 nm, Phenikaa University) exhibited physicochemical characteristics along with the Fourier transform infrared (FTIR, JASCO 6100, Phenikaa University) spectroscopy in the wavenumber range from 400 to 4000 cm−1 at 2 cm−1 resolution.
Evaluation of electrochemical characterizations
A series of electrochemical measurements was carried out on a Palmsen 4 electrochemical workstation at room temperature. The electrochemical characteristics of bare SPE and electrodes modified with different MoS2 samples were investigated by cyclic voltammetry (CV) and electrochemical impedance spectroscopy (EIS) techniques, respectively. Namely, CV measurements at a scan rate of 50 mV s−1 were scanned in the potential range from 0.6 to −0.3 V in 0.1 M KCl solution containing 5 mM redox probe of K3[Fe(CN)6]/K4[Fe(CN)6)]. Also, EIS measurements were conducted at an AC voltage amplitude of 10 mV and in the frequency range from 0.01 to 50 kHz. For targeted CAP molecules, the sensing performance on the modified SPE was evaluated through CV and differential pulse voltammetry (DPV) measurements, respectively. In which, CV curves were recorded at a scan rate of 50 mV s−1 in the potential range of −1.1−0 V with 0.1 M PBS buffer as the electrolyte solution. Meanwhile, DPV curves were measured at the scan rate of 6 mV s−1.
Results and Discussion
Microstructure and physical characterizations
Figure 1a displays the crystallinity and phase purity of the synthesized MoS2 and bulk MoS2 samples. As can be seen, the recorded XRD patterns clearly showed the formation of MoS2 nanosheets resulting from the reduction in the (002) diffraction plane located at 14.4o in all prepared MoS2 samples, compared to the bulk MoS2 sample. Both MoS2-1, MoS2-2, and MoS2-3 samples exhibited characteristic peaks of (002), (100), (103), (104), (105), and (008), reflecting the pure hexagonal phase of the MoS2 sample. 5,11 These obtained results matched well with the previous reports. It is worth mentioning that the relative 2θ position of the characteristic diffraction peaks remained virtually unchanged with the changes in the prepared experimental condition. Furthermore, there were no extra peaks corresponding to impurity phases, confirming all proposed MoS2 samples owned good crystallinity and high purity. 12,18,19 Besides, the decrease in intensity of high-indexed diffraction peaks showed the short-range structural distribution of prepared MoS2 samples, particularly for MoS2-2 and MoS2-3 samples.
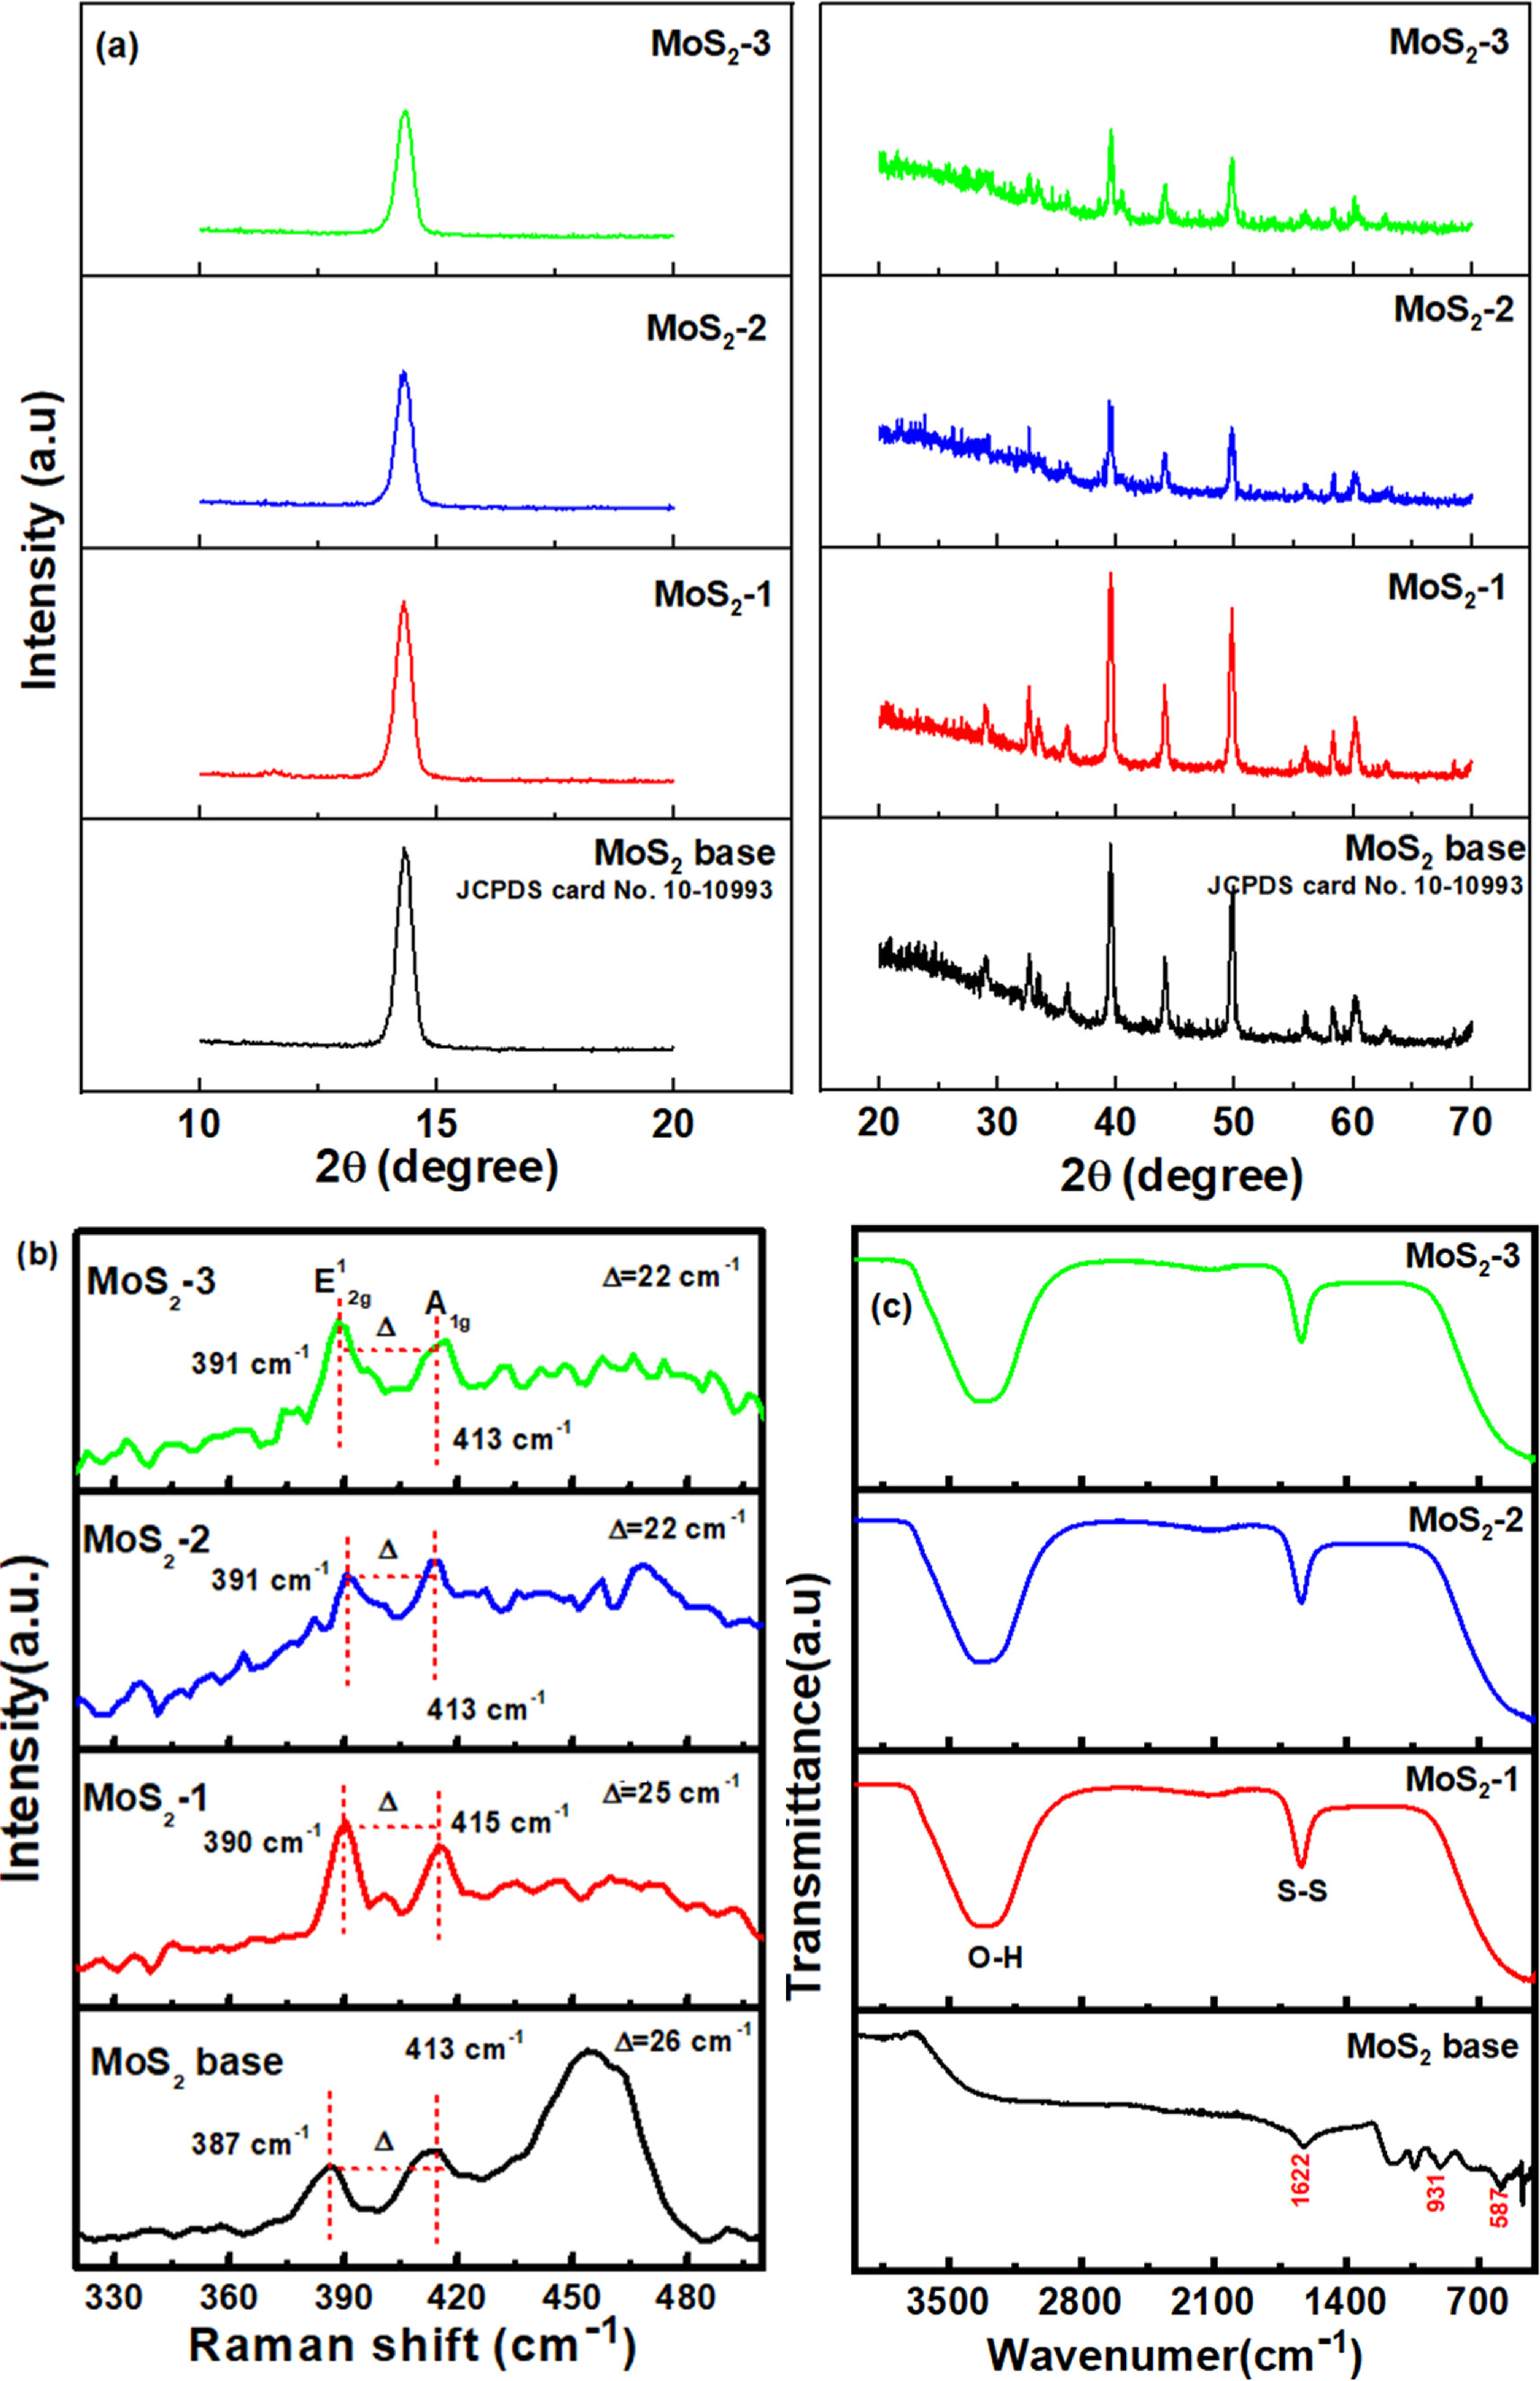
Figure 1. (a) XRD patterns, (b) Raman spectra, and (c) FT-IR spectra of the as-prepared MoS2 samples.
Download figure:
Standard image High-resolution imageRaman spectroscopy is also considered as a powerful tool to study crystalline structure and degree of defects. Herein, under ambient pressure conditions, all Raman patterns of crystalline MoS2 clearly showed the transformation of two internal lattice vibrations around 387 cm−1 and 413 cm−1, respectively. This result further confirmed the high purity and good crystalline structure of proposed MoS2 samples. In which, the in-plane E1 2g mode results from opposite motions of two S atoms with respect to the Mo atoms. Also, the A1g mode is associated with the out-of-plane relative vibration of only S atoms in opposite directions. 20–23 As can be seen, both E1 2g and A1g modes red shifted with the change in synthetic conditions. Furthermore, another Raman peak was observed in MoS2 bulk at 460 cm−1 owing to strong electron-phonon couplings, which arise from a second-order process relating to the longitudinal acoustic phonons at M point (LA(M)). 22 It is worth noting that the position of characteristic peaks directly depended on the number of layers as reported by the literature. 24 According to that, the increase in the layer number led to increase the remarkable difference in frequency (Δω) between two distinct characteristic peaks (E1 2g and A1g modes). Many reports demonstrated that when the frequency difference is approximately 20 cm−1, the MoS2 structure is monolayer. 25,26 As seen in Fig. 1b, the decreasing trend in frequency difference (Δω) at all MoS2 samples was observed, namely from 25 cm−1 in MoS2 bulk to 22 cm−1 in MoS2-2 and MoS2-3 samples. The trend further confirms the change in the number of structural layers closely depended on synthetic conditions. Based on the estimation, the MoS2 bulk and MoS2-1 samples should have more than 4 monolayers of MoS2 due to the Δω of 25 and 26 cm−1, while for MoS2-2 and MoS2-3 samples, Δω is 22 cm–1 for bilayer structure. Furthermore, some reports illustrated that the layer thickness was dependent on the intensity and intensity ratio of E1 2g and A1g modes. 22,27 The upshift of A1g and downshift of E1 2g with the increasing thickness was considered due to the increase in interlayer interactions and dielectric screening of the long-range Coulomb forces. 24 According to that, the peak intensities of E1 2g and A1g modes increased significantly from 1 layer to 2 layers and reached the lowest value at MoS2 bulk. Also, the highest peak intensity ratio between E1 2g and A1g was recorded at 1 layer, and the intensity ratio dropped at 2 layers and MoS2 bulk. Indeed, in this case, the intensity ratio was determined as follows: MoS2-3 (1.74) > MoS2-2 (1.45) > MoS2-1 (1.08) > MoS2 bulk (1.08), indicating the change of synthetic conditions resulting in the difference in intrinsic thickness within MoS2 structure. More interestingly, the shift of characteristic peaks at prepared MoS2 samples also exhibited changes in local electron density, strain, and interfacial interaction. Namely, the E1 2g peaks of all samples red shifted from 387 cm−1 to 391 cm−1 whereas the position of the A1g peak was almost unchanged as shown in Fig. 1b, demonstrating the formation of defect configuration such as S-vacancies via breaking the S–Mo–S bonds as well the equivalent status of local electron densities at basal plane and edge. 28
More evidence of the interaction between prepared MoS2 samples was observed from the obtained results of FT-IR (Fig. 1c). For all the spectra of MoS2 samples, the typical characteristic peak at ∼1622 cm−1 was assigned S–S bonds. 5 Particularly, for MoS2 prepared by various synthetic conditions (MoS2-1, MoS2-2, and MoS2-3 samples), the presence of a new emerging peak around 3400 cm−1 was clearly recorded, suggesting strong stretching vibration of the OH-adsorbed functional groups via interaction between MoS2 samples and water. 5 It is well-known that the hydrophilic group can support to promote the hydrophilicity of materials and enhance contactability with different solvents.
Field-emission scanning electron microscopy (FESEM) image (Fig. 2) clearly revealed the sheet morphology. The average size of the sheets at all as-prepared samples was about 2–4 μm, and obvious distribution can be observed. For bulk MoS2 and MoS2-1 samples, their sheets overlapped or coalesced together to create exfoliated and wrinkled layers. However, for MoS2-2 and MoS2-3 samples, their distribution became more homogeneous and less aggregate, and many sheets were exfoliated effectively. The obtained results further confirmed that the change in the synthetic conditions of MoS2 created remarkable differences in morphology, size, intrinsic thickness, and the formation of defect configuration.
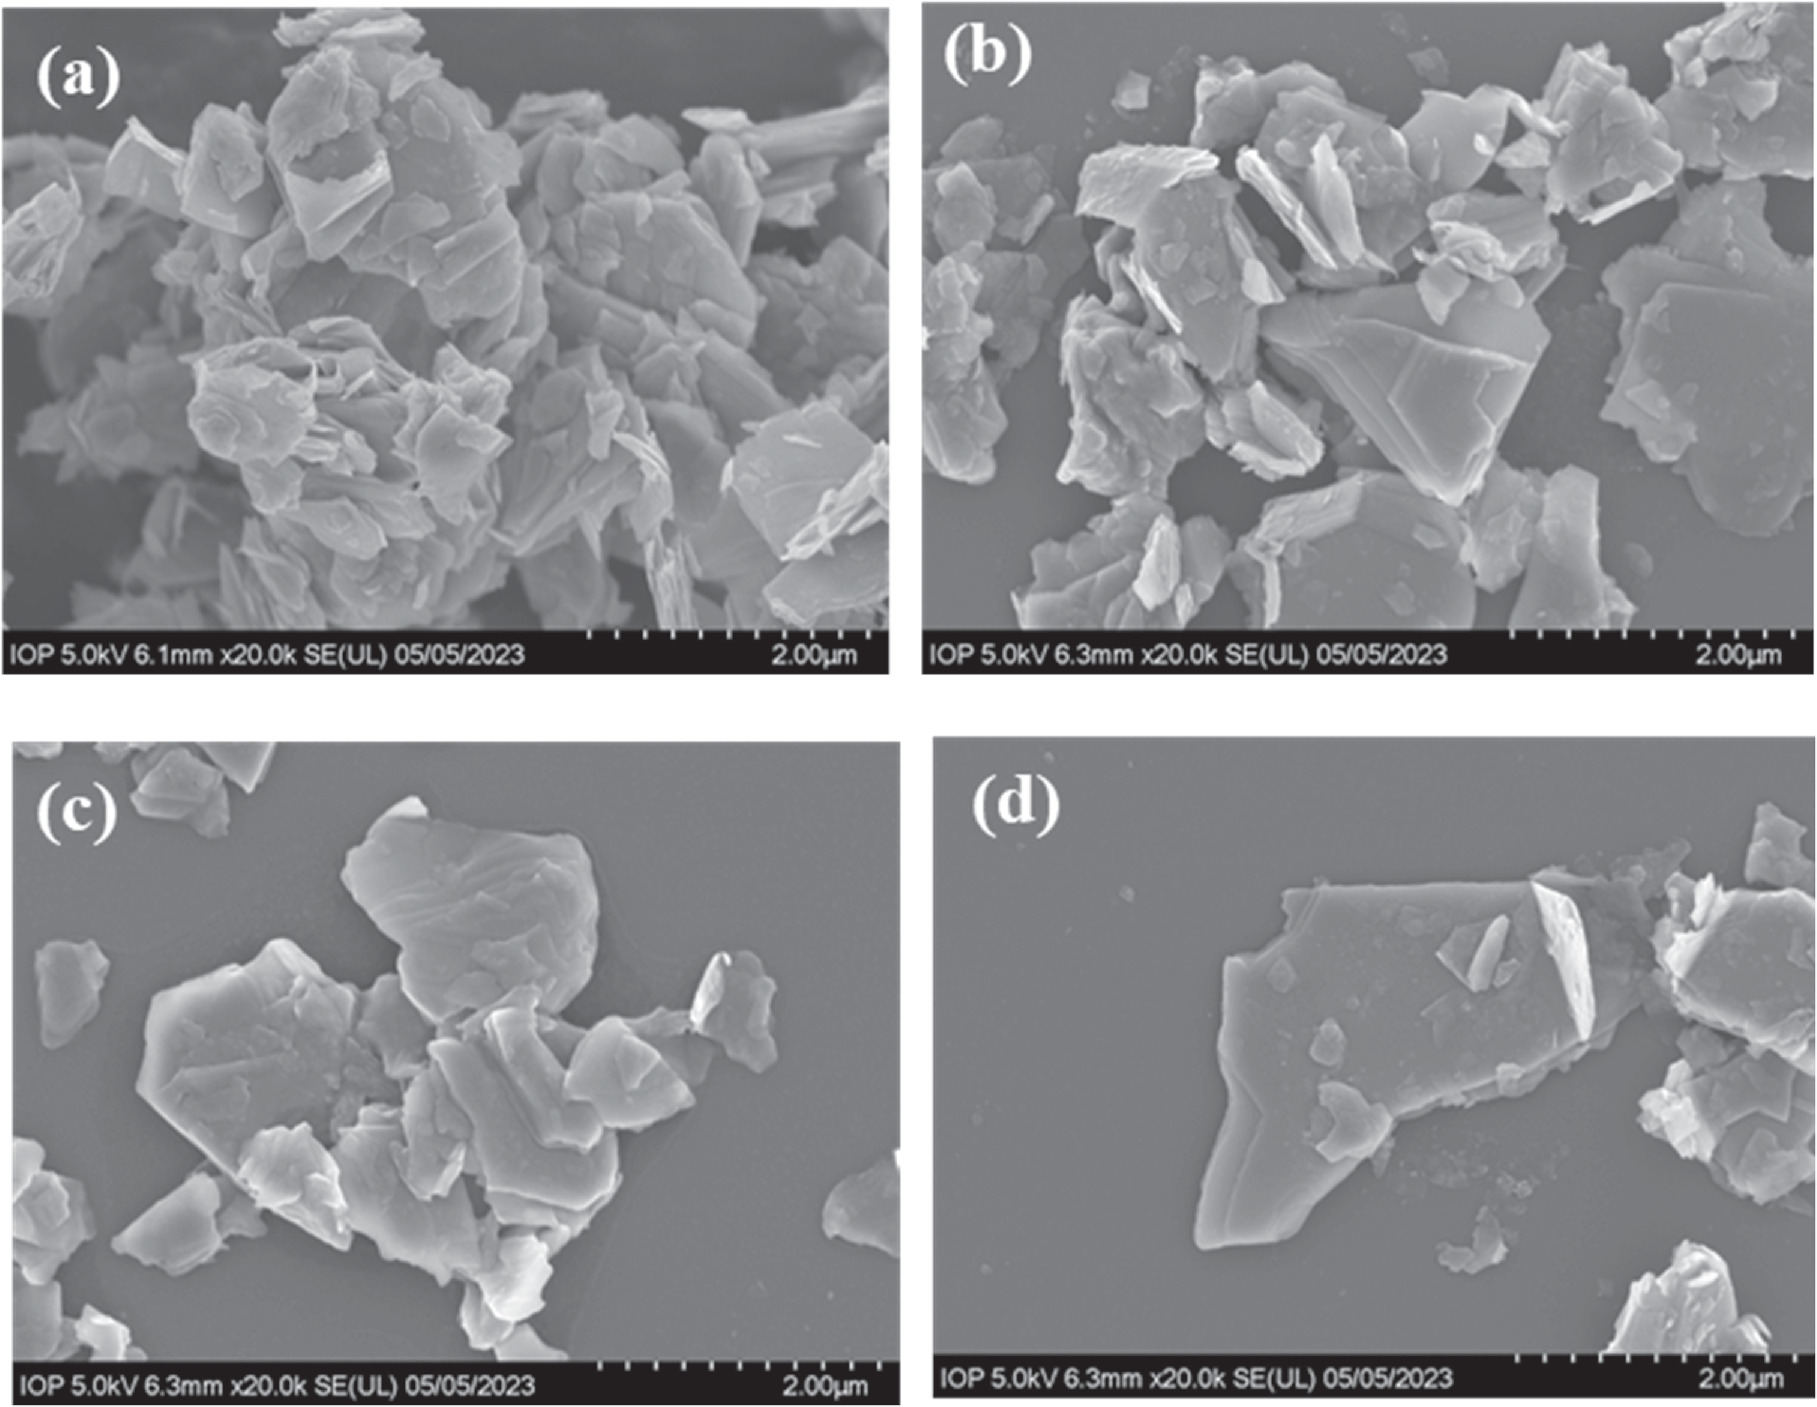
Figure 2. SEM images of MoS2 bulk (a); MoS2-1 (b), MoS2-2 (c), and MoS2-3 samples (d).
Download figure:
Standard image High-resolution imageElectrochemical investigations
The electrochemical properties of the modified electrodes were investigated via CV and EIS measurements using a standard redox probe, [Fe(CN) 6 ] 3−/4− . Figure 3a presents the CV curves of bare SPE and electrodes modified with MoS2 base, MoS2-1, MoS2-2, and MoS2-3 in 0.1 M KCl containing 5 mM [Fe(CN) 6 ] 3−/4− (at a scan rate of 50 mV s−1). All CV curves exhibited a characteristic pair of oxidation/reduction peaks, suggesting to the electron transfer reactions of Fe2+ reversibly into Fe3+ cations. In addition, the current response intensity at each modified electrode was remarkably increased compared with bare SPE. Indeed, the reduction peak currents achieved about 115.7, 134.33, 160.43, 170.39, and 178.16 μA for bare SPE, MoS2 base/SPE, MoS2-1/SPE, MoS2-2/SPE, and MoS2-3/SPE, corresponding to increase of approximately 16.1, 75.9, 86.9, and 95.39%, respectively. Particularly among them, MoS2-3/SPE possessed the highest response current intensity.
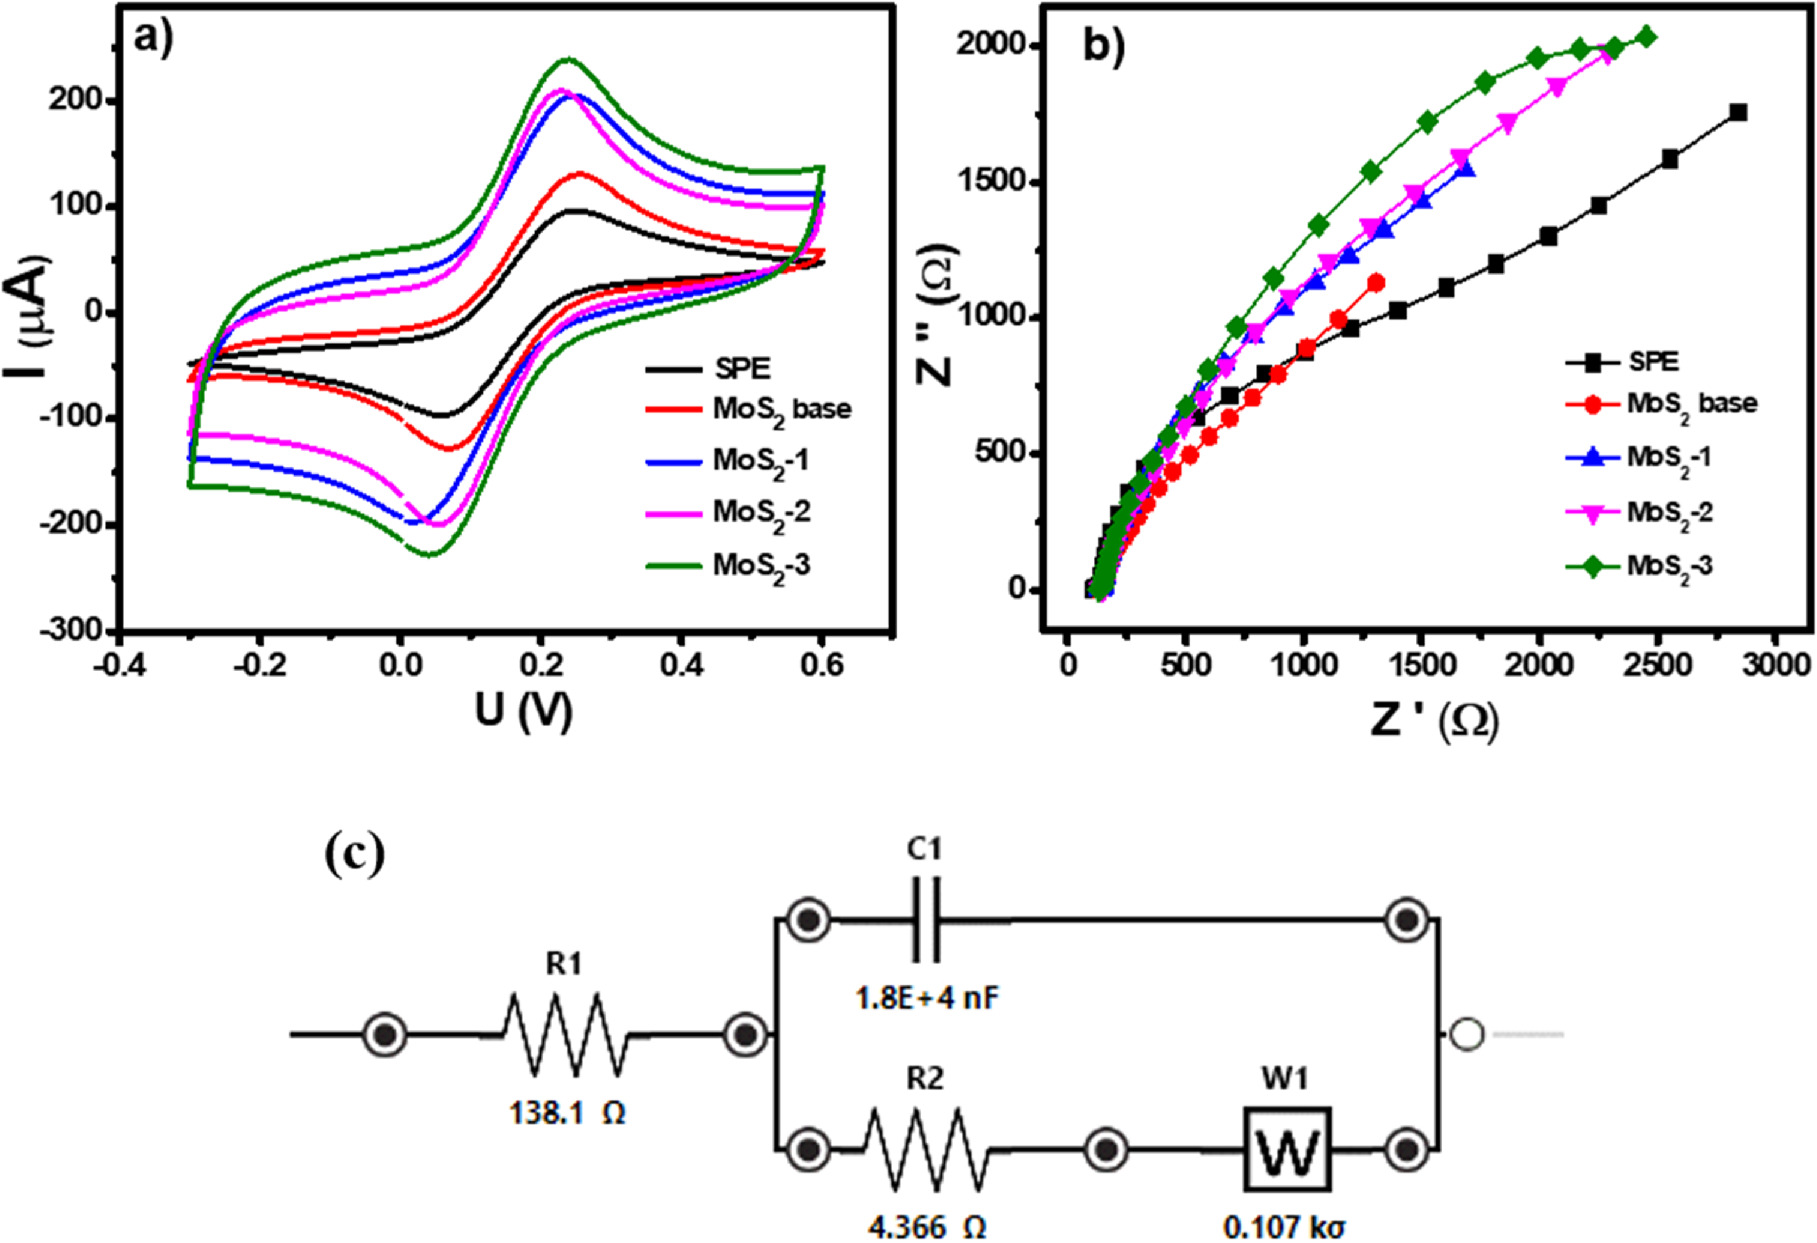
Figure 3. (a) CV curves and (b) EIS profiles obtained from various MoS2-modified electrodes at scan rate of 50 mV s−1 in 0.1 M KCl containing 5 mM [Fe(CN)6]3−/4, and (c): Equivalent circuit of the Randles circuit.
Download figure:
Standard image High-resolution imageEIS measurements were performed to investigate the charge transfer capacity of the modified electrodes. Figure 3b shows the Nyquist plots of SPE, MoS2 base/SPE, MoS2-1/SPE, MoS2-2/SPE, and MoS2-3/SPE in the electrolyte solution of 0.1 M KCl at the frequency range from 50 kHz to 0.01 Hz. For the bare SPE, it possessed the largest semicircle diameter, corresponding to a Rct of 11.25 Ω by fitting well to the Randles circuit as Fig. 3c, by contrast, it reduced to 8.67, 6.63, and 5.05 Ω upon modification with MoS2 base, MoS2-1, MoS2-2, and achieved the lowest value of 4.34 Ω at MoS2-3/SPE, respectively. Obviously, the conductivity of the proposed electrodes was higher remarkably than that of the bare SPE electrode.
In the more detailed study on the change of CV curves at all modified electrodes under various scan rates from 20 to 70 mV s−1 in 0.1 M KCl containing 5 mM [Fe(CN) 6 ] 3−/4− (Figs. 4a–4c') was carried out. Their corresponding linear plots were recorded between peak current (Ip-μA) and sqrt of the scan rate (ν1/2), suggesting the redox reactions onto the electrode surface was a diffusion-controlled process. To study in detail the reason for the enhancement of the current intensity, the electroactive surface area (EASA) value was estimated based on the Randles–Sevick equation:

where Ip is the peak current intensity, n is the number of electrons transferred (n = 1), D is the diffusion coefficient of [Fe(CN)6]3−/4− (D = 6.5 × 10⁻⁶ cm s−1), A is EASA value, ν is the scan rate, and C refers the bulk concentration of redox probe. According to the calculated results, the A value of the proposed electrodes can be improved by the modification of MoS2 as listed in Table I. Among these, the A value of the MoS2-3/SPE was the highest and was 1.6-fold larger than that of the bare SPE. Along with that, the EASA values of MoS2 base/SPE, MoS2-1/SPE, and MoS2-2/SPE also were 1.2-fold, 1.4-fold, and 1.3-fold higher than that of the bare SPE, respectively. Besides, the surface coverage area (θ) value, a measure of how much of the electrode surface is covered by electroactive species, was determined. It is calculated using the formula: θ = (nFAs)/Q, where, θ is a ratio without units, representing the coverage percentage, n is the number of electrons involved in the electrochemical reaction, F is the Faraday constant, As is the electrode's surface area (4 mm diameter for commercial SPEs), Q = ∫IdE is the charge obtained from the cyclic voltammetry curve in Coulombs (C). 29–31 According to that, the θ value was calculated around 0.981, 0.999, and 0.987 for MoS2-1/SPE, MoS2-2/SPE, and MoS2-3/SPE. Clearly, all modified electrodes exhibited high surface coverage area (θ) values (>98% coverage) by modifying with the proposed MoS2 samples. More interestingly, the electron transfer rate constant (ket) was calculated from the Rct and A values obtained as described above:

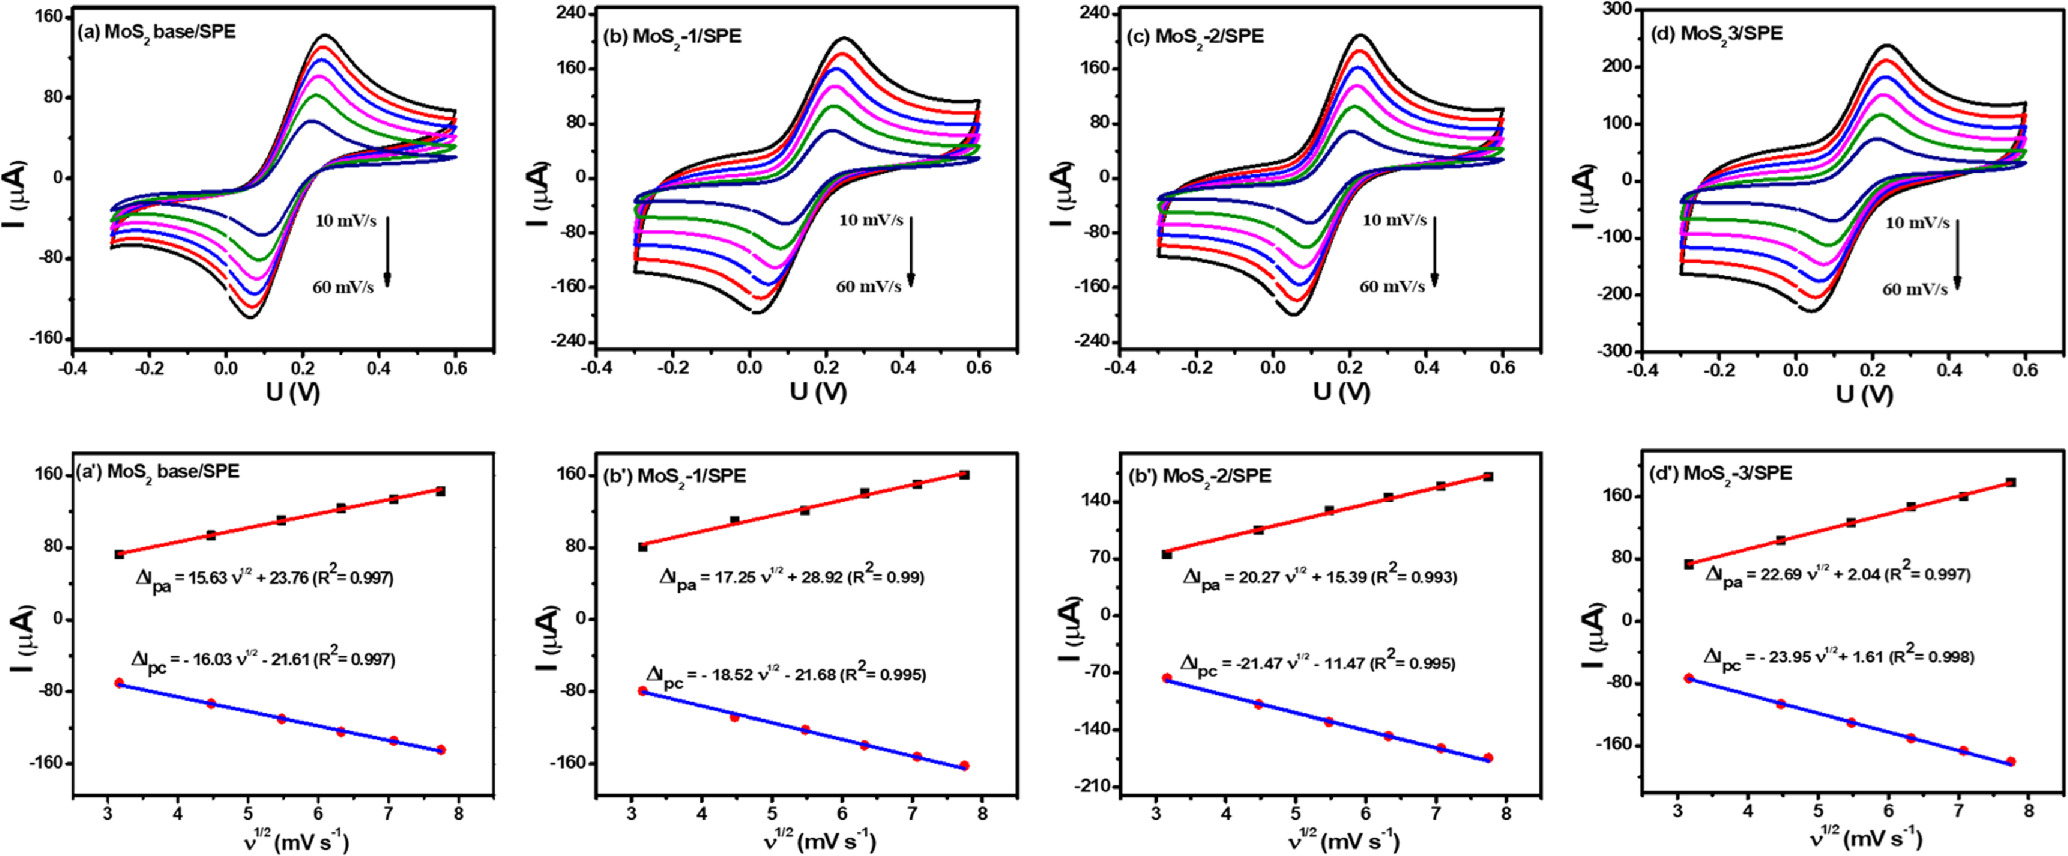
Figure 4. (a)–(d): CV curves of proposed electrodes at various scan rates (20–70 mV s−1) in 0.1 M KCl containing 5 mM [Fe(CN)6]3−/4−; and (a')–(d'): The corresponding linear plots of reduction peak current and the square root (sqrt) of scan rate.
Download figure:
Standard image High-resolution imageTable I. Comparison of kinetic parameters at the redox reactions of K3/K4 probe onto the electrodes modified with different MoS2 samples.
| Electrodes | Ipa(μA) | Rct(Ω) | ket(cm s−1) | EASA (cm2) |
|---|---|---|---|---|
| MoS2 Base/SPE | 134.33 | 8.67 | 0.035 | 0.175 |
| MoS2-1/SPE | 160.43 | 6.63 | 0.038 | 0.21 |
| MoS2-2/SPE | 170.39 | 5.05 | 0.047 | 0.224 |
| MoS2-3/SPE | 178.16 | 4.34 | 0.053 | 0.232 |
| Bare SPE | 115.7 | 11.25 | 0.031 | 0.151 |
The ket values of SPE, MoS2 base/SPE, MoS2-1/SPE, MoS2-2/SPE, and MoS2-3/SPE were calculated as 0.031, 0.035, 0.038, 0.047, and 0.053 cm s−1, respectively. In comparison to the bare SPE electrode, the modified electrodes had an enhanced ket value. This result demonstrated an increase in the reactive electron movement of the redox probe at the electrode/electrolyte interface. Thus, the modification of the electrode surface with MoS2 offered impressive improvements in electrochemical behaviors. As for MoS2-3/SPE, it possessed a considerably higher peak value at a lower potential, along with the highest EASA and ket values in comparison with other modified electrodes. Thus it is expected to be one of the most promising modified electrodes for electrochemical sensing application. To explain these results, some reasons were proposed. Firstly, the enhancement of electrochemical response at the electrode modified with prepared MoS2 samples was considered due to the presence of MoS2 sheets, which provided positive impacts on electronic conductivity, reversible electron transfer, and specific surface area owing to its unique features. Second, the difference in kinetic parameters of redox transfer among modified electrodes arose from the difference in structural characteristics of as-prepared MoS2 samples. Benefiting from a thin layer structure and uniform distribution as well as the formation of defect configuration within layer structure helped the MoS2-3 sample possessing many promising characteristics, which facilitated more effectively the charge transferability at redox reactions, shortened the pathways for electron transfer, increased electroactive surface area and electron conductivity, and enhanced contact with electrolyte solvent.
Electrochemical behaviors of CAP on modified electrodes
The electrochemical behaviors of CAP at the electrodes modified with MoS2-1, MoS2-2, and MoS2-3 in PBS buffer solution (pH 7) were analyzed and evaluated by typical CV curves at 50 mV s−1 (Fig. 5a). As observed, there was no redox peak in the absence of CAP, meanwhile with the presence of CAP molecules in 0.1 M PBS solution, some characteristic cathodic/anodic peak were observed in the potential range from 0 to 1.1 V. CV curves appeared a sharp irreversible reduction peak at about −0.67 V to −0.83 V during cathode scanning, suggesting the irreversible reduction process of −NO2 to hydroxylamine group (−NHOH) occurring toward CAP molecules (as described at Eq. 1).

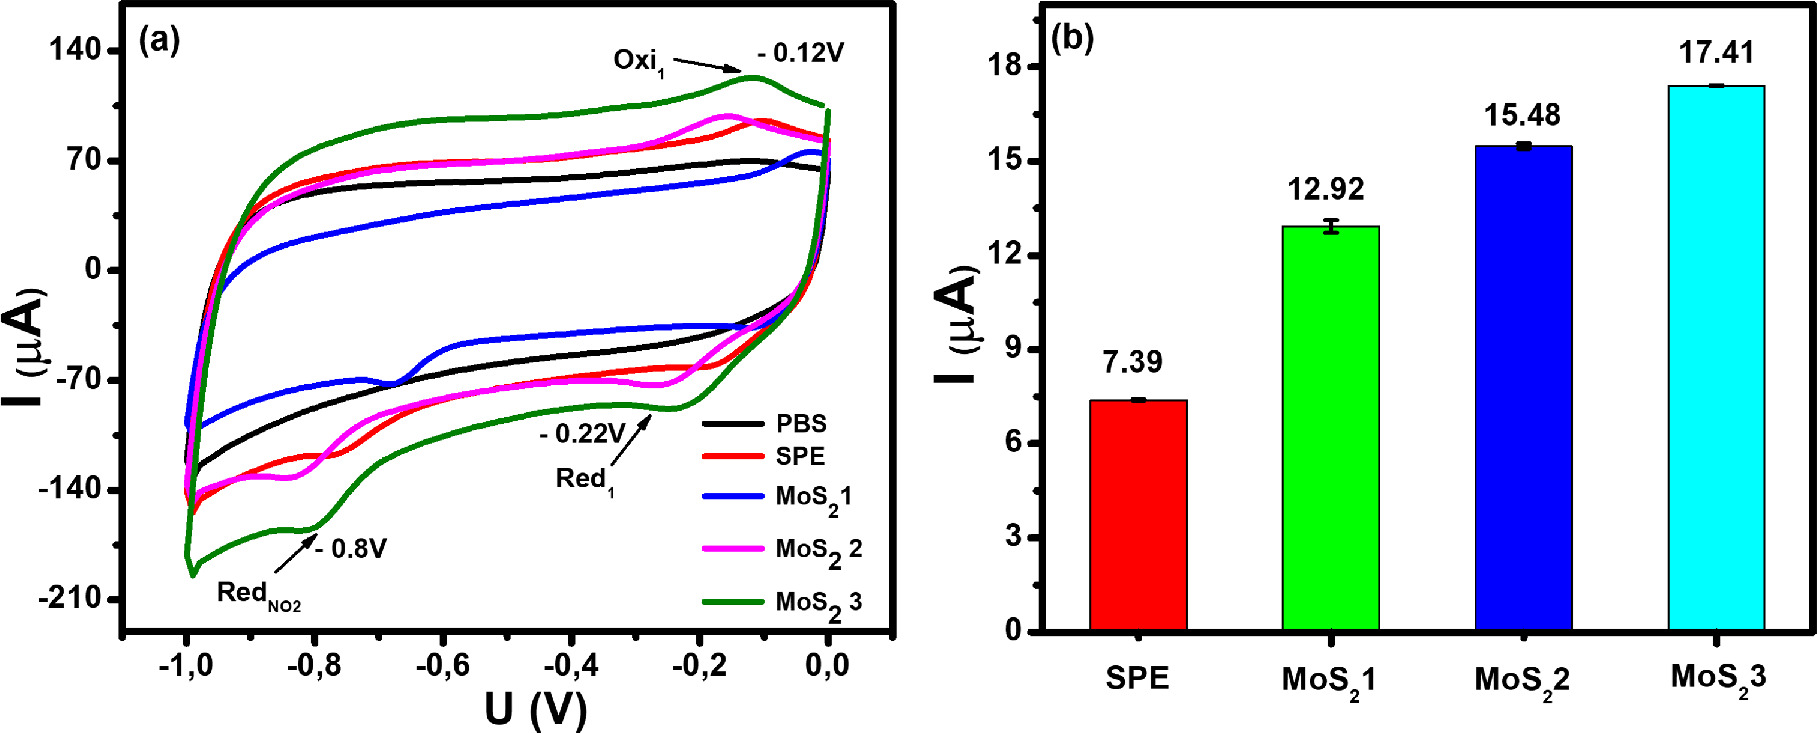
Figure 5. (a): CV curves of bare SPE and electrodes modified with MoS2-1, MoS2-2, and MoS2-3 in 0.1 M PBS (pH 7.0) containing 50 μM CAP and (b): the corresponding bar chart diagram of reduction peak current of CAP. The scan rate is 50 mV s−1.
Download figure:
Standard image High-resolution imageFurthermore, a pair of reversible redox peaks were observed in the potential range of −0.24– −0.18 V, corresponding to the reversible reaction of the −NHOH to nitroso group derivative and vice versa as pointed out in some previous reports (as mentioned in Eqs. 1 and 2), 6,10–12

Clearly, the presence of these peaks was only recorded when the adding CAP molecules were in PBS buffer, the current response of RedNO2 at −0.8 V seemed to be higher and more sensitive than the oxidation current response at −0.12 V and the reduction current response at −0.22 V. Therefore the reduction peak at RedNO2 was employed for the sensitive determination of the existence of CAP molecules in buffer solution. More importantly, the peak potential shift at all proposed electrodes was observed compared to bare SPE. Herein, it is considered due to the difference in conductivity and electron transfer among modified electrodes. In this case, the changes in thin layer structure and uniform distribution, as well as the formation of defect configuration within MoS2-layered structure, also impacted considerably on the charge transferability at redox reactions of CAP molecules, electroactive surface area, and contact ability between electrode and electrolyte. As expected, Fig. 5b shows a bar plot of the irreversible reduction peak response of CAP for all proposed electrodes. The sensitivity of CAP on these electrodes had large differences. Namely, the reduction current response of CAP at MoS2-3/SPE (17.41 μM) was the highest and was 2.4-fold larger than that of the bare SPE (7.39 μM). Also, the reduction peak current at MoS2-2/SPE (15.48 μM) and MoS2-1/SPE (12.92 μM) were 2.1-fold and 1.7-fold higher than that of the bare SPE, respectively. This result matched well the obtained results from the electrochemical studies under the presence of probes, further confirming the strong impact of structural and physical properties on the selectivity and sensitivity of modified electrodes.
To further analyze the kinetic nature of the redox reaction on the electrode surface, the effect of scanning speed on the electrochemical behaviors of CAP at different electrodes was also studied via CV measurements in 0.1 M PBS containing 50 μM CAP. Figure 6 presents the impact of varying scan rates (20–70 mV s−1) on the electrochemical behaviors of CAP. By analyzing the CV obtained in Fig. 6, the reduction current response was increased along with an increase in the scanning speed at all three investigated electrodes. In addition, when the scan rate increased, the reduction peak potentials displayed a slight shift in the more negative direction. This result was explained due to the considerable formation of a diffusion layer on the electrode/electrolyte interface, resulting in the transfer limitation of electron/charge at high scan rates. 6,13 Calibration graphs between peak current response and sweep rate were described with linear regression equations:


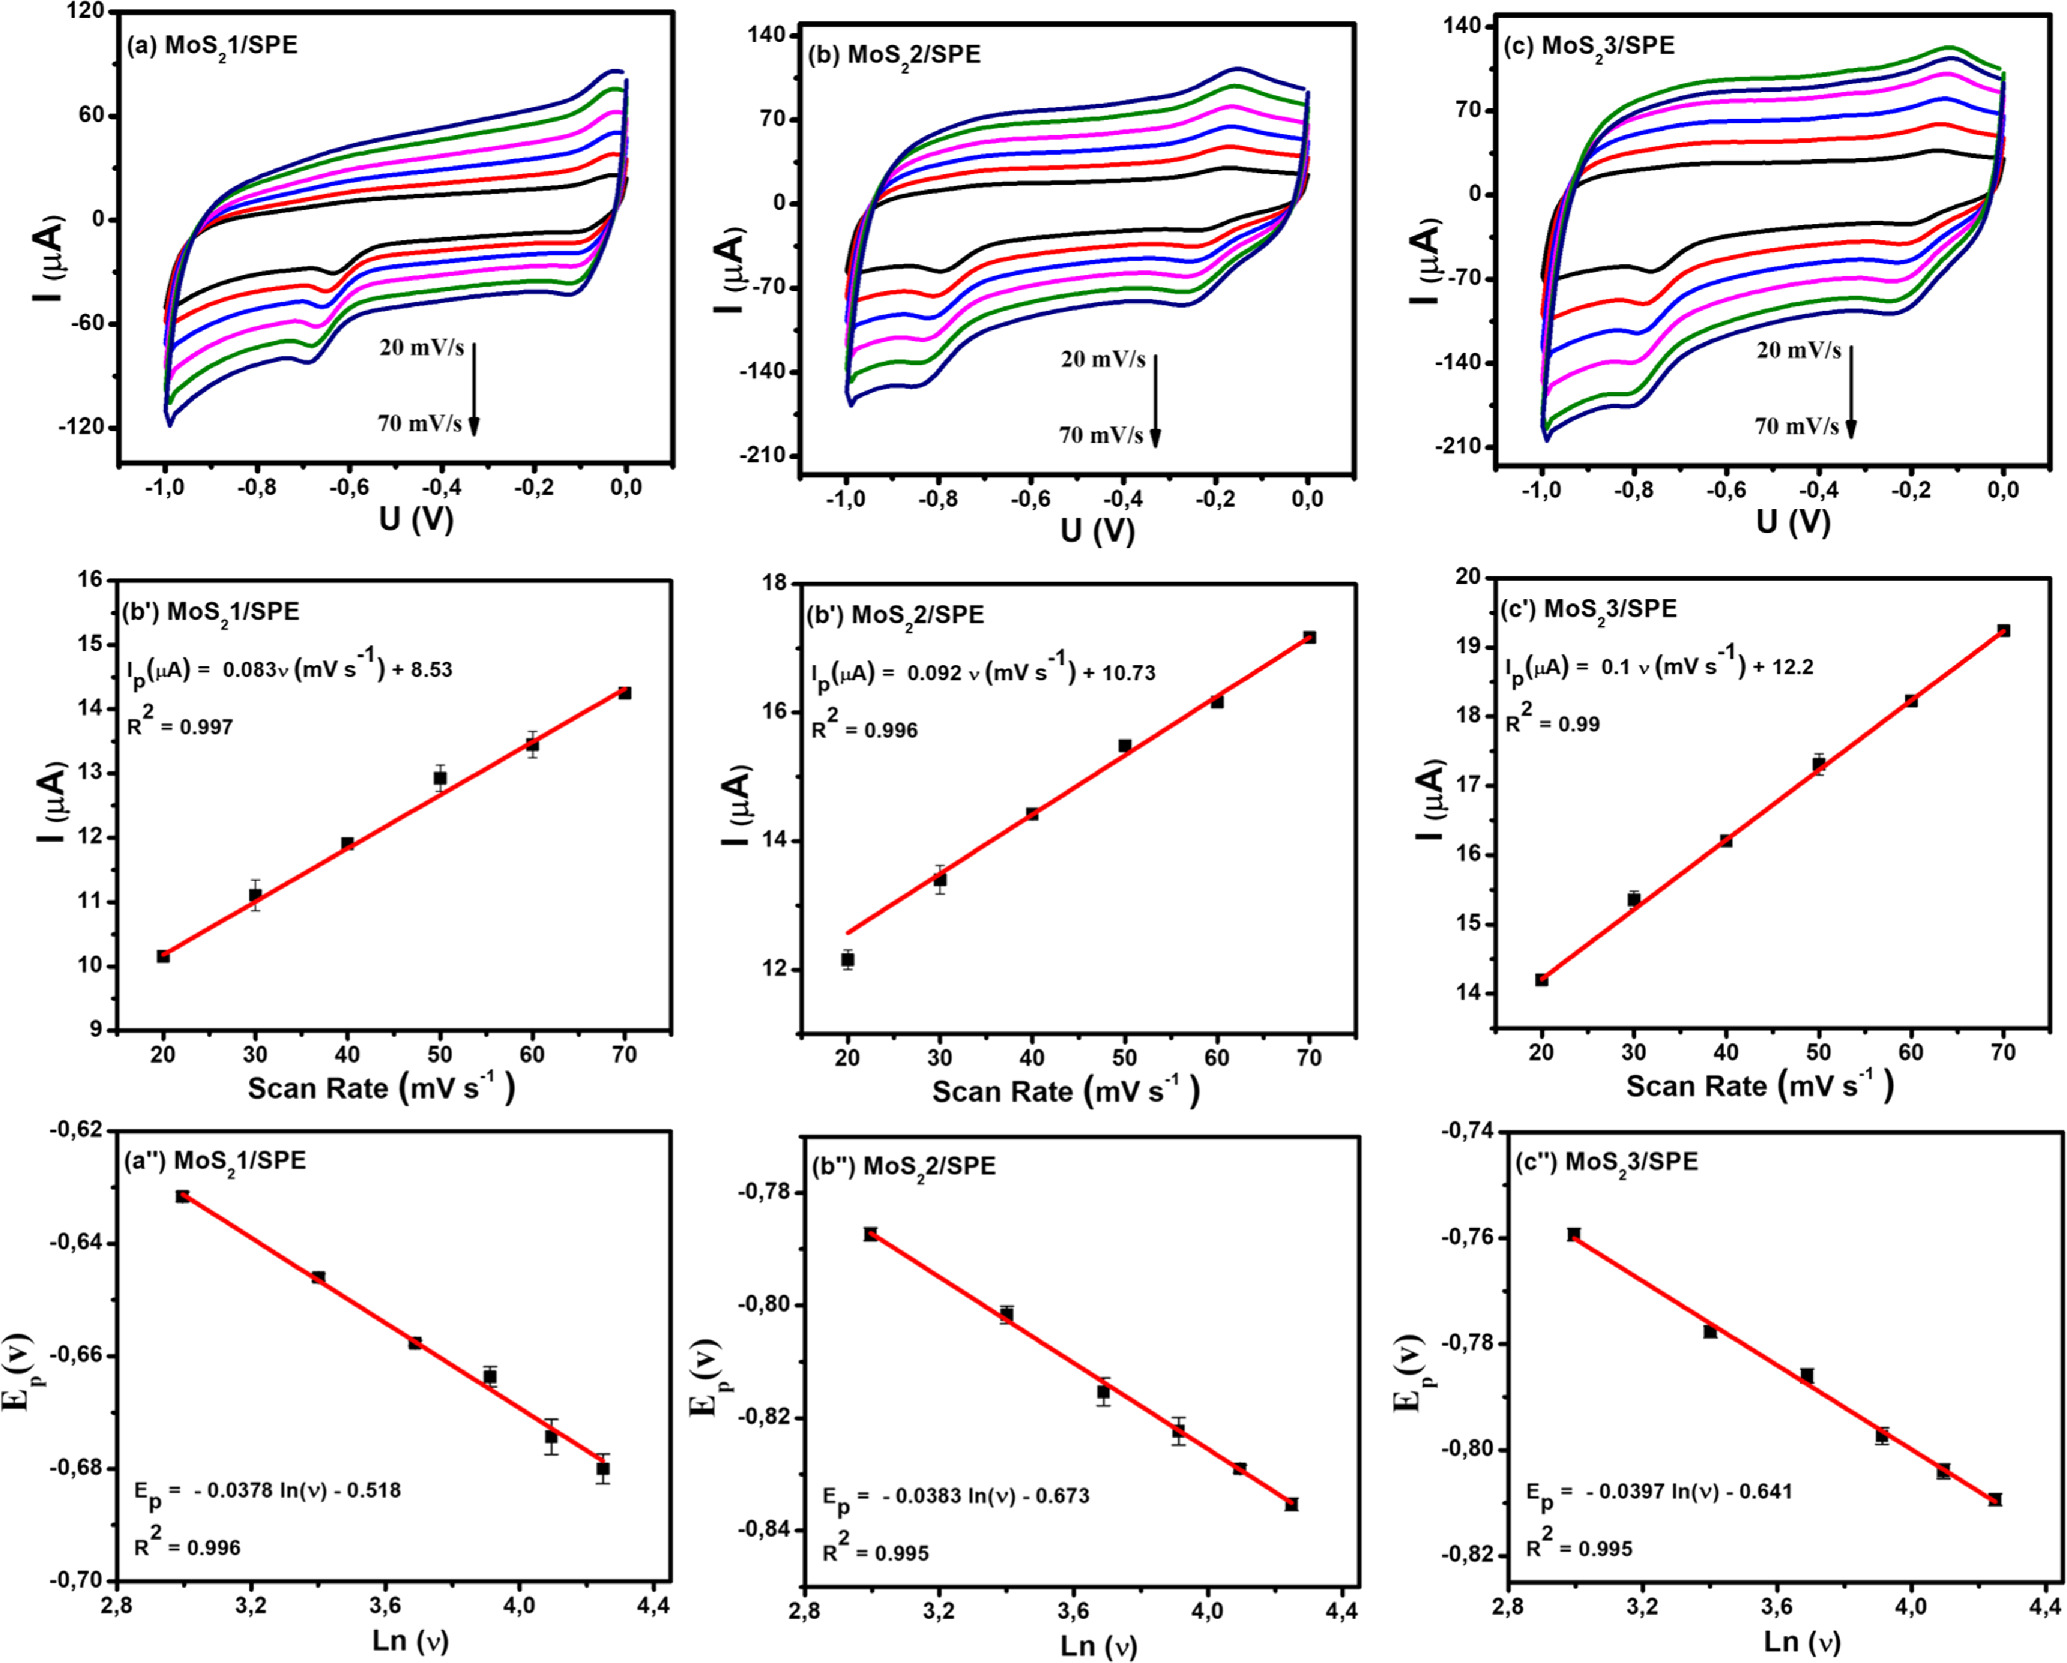
Figure 6. (a)–(c): CVs curves of 50 μM CAP in 0.1 M PBS buffer at different scan rates and different modified SPE, corresponding to the calibration plots with error bars (a')–(c') and (a')–(c').
Download figure:
Standard image High-resolution imageBased on these linear relationships, the adsorption capacity (Г) of CAP on the modified electrode surfaces was also determined through the equation: 4 Ip = n2F2AГν/4RT. According to that, the Г values of CAP were estimated at around 8.02 × 10⁻¹¹, 9.11 × 10⁻¹¹, and 10.04 × 10⁻¹¹ mol cm−2 for MoS2-1/SPE, MoS2-2/SPE, and MoS2-3/SPE, respectively. Clearly, the MoS2-3-modified electrode owned the largest Г value. Besides, the redox peak potential shift of CAP was positive according to a linear relationship with ln(ν), corresponding to the linear regression equations:


According to the Laviron equation: 6,13,14

The kinetic parameters such as the number of electron transfers during the reaction (n) and the charge transfer coefficient (α) were determined from the obtained slope values. Namely, the n value for all modified electrodes was equal to 2, corresponding to α values of 0.368, 0.373, and 0.387 for MoS2-1/SPE, MoS2-2/SPE, and MoS2-3/SPE, respectively. Besides, the electron transfer rate constant (ks) of CAP molecules can be calculated via the following equation: 4,15,32

The ks value was also calculated around 0.983, 1.138, and 1.718 s−1 for MoS2-1/SPE, MoS2-2/SPE, and MoS2-3/SPE, respectively. Herein, MoS2-3/SPE exhibited the largest ks value, demonstrating high electrical conduction and faster electron/charge transfer. More interestingly, CA measurements were performed on the proposed electrodes to observe the difference in diffusibility and electrocatalytic ability at each electrode. In terms of diffusibility, using Cottrell's law, the diffusion coefficient (D) of CAP molecules was calculated via the recorded current.

As described in Fig. 7, the linear relationships between the current intensity (I) and t−1/2 at various CAP concentrations (5–50 μM) were observed. From the obtained slopes and the Cottrell equation, the D value was determined around 2.15 × 10⁻⁸, 5.11 × 10⁻⁸, and 6.15 × 10⁻⁸ cm2 s−1 for MoS2-1/SPE, MoS2-2/SPE, and MoS2-3/SPE, respectively. Furthermore, the Galus method was also used to estimate the catalytic rate constant (kcat) involving the catalytic reduction reactions of CAP at modified electrodes: IC/IL = π1/2(kcatCt)1/2 where IC/IL refers to the catalytic current/limited current in the presence/absence of CAP. From the resulted slopes (Fig. 7), the kcat values were about 1.43 × 10³, 5.49 × 10³, and 8.69 × 10³ M−1 s−1 for MoS2-1/SPE, MoS2-2/SPE, and MoS2-3/SPE, respectively.
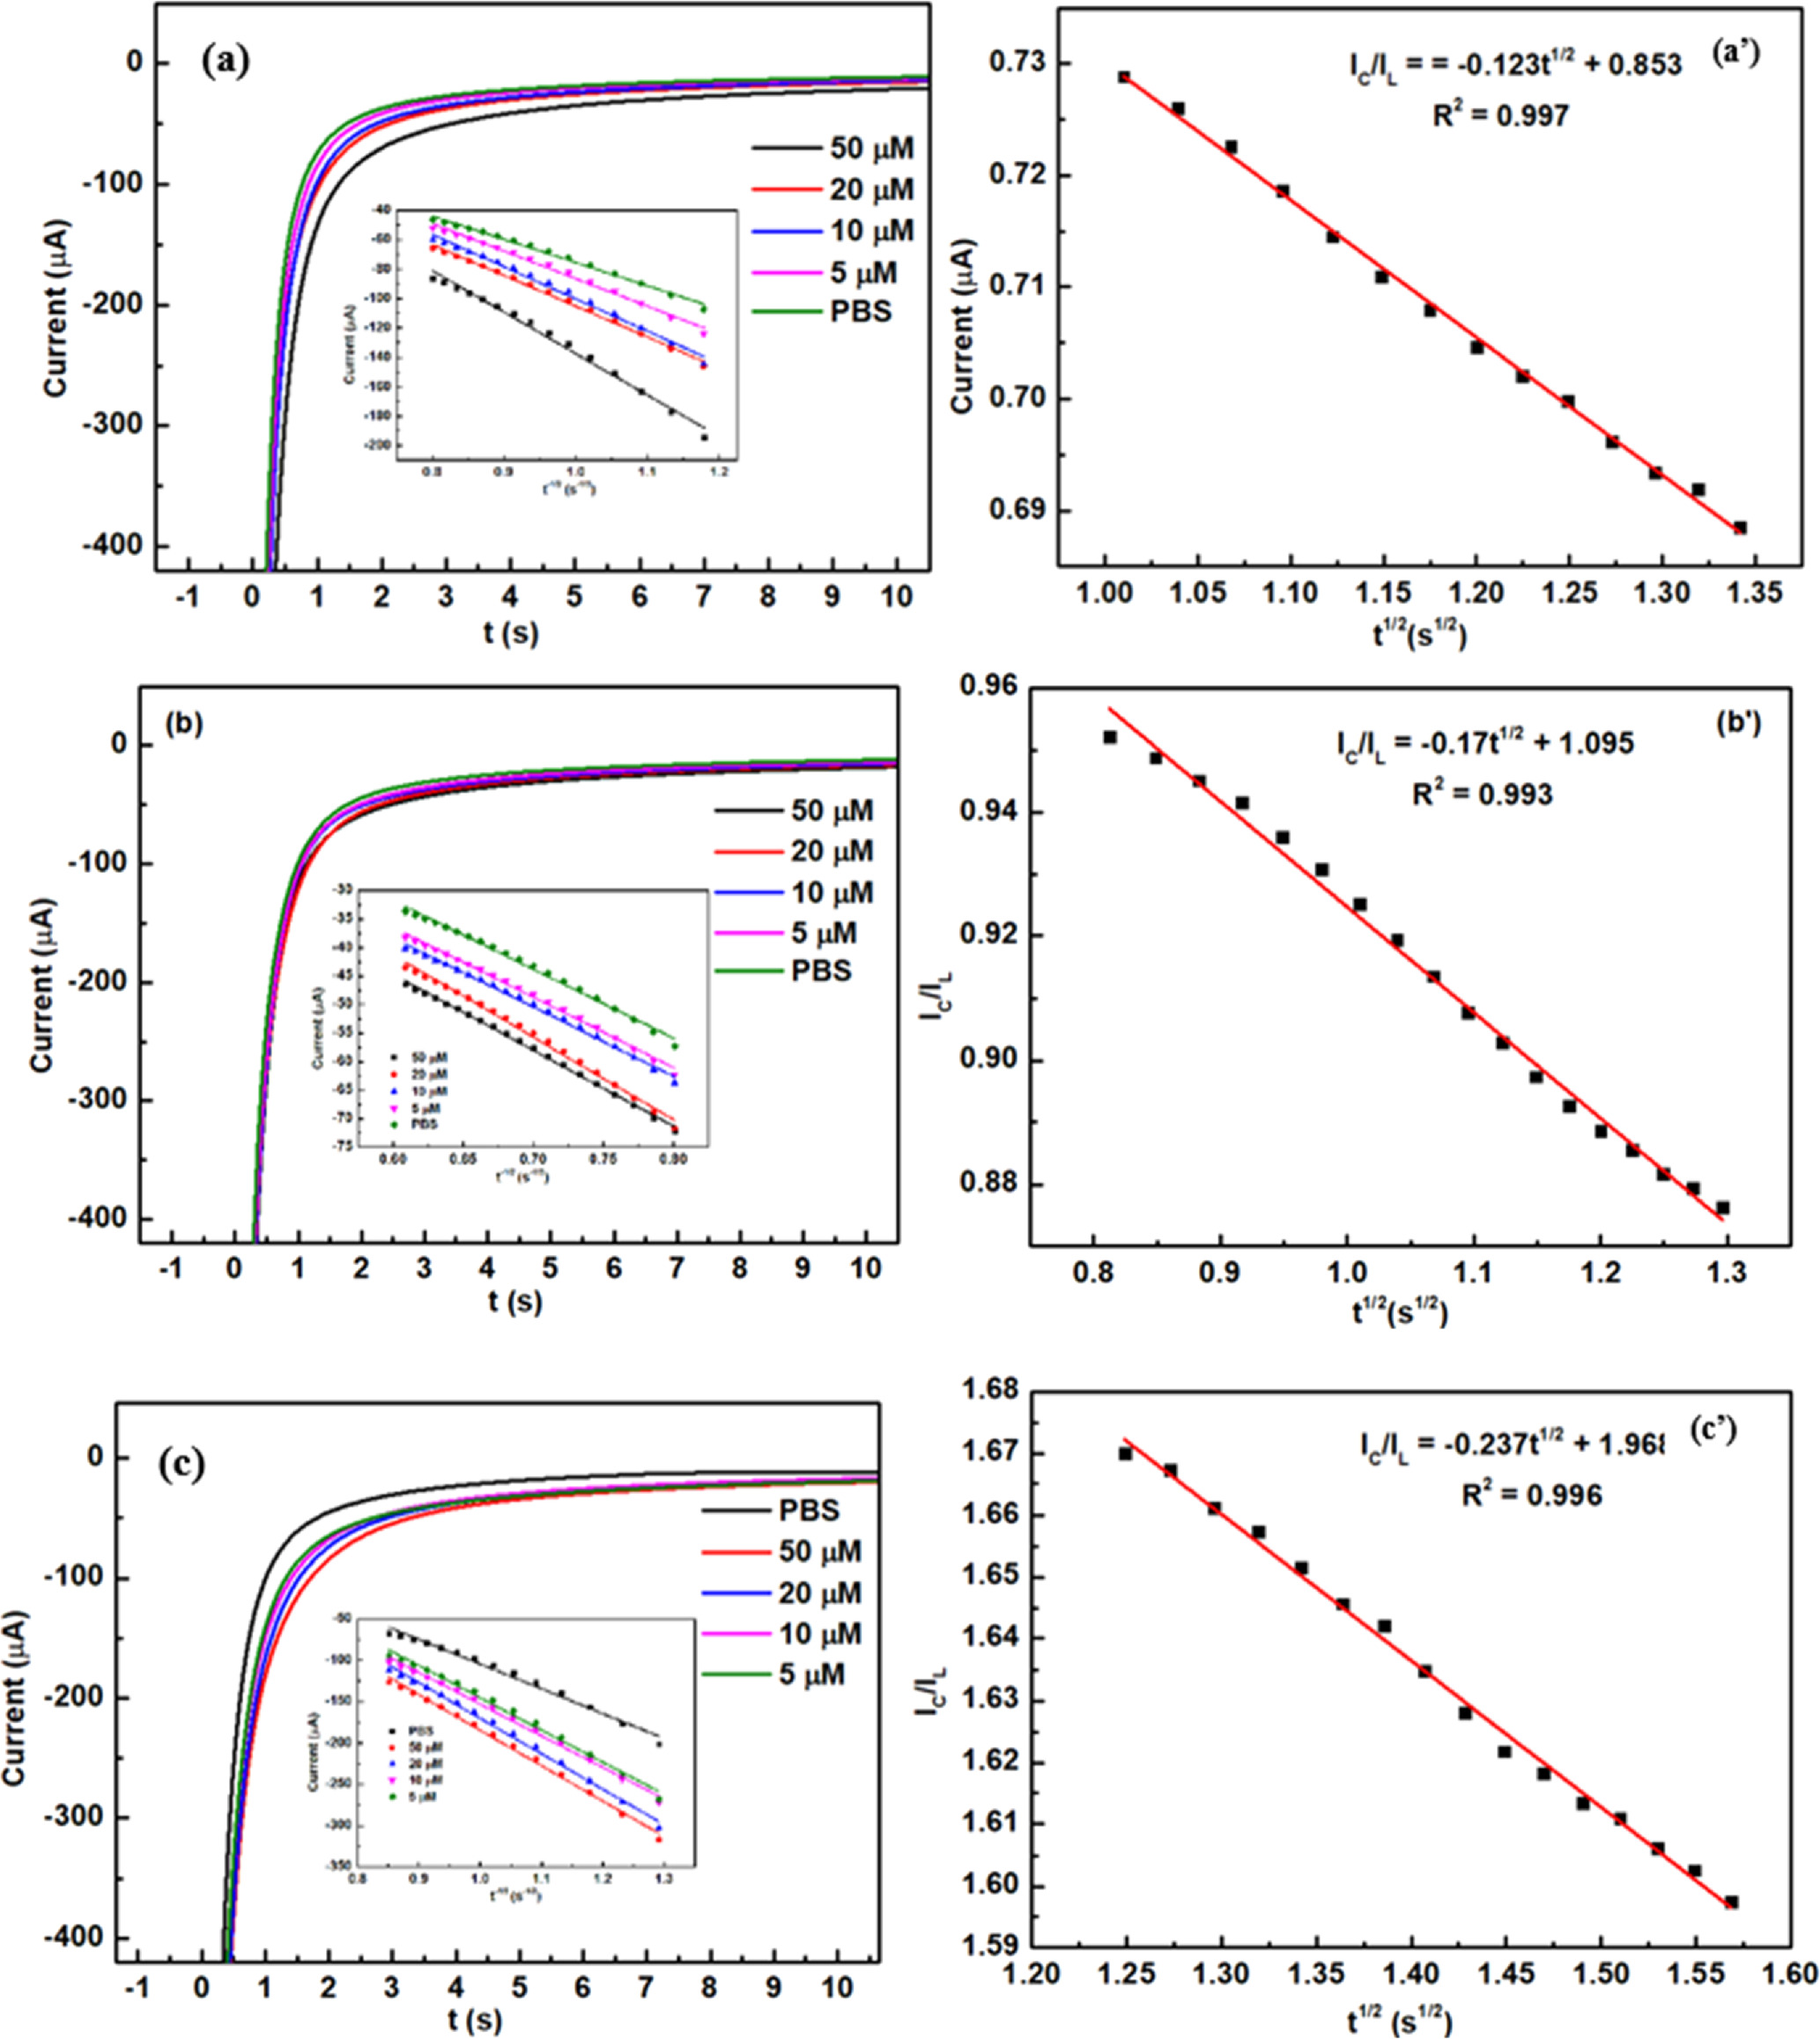
Figure 7. (a)–(c): Chronoamperograms obtained at modified SPEs for different CAP concentrations (5–50 μM) in 0.1 M PBS (pH 7), insert plots of I vs t−1/2; (a')–(c'): Plots of IC/IL vs t1/2.
Download figure:
Standard image High-resolution imageOverall, similar to the observed results from the electrochemical characteristic investigation, the positive influence of electrode modification with as-prepared MoS2 samples on the electrochemical behaviors of CAP was undeniable, furthermore, the difference in electrochemical behaviors of CAP among these modified electrodes was very clear. As expected, using MoS2-3 sample prepared via ultrasonication method for 3 h to modify the electrode surface, it exhibited many positive enhancements in the electrochemical current response, adsorption capacity (Γ), electron transfer rate constant (ks), diffusion coefficient (D), and catalytic rate constant (kcat) for the electrochemical reaction of CAP. Namely, in this case, all parameters at MoS2-3/SPE were higher remarkably compared with other modified electrodes. As seen, in the presence of K3/K4 probes, the increase was recorded mostly in electrical conductivity, charge transfer kinetics, and EASA value at all modified electrodes, however, the increase difference between these electrodes seems to be not clear. While, for adding CAP, the difference among kinetic parameters was very considerable, particularly, for diffusion coefficient (D) and catalytic rate constant (kcat) (Table II). Namely, the electrocatalytic ability and diffusibility for redox reaction of CAP at MoS2-2/SPE were about 3.8 and 2.3-fold higher than that of MoS-1/SPE, while it achieved approximately 6 and 2.9-fold for MoS2-3/SPE. On the basis of the observed results, it can be concluded that the change in the synthetic condition created the MoS2 samples owning different structural characteristics and physicochemical properties, which impacted remarkably the absorption-controlled process for the electron transfer reaction of CAP at modified electrodes. Herein, to justify that the possible impact hypothesis of MoS2 samples could be explained as:
Table II. The comparison of kinetic parameters in redox reactions of CAP molecules at the proposed electrodes.
| Electrodes | MoS2-1/SPE | MoS2-2/SPE | MoS2-3/SPE |
|---|---|---|---|
| Adsorption capacity (Γ) | 8.02 × 10⁻¹¹ | 9.11 × 10⁻¹¹ | 10.04 × 10⁻¹¹ |
| Electron transfer rate constant (ks) | 0.983 | 1.138 | 1.718 |
| Diffusion coefficient (D) | 2.15 × 10⁻⁸ | 5.11 × 10⁻⁸ | 6.15 × 10⁻⁸ |
| Catalytic rate constant (kcat) | 1.43 × 10³ | 5.49 × 10³ | 8.69 × 10³ |
| Linear concentration range | 1–50 | 1–50 | 0.5–50 |
| LOD | 0.21 | 0.12 | 0.1 |
The first reason might be proposed due to the increasing electrical conductivity and faster charge transfer kinetic owing to the unique features of MoS2 materials at modified electrodes similar to the diffusion-controlled process for the redox reactions of K3/K4 probes. The second reason should be noted that the change in the number of structural layers of MoS2 samples led to the positive changes in mass transfer rate, intrinsic thickness, and wettability of the electrode-electrolyte interfaces, as well as intractability and exposure ability between the electrode surface and targeted molecules at modified electrodes. Indeed, thanks to the lower layer number, the electrode modified with the MoS2-3 sample exhibited a higher adsorption capacity and diffusion coefficient compared with that of MoS2-1/SPE and MoS2-2/SPE. On the other hand, the presence of OH-functional groups on the electrode surface seemed to have better reactivity and interaction with CAP molecules, leading to higher adsorption capacity as mentioned in some of our reports. Notably, the outstanding electrocatalytic ability of MoS2-3/SPE was considered due to the abundant formation of defect configuration (S-vacancies) arising from breaking the S–Mo–S bonds as well the equivalent status of local electron densities at basal plane and edge at MoS2-3 sample.
Clearly, for the MoS2 sample, the change in structural characteristics such as layer number, morphology, size, thickness, and distribution just slightly impacted electrochemical behaviors, namely herein, electron transferability, electroactive surface area, and electrical conductivity. In contrast, the formation of defect configuration within the MoS2 structure and its physicochemical properties (wettability, interaction, and exposure ability) could be considered to be one of the most important characteristics, deciding the impressive enhancements of the electrochemical performance of CAP. 33
Electrochemical sensor performance was affected considerably by experimental parameters (pH value and accumulation time), so these parameters have been investigated and optimized. 34 The DPV curves of 50 μM CAP at MoS2-3/SPE with different pH values (3–11) were shown in Fig. S1. As can be observed when the pH changed, there were noticeable changes in both the potential position and peak response. As the pH value of PBS increased, the peak potential of CAP turned negative. More importantly, the peak reduction current of CAP peaked at pH 7.0. Therefore, pH 7 was chosen as the best experimental condition for CAP detection. On the other hand, the DPV measurements at MoS2-3/SPE were measured from 30 to 160 s to determine the optimal accumulation time. The recorded results were illustrated in Fig. S1c. The current intensity increased significantly with an increase in accumulation time and peaked at 120 s, however, it seems to not change after that. Therefore, the optimized accumulation time was 120 s for the subsequent experiments.
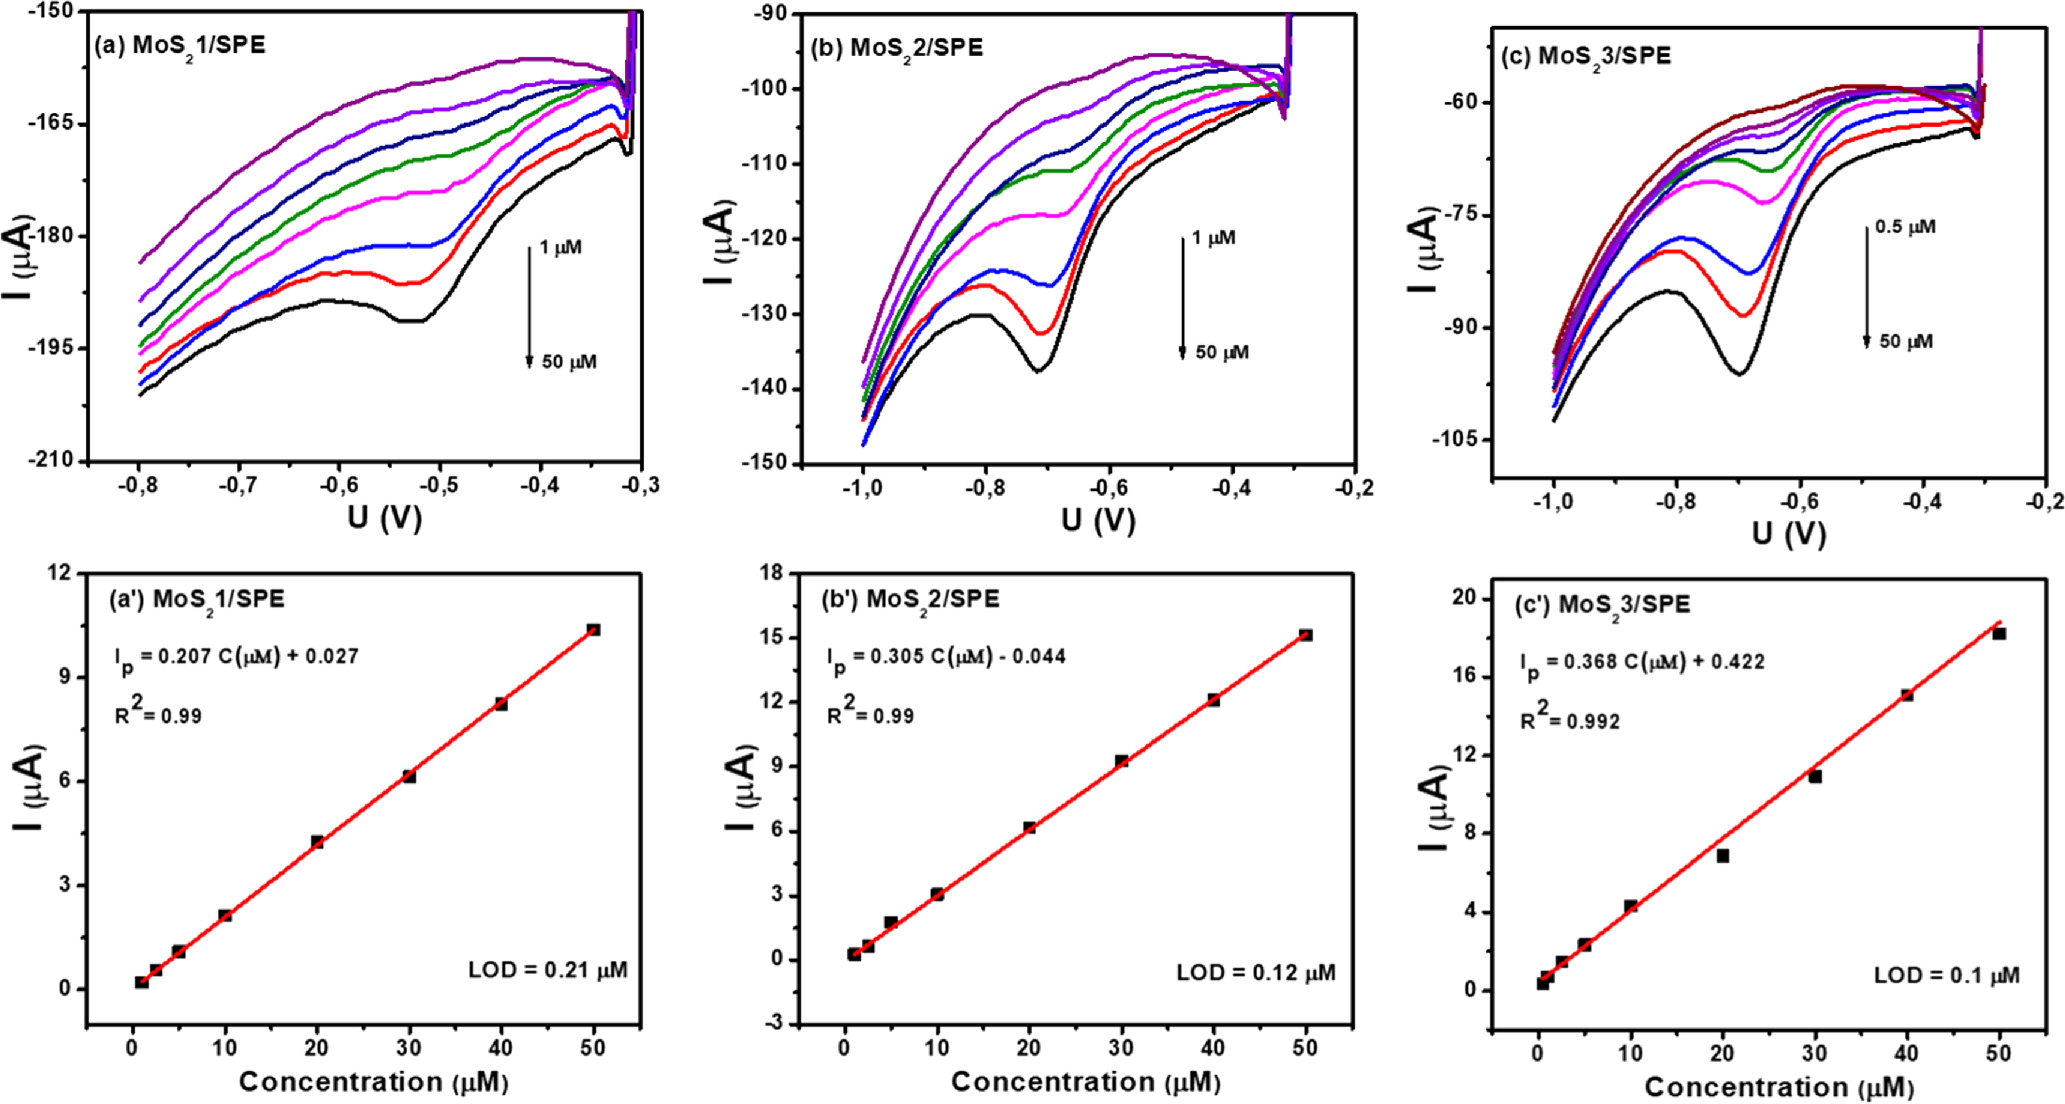
In order to evaluate the efficiency of CAP analysis on different MoS2-modified electrochemical sensors, DPV measurements were carried out. The DPV curves at different CAP concentrations on proposed electrodes, MoS2-1/SPE (a), MoS2-2/SPE (b), and MoS2-3/SPE (c) in 0.1 M PBS (pH 7) under optimal conditions were shown in Fig. 8. The obtained results show that the amperage increases as the CAP concentration increases for all proposed electrodes. The regression equations were as follows: Ip (μA) = 0.207 C(μM) + 0.027 (R2 = 0.99) and Ip (μA) = 0.305 C(μM) + 0.044 (R2 = 0.99) for MoS2-1/SPE, MoS2-2/SPE, in the CAP concentration range of 1–50 μM, respectively. Particularly, for sample MoS2-3/SPE, the linear concentration range was widened from 0.5 to 50 μM, corresponding with a linear regression equation of Ip (μA) = 0.368 C(μM) + 0.422 (R2 = 0.99). According to that, the limit of detection (LOD) was evaluated to be around 0.21, 0.12, and 0.1 μM from the recorded slope values of the above linear regression equations. Furthermore, the electrochemical sensitivity value of the proposed electrodes was determined respectively around 0.986, 1.362, and 1.586 μA. μM−1. cm−2 for MoS2-1/SPE, MoS2-2/SPE, and MoS2-3/SPE. So compared to other electrodes, the MoS2-3/SPE exhibited the highest electrochemical sensitivity.
Figure 8. DPV curves of various concentrations of CAP in 0.1 M PBS (pH 7) at 50 mV s−1 on MoS2-1/SPE (a), MoS2-2/SPE (b), and MoS2-3/SPE (c), corresponding to the calibration plots of peak current intensity vs various concentrations of CAP (a')–(c') with error bar.
Download figure:
Standard image High-resolution image
The proposed electrodes were also observed by recording the change of current intensity for 10 successive times on the same electrode/experimental condition to evaluate the repeatability. Figures S2a–c show the current intensity of CAP of three modified electrodes. The obtained results demonstrated that all proposed electrodes had promising repeatability with low relative standard deviation (RSD) values of 0.667%, 0.659%, and 0.663% for MoS2-1/SPE, MoS2-2/SPE, and MoS2-3/SPE, respectively. Besides, the selectivity of the proposed electrodes in the determination of CAP was evaluated with the addition of several interfering metal ions (such as Fe3+, Ni2+, Cu2+, NO3 −, and SO4 2−) and even organic compounds (urea, D-glucose, and 4-nitrophenol) on the detection of 50 μM CAP. The tested results were shown in Fig. S3. The electrochemical sensors designed in the presence of other natural interferences at 10-fold concentrations can reliably determine CAP. For the determination of CAP in the real sample, the electrochemical performance of MoS2–3/SPE towards the sensitive detection of CAP was carried out on shrimp samples from a local shop. Proceeding to the experiment, firstly, different concentrations of CAP (10, 20, and 40 μM) were added to the prepared shrimp samples and then were analyzed using the DPV technique. The concentration of CAP was calculated according to the regression equation formula of the calibration curves (Table III). The results showed the average recoveries for MoS2–3/SPE were in the range from 93% to 94% corresponding to the relative standard (RSD) within 1.05%–1.35% (n = 3). The calculated results demonstrated the promising practical applicability potential of MoS2–3/SPE for the measurement of CAP in real samples.
Table III. Determination results of CAP in shrimp samples (n = 3).
| Electrode | Amount added (μM) | Amount found (μM) | Recovery (%) | RSD (%) |
|---|---|---|---|---|
| MoS2-3/SPE | 40 | 37.41 | 93.51 | 1.35 |
| 20 | 18.68 | 93.41 | 1.11 | |
| 10 | 9.451 | 94.51 | 1.03 |
Conclusions
In summary, we have successfully synthesized various MoS2 materials for modifying electrode surfaces toward CAP electrochemical detection via a simple ultrasonication method. By varying the ultrasonication time, a series of MoS2 samples with changes in structural characteristics such as layer number, morphology, size, thickness, distribution, as well as, physicochemical properties were observed. Electrochemical measurements demonstrated that the change in structural characteristics such as layer number, morphology, size, thickness, and distribution just slightly impact electrochemical behaviors such as electron transferability, electroactive surface area, and electrical conductivity. In contrast, the formation of defect configuration within the MoS2 structure and its physicochemical properties (wettability, interaction, and exposure ability) played an important role, in deciding the impressive enhancements of the electrochemical performance of CAP. In this case, the MoS2-3 sample with good crystallinity, high purity, low intrinsic thickness, and particularly, a defect-rich structure offered remarkable advances in the modified electrode. Herein, all kinetic parameters involving the redox reaction of CAP at MoS2-3/SPE were significantly increased. Corresponding to that, the linear concentration range was widened from 0.5–50 μM and the limit of detection (LOD) was evaluated to be around 0.1 μM, which was lower than that of modified electrodes.
Acknowledgments
This research was supported in full with Kurita Asia Research Grant (22Pvn015-T5) provided by Kurita Water and Environment Foundation, Japan. The authors would like to acknowledge the support for Raman & Electrochemical measurements from NEB Lab in the Phenikaa University, Vietnam. Declaration of competing interest. The authors declare that they have no known competing financial interests or personal relationships that could have appeared to influence the work reported in this paper.
Supplementary data (0.1 MB DOCX)