

Abstract
The mass transport of oxygen in the cathode catalyst layer of high-temperature proton exchange membrane fuel cells (HT-PEMFCs) has a great impact on cell performance. However, some bulk average methods are unable to study the permeation properties of oxygen near the triple phase boundary of HT-PEMFCs due to the size mismatch. Here, we develop a microelectrode integrated system to quantitatively study the O2 mass transport behavior at the Pt/binder interface under actual operating temperatures (100 °C–180 °C). The oxygen diffusion coefficients and solubility obtain from potential-step chronoamperometry and a modified Cottrell equation follow the diffusion "ball-cage" model and the dual-mode solubility model. Subsequently, molecular dynamics simulations are used to describe the key structural elements and diffusion behavior of oxygen molecules from the microscopic perspective. These results provide a scientific approach to study the mass transfer process of oxygen at the local environment, endowing with insightful strategies for future improvement and applications of HT-PEMFCs.
Highlights
A high temperature microelectrode system for study of HT-PEMFCs was built.
O2 diffusion and permeation properties near the triple phase boundary were characterized.
The mechanisms of O2 mass transfer in the local catalyst layer of HT-PEMFCs were revealed.
Export citation and abstract BibTeX RIS
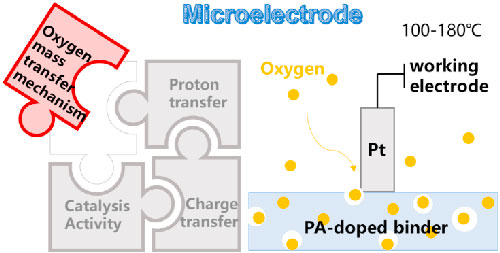
High-temperature proton exchange membrane fuel cells (HT-PEMFCs) have the advantages of fast reaction kinetics, high tolerance to impurities in the fuel, and good thermal and water management. 1,2 The membrane electrode assembly (MEA) consisting of the catalyst layer (CL), HT-PEM and the gas diffusion layer (GDL) is the core of the HT-PEMFC. In the cathode catalyst layer (CCL), the oxygen reduction reaction (ORR) occurs at the triple phase boundaries (a confluence site of oxygen, electrons and protons). 3 To further understand and improve the performance of ORR, advanced characterization techniques and density-functional theory (DFT) calculations have been utilized to understand the catalyst coordination structure and reaction mechanism. 4,5 These advanced techniques have made it possible to improve the activity and stability of ORR through precise structural modulation. 6 However, in practice, in addition to accurate structural modulation of catalysts, rapid delivery of reactants to the reaction sites is also required. 7 In practice, however, in order to participate in ORR at the catalyst (e.g. Pt) surface, oxygen must cross the binder and phosphoric acid (PA) leached from the HT-PEM. 8 Therefore, the mass transfer resistance of oxygen plays an increasing role in the electrode performance. 9,10 An in-depth understanding of the O2 mass transfer process in CCL is important to optimize the cell system.
In recent years, considerable research and development efforts have been devoted to describing the transport process of O2 in HT-PEMFCs. Shamardina et al. 11 developed a pseudo-two-dimensional model to describe the transport process in the cathode catalyst layer (CCL) of HT-PEMFCs and discuss the causes of the poor oxygen and proton transport in the CCL. Jinnouchi et al. 12 used molecular dynamics simulation with the constructed function and parameter to reproduce physical properties dominating the O2 permeation, to clarify the source of the interfacial permeation resistance at Nafion/Pt or gas/Nafion interfaces. Fleige et al. 13 use rotating disk electrode for hydrodynamic chronocoulometric measurements to explore the effect of PA electrolyte concentration and temperature changes on diffusivity and concentration of oxygen at low temperature. Nonoyama et al. 14 studied the diffusive oxygen transfer resistance of CL to quantify the oxygen transfer resistance of PEMFC. However, in general, either essential characteristics of the porous, heterogeneous multicomponent catalyst layers are ignored, or microscopic details are averaged in these analyses due to the mismatch of the size of the testing tool and the microstructure scale of the CL. Therefore, it is still necessary to establish new research methods and tools to study the mass transport of oxygen in CL from the microscopic perspective.
On the other hand, recently there have been considerable advancements in the theoretical study of ion/molecule transport in polymers. For example, the Vogel-Tamman-Fulcher (VTF) relationship describes models of ion transport and polymer chain mobility which have a temperature dependence. 15 Nonetheless, VTF behavior is characteristic of most polymer systems, and therefore, the molecular mass transport mechanism is considered as a similarity. In addition, for the diffusion mechanism model, one unifying molecular mechanism is proposed to correlate transport properties through the concept of free volume and the Cohen-Tumbull models, 16 which relate the diffusion coefficients (D), to free volume and combined with these, the mass transport properties of glassy and rubbery polymers can be successfully predicted. Furthermore, for the dissolution mechanism of gas molecules in polymers, theoretical equations of state, 17 dual-mode model, 18 and statistical methods 19 are mainly described in the literature. Considering the certain common properties of polymer materials, it is reasonable to study the mass transport mechanism of oxygen in the binder of HT-PEMFCs combined with these models or methods. However, it is not difficult to notice that quantitative measurement of oxygen mass transport parameters such as the diffusivity, Henry's constant, and the permeability under real working conditions, is a prerequisite for establishing the oxygen mass transport mechanism model and studying the local mass transfer behavior of oxygen on the surface of platinum particles in the catalyst layer.
Distinguishing from some methods based on bulk average, 13,14 we found that microelectrodes (ME) provide a good method to study the interfacial transient mass transfer phenomena and mechanisms between Pt catalyst particles and ionomers in CL at the microscopic scale. 20 In this method, the solid ion-exchange polymer acts as the electrolyte and the Pt micro-disk electrode acts as the working electrode to obtain higher intrinsic resistance Rs compared to the liquid electrolyte. 21–26 In addition, the concentration of electroactive material in the solid polymer electrolyte does not change significantly during the measurement, which will be beneficial for the signal stability and the following simulations. 22
Here, we integrated a closed microelectrode electrochemical system with electromagnetic shielding, signal amplification, and stable temperature and humidity control. We selected polyethersulfone-polyvinylpyrrolidone (PES-PVP) as a typical binder for verifying the reliability of the microelectrode system. PA-doped PES-PVP, as a polymer with excellent thermal stability and high proton conductivity, has been verified to be promising for use in HT-PEMFC. 27 For the first time, electrochemical information and characteristic parameters of O2 mass transport processes in typical HT-PEMFC binders were successfully obtained in the temperature range of 100 °C–180 °C and low relative humidity. Further, according to the variation trend of diffusion coefficient with temperature, a sphere-cage model is established based on free volume theory to describe the diffusion process of oxygen in PES-PVP binder. In addition, we established a solubility model based on a dual-mode model to classify solubility into internal dissolution and surface adsorption. Through fitting the mass transport parameters with the mathematical model derived from the mechanistic model, molecular dynamics simulation (MD) was used to simulate the mass transport process of oxygen in the binder in order to analyze the interaction between O2 molecules and the polymer. The test system and the theoretical model are expected to guide the direction of future breakthroughs in the development of outperforming the microenvironment of cathode catalyst layers in the field of fuel cells. 28,29 In addition, the microelectrode test system is expected to be expanded to study the microphase environment of more fuel cell electrochemical devices. 30–33
Experimental
Materials
Commercial Polyethersulfone (PES, Mw ≈ 480,000) and Polyethersulfone (PVP, Mw ≈ 1,300,000) of a certain mass ratio (PES:PVP = 4:6) were dissolved in N, N-dimethylformamide (DMF), where the total mass fraction of the polymer was 5 wt%, and then stirred at room temperature for 12 h to obtain a homogeneous solution. The membrane solutions were poured on clean and dry glass plates, and then dried at 70 °C for 24 h to obtain PES-PVP polymer films with a thickness of about 50 μm, as measured by a micrometer.
After that, the prepared PES-PVP-60 film was completely immersed in 85 wt% PA and soaked at room temperature for 12 h. And then the residual PA parts from the solution is removed and pre-treated membrane was placed in a dryer for use.
Construction of high-temperature microelectrode system
In this work, we used the PES-PVP blend membrane as a typical high-temperature proton exchange membrane sample. Detail for the preparation and pretreatment procedures of these membranes are described in the support information. Below, we briefly describe the microelectrode system working in the condition of high temperature and low humidity, a series of electrochemical methods combined with the Cottrell equation to obtain the O2 mass transport coefficients in the PES-PVP binder, and the mathematical models and molecular dynamics simulations to explore the process of O2 mass transport and O2 diffusion dissolution mechanism in binders at micro-scale.
Microelectrode preparation
In this study, a Pt disk microelectrode with a diameter of 25 μm is prepared and sealed in a glass holder. 21–26 The details were explained in the supporting information. The surface of the Pt disk microelectrode is proved to be smooth and defectless by a metallographic microscope. As shown in Fig. S1, the microelectrode is in a good response state from CV measurement in a three-electrode system. 21–26
Microelectrode cell and chamber design
A schematic diagram of the microelectrode electrochemical system used in this study is shown in Fig. 1. In this microelectrode system, a 25 μm diameter platinum disk microelectrode polished with alumina compound is used as the working electrode (WE, Fig. 1a). Figure 1b shows the schematic diagram of the device assembly. A 22 mm*22 mm single-sided polished Pt plate is used as the counter electrode (CE) and the pseudo reference electrode (RE). A 20 mm*20 mm PA-doped PES-PVP hybrid film is tightly attached to the polished side of the Pt plate as an electrolyte. Two stainless steel plates are clamped uniformly between the membrane and the CE by screws on the four corners, and a layer of insulating tape is applied to both surfaces to prevent short circuits. The microelectrodes are supported by hollow glass tubes bolted to the stainless steel base 1 and pressed tightly against the membrane by compression springs to reduce contact resistance at the interface. The base-integrated system is placed in an enclosed environmental chamber surrounded by an electromagnetically shielded box to ensure signal stability (Fig. 1c). Details of the temperature and environmental control procedures are described in the supporting information.

Figure 1. (a) Schematic diagram of microelectrodes. (b) Schematic diagram of test device assembly. (a)Schematic diagram of the high-temperature ultra-microelectrode electrochemical system,1 - stainless steel base; 2 - microelectrode fixed plate; 3 - Microelectrode; 4 - stainless steel plates; 5 - PES-PVP blend member; 6 - platinum plate; 7 - temperature sensor; 8 - stainless steel plates; 9 - environment chamber; 10 – electromagnetic shielding case.
Download figure:
Standard image High-resolution imageTheories
"Sphere-cage" diffusion model. In order to explain some characteristics of diffusion of oxygen molecules in the binder, the sphere-cage diffusion model is established and combined with the Cohen-Turnbull model based on free volume theory. Normally, polymer molecules crosslink with each other to form a "cage," in which the gas molecules can be regarded as the hard sphere and confined to a cage with the gas kinetic velocity u. In this system, and molecular diffusion is achieved by migration between adjacent "cages." According to the Ref. ,34 by analogy to random walk in one dimension, the probability of the molecule moving to a region can be expressed as from Eqs. S3–1 to S3–9, and then the diffusion coefficient is expressed by comparing Eqs. S3–9 and Eqs. S3–10 in the following form through mathematical statistics and see support information for the specific derivation process:

Where D is the gas diffusion coefficient, n is the migration frequency, l is the distance between the "cages." To calculate the migration frequency n, it is assumed that the molecular migration process must cross the free energy barrier, and the absolute rate theory is combined to obtain the following relation

Where k is the Boltzmann constant, h is the Planck constant, ∆G is the barrier through which molecules spread from one cage to another. Since the Gibbs free energy ∆G is relative to the temperature

Combined with the above equations, diffusion coefficient D could meet the following relationship.

Where 


The sphere-cage diffusion model and the formula derived above consider the diffusion process of gas molecules in polymer from the microscopic point of view and evaluates the diffusion process by analyzing the effect of temperature on the energy barrier between cages.
Dual-mode solubility model
In order to analyze and describe the dissolution of gas molecules in the binder, a solubility model is established based on the dual-mode model, which describes the dissolution as Henry's law part and a Langmuir part. 17,18,35 The dual-mode model can be expressed as follows.

Where C is the total gas solubility in the binder, kd is effective Henry's law solubility constant, CH is the hole saturation constant, b is the hole affinity constant, and p is the gas pressure.
Based on Eq. 5 and relevant literature, 17,18 the parameters (kd, CH, b) in Eq. 5 are transformed into temperature-related functions, as shown in Eq. 6 to Eq. 8.


Substituting Eqs. 6, 7 and 8 into Eq. 5, the following equation is obtained:
Then, in order to simplify the equation, independent variable temperature T is separated by Taylor expansion (from Eqs. S3–12 to S3–25) and the coefficient of the k term  can be expressed in the following form.
Since  is always negative and
  is always positive, and the absolute of
  and
and  for O2 is 10∼20 kJ mol−1,
36
it can be considered in the experimental temperature range
for O2 is 10∼20 kJ mol−1,
36
it can be considered in the experimental temperature range


At the same time, for the power series terms of the coefficients 

 ignoring the numbers after the fourth term, the original expression can bexpressed as follows

In this formula, a, b, c, d are parameters independent of temperature and the specific expression of these parameters can be seen in support information (from Eqs. S3–26 to S-32). The simplified dual-mode model is established based on the dual-mode model to analyze and describe the O2 dissolution process, and the mechanism of O2 dissolution process is analyzed by fitting O2 solubility data obtained from microelectrode measurements with the simplified dual-mode model.
Molecular dynamics simulation
In order to further study the diffusion behavior of oxygen molecules in PES-PVP binder from the molecular scale, molecular dynamics (MD) simulation is performed. According to the experimental design, the simulation box consisting of oxygen, PA and PES-PVP polymer materials is constructed. Consistent of the experimental conditions, the polymerization degree of PES and PVP in the system is 50 and 264, respectively, and the box contains 5 PES polymer chains and 3 PVP polymer chains, and the mass ratio of PVP is 60 wt%. The doping ratio of PA is estimated by 6.7 mol PA/mol PVP monomer, with a total of 5306 PA molecules. In this system, the number of oxygen molecules is 100, and the total atom is 59680. The initial structure of the simulated box is optimized and relaxed by NPT simulation for 1∼2 ns. Then the system under the specified temperature and pressure using NPT simulation was maintained for 5 ns. The system energy, radial distribution function (RDF,  ) and mean square displacement (MSD, 〈
 〉) are calculated during 5 ns MD trajectory. Diffusion coefficient D can be obtained by the following formula:

Where  is the position vector of the atom at time t; 〈
 〉 means sthe tatistical average of the physical quantities in brackets;
  is the pore parameter, which is a correction related to the porosity of the polymer film and the degree of pore channel bending. The time step of all-atom simulations is 1 fs. All the simulations are carried out at standard atmospheric pressure. In the all-atom simulation, the van der Waals interaction is truncated at 1.2 nm and tail correction is added, and the particle-particle particle-mesh (PPPM) method is used to calculate the electrostatic Coulomb interaction.
37,38
Nosé–Hoover method is used to control temperature and pressure.
39,40
Direct Force Field (DFF) software is used to build the initial structure, LAMMPS code is used for molecular dynamics simulation, and VMD software is used for visualization of simulation results.
is the pore parameter, which is a correction related to the porosity of the polymer film and the degree of pore channel bending. The time step of all-atom simulations is 1 fs. All the simulations are carried out at standard atmospheric pressure. In the all-atom simulation, the van der Waals interaction is truncated at 1.2 nm and tail correction is added, and the particle-particle particle-mesh (PPPM) method is used to calculate the electrostatic Coulomb interaction.
37,38
Nosé–Hoover method is used to control temperature and pressure.
39,40
Direct Force Field (DFF) software is used to build the initial structure, LAMMPS code is used for molecular dynamics simulation, and VMD software is used for visualization of simulation results.
Results and Discussion
Microelectrode measurement at high temperature and low humidity was conducted on PES-PVP-60 blend membrane samples. Representative CVs obtained for the PA-doped PVP-PES-60 blend membrane at 100 °C and 2% RH are shown in Fig. 2a. A typical CV profile was obtained in Ar atmosphere for a scan rate of 250 mV s−1. The SCV curve was divided into three regions, including hydrogen adsorption/desorption (−0.6 V∼−0.4 V), double layer (−0.4 V∼0.6 V) and oxide species formation/reduction (0.6 V∼0.8 V), represents in good condition and interface of polycrystalline Pt/acidic medium. In contrast, the CV curves measured in oxygen atmosphere show a clear reduction peak in the range of −0.3–0.3 V vs Pt. This corresponds to the ORR process occurring on the surface of the Pt disk microelectrode by O2 dissolved in the PES-PVP-60 binder. The typical CV curves for 120 °C–180 °C all show similar characteristic peaks (Figs. S3Ba–S6a).

Figure 2. Electrochemical test results of the saturated PA doped PES-PVP-60 binder under 100 °C. (a) Cyclic voltammetry curves obtained in Ar and O2 atmospheres. (b) Potential-step chronoamperometry curves with a constant initial potential Vi = 0.65 V and the final potential Vf from 0.4 V to −0.6 V with the interval of 25 mV in O2 atmosphere. (c) Sampled-current voltammograms obtained by potential-step chronoamperometry curves. The three regions are highlighted to represents the different processes that occur at a particular potential. (d) Fitting plots of I-t−0.5 with modified Cottrell equation.
Download figure:
Standard image High-resolution imageNext, starting from the initial potential constant (Vi = 0.65 V), a potential-step chronoamperometry (CA) measurement was performed in the O2 condition with a −25 mV increment for each final potential point from 0.4 V to −0.6 V. Representative I-t curves obtained for the PES-PVP-60 binder at 100 °C and <5% RH at different final potentials are shown in Fig. 2b. All the I-t curves show a similar exponential decay trend and gradually reach a steady state with the increase of time, indicating that the O2 mass diffusion control region is reached at the electrode surface.
Then, a representative SCV curve was derived from Fig. 2b and shown in Fig. 2c. The SCV curve can be divided into three regions including the kinetic or mixed kinetic/diffusion-control regime, a diffusion-control regime and H2 adsorption regime. All have similar patterns at 120 °C–180 °C (Figs. S3Bc–S6c). As compared to our previous microelectrode work at low temperature and high humidity, 20 the potential range of the diffusion control regime becomes larger, indicating that temperature will affect the O2 mass transport in the binder.
The I-t curves selected in the O2 mass-transport-limited regime are converted into the form of I-t−0.5. Then, linear regression fitting was performed according to the modified Cottrell equation, as shown in Fig. 2d, S3Bd–S6d. 41,42

Where n represents the number of electrons transferred during the ORR process on Pt microelectrode surface (n = 4), F is Faraday's constant (96,485 C mol−1), A is the electrochemically active surface area (ECSA) of the WE (2.4191 × 10⁻⁵ cm2, from Eqs. S2–1 to S2–3, Fig. S2), DO2 is the O2 diffusion coefficient (cm2 s−1), CO2 is the O2 solubility (mol cm−1), t is time (s), and r is the effective radius of the microelectrode (cm) derived from the ECSA. 25
Over a short-time domain, satisfied the relationship  where
where  a plot of I vs t−0.5 is linear.
25,42
The DO2 and CO2 in the binder are calculated by substituting the slope m and intercept b of the I-t−0.5 plot into Eqs. 16 and 17:
a plot of I vs t−0.5 is linear.
25,42
The DO2 and CO2 in the binder are calculated by substituting the slope m and intercept b of the I-t−0.5 plot into Eqs. 16 and 17:


With the same method, the DO2 and CO2 in the binder at 120 °C, 140 °C, 160 °C and 180 °C are calculated respectively, and the corresponding I-t−0.5 plots are shown in Figs. S3–S6.
O2 permeation in the ionomer of low temperature proton exchange membrane fuel cells (LT-PEMFCs) catalytic layer is critical to the interfacial oxygen transport and ORR activity which determine the cell performance. 43 Compared with LT-PEMFCs, HT-PEMFCs have a wider operating temperature range, so it is necessary to explore the temperature effect on the oxygen mass transport process. In fuel cells, when studying the influence of temperature, other operating conditions of the reactant gases (e.g. the RH, current density, backpressure, and gas flow rate) need to be considered, but the use of a microelectrode measurement system could eliminate the influence of other factors well. Figure 3a shows the relationships between the O2 diffusion coefficient and temperature in PES-PVP-60. It is not surprising to see this trend that the diffusion coefficient of oxygen increases with temperature since the thermal motion rate of O2 molecule can be accelerated by the temperature, which is consistent with the variation rule of the diffusion coefficient of O2 molecule. 44–46

Figure 3. (a) Oxygen diffusion coefficients in PES-PVP-60 binder as a function of temperature and fitting results of the experimental O2 diffusion coefficients in PES-PVP-60 binder with the "sphere-cage" model. (b) The free energy ∆G of oxygen molecular diffusion in PES-PVP-60 binder as a function of temperature.
Download figure:
Standard image High-resolution imageAccording to the free volume theory, 46 in general, the total volume (VT) of a polymer consists of the occupied volume (VO) per polymer molecule and the free volume (VF) existed in the form of "holes." The free volume provides a certain activity space for the polymer chain motion in PES-PVP-60, and also provides a channel for the diffusion of O2 molecules. However, when O2 molecules thermal vibrate to a specific position in the hole, the polymer chain segment at that position appears torsion or relative motion, which provides a transition channel for O2 molecules to jump from one hole to another, and then O2 molecule overcomes the energy barrier along the path to enter another hole. This is consistent with the mechanism of small molecule diffusion in polymers. 47 As the temperature increases, the free volume in PES-PVP-60 increases, which increases the number of holes that can accommodate O2 molecules, thus greatly improving the probability of O2 molecules jumping between the holes, and finally making the diffusion process easier to realize, so the diffusion coefficient of O2 molecules increases.
Based on Eq. 4 derived from the " sphere-cage" model, Fig. 3a also shows the fitting results of experimental values of the diffusion coefficient of oxygen in PES-PVP-60 binder. It can be seen that the fitting correlation coefficient is R2 = 0.9879, and the fitting curve is  Combined with the fitting equation, we can obtain the entropy changes of O2 molecules
  and enthalpy
  in the diffusion process of O2 molecules in the binder.
By combining  and
and  we can obtain the free energy
  of oxygen molecular diffusion as a function of temperature, as shown in the Fig. 3b. The diffusion of O2 molecules in the binder is an endothermic process of entropy reduction, because O2 molecules are constantly consumed during ORR on the electrode surface. It is confirmed that the diffusion of O2 molecules in the binder is facilitated by the increase of temperature.
Figure 4a show the relationships between the O2 solubility and temperature in PES-PVP-60. In general, when the temperature exceeds the boiling point of water, the solubility of oxygen decreases by two orders of magnitude compared to the low temperature, which may be a potential factor affecting the cell performance at high temperature, because the high solubility allows O2 molecular to permeate the triple phase interface and participate in the ORR reaction. An interesting phenomenon can be seen in Fig. 4a that CO2 gradually increases as the temperature increases from 373 K, and reaches the peak when the temperature rises to 453 K. After that, the solubility shows a downward trend, indicating that the dissolution process of O2 molecules in PES-PVP-60 is affected by multiple factors.
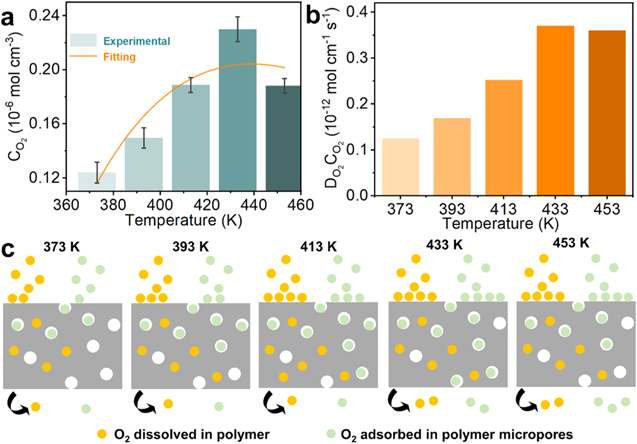
Figure 4. (a) Oxygen solubility in PES-PVP-60 binder as a function of temperature and fitting results of the experimental O2 solubility in PES-PVP-60 binder with the "sphere-cage" model. (b) Oxygen permeability in PES-PVP-60 binder as a function of temperature. (c) Schematic diagram of dissolution process. The orange balls represent O2 dissolved in the polymer, conforming to Henry's law of dissolution, and the green balls represent O2 adsorbed in the micropores, conforming to Langmuir-type adsorption.
Download figure:
Standard image High-resolution imageFigure 4b show the relationships between the O2 permeability (DO2CO2) and temperature in PES-PVP-60. As a product of diffusivity and solubility, the magnitude of permeability reflects the ease which oxygen molecules can pass through the binder to reach the surface of the Pt catalyst. As can be seen from the Fig. 4b, overall variation trend of permeability with temperature is similar to that of solubility, indicating that the solubility may become the limiting factor for oxygen permeation at high temperature, thus affecting the further improvement of cell performance.
Figure 4a also shows the experimental results of the solubility of oxygen in the PES-PVP-60 binder and the fitting results of the dual-mode model. It can be seen that the fitting correlation coefficient is R2 = 0.8176, and the fitting curve is  Therefore, the dissolution process of oxygen in the binder can be explained by the dual-mode model. The microvoids (or "cage") in the membrane immobilize O2 molecules by entrapment or binding to high-energy sites at the molecular periphery of the micropore, allowing oxygen to dissolve in the membrane (similar to adsorption).
35
Figure 4c illustrates the gas adsorption process in polymers based on a dual-mode. The model is based on two types of adsorption sites which follow (i) Henry's law dissolution and (ii) Langmuir-type adsorption. Langmuir adsorption sites in polymers correspond to pores or "micropores" due to the non-equilibrium nature of glassy polymers. With the increase of temperature, the similar adsorption function of O2 on the O2/binder interface of PES-PVP-60 is promoted, and the O2 concentration on the O2/binder interface is increased, thus improving the dissolution process of O2 in the binder, that is, the solubility increases. When the temperature is further increased to 433 K, the thermal motion of molecules is intensified, and the similar adsorption effect of micropores on oxygen molecules is weakened. As a result, the desorption rate of oxygen molecules is faster than the adsorption rate, that is, the solubility of oxygen decreases.
Therefore, the dissolution process of oxygen in the binder can be explained by the dual-mode model. The microvoids (or "cage") in the membrane immobilize O2 molecules by entrapment or binding to high-energy sites at the molecular periphery of the micropore, allowing oxygen to dissolve in the membrane (similar to adsorption).
35
Figure 4c illustrates the gas adsorption process in polymers based on a dual-mode. The model is based on two types of adsorption sites which follow (i) Henry's law dissolution and (ii) Langmuir-type adsorption. Langmuir adsorption sites in polymers correspond to pores or "micropores" due to the non-equilibrium nature of glassy polymers. With the increase of temperature, the similar adsorption function of O2 on the O2/binder interface of PES-PVP-60 is promoted, and the O2 concentration on the O2/binder interface is increased, thus improving the dissolution process of O2 in the binder, that is, the solubility increases. When the temperature is further increased to 433 K, the thermal motion of molecules is intensified, and the similar adsorption effect of micropores on oxygen molecules is weakened. As a result, the desorption rate of oxygen molecules is faster than the adsorption rate, that is, the solubility of oxygen decreases.
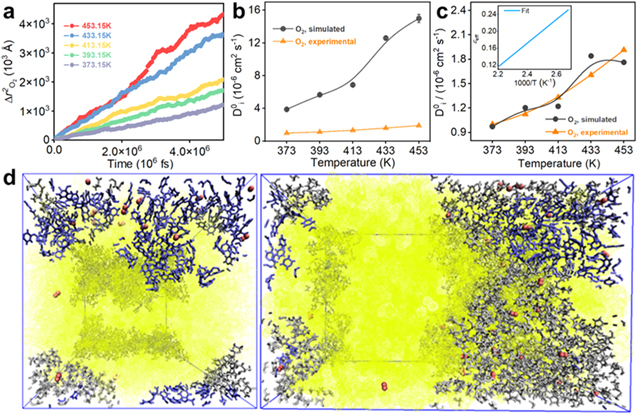
To elaborate the mass transfer process of oxygen at the molecular level, the diffusion behavior of oxygen in the temperature ranging from at 373.15 K to 453.15 K is calculated. As shown in Fig. 5a, with temperature increases, the root-mean-square displacements of oxygen is significantly enhanced, indicating that temperature is an important factor driving molecular diffusion, and the diffusion behavior of molecules reaches the random diffusion region in a linear relationship with time t, indicating that the system reaches equilibrium. The diffusion coefficients  of oxygen at different temperatures are shown in Fig. 5b. Compared with the experimental measurements, the simulated diffusion coefficients are qualitatively consistent within the order of magnitude. However, the specific values are overestimated, and the deviation gradually increases with the increase of temperature, due to the morphology of PES-PVP polymeric materials is simplified in the simulation model, which is a representative configuration.
48
of oxygen at different temperatures are shown in Fig. 5b. Compared with the experimental measurements, the simulated diffusion coefficients are qualitatively consistent within the order of magnitude. However, the specific values are overestimated, and the deviation gradually increases with the increase of temperature, due to the morphology of PES-PVP polymeric materials is simplified in the simulation model, which is a representative configuration.
48
Figure 5. (a) The root-mean-square displacements of O2 molecules as a function of time under different temperature, 1 atm. (b) Comparisons of the simulated diffusion coefficients with the experimental values at 1 atm. (c) Comparisons of the diffusion coefficients after correction of the porosity parameter with the experimental values at 1 atm. (d) Simulated structure of O2/PA/PES-PVP system at 1 atm and 453.15 K. Red spheres: O2; Yellow spheres: PA; Purple spheres: PES; Grey spheres: PVP. The size of the pores filled with PA and O2 molecules is about 6 nm.
Download figure:
Standard image High-resolution image
We find that within the temperature range of this study, the porosity parameters  have the following relationship with temperature:

The porosity corrected diffusion coefficient is shown in Fig. 5c, and the simulated diffusion coefficient of oxygen molecules is basically consistent with the experimental results. The pore morphology and pore size distribution of real PES-PVP materials are complicated, and the experimental results are the average results of pore diffusion. As shown by equilibrated microstructure of PES-PVP in Fig. 5d, the pore of the polymer material with a size of about 6 nm is obtained by NPT simulation instead of the initial structure, and is filled with PA and oxygen molecules. Oxygen molecules are not only diffused in the pores, but also adsorbed on the surface and gap of the material by the polymer. Such a process is consistent with the dual-mode model described above and demonstrates the accuracy of the experiment.
Conclusions
In this study, a high temperature microelectrode system with functions of temperature control, humidity control and electromagnetic shielding is used for quantitative measurement of O2 mass transport coefficients at the real working condition (100 °C–180 °C) in a PES-PVP binder used in HT-PEMFCs from a microscopic and local perspective. The diffusion coefficients, solubility and permeability of O2 with varying temperature are successfully obtained, indicating that the temperature has a considerable effect on O2 mass transport in the catalyst layer of HT-PEMFCs. With the increase of temperature, the diffusion coefficient of oxygen in the binder increase gradually, while the solubility increases first and then decreases. In order to further reveal the mechanism of oxygen mass transfer in binders, the diffusion process of O2 molecules were described by a "sphere-cage" model based on the free volume theory and hard sphere model. In addition, a dual-mode model describing the dissolution process of O2 molecules in PES-PVP-60 binder was established by fitting the experimental results.
According to the theoretical analysis and data fitting results, it is concluded that the diffusion process is determined by the hole containing oxygen molecules in the polymer, while the dissolution process is gradually changed from the surface chemisorption to the internal hole capacity with the increase of temperature. The results of the all-atom field and molecular dynamics simulation show that with temperature increases, the diffusions of oxygen is significantly enhanced, indicating that temperature is an important factor driving molecular diffusion. Moreover, the molecular simulation results show that the diffusion and dissolution behaviors of oxygen are consistent with the experimentally proposed dual-mode model. The agreement between molecular simulations and experimental results also reaffirms the ability of the constructed microelectrode test to accurately characterize the mass transfer process of oxygen within the polymer. It is foreseeable that the test system and the theoretical model are expected to guide the direction of future breakthroughs in the development of outperforming microenvironment of cathode catalyst layers.
Acknowledgments
Q. He acknowledges financial support from the National Natural Science Foundation of China (Grant Nos. 22178307 and 21978260) and China Southern Power Grid (Grant Nos. 0470002022030103HX00002–01).
Supplementary data (1.7 MB DOCX)