
Abstract
This study addresses the behavior of an aluminum alloy and its components in conditions simulating the presence of atmospheric salts. The corrosion of synthetic intermetallic compounds (IMCs) Al2Cu, Al2CuMg, Al7Cu2Fe, MgZn2, and bulk aluminum alloy 7075-T6 was studied in dilute Harrison's solution (DHS, 0.35 wt% (NH4)2SO4 + 0.05 wt% NaCl). For IMCs, electrochemical measurements were performed using a microcell, and a standard electrochemical cell was used to study the bulk alloy. Separately measured cathodic and anodic potentiodynamic polarization curves were recorded, and prolonged immersion was characterized using electrochemical impedance spectroscopy. Samples were characterized using scanning electron microscopy, energy-dispersive X-ray spectroscopy and X-ray photoelectron spectroscopy. Bulk AA7075-T6 was less susceptible to corrosion in DHS than in chloride solution stemming from the beneficial presence of sulfate ions and lower chloride concentration. The susceptibility of IMCs to corrosion in DHS increased in the order Al2Cu < Al7Cu2Fe < Al2CuMg < MgZn2 due to the increased dissolution of Mg in the presence of ammonium ions. The relative nobility of IMCs was determined based on the galvanic current density. Further, the possibility of using cerium chloride, nitrate and acetate salts as corrosion inhibitors in DHS was evaluated. Ce salts acted as inhibitors for the alloy during 14 d testing, forming a Ce hydroxide layer. The degree of protection depended on the type of anion, with acetate Ce salt giving the most efficient protection. For the IMC, however, inhibition by Ce salts did not occur during short measurements in the microcell, indicating the importance of galvanic interaction with the alloy matrix in the inhibition mechanism, which was confirmed by long-term measurements of the alloy.
Export citation and abstract BibTeX RIS

This is an open access article distributed under the terms of the Creative Commons Attribution 4.0 License (CC BY, http://creativecommons.org/licenses/by/4.0/), which permits unrestricted reuse of the work in any medium, provided the original work is properly cited.
Because of its suitable physical and chemical properties combined with relatively low weight, aluminum alloy (AA) 7075-T6 has many applications in the automotive and aircraft industries, various household appliances, and other technical fields. 1,2 Due to the presence of intermetallic particles (IMPs) consisting mainly of Al, Zn, Cu, Fe, and Mg, the mechanical properties are improved compared to Al metal. 3 However, the IMPs may dissolve or produce galvanic currents with the surrounding matrix due to the differences in electrochemical potential, 4–8 leading to severe localized types of corrosion, like pitting, 5,9 intergranular corrosion, 10 and exfoliation corrosion. 3,5,6,11 These processes generally occur in environments containing a relatively high concentration of chloride ions (Cl–). 12,13 Further, the electrochemical behavior of aluminum alloys depends on the corrosive medium temperature, 14–16 pH, 7 dissolved oxygen content, 16,17 etc. Regarding the composition of the corrosive medium, Cl− is not the only pollutant in industrial and urban areas. In addition, major inorganic species such as ammonium (NH4 +), sulfate (SO4 2−) and nitrate (NO3 −) ions found in the form of NH4NO3 and (NH4)2SO4 (or NH4HSO4), should be considered as well 18 because they represent corrosive agents for many aluminum alloys. 19,20 Corrosive conditions may be thus better simulated by the so-called dilute Harrison's solution (DHS) (0.35 wt% (NH4)2SO4 + 0.05 wt% NaCl), which in addition to Cl− also contains SO4 2− and nitrate NO3 − reflecting the environmental and atmospheric conditions. 21 The studies of aluminum alloys in DHS are relatively scarce. 20,22–27 Only two studies dealt with the effect of sol-gel coatings as protection for AA7075, 28,29 but the corrosion mechanism of this alloy in DHS has not been investigated in detail, especially regarding the role of particular IMPs in the process. This matter is worth further investigation due to the increasing trend of using AA7075-T6 in the transportation industry in the presence of atmospheric pollutants. The first step of our study is thus focused on the corrosion of AA7075-T6 in DHS. The alloy's most common IMPs are: precipitates Al2Cu (θ-phase), Al2CuMg (S-phase), MgZn2 and Mg2Si, and constituent particles Al7Cu2Fe, (Al,Cu)6(Fe,Cu), and Al3Fe, of which (Al,Cu)6(Fe,Cu) and Al7Cu2Fe particles have the largest area fraction and mainly responsible for the galvanic interactions with the matrix. 6,15,30–34 The corrosion mechanism of IMPs in chloride solutions depends on the corrosion potential, size, and quantity. 6,32 Some IMPs are more anodic relative to the matrix, e.g., MgZn2, and some are more cathodic, e.g., the Al–Cu–Fe IMPs. 6,33,34 The corrosion potential changes after prolonged immersion due to the dissolution of more active elements, such as magnesium and aluminum, or the enrichment of IMPs with more noble elements, such as copper. 6,34–36 The behavior in DHS may be similar or different than that in pure chloride solution.
In the second part of our study, we address the role of cerium salts in the corrosion protection of AA7075-T6. Cerium salts are non-toxic compounds and demonstrate corrosion inhibition 37 by inhibiting redox reactions by the formation of a protective cerium-containing precipitated conversion layer. 37,38 The mechanism of cerium layer formation from a solution containing cerium salts such as Ce(NO3)3, 17,39,40 CeCl3, 40–42 and Ce(CH3COO)3 (abbreviated as Ce(OAc)3) 40,41,43–46 was studied on aluminum alloys 7075 and 2024, but mainly in NaCl solution. 37,40,46,47 Cerium hydroxide/oxide first precipitates on the cathodic sites, blocking the oxygen reduction reaction and suppressing the localized corrosion. 47 The process consists of three steps: initiation, layer formation, and layer growth. The thickness of the precipitates depends on the type of IMP. 40,48 It was shown recently that deposition of the Ce-rich layer initiates at large Cu-containing Al(Fe,Cu)Si IMPs and proceeds to grow laterally across the surface. Dealloying of IMPs was found to be the governing mechanism for the precipitation of large Ce-rich deposits; the outward dissolution of Al and Mg and simultaneous precipitation of Ce led to the formation of a mixed Ce–Al hydroxide. 40 It was reported that Al2CuMg was covered with a thicker cerium-based deposit layer than Al2Cu. 40,47,49,50 Al7Cu2Fe(Mn) particles are either discretely or fully covered with a thin cerium-based layer, depending on immersion time. 40,48
The effects of the type of associated anions nitrate NO3 –, 9,51 sulfate SO4 2– 43–45,51 and acetate CH3COO–9,52 and their potential synergistic effect on corrosion inhibition were studied as well. 44,45 The NO3 − can passivate the aluminum surface, 39,53 SO4 2– can be adsorbed, 54 and CH3COO– acts as a buffer. 43,44 Additionally, the SO4 2− anions act as grain refiners and/or growth inhibitors for the precipitated layer, thus enhancing corrosion resistance. 43 Again, although these issues have already been well investigated in chloride solutions, there is no information on how the cerium protective layers are formed in DHS, which represents a more realistic corrosive environment containing sulfate, nitrate and ammonium ions.
The main challenge in assessing the corrosion inhibition mechanism remains the initiation and growth of the protective layers. The corrosion phenomena such as pit initiation, pit propagation, and inhibitor deposition are often localized within the micro or even nanometer range. 9,48 To characterize such processes, measurements should be performed locally 6,7,55 to allow only a small part of the sample area to be exposed to the corrosive solution. The corrosion mechanisms of AA2xxx and AA7xxx in chloride solutions were studied in detail using the microcell technique on the bulk alloys 39 and also on specific intermetallic compounds (IMCs) typical for these alloys. 3,4,6,14,30,35,55,56 The studies on IMCs allow the individual phases to be addressed separately. IMCs consisting of two or more metals falling at or near a fixed stoichiometric ratio exhibit different crystal structures and properties than their constituent elements. 6,7 Their corrosion properties have often been studied on bulk samples synthesized intentionally by casting. 6,7
This study addresses two major issues: (i) the corrosion of major intermetallic compounds synthesized in bulk form to represent the major intermetallic constituents (Al2Cu, Al2CuMg, Al7Cu2Fe and MgZn2) and AA7075-T6 bulk alloy in DHS, and (ii) the formation of cerium inhibitor layers on IMCs and AA7075 bulk alloy. Micro- and macro-electrochemical techniques were used to evaluate the effects at different time scales (from 30 s to 14 d) and spatial scales (from 60 μm to 1 cm) of the processes. The morphology of IMCs and bulk AA7075-T6 were characterized by a focused ion beam/scanning electron microscopy (FIB/SEM) equipped with energy-dispersive X-ray spectroscopy (EDS). SEM/EDS analyses were performed at the same spot after immersion in DHS without and with cerium salts. Formed cerium layers were also analyzed using X-ray photoelectron spectroscopy (XPS) to account for elemental speciation. The corrosion and inhibition properties were evaluated through electrochemical potentiodynamic measurements and electrochemical impedance spectroscopy (EIS).
Experimental
Materials, chemicals, and solutions
Synthetic IMCs, Al2Cu, Al2CuMg, MgZn2 and Al7Cu2Fe, were included in this study as proxy phases to represent a range of particles in the matrix of AA7075-T6. Synthesis and heat treatment were controlled to achieve a grain size of several tens of micrometers to facilitate electrochemical characterization by the microcell method. 6,7,30 Briefly, IMCs were synthesized by combining proper proportions of constituent metals, melting them using induction or arc melting and then subjecting them to isothermal heat treatments, as has been described in detail previously. 6,7,30 The sample surface was ground from 1200 to 4000 grit using SiC emery papers lubricated with ethanol, degreased ultrasonically in ethanol, and dried using compressed air. The samples were then polished using a 3-micron (heavy) diamond polishing compound (Buehler) lubricated by a diamond alcohol extender on a Buehler polishing machine. All samples were tested immediately after surface preparation to minimize the effect of oxidation.
Bulk AA7075-T6 samples in the form of 0.5 mm thick disks with a diameter of 14 mm, distributed by Kaiser Aluminum Corporation (Foothill Ranch, CA, USA), were also studied. The nominal composition in weight percentage (wt%) was: 89.68 Al, 5.81 Zn, 2.55 Mg, 1.67 Cu, 0.21 Fe and 0.08 Si. 46 The alloy surface was ground with 1200 and 4000-grit SiC emery papers in ethanol, rinsed with ethanol and ultrasonically cleaned in anhydrous ethanol for 10 min. Finally, polishing of the alloy surface was performed using a polishing machine (Struers LaboPol-5, Denmark) at a speed of 300 rotations per second using a polishing cloth (MD/DP-Nap cloth) with various diamond pastes ranging from 15 to 1 μm (DP-paste P) and ethanol-based lubricant (DP-Lubricant Blue), all supplied by Struers Inc., United States.
The corrosion testing was carried out in freshly prepared pH 5.2 DHS consisting of 0.35 wt% (NH4)2SO4 (AppliChem ≥ 99%) + 0.05 wt% NaCl (AppliChem > 99.5%). Comparative measurements were performed in 0.1 M NaCl (pH = 5.5). The solution was prepared using Milli-Q Direct water with a resistivity of 18.2 MΩ cm at 25 °C (Millipore, Billerica, MA).
As corrosion inhibitors, the following cerium rare earth salts were studied: cerium(III) chloride (CeCl3 · 7H2O, 99.9%, Aldrich), cerium(III) nitrate (Ce(NO3)3 · 6H2O, 99.9%, Aldrich), and cerium(III) acetate (Ce(OAc)3: Ce(CH3COO)3 · 2H2O, 99.9%, Aldrich). Corrosion inhibitors were added into DHS at the concentration of 3 mM. All solutions were freshly prepared and naturally aerated. Adding cerium salt into DHS changes the solution pH. The pH values of DHS+CeCl3, DHS+Ce(NO3)3, and DHS+Ce(OAc)3 solutions were 5.4, 5.2, and 6.4, respectively.
Electrochemical corrosion measurements
Microcell measurements
Electrochemical measurements on IMCs were performed using the electrochemical microcell approach. 55,57 Cathodic and anodic polarization curves were measured separately at ambient temperature in the presence or absence of cerium salts in DHS. The cathodic measurements started +20 mV above the open circuit potential (Eoc) to −250 mV vs Eoc. The anodic measurements started –20 mV below Eoc in the upward direction until the current density reached 10−4 A cm−2. The microcell consisted of a three-electrode setup: a working electrode, a platinum wire as a counter electrode, and a saturated calomel electrode (SCE, Hg/Hg2Cl2, 0.242 V vs saturated hydrogen electrode) as a reference electrode. The IMC working electrode was contacted by a borosilicate glass capillary with a silicone skirt/seal applied on the open end to prevent solution leakage. The measurement locations were selected randomly. The exposed area was approximately 70–80 μm in diameter, as determined after each experiment by observation using optical profilometry (Veeco Contour GT-K). The measurements were performed using a Gamry reference 600 potentiostat/galvanostat and controlled by Gamry Echem Analyst software (Gamry FrameworkTM, Version 4.35).
Cathodic and anodic polarization curves were measured at a scanning rate of 10 mV s−1 after a short initial stabilization time of 30 s following the contact of IMP with the solution. The short stabilization time was chosen to avoid any issues with cell leaking, the establishment of concentration gradients in the capillary, and clogging of the capillary with corrosion products. For the same reasons, a higher scan rate was used than in the macrocell setup. The polarization measurements were repeated at least 5 times; representative curves are shown, but all results are given in the Supplemental Information. The corrosion current density icorr was obtained by extrapolating the linear portion (from about 50 mV more negative than the corrosion potential Ecorr) of the cathodic part to Ecorr. The following electrochemical parameters were determined: Ecorr, icorr, pitting potential Epit and the span of the passive region calculated as ΔE = ∣Epit − Ecorr∣.
Macrocell measurements
Electrochemical measurements on bulk AA7075-T6 were performed using a standard three-electrode electrochemical corrosion cell (Parstat, Corrosion Cell Kit, model K0047, volume 1 L). Substrate disks embedded in a Teflon holder (model K0105 flat sample holder kit), leaving an area of 0.95 cm2 (diameter 1.1 cm) exposed to the corroding solution, served as a working electrode. An o-ring between the sample and holder was used to mask the area. Crevice corrosion under the o-ring was not observed. A SCE placed in a Luggin capillary salt bridge was used as a reference electrode, and a carbon rod served as a counter electrode. Electrochemical experiments were carried out with an Autolab PGSTAT 12 (Metrohm Autolab, Utrecht, The Netherlands) potentiostat/galvanostat and controlled by Nova 2.1 software.
The samples were allowed to stabilize at ambient temperature under open-circuit conditions for 3 min, 1 h or 6 h before initiation of polarization. The shortest stabilization time was chosen to assess the initiation process and correlate data with microcell experiments. Following stabilization, potentiodynamic measurements (cathodic and anodic curves) were performed separately using a 1 mV/s scan rate, starting at +20 mV above the Eoc and going to −250 mV vs Eoc in the downward direction, or –20 mV below Eoc and scanning in the upward direction until the current density reached 10−4 A cm−2. For each sample, measurements were performed at least in triplicate, and a representative measurement was plotted in graphs. The electrochemical parameters described above were determined: Ecorr, icorr, Epit and ΔE = |Epit −Ecorr|.
The corrosion behavior during long-term immersion (up to 2 weeks) of bulk AA7075-T6 was monitored using electrochemical impedance spectroscopy (EIS). The frequency range was from 100 kHz to 10 mHz at a sinusoidal voltage amplitude of 10 mV (rms). The sample was immersed in DHS without or with 3 mM cerium salt at ambient temperature for two weeks. The EIS spectra were recorded at Eoc at selected time intervals.
Surface characterization
A confocal light microscope (Axio, CSM 700, Zeiss, Göttingen, Germany) with a 20-times magnification objective lens was used to image the IMC surfaces.
A field-emission scanning electron microscope (FE-SEM, JEOL JSM 7600 F) equipped with EDS (Inca 400, Oxford Instruments) was used to analyze the morphology and composition of the IMCs. The imaging was performed by collecting the back-scattered electron (BSE) signal using a compositional mode at 15 kV voltage. EDS analyses were performed in point analysis mode.
The bulk AA7075-T6 and cerium inhibitor layers were evaluated by FIB/SEM (FEI Helios NanoLab 600 Dual-beam microscope). Imaging was performed using a circular back-scatter detector (CBS) at 5 kV voltage. EDS mapping was obtained using EDS Aztec software at 5 kV. Microstructural characterization was performed at the same spot before and after immersion for 6 h.
Monte Carlo simulation (using the NIST DTSA-II software - Power tools for X-ray Microanalysis) was used to simulate the EDS spectra at 3, 5 and 10 kV. The simulation used two assumptions: cerium layer thickness of 30 nm, and layer density of 2.5 g cm−3.
The cross-section of the selected region was obtained by FIB/SEM after the deposition of a thin layer of platinum on the surface (first 0.2 μm thick layer at 2 kV, 0.4 nA, second 1 μm thick layer deposited at 30 kV, 0.24 nA). A Ga FIB beam at 30 kV and 9.4 nA was used to cut the surface, which was then polished with a Ga beam at 30 kV and 0.4 nA.
XPS was performed using a TFA Physical Electronics Inc. spectrometer with a hemispherical analyzer. Non-monochromatized Al Kα radiation (1486.6 eV) was used to record survey spectra in a broad energy range (pass energy 187.9 eV). High-resolution spectra were taken using monochromatized radiation (pass energy 29.4 eV). The energy scale was calibrated by setting the main hydrocarbon peak C 1s at the binding energy (Eb) of 284.8 eV to correct sample charging. The X-ray spot size was 400 μm.
Results and Discussion
Microstructure and composition of IMCs and bulk alloy
The synthesized IMCs and bulk AA7075-T6 were first evaluated using optical profilometry and FIB/SEM/EDS to gain basic information on their microstructure and composition.
Microstructure of intermetallic compounds
Synthesized Al2Cu, Al2CuMg, Al7Cu2Fe and MgZn2 IMCs were metallographically polished to analyze their microstructure. First, the optical profilometry images in Fig. S1 were used to define the grain sizes, shapes and distribution. Additionally, these images were used to select the area to be tested by microcell. The grains in the IMCs differ in type (Fig. S1, left column). The Al2Cu grain size was a few hundred micrometers, and the grain boundaries could not be distinguished well, but a eutectic network was seen. In the Al2CuMg IMC, the grains were larger, and two different types of grains were noticed: the bright area representing the IMC was selected for testing. The grains were smaller, better defined, and well distributed in Al7Cu2Fe and MgZn2 IMCs. The diameter of the individual grains was ∼50 μm.
Optical microscopy cannot determine the IMC composition so FE-SEM/EDS analyses were used to investigate further the grains and phases in the IMCs (Fig. 1). These IMCs have already been characterized by different techniques in the literature. 3,6,35 Herein, we focus on surface characterization using the back-scattered SEM mode to distinguish the size and composition of the phases, where darker areas represent lighter and bright areas represent heavier elements.

Figure 1. Back-scattered FE-SEM images with insets of four synthetic intermetallic compounds: (a) Al2Cu, (b) Al2CuMg, (c) Al7Cu2Fe, and (d) MgZn2. The EDS analyses were made at numbered locations, and the compositions are given in Table I.
Download figure:
Standard image High-resolution imageThe BSE SEM images in Fig. 1 show the heterogeneous microstructure of the IMCs. Inset images at higher magnification confirm that different phases were present along the grain borders. The Al2Cu IMC consisted of two constituents differentiated as dark and bright phases (Fig. 1a, Table I). The bright phase (1) contained Al and Cu with an approximate atomic ratio of 2:1, indicating that they are probably the θ-Al2Cu phase. The dark grey phase (2) had an atomic ratio of Al:Cu, approximately 5:1, indicating that these are Al5Cu.
Table I. Chemical composition given in atomic percentage (at%) was determined by EDS analyses at different spots on the synthetic intermetallic compounds Al2Cu, Al2CuMg, Al7Cu2Fe, MgZn2, as numbered in Fig. 1.
| Phase/spot | Al | Cu | Mg | Si | Zn | Fe |
|---|---|---|---|---|---|---|
| Al2Cu | ||||||
| 1 | 67.1 | 32.9 | ||||
| 2 | 83.4 | 16.6 | ||||
| Al2CuMg | ||||||
| 3 | 50.0 | 25.5 | 24.5 | |||
| 4 | 92.7 | 1.3 | 6.0 | |||
| 5 | 34.3 | 32.2 | 33.5 | |||
| Al7Cu2Fe | ||||||
| 6 | 67.6 | 31.6 | 0.7 | |||
| 7 | 69.4 | 20.4 | 10.2 | |||
| 8 | 82.4 | 17.2 | 0.4 | |||
| 9 | 97.1 | 2.8 | 0.1 | |||
| MgZn2 | ||||||
| 10 | 36.8 | 63.2 | ||||
| 11 | 66.2 | 33.3 | 0.5 | |||
| 12 | 14.5 | 0.5 | 84.9 | |||
The S-phase (Al2CuMg) included three phases (Fig. 1b, Table I). The grey phase (3) contained Al, Cu, and Mg with an approximate atomic ratio of 2:1:1, suggesting the Al2CuMg phase. The darker phase (4) had an atomic ratio of Al:Cu:Mg at approximately 9:1:6, indicating Al7CuMg6. The brightest phase (5) had an atomic ratio of approximately 1:1:1, corresponding to AlCuMg.
The Al7Cu2Fe sample consisted of four phases (Fig. 1c, Table I). The brightest grey phase (6) contained Al and Cu with an approximate atomic ratio of 2:1 and only a small amount of Fe, indicating they were probably the Al2Cu phase. The grey phase (7) contained Al, Cu and Fe with an approximate atomic ratio of 7:2:1, indicating that this was Al7Cu2Fe (Fe-bearing phase). Structure (8) was a mixture of dark and bright phases and contained Al and Cu and a small amount of Zn with an approximate atomic ratio of Al:Cu of 4:1. The dark phase (9) contained predominantly Al with a small amount of Cu.
The MgZn2 samples consisted of three phases (Fig. 1d, Table I). The light grey phase (10) contained a ratio Mg:Zn of 1:2, indicating that inclusions were MgZn2 phase. The darker phase (11) contained Mg and Si as major elements with an approximate atomic ratio 2:1, along with a small amount of zinc; this phase was probably Mg2Si (Si-bearing phase). The brightest phase (12) had an atomic ratio of Mg:Zn, approximately 1:6, indicating that these were Mg6Zn.
The presented data confirmed that all IMCs had a well-defined composition without other metallic impurities, but each IMC contained several grains with different phases. The sizes of the phase in IMCs were less than the diameter of the microcell capillary tip, which had a diameter between 70–80 μm (Fig. S1, right column). The electrochemical measurements therefore reflected the average response measured on several grains and their boundaries within the particular IMC samples (Fig. S1), which affected the reproducibility, as described in the Experimental section. The electrochemical measurements presented below represent a typical response of these samples.
Microstructure of 7075-T6 aluminum alloy
The metallographically polished AA7075-T6 surface was characterized using SEM imaging with a CBS detector (Fig. 2). The polishing makes the intermetallic particles well-defined and seen as bright or dark features incorporated in the aluminum matrix. They were differently sized or shaped and randomly distributed. The composition determined by EDS of the whole 85 × 55 μm area in Fig. 2a, which is marked with a dashed rectangle, is representative of the average alloy composition and is shown in the figure in atomic percentage. This bulk alloy composition agrees with the composition given by the producer's quality certificate as stated above. The matrix contains predominantly aluminum and a small amount of oxygen originating from the native passive Al oxide formed on the alloy surface. Within the matrix, very fine MgZn2 precipitates were formed during solution heat treatment. 5 These IMPs can strongly affect the corrosion behavior of the alloy because MgZn2 particles are active relative to the matrix and dissolve preferentially. 13,58
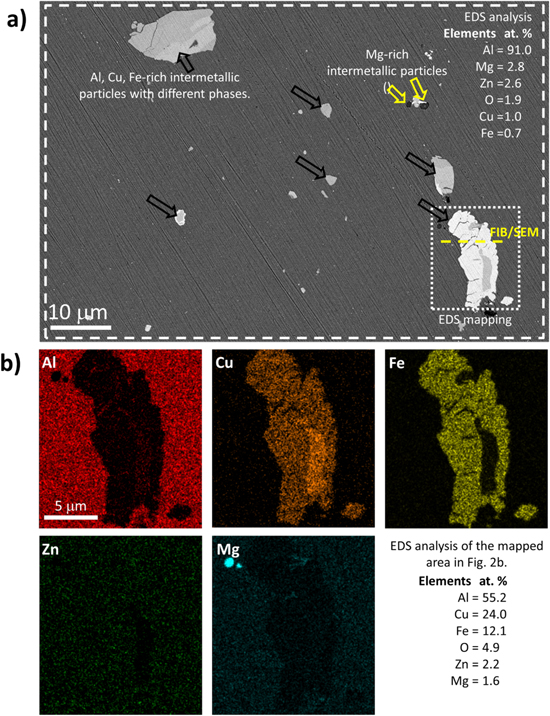
Figure 2. (a) SEM image using circular backscatter detector of bulk AA7075-T6 recorded at 5 kV. The composition is given in atomic % obtained with EDS analysis of the area within the dashed rectangle. (b) EDS elemental mapping of Al, Cu, Fe, Zn, Mg of the selected Al-Cu-Fe intermetallic particle denoted by a dotted rectangle. The table gives the average composition of the analyzed area. The yellow dashed line presents the area where the FIB/SEM cross-section was performed (shown in Fig. S2a). Black arrows denote Al,Cu,Fe-rich IMPs, and yellow arrows Mg-rich IMPs.
Download figure:
Standard image High-resolution imageThe size of the other IMPs is from a few tens of nm up to tens of μm depending on their composition (Fig. 2a). The darker, smaller particles ranging from 5 to 10 μm are the Mg-rich phase (marked with yellow arrows), and the lighter, larger particles ranging from 5 to 30 μm, were the α(Al–Fe–Cu) phase (Fe-bearing inclusions) and are marked with black arrows.
The Al7Cu2Fe IMPs were larger than other IMPs and irregularly shaped. The EDS composition of the selected Al–Fe–Cu particle in the dotted rectangle in the lower right of Fig. 2a was analyzed. EDS elemental maps and the average composition in Fig. 2b reveal different phases, consisting mainly of Al, Cu, Fe, Zn and Mg. Within the IMP, there was a region with more Al and Cu and darker contrast. Overall, the composition of this IMP correlates with the Al7Cu2Fe IMC (Fig. 1d). Zn and Mg were dispersed in the surrounding aluminum matrix.
The FIB/SEM/EDS analysis of the cross-section of the selected IMP in Fig. 2a (at the location marked with a yellow dashed line within the dotted rectangle) is shown in Fig. S2a. The Al–Cu–Fe IMP reached ∼4.9 μm into the aluminum alloy structure. The grain boundaries in the AA7075-T6 are marked with dashed lines. Voids within the alloy structure were probably formed during the production or thermal processing. Figure S2b presents the EDS maps of the visible area along the cross-section to analyze the distribution of the elements. Similar to the top-view imaging (Fig. 2b), Cu, Fe and Al were present in the IMP and Al, Zn and Mg in the surrounding matrix. The native oxide layer on the alloy surface was only a few nm thick and thinner on IMPs, marked with white arrows (Fig. S2a). Such a thin native oxide layer on IMPs represents the weak points for corrosion in the alloy. 59
The comparative analyses of synthesized intermetallic compounds and the bulk alloy with intermetallic particles are the basis for further investigation of the corrosion mechanism in DHS and inhibition by Ce presented in the second and third parts of the study. The top view and cross-section SEM/EDS analyses of bulk AA7075-T6 reflected the heterogeneous distribution of the IMPs in the aluminum alloy. Among IMPs, the main focus is on Al–Cu–Fe since our recent study showed that these IMPs play a major role in forming Ce inhibitor layers. 40
Electrochemical measurements in DHS and NaCl solution
The electrochemical responses of the synthesized IMCs and bulk AA7075-T6 were first studied in DHS with comparative measurements in 0.1 M NaCl. Evaluation of major IMCs allowed the assessment of their roles in the corrosion process of the alloy. The IMCs were studied using the microcell approach, and the alloy using a standard or macrocell approach.
Microcell measurements on IMCs
Separately measured anodic and cathodic curves were recorded using the microcell approach for the IMCs following 30 s immersion in DHS (Fig. 3). Due to the grain size and comingling of phases in each IMC sample (Fig. 1), it is challenging to carry out electrochemical measurements on a single phase. As a result, the electrochemical measurements were not performed only on a single grain/phase (Figs. 1a and S1), which impacted the reproducibility. All recorded curves are provided in Fig. S3. For comparison, the most typical curves were plotted in Fig. 3.
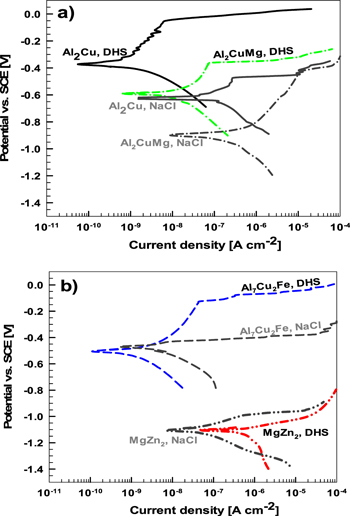
Figure 3. Separately measured cathodic and anodic polarization curves for (a) Al2Cu, Al2CuMg, and (b) Al7Cu2Fe and MgZn2 in dilute Harrison's solution (DHS) and NaCl solution. Curves were recorded in a microcell setup (tip ∼70–80 μm) after 30 s stabilization time at the Eoc. Scan rate dE/dt = 10 mV s−1. The polarization curves for IMC measured in 0.1 M NaCl are gray colored.
Download figure:
Standard image High-resolution imageThe microcell experiments with a short immersion time (30 s) reflect the initial electrochemical response of the metal to contact with the solution compared to the behavior after longer exposure to Eoc as shown below. The curves show that each IMC, due to different compositions, behaves differently in DHS. The icorr, Ecorr, Epit, and ΔE values are presented in Fig. 4 and Table SI. The less corrosion-resistant in DHS are IMCs containing Mg (MgZn2 and Al2CuMg), and the more resistant contain Cu (Al7Cu2Fe and Al2Cu), as evidenced by decreasing icorr (Fig. 4a). The difference in the icorr between MgZn2 (0.31 μA cm−2) and Al2Cu (0.33 nA cm−2) or Al7Cu2Fe (0.4 nA cm−2) was approximately three orders of magnitude due to the high tendency of Mg to dissolve. 35,58
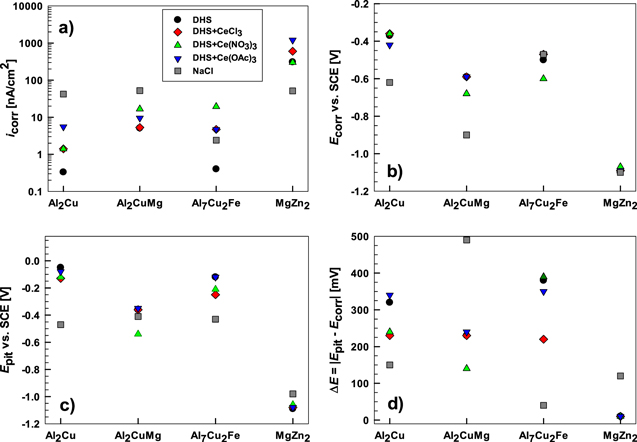
Figure 4. Electrochemical parameters measured for intermetallic compounds Al2Cu, Al2CuMg, Al7Cu2Fe and MgZn2 in dilute Harrison's solution (DHS) with and without added 3 mM of cerium chloride CeCl3, cerium nitrate Ce(NO3)3 and cerium acetate Ce(OAc)3. (a) icorr (corrosion current density), (b) Ecorr (corrosion potential), (c) Epit (pitting potential), and (d) the span ΔE = ∣Epit − Ecorr∣ were determined from potentiodynamic polarization curves (Figs. 4 and 6). For comparison, the electrochemical parameters measured in NaCl are also given.
Download figure:
Standard image High-resolution imageIn DHS, Ecorr became less negative in the given order: MgZn2 < Al2CuMg < Al7Cu2Fe < Al2Cu (Fig. 4b, Table SI). The trend in pitting potential was similar: MgZn2 < Al2CuMg < Al7Cu2Fe < Al2Cu (Fig. 4c, Table SI). More negative values of Al2CuMg and especially MgZn2 resulted from electrochemically active Mg in the IMC. The magnesium in the Al2CuMg strongly determines its dissolution behavior in chloride solutions; it is selectively dissolved, leaving the IMP enriched in Cu. 48,60 In DHS, MgZn2 was the only IMC that did not have a potential range that established a passive region (ΔE) in the anodic curve. For Al–Cu–containing IMCs ΔE spanned between 230 mV and 380 mV (Fig. 4d).
The corrosion behavior of IMCs has been previously studied in 0.1 M NaCl at different pHs. 6,7 Herein, we compared the behavior in DHS with that in the NaCl solution (Fig. 3, Table SI). In DHS, the icorr values for Al2Cu IMC were almost two orders of magnitude, and for Al7Cu2Fe and Al2CuMg, one order of magnitude smaller than in 0.1 M NaCl. A decreased icorr in DHS can be ascribed to the lower aggressiveness of the solution due to lower (∼12-times) chloride concentration (0.05 wt% (or ∼0.0085 M) in DHS and 0.1 M in NaCl). In contrast, icorr for MgZn2 was 6 times higher in DHS than in NaCl. The effect of corrosion media was also reflected in Ecorr; the values for Al2CuMg and Al2Cu 0.31 V and 0.25 V more negative, respectively, in NaCl solution. For Al7Cu2Fe, the shift was only 0.03 V, whereas Ecorr of MgZn2 remained unchanged. Important differences could also be noticed in Epit, with more noble values in DHS for the Al7Cu2Fe, Al2CuMg, and Al2Cu. The main difference was again MgZn2, for Epit was 0.11 V more negative in DHS than in NaCl solution.
These results undoubtedly confirmed the change in the corrosion behavior of IMCs in DHS compared to NaCl solution. The main difference between electrolytes can be explained by the lower concentration of Cl−, but also by the effect of NH4 + and SO4 2− ions in DHS. The pH values of the two solutions are similar: 5.2 (DHS) and 5.5 (0.1 M NaCl). Let us first consider the effect of ammonium ions. While all three Al–Cu-based IMCs showed less corrosion susceptibility in DHS than in NaCl, the MgZn2 IMC exhibited the opposite behavior. Below a pH of approximately 10, the overall reaction of Mg in an aqueous solution can be expressed as the dissolution of magnesium accompanied by hydrogen evolution, reaction 1: 61

In an aqueous solution, the ammonium ion acts as a weak acid because it dissociates to form hydroxyl ions and ammonia, reaction 2.

This is the reaction characteristic of ammonium buffer, which maintains a pH between 10 and 11, depending on the concentration of ammonium salt. Consequently, it maintains the pH at a value below that for the precipitation of Mg(OH)2. 26 It was reported that Mg showed remarkable higher reactivity in the presence of NH4 + ions. 26 Uniform dissolution was observed shortly after immersion in 1 M (NH4)2SO4 with vigorous H2 evolution. This is due to the reaction of magnesium with ammonium ions, giving the overall reaction 3: 62

The reactivity of Mg in the presence of ammonium ions may be used to explain the behavior noticed for MgZn2 in DHS (Figs. 3 and 4), resulting in stimulation of dissolution compared to that in NaCl. Dissolved Mg2+ ions can further react with SO4 2− ions to form soluble magnesium sulfate MgSO4 (or less soluble complex (NH4)2MgSO4). 20,26,63,64
The second issue that needs to be considered when discussing the behaviour in DHS is the formation of a protective layer of aluminum oxide in the sulfate-containing solution. 65 It is known that the SO4 2− ions displace chloride ions from the surface. 9 The presence of SO4 2− reduces the pitting corrosion of aluminum, and corrosion occurs only locally on the pre-existing surface voids and cracks. 20,26,66 At low sulfate concentrations, the formation of Al hydroxide is preferred; however, aluminum sulfate or oxysulfate is favored at higher concentrations. The reaction between SO4 2− and Al 67 may proceed according to reactions 5 and 6. 43


The formation of  can contribute to the more extensive passivation of Al2Cu, Al2CuMg, and Al7Cu2Mg observed in DHS compared to NaCl (Figs. 3 and 4). The composition of the surface layer is further addressed below.
Macrocell measurements on AA7075-T6
Separately measured anodic and cathodic polarization curves recorded on AA7075-T6 after 3 min, 1 h and 6 h exposure at Eoc in DHS are given in Fig. 5. Overall, according to the position of Ecorr, the curves for bulk alloy resemble those of Al–Cu-based IMCs (Fig. 3). However, the passive region was much smaller. After 3 min, the alloy was more susceptible to corrosion than Al2Cu, Al2CuMg and Al7Cu2Fe after 30 s immersion. The Ecorr and Epit were –0.52 and –0.42 V SCE, respectively, giving ΔE of 100 mV. When comparing the micro and macro measurements it should be considered that the area investigated largely differs (as explained below), which likely affects the number of breakdown events captured by each type of measurement.
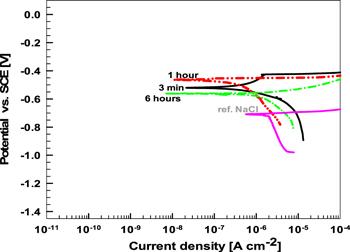
Figure 5. Separately measured cathodic and anodic polarization curves for AA7075-T6 in dilute Harrison's solution (DHS) after 3 min, 1 h and 6 h of stabilization time at Eoc. As a reference, the polarization curve measured in 0.1 M NaCl after 1 h at Eoc is given. Scan rate dE/dt = 1 mV s−1.
Download figure:
Standard image High-resolution imageAfter 1 h, the curves were shifted slightly in a positive direction, but the passive region disappeared, indicating pitting at Eoc. After 6 h, the curves were shifted in the negative direction, and the rapidly increasing current density also suggested active pitting corrosion. The polarization curve recorded after 1 h of immersion of AA7075-T6 in 0.1 M NaCl is given for comparison (Fig. 5). In NaCl, icorr was ∼16-times higher (Table SII) than in DHS because of the less noble value of Ecorr, which was pinned at Epit. 40,46,68 Thus, similar to Cu-containing IMCs, the bulk AA7075-T6 also had better corrosion resistance in DHS compared to the NaCl solution.
Electrochemical measurements in DHS with added cerium salts
Microcell measurements on IMCs
The anodic and cathodic curves recorded in DHS with added cerium salts are presented in Fig. 6. The electrochemical response of all IMCs at the initial stage, after 30 s of immersion, changed in the presence of cerium salts, as shown by changed electrochemical parameters (Fig. 4, Table SI).

Figure 6. Separately measured cathodic and anodic polarization curves for (a) Al2Cu, (b) Al2CuMg, (c) Al7Cu2Fe and (d) MgZn2 in dilute Harrison's solution (DHS) with and without added 3 mM CeCl3, Ce(NO3)3 and Ce(OAc)3. Curves were recorded in a microcell setup (tip ∼70–80 μm) after 30 s stabilization time at the Eoc. Scan rate dE/dt = 10 mV s−1. All repetitions of the curves are given in Fig. S3. Please note that the curves for DHS are also given in Fig. 3.
Download figure:
Standard image High-resolution imageFor the Al2Cu IMC, the shapes of the curves recorded in the presence of various cerium salts were similar. The cathodic curve was almost not affected by the addition of Ce salts, but there were noticeable differences in the icorr, Ecorr and Epit. A pronounced increase in icorr, about one order of magnitude, was noticed for Ce(OAc)3 owing to an increase in the passive current density. Ecorr remained similar in the presence of CeCl3 and Ce(NO3)3, but for Ce(OAc)3, it shifted more active by 50 mV (Figs. 6 and 4). The passive range became narrower in the presence of CeCl3 and Ce(NO3)3.
Almost no effect of CeCl3 added to DHS was noticed on Al2CuMg, whereas Ce(OAc)3 affected only the cathodic part (Fig. 6b). These two salts did not enhance the preferential dissolution of Mg. In contrast, Ce(NO3)3 caused a more significant change in the curve shape of Al2CuMg. The Ecorr and Epit were shifted to less noble values, and ΔE became narrower. It seems that the addition of NO3 − stimulates the dissolution of Al2CuMg.
More pronounced effects of Ce salts were observed on the Al7Cu2Fe IMC (Figs. 6c and 4). Both cathodic and anodic curves were affected. All Ce salts caused both the anodic and cathodic portions of the polarization curves to shift to greater current densities, but the shape of the curves for Ce(OAc)3 and CeCl3 remained similar to that in DHS. As was the case for Al2CuMg, the most significant effect was observed for DHS+Ce(NO3)3; icorr was almost two orders of magnitude higher than the other two Ce salts and Ecorr was shifted to more active values.
All Ce salts seem to have a similar effect on the electrochemical behavior of MgZn2 IMC, primarily increasing the current density in the cathodic curve (Figs. 6d and 4). The Ecorr remained similar. Enhancement of the cathodic reaction is the opposite of the effect Ce salts are known to have on Al alloys. 43,46 This will be addressed below.
To sum up, the results confirmed that different Ce(III) salts affected the IMC electrochemical activity differently. At the initial stage of the process (first 30 s), the dissolution of almost all IMCs was promoted in DHS with added Ce(III) salts. The effect was most pronounced for Al2Cu and Al7Cu2Fe IMCs for all three Ce salts and Al2CuMg in DHS+Ce(NO3)3. MgZn2 IMC was less influenced by adding Ce(III) salts. The subsequent stages of cerium inhibitor layer precipitation and growth examined by macrocell measurements are described in the next section.
Macrocell measurements on 7075-T6 aluminum alloy
The variation of Eoc of bulk AA7075-T6 as a function of the immersion time in DHS with and without added Ce(III) salts is shown in Fig. 7a. In DHS, Eoc increased abruptly after immersion from the very negative value of −0.95 V and reached a steady-state at −0.60 V after only 90 s. The more active metals (Mg and Al) are dissolved, and the native oxide layer also interacts with the corrosion medium. However, the oxide layer is quickly rebuilt, leading to the stabilization of Eoc. A scattering of values within ±10 mV reflected the continuous corrosion and repassivation processes, and no pitting was observed during 1 h of immersion.

Figure 7. (a) Open circuit potential curves were recorded in a macrocell set up during the first hour of immersion and after 6 h for AA7075-T6 in dilute Harrison's solution (DHS) with and without added 3 mM CeCl3, Ce(NO3)3 and Ce(OAc)3. Separately measured cathodic and anodic polarization curves in DHS, DHS+CeCl3, DHS+Ce(NO3)3 and DHS+Ce(OAc)3 after (b) 3 min, (c) 1 h and (d) 6 h of stabilization time at the Eoc. Scan rate dE/dt = 1 mV s−1. In Fig. S4, curves were presented separately as a function of immersion time for each solution. Please note that the curves for DHS are also given in Fig. 5.
Download figure:
Standard image High-resolution imageDifferences in the Eoc curves were observed in DHS containing Ce salts, although the general shape was similar, two regions can be recognized. In the first region, a few seconds after immersion, all Ce salts exhibited more negative Eoc relative to DHS, most for DHS+Ce(NO3)3. Eoc shifted more positively but slower than in DHS, suggesting that the initial dissolution of active metals was promoted in the presence of Ce salts. A somewhat longer period was required to reach a steady state with less noisy potential. After 5 min, the Eoc stabilized around −0.70 V for DHS+Ce(OAc)3 and DHS+CeCl3. For DHS+Ce(NO3)3, Eoc was around −0.46 V after ∼40 min. Only in the latter solution was Eoc more positive than in DHS. Final Eoc values after 1 h were: −0.67 V, −0.63 V, −0.60 V and −0.54 V in DHS+Ce(OAc)3, DHS+CeCl3, DHS and DHS+Ce(NO3)3, respectively. Note that the scatter of these measurements was within 10 mV. After 6 h, Eoc in DHS+Ce(NO3)3 remained similar, whereas in all other solutions became more positive and stabilized around −0.56 V. Shifting potential to more noble values is related to the anodic inhibition or a lessening of cathodic inhibition.
Figures 7b−7d and S4 present the separately measured cathodic and anodic polarization curves of AA7075-T6 in DHS with and without added CeCl3, Ce(NO3)3, and Ce(OAc)3 after 3 min, 1 h and 6 h of stabilization time at Eoc. The curves were recorded to study the effect of immersion time on the course of corrosion in DHS and inhibition in DHS+Ce salts, respectively. Deduced electrochemical parameters are presented in Fig. 8. Note that the Eoc values were quite reproducible, so the overlaid cathodic and anodic curves appear to be one continuous curve.
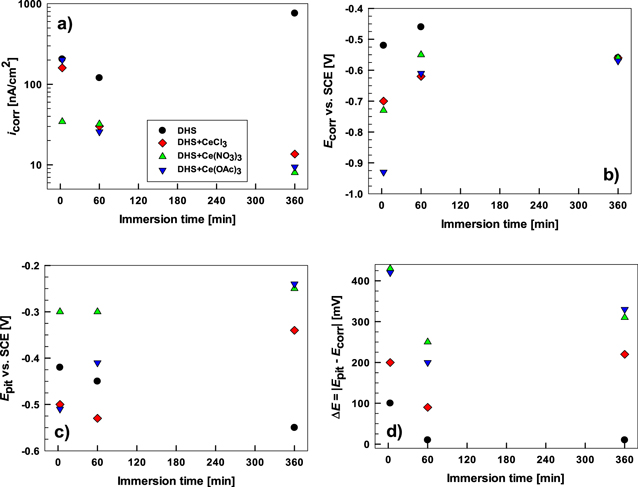
Figure 8. Electrochemical parameters measured for bulk AA7075-T6 in dilute Harrison's solution (DHS) with and without added 3 mM of cerium chloride CeCl3, cerium nitrate Ce(NO3)3 and cerium acetate Ce(OAc)3. (a) icorr (corrosion current density), (b) Ecorr (corrosion potential), (c) Epit (pitting potential) and (d) the span ΔE = ∣Epit—Ecorr∣ were determined from potentiodynamic polarization curves (Fig. 7) and presented as a function of immersion time at Eoc.
Download figure:
Standard image High-resolution imageWith adding cerium salts, significant differences observed in the polarization curves confirm that Ce salts act like corrosion inhibitors on AA7075-T6 because they reduce the corrosion rate. Already after 3 min at Eoc, curves were shifted to smaller current densities and more negative potentials. The negative shift was most pronounced for DHS+Ce(OAc)3, resulting in a large ΔE. The icorr was slightly lower or remained similar to DHS (Table SI). After 1 h of immersion, the icorr decreased further in the solutions with Ce(III) salts as the result of decreases in both the anodic and cathodic kinetics. The net result caused a positive shift of Ecorr. This trend continued at 6 h of immersion when all curves exhibited similar Ecorr but considerably different icorr and ΔE compared to DHS. The DHS curve indicated pitting at Eoc, whereas the curves in inhibited solution showed extended passive regions with 60 to 95-times smaller icorr and ΔE between 220 and 330 mV (Fig. 8). The inhibition performance of cerium salts on Al alloys was reported to improve with prolonged time at the Eoc in chloride solution. 41,43,46 This trend is now confirmed in DHS as well. DHA+Ce(OAc)3 and DHS+Ce(NO3)3 showed similar values of icorr and ΔE, both being smaller and broader, respectively, than for DHS+CeCl3.
Based on the above data, all three Ce salts act initially (after 3 min) as cathodic inhibitors for the alloy, shifting Ecorr in the negative direction and establishing a passive region with ΔE of a few hundred mV. In contrast to DHS, where the corrosion process is promoted with immersion time, in DHS+Ce salts, the corrosion of AA7075-T6 was considerably suppressed (Fig. 4). The shift of polarization curves with prolonged immersion time shows that all three Ce salts follow the transition from primarily cathodic inhibition at first to anodic inhibition later on. After 6 h, DHS+Ce(NO3)3 and DHS+Ce(OAc)3 showed similar curves, i.e. similar level of protection, whereas CeCl3 was somewhat lesser. This is related to the corresponding anions (NO3 − and OAc−), which were involved in the inhibition mechanism in DHS solution, as already shown for chloride solution, 43 in contrast to the etching behavior of CeCl3. 16 The beneficial effect of the associated NO3 – and OAc– ions on the inhibition process is thus confirmed along with the synergetic effect between cerium ions and SO4 2– ions in DHS. The beneficial effect of incorporating SO4 2– ions in the Ce conversion layer was reported. 43–45
Long-term immersion test of 7075-T6 aluminum alloy
The correlation of inhibition in DHS with and without added CeCl3, Ce(NO3)3 and Ce(OAc)3 was further evaluated during a prolonged immersion test (up to two weeks) using EIS measurements.
Bode plots of the impedance magnitude (|Z|) and phase angle (ϕ), as a function of frequency (f) are compared after 6 h (Fig. 9a) and 2 d of immersion (Fig. 9b). In DHS, bulk AA7075-T6 exhibited primarily capacitive behavior at 6 h of immersion, but then a large decrease in low-frequency impedance to 1.1 × 10⁵ Ω cm2 after 2 d (Fig. 9b). The phase shift ϕ exhibits a rapid decrease at lower frequencies after 2 d. This behavior indicates an enhancement of corrosion, likely associated with pitting corrosion, which was observed on the specimens. The corrosion process in DHS is, however, less aggressive than in the NaCl solution, in which the low-frequency impedance was reported to be one order of magnitude lower, ∼1 × 10⁴ Ω cm2. 43,68
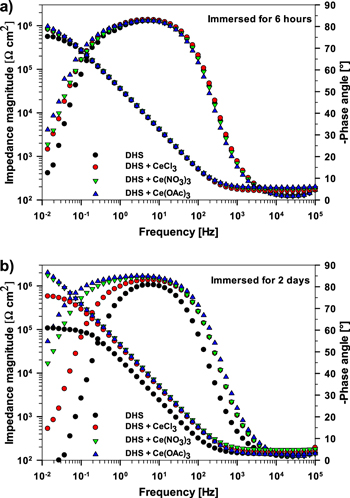
Figure 9. The electrochemical impedance spectra measured for AA7075-T6 in dilute Harrison's solution (DHS) with and without added 3 mM CeCl3, Ce(NO3)3 and Ce(OAc)3 (a) after 6 h and (b) after 2 d of immersion presented as Bode plots of impedance magnitude and phase angle.
Download figure:
Standard image High-resolution imageThe EIS results substantiate significant corrosion inhibition of AA7075-T6 in DHS containing Ce salts. Even after 6 h, the |Z| values increased continually with decreasing f, indicating the highly capacitive character of the protective layer formed at the metal surface during immersion. The greatest inhibition resulted from the addition of Ce(OAc)3. At the lowest frequency of 10 mHz, the |Z| in DHS+Ce(OAc)3 was ∼0.9 MΩ cm2 compared to ∼0.6 MΩ cm2 in DHS (Fig. 9a). After 2 d, the differences among Ce salts became more pronounced. |Z| for DHS+CeCl3 was ∼0.6 MΩ cm2, but still remained above values for DHS (Fig. 9b). However, the |Z| in DHS+Ce(NO3)3 and DHS+Ce(OAc)3 increased up to 2.2 MΩ cm2 and a broad plateau of ϕ was established in the frequency range from 102 to 1 Hz. The ϕ exhibited a maximum at −85°, thus reflecting high capacitive properties of the interfacial layers.
The EIS measurements were performed after extended immersion times of 14 d. Only the impedance values at low frequency (|Z10 mHz|) are shown. |Z10 mHz| values were taken as the representative parameter related to the corrosion process at the metal/layer interface 43,45 and are presented as a function of immersion time (Fig. 10). In DHS, |Z10 mHz| increased in the first 16 h and reached 1.0 MΩ cm2, but then decreased progressively reflecting the corrosion process. In the presence of CeCl3, the |Z10 mHz| also initially reached a maximum at 16 h, but it then increased again, reaching another maximum of 0.6 MΩ cm2 after 2 d of immersion. At longer immersion times, the |Z10 mHz| decreased slowly but remained higher than that in the non-inhibited DHS (Fig. 10). Several pits were noticed after the end of the experiment.

Figure 10. Impedance magnitude at 10 mHz (|Z10 mHz|) as a function of immersion time measured for AA7075-T6 in dilute Harrison's solution (DHS) with and without added 3 mM Ce(NO3)3, CeCl3 and Ce(OAc)3.
Download figure:
Standard image High-resolution imageMeasurements in DHS+Ce(NO3)3 and DHS+Ce(OAc)3 showed considerably different curves. After 2 d, the |Z10 mHz| in DHS+Ce(NO3) reached a maximum of 2.2 MΩ cm2 followed by a rapid and then slower decrease, reaching a steady value of 0.6 MΩ cm2 after 9 d. The layer formed in the presence of Ce(NO3)3 exhibited better inhibition properties compared to that in CeCl3, but the rapid drop was probably related to the formation of some pits or defects in the layer formed. The best and most durable inhibition performance was achieved in a solution containing Ce(OAc)3. The |Z10 mHz| values slightly fluctuated but remained between 2.0 and 2.5 MΩ cm2 during the immersion period. These results indicate that the layer formed in the DHS+Ce(OAc)3 solution can resist localized corrosion attack. The increase in low-frequency impedance was related to the precipitation of the protective Ce oxide layer and inhibition of the corrosion process. 69
These EIS results demonstrated the importance of choosing the appropriate cerium salt to be added to the DHS due to the synergistic effect between Ce3+ cations and corresponding anions (NO3 – and CH3COO–), promoting passivation and buffering effects. 43–45 The addition of Ce(OAc)3 to NaCl produces a buffering effect, maintaining the solution pH at 8.3, so that it is less sensitve to local pH changes driven by the cathodic reaction. 43 In contrast, in unbuffered NaCl solution, pH quickly increases above pH 10, where aluminum is prone to dissolution.
Composition and morphology of AA7075 after 6 h of immersion
XPS analysis
Based on results obtained with electrochemical measurements, the XPS analyses were performed on the AA7075-T6 samples after 6 h of immersion in DHS with and without added CeCl3, Ce(NO3)3 and Ce(OAc)3 aiming to reveal the chemical composition and speciate the elements in the surface layers. XPS senses the surface layer of ca. 10 nm and does not have sufficient lateral resolution to study individual IMPS so it provides an average composition of the matrix and IMPs.
The survey XPS spectrum of AA7075-T6 immersed in DHS identified Al, O, S, Cl, and C (Fig. S5, Table II). The Al and O were related to aluminum alloy and the native oxide film. S (2.7 at%) and Cl (0.7 at%) originated from the corrosive medium (DHS); the sulfate ions (SO4 2−) were probably adsorbed (forming a complex) on the alloy surface, 70,71 while Cl− ions reacted with aluminum alloy forming AlCl3. 43 Carbon can be characterized as adventitious and was not analyzed further.
Table II. XPS surface composition obtained from survey spectra for (Fig. S5) for AA7075-T6 in dilute Harrison's solution (DHS) without and with added 3 mM CeCl3, Ce(NO3)3 and Ce(OAc)3.
| Atomic percentage (at%) | O | C | Al | S | Cl | N | Ce |
|---|---|---|---|---|---|---|---|
| DHS | 52.4 | 30.3 | 13.9 | 2.7 | 0.7 | ||
| DHS+CeCl3 | 46.7 | 37.7 | 11.8 | 2.4 | 0.4 | 1.0 | |
| DHS+Ce(NO3)3 | 47.6 | 35.2 | 12.5 | 3.2 | 0.6 | 0.8 | 0.1 |
| DHS+Ce(OAc)3 | 46.5 | 39.2 | 10.1 | 3.3 | 0.2 | 0.7 |
In solutions with DHS+Ce salts, the main differences in the survey XPS spectra were the presence of peaks related to cerium and a decrease in Al content. These results aligned with the electrochemical data, confirming the formation of the cerium conversion layer after 6 h of immersion in cerium-containing media. The content of Ce ranged between 0.1 and 1.0 at%, with lower values for Ce(NO3)3 and higher for Ce(OAc)3 and CeCl3 (Table II); however, it should be noted that the quantification below 1 at% is unreliable in XPS but still there was a comparative difference between the measured spectra. For the sample immersed in DHS+Ce(NO3)3, a small N 1s peak was detected related to N−O/Al bond (Figure S5).
The composition of the aluminum alloy surface was further analyzed with high-resolution XPS spectra of the selected elements (Fig. 11). The broad peak in Al 2p spectra at 74.9 eV can be associated with the native oxide layer (Al2O3 at 75.7 eV) and/or Al(III) oxyhydroxide (AlOOH at 74.2 eV) formed during immersion in DHS (Fig. 11a). The peak related to Al metal at 71.0–71.5 eV was not identified, indicating that the surface oxide was greater than ca. 10 nm in thickness. In DHS+Ce salts, the spectra were similar, with a broad peak centered at somewhat higher binding energy, 74.9 eV. It can be hypothesized that this peak is associated with the native oxide layer and very thin mixed Al–Ce oxide/hydroxide deposits.
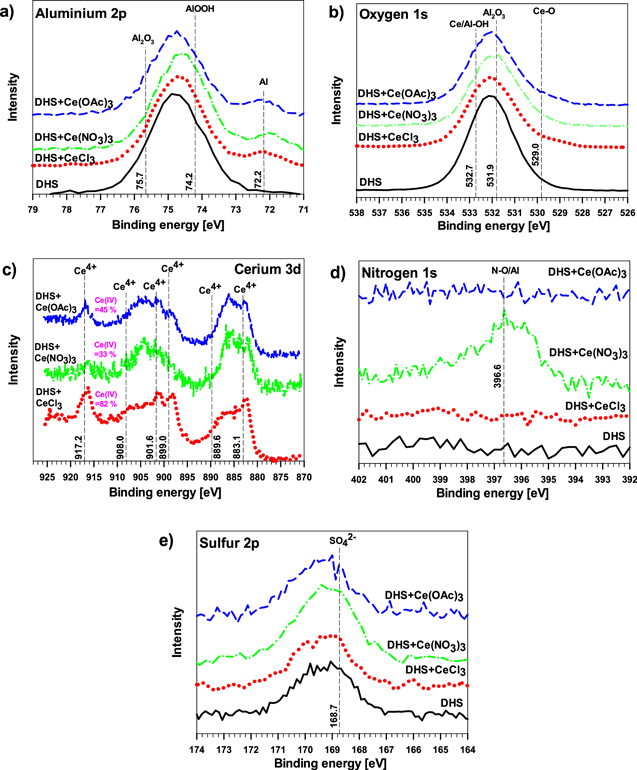
Figure 11. High-resolution XPS spectra (a) Al 2p, (b) O 1s, (c) Ce 3d, (d) N 1s and (e) S 2p of AA7075-T6 immersed for 6 h in dilute Harrison's solution (DHS) with and without added 3 mM CeCl3, Ce(NO3)3 and Ce(OAc)3. The surface composition is given in Table II.
Download figure:
Standard image High-resolution imageThe O 1s spectra showed a similar broad peak for all immersed samples (Fig. 11b). Aluminum oxide and hydroxide appeared at similar binding energy (Al2O3 531.9 eV and Al−OH 532.7 eV). In DHS with added Ce salts, the contribution of Ce oxide/hydroxide was expected as well, Ce–O at 529.5 eV and Ce–OH at 532 eV, due to the presence of Ce 3d peaks. 72,73
The high-resolution XPS Ce 3d spectra (Fig. 11c) showed peaks related to the mixture of cerium species Ce(III)/Ce(IV) with five peaks corresponding to Ce(III) and Ce(IV) features at 882.7, 886.6, 898.3, 901.3 and 907.3 eV and a Ce(IV) satellite at 916.7 eV. The latter peak appeared for all three Ce salts indicating that both Ce(III) and Ce(IV) species were present in the layers formed. It seems that the ratio Ce(III)/Ce(IV) may vary with the type of Ce salt, but a more detailed analysis was beyond the scope of the present study.
The N 1 s spectra showed a broad peak only for DHS+Ce(NO3)3 immersed sample (Fig. 11d). The peak appeared at similar binding energy to most other oxygen species (N−O/Al 396.6 eV). As reported previously, 17,39 nitrate ions could passivate the Al surface, consequently reducing the possibilities for cerium film deposition, which requires a cathodic reaction to proceed and causes a rise in pH. This process affects the course of inhibition by cerium cations as well.
The sulfur S 2p spectra confirmed the presence of sulfur at the surface (Fig. 11e). The S 2p spectrum comprises S 2p3/2 and 2 p1/2 peaks that differ by only 1.1 eV and are not usually differentiated as two separate peaks. SO4 2− ions added in the form of (NH4)2SO4 are dissociated in an aqueous solution as SO4 2− and HSO4 −. Both ions are capable of adsorption on the aluminum surface or forming a complex with other ions, such as Ce(OH)SO4. 44 The peak center at 168.6 eV is consistent with the formation of SO4 2− which is expected in the range of 168.6–169.5 eV. 73
The XPS data confirmed that the deposition of Ce(III)/Ce(IV) layers occurs in DHS. The action of additional anions present in the solution (ammonium and sulfate ions) affects the course of the deposition, resulting in their reaction with the Al substrate and incorporation in the layers formed. These results correlate with the electrochemical data described above.
SEM/EDS analysis
Bulk AA7075-T6 samples before and after 6 h of immersion in DHS with and without added CeCl3, Ce(NO3)3 and Ce(OAc)3 were further characterized by low-voltage SEM/EDS. The aim was to elaborate on the layer characteristics as a function of a cerium salt. Usually, higher electron voltages (10 kV) have been adopted for SEM/EDS analyses because the incident electrons excite the K-shell emissions for light elements to 3d transition metals, and high electron beam currents are easily achieved. In this study, the spatial resolution was increased by reducing the size of the X-ray generation volume at a lower accelerated voltage (Fig. S6). According to Monte Carlo calculations, the imaging and EDS analysis can be performed at a minimum of 5 kV because EDS analysis requires using L lines for first-row transition elements (Fig. S6).
The BSE SEM images of a selected IMP in the bulk AA7075-T6 alloy surface before and after 6 h of immersion are presented in Fig. 12. The same spots on selected Al-Cu-Fe-rich IMPs were imaged but analyzed only after immersion (to prevent the effect of surface activation during surface analysis). The impurities seen before and after immersion on the alloy surface were polishing residuals identified when imaging using a low voltage but were otherwise not identified at 10−15 kV.
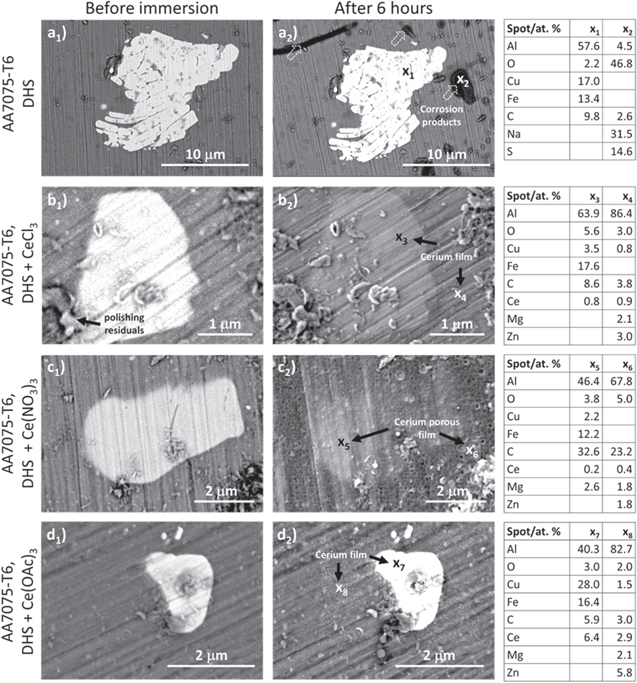
Figure 12. (a) Backscattered SEM image (5 kV) of Al-Cu-Fe IMP in bulk AA7075-T6 before and after 6 h of immersion in dilute Harrison's solution (DHS) with and without added CeCl3, Ce(NO3)3, Ce(OAc)3. The white arrows mark the corrosion products and the black arrows the formed cerium layer. The composition given in atomic percentage (at%) determined by EDS at marked spots from x1 to x8 is given in the tables on the right.
Download figure:
Standard image High-resolution imageAfter 6 h of immersion in DHS solution, there was no evidence of corrosion damage near IMPs, such as pitting or other local types of corrosion, which is typical for immersion in 3.5 wt% NaCl solution. 34,68 The EIS data in this solution indicated a decrease in low f impedance only after about 16 h. The selected Al–Cu–Fe-rich IMPs (denoted by spot x1) remained virtually unchanged, but several dark-colored spots of corrosion products (denoted by spot x2) were noted. These could be related to less corrosion-resistant MgZn2 IMPs in the alloy matrix. The presence of a great amount of O, Na and S reflected the reaction of the matrix/IMPs with a corrosive medium resulting in the formation of corrosion products and complexes (Fig. 12a2).
In DHS containing Ce salts, the situation changed (Figs, 12b2, 12c2, 12d2). Comparing the SEM images before and after 6 h of immersion shows that the Ce layers of various thicknesses and morphologies were formed. The cerium layer formed in DHS+CeCl3 (Fig. 12b2) was detected on the IMP, spot x3 (3.1 wt%) and the surrounding matrix, spot x4 (4.3 wt%). It should be noted that due to the overlapping of Ce M peak and Cu Lα peaks recorded at the low voltage the EDS quantification is less reliable (Fig. S6).%.
The cerium layer formed in DHS+Ce(NO3)3 did not uniformly cover the surface after 6 h because several other defects were noted. The amount of Ce was lower on IMPs, spot x5 (1.2 wt%) and matrix, spot x6 (2.2 wt%) than in DHS+CeCl3. In DHS+Ce(OAc)3, the content of Ce on IMPs and matrix was the largest among the Ce salts, i.e. 6.4 wt% and 2.9 wt%, spots x8 and spot x7, respectively (Fig. 12d2).
These results confirmed that after 6 h of immersion, some minor differences in the formed cerium layers vs cerium salts could be noticed, with Ce(OAc)3 forming the most compact layer.
Stages of corrosion and inhibition
This study aimed to give answers to the following questions:
- (i)What is the role of IMCs in AA7075-T6 in the initiation of corrosion in DHS compared to 0.1 M NaCl?
- (ii)Do cerium salts act as corrosion inhibitors in DHS, and is there an effect of the type of cerium salt used?
- (iii)Can the combination of micro and macro approaches better describe the initial stages of corrosion and inhibition?
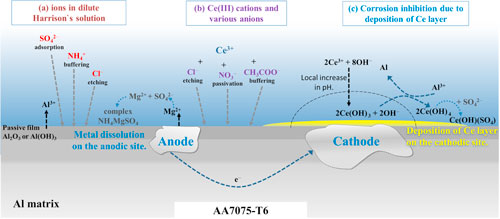
(i) AA7075-T6 is less susceptible to corrosion in DHS than in NaCl, as reported in our previous study. 28,46 In this study, we investigated this further by evaluating the corrosion behavior of characteristic synthetic IMCs. The susceptibility of IMCs individually to localized corrosion in DHS increases in the order Al2Cu < Al7Cu2Fe < Al2CuMg < MgZn2, evidenced by increased corrosion current density (Fig. 4). Also, all three Al–Cu-based IMCs showed much lower susceptibility to corrosion in DHS than in NaCl, whereas MgZn2 showed the opposite behavior. A schematic presentation of the corrosion and inhibition stages and the possible effects of different anions in DHS is given in Fig. 13. The composition of DHS with Cl–, NH4 + and SO4 2– anions has an important impact on the corrosion behavior (Fig. 13a): chloride ions act as an etchant but their concentration in DHS of 0.00085 M is much lower compared to 0.1 M or 0.5 M commonly used in corrosion studies. Ammonium ions act as a buffering agent, reaction 2, and a complexant. Aluminum does not tend to form strong ammine complexes (metal complexes with at least one ammonia ligand). 74 Generally, Al with 3+ charge has a strong hydrolyzing tendency and affinity to oxygen. 1,2 Al as a p-block element differs from d-block elements like Co(III) and Cr(III), which form strong complexes with ammonia. 74 Copper ions also form strong tetrammine complexes [Cu(NH3)4]2+. 75 However, the concentration of Cu2+ ions dissolved from AA7075 available for complexation with ammonia is rather low. The Cu-rich remnants formed by dealloying of Al and Mg from IMPs comprise Cu particles that can either remain intact or detach from the alloy surface and in the surrounding area. 35,60 On the other hand, sulfate anions play a role in the passivation of Al alloys due to their affinity to adsorb on the surface, thus forming a protective complex with the surface oxide. 43 This is substantiated by XPS results confirming the presence of sulfur in the oxide layer (Fig. 11).
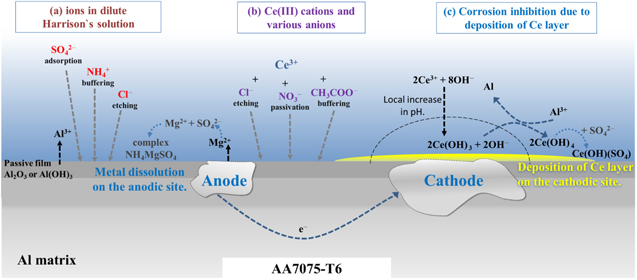
Figure 13. Schematic presentation of (a) effect of various anions (NH4 +, SO4 2− and Cl−) in dilute Harrison's solution, and (b) effect of cerium(III) cations and corresponding anions (Cl−, NO3 − and CH3COO−) on the surface of AA7075-T6. Corrosion inhibition due to the deposition of the cerium layer is presented in (c). The precipitation of Ce species proceeds mainly on the cathodic sites and progressively spreads over the alloy surface; meanwhile, the Mg and Al are slowly dissolved from the anodic sites.
Download figure:
Standard image High-resolution imageMgZn2 behaved differently than Al–Cu-containing IMCs with an Ecorr as much as 600 mV more negative and several orders of magnitude higher icorr. MgZn2 also differs from other IMCs because it showed much higher susceptibility to corrosion in DHS than in NaCl, reaction 3. The reason is the high activity of Mg in the presence of ammonium ions, which promote dissolution, as observed by Harrison and Tickle. 21 It was reported that DHS causes Mg to corrode faster. 20,62 Therefore, concerning issue (i), it can be stated that the presence of sulfate and smaller content of chloride ions improve the passivity of Al-Cu containing IMCs, but the presence of ammonium ions promotes the corrosion of MgZn2 and formation of soluble complexes (Fig. 13a).
Considering that these IMPs are present in AA7075-T6, it might be expected that the alloy would exhibit similar differences between DHS and NaCl. Indeed, after 1 h of immersion in DHS, AA7075-T6 exhibits current smaller densities than in NaCl. The differences in the alloy response are, however, smaller compared to those of IMCs, proving that the behavior of IMCs does not directly translate to a complex system of an alloy.
(ii) The localized deposition of the cerium conversion layer is driven by the micro-galvanic couples between different local potentials at the aluminum surface. Corrosion potential difference, calculated as ΔEcorr = Ecorr,IMC − Ecorr,alloy, reflects the relative nobility of the particular IMC with respect to the AA7075-T6 matrix where a negative ΔEcorr value denotes a less noble IMC and a positive value indicates a more noble IMC. ΔEcorr were determined after 30 s of immersion (IMCs) and 3 min of immersion (alloy) (Tables SI and SII). Figure 14 presents ΔEcorr for different IMCs in the four solutions: DHS, DHS+CeCl3, DHS+Ce(NO3)3 and DHS+Ce(OAc)3. In DHS (black bars), Al2Cu and Al7Cu2Fe are more noble than the alloy (the former more than the latter, i.e. 150 mV and 20 mV in DHS). Al2CuMg and especially MgZn2 are less noble IMCs. MgZn2 is almost 600 mV less noble than the alloy in DHS. The ΔEcorr changed significantly with the addition of Ce salts. In DHS+CeCl3 (red bars), all Al–Cu-based IMCs became more noble compared to DHS; the shift was the largest for Al2Cu (up to 510 mV), followed by Al7Cu2Fe and Al2CuMg. The latter changed its mobility from less to more noble than the alloy upon adding CeCl3 and was also more noble in solutions containing nitrate and acetate salts. The same is true for Al7Cu2Fe.

Figure 14. Corrosion potential difference (ΔEcorr) presented for intermetallic compounds Al2Cu, Al2CuMg, Al7Cu2Fe and MgZn2 in dilute Harrison's solution (DHS) with and without added 3 mM of cerium chloride CeCl3, cerium nitrate Ce(NO3)3 and cerium acetate Ce(OAc)3. ΔEcorr = ΔEcorr,IMC − ΔEcorr,alloy.
Download figure:
Standard image High-resolution imageFor MgZn2, the ΔEcorr became less negative with the addition of Ce salts in the order Ce acetate < nitrate < chloride. The difference in nobility increased in the same order for Al2Cu. These data confirm that the formation of Ce inhibitor layers increases the nobility of IMCs. This behaviour is valid after short immersion; it was shown that at more extended immersion, the Ecorr of the alloy shifted in the positive direction, thus changing the relative nobility of IMCs (Fig. 7). Among Ce salts, acetate exhibits the strongest ability to increase the positive ΔEcorr of Al–Cu IMCs and to decrease the negative ΔEcorr of MgZn2 IMC. For this particular system, this is important due to the requirement of reaching a sufficient pH for the deposition of the Ce inhibitor layer.
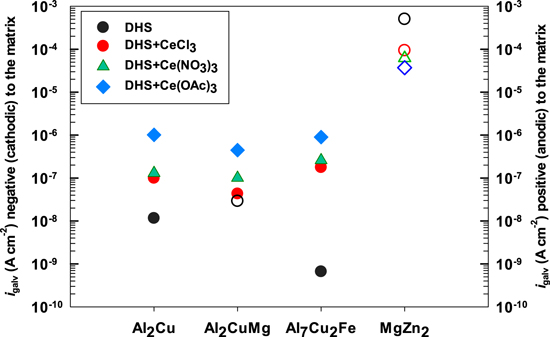
Another parameter worth considering is the galvanic current density, igalv, which was taken to be the current density from the polarization curve of each IMC (Figs. 6 and 7) at the alloy Ecorr. The methodology is presented in Fig. S7. The value of igalv will be negative or positive if the IMC is more or less noble than the matrix, respectively. igalv values for the four IMCs, and AA7075-T6 in DHS with and without added Ce(III) salts are presented in Fig. 15. In DHS, Al2Cu and Al7Cu2Fe show negative igalv indicating these IMCs are more noble than the alloy matrix, especially the former. Al2CuMg and especially MgZn2 show positive igalv, meaning these IMCs would dissolve at a high rate within the alloy. 6 After adding Ce(III) salts, the igalv of more noble IMCs increased. The opposite might be expected because Ce salts are cathodic inhibitors of the alloy, but, as will be discussed further below, the immersion time during microcell measurements was too short to establish the conditions for inhibition. For the less noble MgZn2, the addition of Ce salts reduces the igalv.
Figure 15. Galvanic current density (igalv) presented for intermetallic compounds Al2Cu, Al2CuMg, Al7Cu2Fe and MgZn2 in dilute Harrison's solution (DHS) with and without added 3 mM of cerium chloride CeCl3, cerium nitrate Ce(NO3)3 and cerium acetate Ce(OAc)3. Filled symbols denote cathodic igalv (left y-scale), and open symbols denote anodic igalv (right y-scale).
Download figure:
Standard image High-resolution image
Further, the relative nobility of a particular IMP also affects the course of the process by controlling dealloying. 40 The latter process is the critical stimulus for further inhibition due to the increased cathodic action leading to a rise in pH required for the deposition of Ce hydroxide (Fig. 13c) at a high enough pH of around 8.5. 43 Anions of Ce salts also affect the course of the process (Fig. 13b): Cl− ions etch the Al oxide native layer and thus stimulate the initial activation of the surface. Notably, adding 3 mM CeCl3 increases the chloride concentration in DHS by 30% (from 0.0085 to 0.0115 M); the addition to, for example, 0.1 M NaCl solution causes only a 3% increase in chloride concentration in the solution. Since the results show that CeCl3 performed worse than acetate and nitrate Ce salts (Figs. 7 and 10), the substantial increase in Cl− content in DHS seems to affect the inhibitive ability of CeCl3 in this particular solution. In 0.1 M NaCl, this effect was not so pronounced, and the layer formed in CeCl3-containing solution showed better inhibition effectiveness than, for example, that formed with added Ce(NO3)3. 46 NO3 − can passivate the surface and decrease the area available for inhibition. CH3COO− anions have a buffering effect and mitigate the dealloying of the substrate. 43,52 In DHS, these anions can form a complex with sulfate ions. 43,44 All three Ce salts act as inhibitors of AA7075-T6, as shown by the macrocell measurements. The highest degree of prolonged inhibition was achieved by Ce(III) cations together with acetate anion. The explanation lies in the optimal combination of buffering effect, i.e. more extended maintenance of pH suitable for deposition of Ce(III) hydroxide. 43
(iii) The third issue concerns the combination of micro- and macrocell approaches. It should first be noted that the sizes of the analyzed sites differ by 3 orders of magnitude: for the microcell, it is 50 · 10−6 cm2, and for the macrocell, 0.95 cm2 (Fig. S8). Giving the heterogenicity of AA7075-T6 and IMC surfaces, it is even more challenging to obtain comparative analyses. The two approaches gave the contradictory result that all Ce salts initially activate corrosion of IMCs, as shown by microcell measurements but work as inhibitors in the long-term for AA7075-T6, as shown by macrocell measurements. This apparent contradiction can be explained by considering that the dissolution reaction precedes the inhibition reaction. In general, inhibitors are much less efficient when used on a surface already covered by a surface layer, as well known in industrial practice, where all surfaces are mechanically or chemically cleaned before the subsequent protection step. Therefore, initial etching of the native oxide layer may be stimulative for subsequent inhibition by exposing the available active sites. The initial shift of Eoc from negative to positive potentials of AA7075-T6 upon immersion is attributed to the dissolution of alloying elements and the native oxide layer (Fig. 6a). Microcell measurements performed on IMCs captured the initial 30 s after placing IMCs in contact with an aggressive solution, DHS or NaCl, with pH around 5.6. Under these conditions, even in the presence of Ce salts, inhibition is not feasible because the conditions for precipitation of Ce-hydroxides have not yet been established (short immersion time is insufficient to reach local pH > 8). Therefore, the microcell measurements performed in this work after 30 s of immersion reflected the initial activation stage but could not reflect the subsequent inhibition. Macrocell measurements proved the latter process over a prolonged period. Nonetheless, microcell results offer valuable data on the behavior of individual IMC in particular solutions and provide an assessment of their role in the overall electrochemical response of the alloy. It is also notable that the electrochemical activity of IMPs leading to the alkalization required for the deposition of Ce hydroxide is not the same as in synthetic IMCs. In other words, the distribution of cathodic and anodic sites is different. How this issue affects the deposition of Ce hydroxides should be studied further.
Conclusions
The corrosion in dilute Harrison's solution was evaluated on synthetic Al2Cu, Al2CuMg, Al7Cu2Fe, MgZn2 intermetallic compounds and on bulk AA7075-T6. The electrochemical parameters using micro- and macrocell approaches confirmed different initial actions of each intermetallic compound in DHS and NaCl solution due to the presence of NH4 + and SO4 2− ions. Cu-based IMCs are passivated in DHS because of lower chloride concentration and also partially due to the formation of the protective layer containing sulfate ions. In contrast, ammonium ions promote high dissolution of MgZn2, which corrodes faster in DHS than in NaCl. In terms of relative nobility in DHS, Al2Cu and Al7Cu2Fe are more noble when coupled with matrix, whereas Al2CuMg and especially MgZn2 are less noble and thus susceptible to dissolution.
Microcell measurements on IMCs showed that the addition of all cerium salts (CeCl3, Ce(NO3)3, and Ce(OAc)3) initially (within 30 s) promoted dissolution. During long-term immersion, electrochemical data obtained with macrocell proved that all Ce salts acted as corrosion inhibitors, and the most efficient was Ce(III) acetate. The inhibitor action is time-dependent.
Micro and macro approaches give essential information on the galvanic relation between the IMPs and Al matrix under different conditions in the presence and absence of different cerium salts or other inhibitions, which brought about valuable information concerning the corrosion inhibition and synergism with other ions present in the corrosion media.
Acknowledgments
This study was conducted within the bilateral project between Slovenia and the United States of America (project No. BI-US/15–16–006) and Interreg Italia-Slovenia Nano-region (project PoC#7). The financial support was provided by the Slovenian Research Agency (research core funding No. P2–0393 and No. P1–0134). The authors acknowledge Barbara Kapun and Dr Bojan Ambrožič for FIB/SEM-EDS analyses. Center of Excellence in Nanoscience and Nanotechnology (CENN) is acknowledged for using FIB/SEM/EDS, and the Department of Surface Engineering for using XPS.
Supplementary data (3.3 MB DOCX)