

Abstract
Two Co-alloy-coated steels with 1.0 wt% and 3.0 wt% Mn content were subjected to 1000 h of thermal exposure (750 °C) in air. The coated alloys displayed an increased oxidation rate as the Mn content varied between 1.0 wt% and 3.0 wt%. And Co coating was thermally converted into a three-layer structure composed of Cr-rich oxide (inner layer), mixed oxide with Co, Fe, Mn and Cr (middle layer) and doped Co3O4 spinel oxide (outer layer). Regardless of the Mn content, only a small amount of Mn was incorporated in the Co3O4 spinel. The area specific resistance for the Co-coated Fe-Cr containing 1.0 wt% Mn was as low as 5.37 mΩ cm2 subsequent to oxidation (lasting for 1000 h). Compared to the cathode with the uncoated alloy present, the polarization resistance of the cathode in the presence of the Co-coated alloy increased very slowly under the conditions of open circuit potential set as 750 °C and 200 h, and Cr deposition on the cathode surface declined noticeably. This showed that the Co coating effectively inhibited outward diffusion of Cr to poison the cathode during long-term exposure.
Export citation and abstract BibTeX RIS
As widely applied to solid oxide fuel cell (SOFC) interconnects, ferritic stainless steels are regarded as common interconnect materials on account of their low cost, good formability, excellent oxidation resistance, high electrical and thermal conductivity, as well as being a reasonable match with neighboring ceramic cell components in terms of coefficient of thermal expansion (CTE) at around 10 × 10−6 K−1. 1 The ferritic stainless steels are inevitably oxidized to form a Cr2O3 oxide scale to protect them against further attack in fuel and oxidant atmospheres. However, the oxide scale growth results in an increase in the scale area specific resistance (ASR). 2 It is even worse that the Cr oxide scale will react with ambient gas containing H2O and O2 to form CrO3, CrO2(OH)2 and other volatile oxides. 3–5 Moreover, volatilized Cr species would migrate to the cathode and degrade the electrochemical performance of the SOFC. 6,7
Various materials have been proposed and investigated as the surface coatings. 8 Spinel oxides, such as Co3O4, Mn-Co and Ni-M (M=Mn, Co, Fe) 9–18 have been attracting extensive attention because of their high electrical conductivity and similar CTE to adjacent cell components. In particular, a Mn-Co coating is proving to be effective in slowing down the growth rate of the oxide scale, improving electrical properties and restraining Cr out-diffusion as a barrier, thus, suppressing the generation of volatile Cr-containing species. 10 Therefore, a Mn-Co coating, with more favorable electrical conductivity (60 S cm−1) plus CTE match (9.7 × 10⁻⁶ K−1), has been regarded as the most potential interconnect coating material for SOFCs. 19 A wide variety of techniques can be used for Mn-Co coating fabrication, including sol-gel methods, 20 electrophoretic deposition, 21 magnetron sputtering, 22 plasma spraying 23 and electroplating. 24 Among these coating deposition techniques, electroplating is widely used because of its low cost and the ability to deposit a uniform coating on a complicated geometry.
It is well known that adding a small amount of Mn into the alloy will lead to a double-layered structure produced on the oxide scale, including Cr2O3 on the bottom of (Mn, Cr)3O4. The (Mn, Cr)3O4 spinel as the outer layer will effectively enhance the oxide scale from the electrical conductivity aspect, and also mitigate the volatilization rate of the Cr species. 25 In the case of further increased Mn content, Mn2O3 and Mn3O4 oxides form on the double layered structure oxide scale at the top by faster outward diffusion of Mn ions, instead of Cr ions, in Cr2O3. 26 A metallic Co coating is one of the most favorable coating materials that is thermally converted to a spinel by oxidation. 27,28 Therefore, converting the Co-coated layer into a Mn-Co spinel via Mn out-diffusion from the Mn-containing ferritic stainless steels is considered as a hopeful coating strategy. To understand whether it is possible to manufacture a Mn-Co coating using the Co-coated layer through thermal conversion and Mn out-diffusion, two Fe-Cr alloys with 1.0 wt% and 3.0 wt% Mn content were prepared as substrates, respectively. It is also necessary to investigate the function of the Co coating in influencing Fe–Cr alloys from the aspect of oxidation resistance together with electrical conductivity under the working conditions of the SOFC cathode. Furthermore, under the operating conditions of the SOFC, the Cr volatilization from the oxide scale formed on the Co-coated alloy and deposition into the cathode were evaluated, with electrochemical impedance spectroscopy (EIS) analysis and microstructure as the basis.
Experimental
In terms of the substrates for the present study, the Fe-Cr based alloys with 1.0 wt% and 3.0 wt% Mn contents were designed, whose compositions are exhibited in Table I. They were prepared with high-purity elemental materials by arc melting in vacuum. The ingot was processed into 1 mm thick sheets by forging (1050 °C-1100 °C), hot rolling (1100 °C) and cold rolling, subsequently by conventional heat treatment (800 °C for 1 h). 26 Electric discharge machining was adopted to prepare the alloy specimens with dimensions of 19 × 19 × 1 mm3, and then ground with SiC papers up to 1200-grit, followed by mechanical polishing. Before electroplating, the polished specimens firstly underwent ultrasonic cleaning with acetone prior to degreasing with a solution mixed with NaOH (20 g l−1), Na2CO3 (20 g l−1) and Na3PO4 (20 g l−1) at a current density of 4 A/dm2. After ultrasonic cleaning they were dipped in a 15% HCL and 3% HNO3 mixture for 10 s to remove the oxide scale of the alloy and then rinsed with distilled water again. Subsequently, they were placed in mixing acid with 10 ml l−1 H2SO4 and 1 ml l−1 HCL for 30 s to improve the efficiency of the electroplating. Finally, pre-cobalt plating was carried out by virtue of an electrolyte containing CoCl2 6H2O (90 g l−1) blended with 37% HCl (90 ml l−1) for 5 min, which can improve greatly the attachment of coating layers obtained thereafter to substrate. Table II provided the composition together with the operating conditions. The specimens served as cathodes which were set symmetrically between two vertically hung anodes of cobalt metal plates.
Table I. Elemental composition of Fe–17Cr alloy (wt%).
| Mn | Cr | C | S | P | Si | Fe |
|---|---|---|---|---|---|---|
| 0.99 | 16.76 | 0.001 | 0.006 | 0.0098 | 0.043 | Bal. |
| 2.84 | 16.90 | 0.002 | 0.008 | 0.0088 | 0.0036 | Bal. |
Table II. Composition and operating conditions of the electrolytic baths for Co electroplating.
| CoSO4 · 7 H2O | 200 g l−1 |
| NaCl | 15 g l−1 |
| H3BO3 | 35 g l−1 |
| C12H25SO4Na | 0.1 g l−1 |
| C7H5O3NS | 1.5 g l−1 |
| Deionized water | Other g l−1 |
| pH | 3.5 ∼ 3.8 |
| Temperature | 35 °C |
| Current Density/mA cm−2 | 19 mA cm−2 |
| Plating time/min | 30 min |
| Anodes | Pure cobalt |
The plated specimens were subjected to 1000 h of high temperature (750 °C) cyclical oxidation in air, which were taken out after the designed cycle interval. The weight of the specimen prior and subsequent to oxidation was measured and recorded by means of a Huazhi electronic balance (accuracy: 10−5 g), so as to calculate the weight gain due to oxidation. The square of the weight gain in the specific area against the isothermal time was computed to plot the oxidation kinetics curve.
PANalytical X'Pert PRO X-ray diffraction (XRD) with Cu radiation under the conditions of 40 kV and 40 mA was utilized to distinguish the phase structures in the electroplated Co coating and thermally grown surface oxides. The angle between the incident ray and the surface of the samples was fixed at 1.2°. The scanning rate was about 10 min, and the scanning angle ranged from 20° to 80°. Scanning electron microscopy plus energy-dispersive X-ray spectroscopy (SEM/EDS) was conducted to explore the electroplated Co and its oxidized layer for its composition and/or surface and cross-section microstructure. After the oxide scale was generated on the Co-coated alloy through oxidation (750 °C, 1000 h in air), its electrical property was determined in air by virtue of the standard four-probe direct current technology with a constant current density of 200 mAcm−2 under the temperature ranging from 600 °C to 850 °C.
Furthermore, an electrolyte pellet was prepared with GDC powder (Ce0.9Gd0.1O2-δ, fuel cell materials) by die pressing and subsequent sintering (6 h in air at 1450 °C). Next, both sides of the pellets underwent polishing until the surfaces were parallel, and the dimensions were 8 mm diameter and 5 mm thick. LSCF slurry (formulated in-house) was applied on both sides of the GDC pellets (specific area: 0.316 cm2) via screen printing, so as to fabricate the La0.60Sr0.40Co0.20Fe0.80O3-x (LSCF) electrode that acted as either the working or the counter electrode, and 3 h of sintering in air (1050 °C) was conducted. The pellet was cut from the middle to create a narrow groove, along which the Pt wire was placed, becoming a reference electrode.
A piece of coated or uncoated Fe–Cr alloy in the dimensions of 5 × 5 × 1 mm3, as an interconnect, was compressively attached to the electrode top that served as the current collector. To evaluate the effect of Co-coated Fe-Cr on Cr-induced poisoning, electrochemical performance of the LSCF cathode was measured by a Gamry interface 5000E, using a three-electrode configuration. The literature 29 presented the symmetric cell configuration as well as the test settings. The operating conditions for the measurements were as follows: 750 °C, 200 h (with an interval of 1 h), dry air, and open circuit potential (OCP). The frequency ranged from 10−2 Hz to 105 Hz, and the amplitude was 10 mV. Besides, the difference between the high and low frequency intercepts was adopted to decide the polarization resistance (RP). The surface microstructure as well as the composition of the LSCF electrode was examined by a Sirion 200 field emission scanning electron microscope (FESEM) attached by an energy dispersive spectrometer (EDS).
Results and Discussion
Composition and morphology of the Co coating
The XRD patterns for the aforementioned coated Fe-Cr-1.0 wt% Mn alloy are displayed in Fig. 1. According to the International Center for Diffraction Data (ICDD) file, the diffraction peaks of the coating belong to Co (ICDD 01–1254). As for the Co-coated Fe-Cr-1.0 wt% Mn alloy, its surface plus the cross-section morphology are illustrated in Fig. 2. The surface is featured with randomly oriented flake-like grains, on which there is a net of tiny leaf-shaped structures as previously observed 30 (Fig. 2a); the cross-section is uniform and compact, with good adhesion to the substrate and a thickness at 4 μm–4.5 μm (Fig. 2b). Combined with the XRD and SEM results, the Co coating was successfully applied to the substrate surface with electroplating.

Figure 1. XRD pattern of the as-coated Fe–Cr–1.0 wt% Mn alloy.
Download figure:
Standard image High-resolution image
Figure 2. SEM surface morphology (a) and cross-section (b) of the as-coated Fe–Cr alloy with 1% wt% Mn content.
Download figure:
Standard image High-resolution imageOxidation Resistance
Through the 750 °C cyclic oxidation in air, the oxidation weight gains are exhibited in Fig. 3, which are composed of an oxidation time function for the Co-coated Fe–Cr alloys with 1.0 wt% and 3.0 wt% Mn content, respectively. The parabolic rate law containing two rate constants is approximately applicable to the oxidation kinetics. With regard to the coated Fe–Cr–1.0 wt% Mn alloy, for the oxidation period of 0 h–50 h and 50 h–1000 h, the kp values are 3.03 × 10⁻¹² g2 cm−4 s−1 and 6.32 × 10⁻¹⁴ g2 cm−4 s−1, respectively, lower than those for the uncoated Fe–Cr–1.0 wt% Mn alloy (8.8 × 10⁻¹⁴ g2 cm−4 s−1(0 h–200 h); 1.7 × 10⁻¹³ g2 cm−4 s−1(200 h–700 h)); for the oxidation period of 0 h– 50 h and 50 h–1000 h, the coated Fe–Cr–3.0 wt% Mn alloy has kp values of 5.09 × 10⁻¹² g2 cm−4 s−1 and 1.68 × 10⁻¹³ g2 cm−4 s−1, respectively, which also decline when compared with those of the uncoated one (with 3.8 × 10⁻¹³ g2 cm−4 s−1 (0 h–700 h)). 26 It can be seen that weight gains show a rapid growth in the first 50 h and becomes much slower afterwards for both alloys. The rapid-growing weight gain in the first 50 h is due to the fact that the electroplated Co metal coating is oxidized, and a Cr2O3 and Mn-Cr spinel double layer is generated due to faster diffusion of Mn ions in Cr2O3 than that of Cr ions. And as confirmed by the authors' previous study( Ref. 26), oxidation rate of the Fe-Cr-xMn alloys increases subsequently with the content of Mn in the alloy. It is corroborated by the slower weight gain that the Co coating is an effective barrier against oxidation, which suppresses Cr out-diffusion together with O in-diffusion to the Cr2O3 thickening and form of the Mn-Cr spinel.

Figure 3. Oxidation weight gain of the coated Fe–Cr alloy as a function of cyclic oxidation time at 750 °C in air.
Download figure:
Standard image High-resolution imageFor Co-coated Fe–Cr alloys with either 1.0 wt% or 3.0 wt% Mn content subjected to as long as 1000 h of 750 °C oxidation in air, the XRD patterns are shown in Fig. 4. On the basis of the coated oxide scale, the obtained single oxide phase of the Co3O4 was attributed to the transformation of the metal Co coating during the oxidation process. However, increasing the Mn content from 1.0 wt% to 3.0 wt%, the Co-coated layer was not successfully converted into the desired Mn-Co spinel coating via Mn out-diffusion from the substrate. Through a careful comparison of the diffraction pattern for the coated Fe–Cr-3.0 wt% Mn alloy after oxidation with the ICCD file, it was uncovered that the diffraction peaks, which are derived from the Co3O4 phase, manifest an overall right-shift relative to the ICCD file, indicating potentially impure Co3O4 and possible doping with elemental Fe, Cr and Mn coming from the substrate. According to Fig. 4, the diffraction patterns of Cr2O3 plus Mn-Cr spinel phase were not detected because of the thick coating.
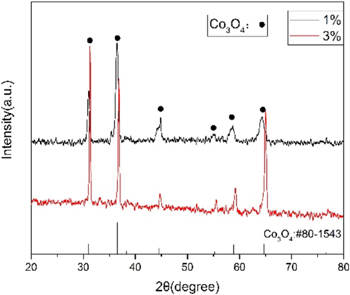
Figure 4. XRD pattern of the coated Fe–Cr alloy after 1000 h cyclic oxidation at 750 °C in air for 1000 h.
Download figure:
Standard image High-resolution imageThe cross-section and surface morphology of the coated Fe-Cr-Mn alloy receiving oxidation (1000 h in air, 750 °C), as well as EDS analysis, is presented in Fig. 5. The composition of the surface involves densely packed large facet particles (Figs. 5a, 5d). Spot EDS analysis suggests the particles mainly consist of Co and O, in addition to Fe, Mn, and Cr in small quantities. Importantly, the Cr concentration in the particle is <3 at% after 1000 h oxidation, showing excellent capability of blocking Cr out-diffusion. Furthermore, the thickness of the whole oxide layer was raised to 7 μm–8 μm, mainly because the inner Cr2O3 layer grew and kept adhering to the substrate (Figs. 5b, 5e). As shown by the EDS line scans, there is a three-layer structure in the surface oxide scale, including Cr-rich oxide (inner layer), mixed oxide with Co, Fe, Mn and Cr (middle layer) and doped Co3O4 spinel oxide (outer layer) (Figs. 5c, 5f). Obviously, the mixed oxide and doped Co3O4 spinel oxide layer was thermally converted by Fe, Mn and Cr diffusing outward from the alloy substrates and the electroplated Co coating. On the contrary, the growth of the Cr-rich oxide as the inner layer at the alloy/coating interface resulted from the production of a protective Cr2O3 layer via selectively oxidizing Cr in the substrate. It can be seen that the Cr concentration presents an abrupt decrease at the interface of inner and middle layers, namely, Cr-rich oxide and mixed oxide, indicating effectively inhibited Cr out-diffusion. Comparing the morphologies, structure and composition of the two alloys, both were very similar. The small difference between them is that the coated Fe-Cr-3.0 wt% Mn alloy has a thicker Cr-rich oxide as the inner layer than the coated Fe-Cr-1.0 wt% Mn alloy, which is consistent with results of oxidation weight gain. It is well known that the thick Cr-rich oxide scale increases the whole oxide scale in terms of the electrical resistance. For the purpose of attenuating the electrical resistance of the generated oxide scale, it is recommended to apply the Co coated Fe-Cr-1.0 wt% Mn alloy to the interconnect.
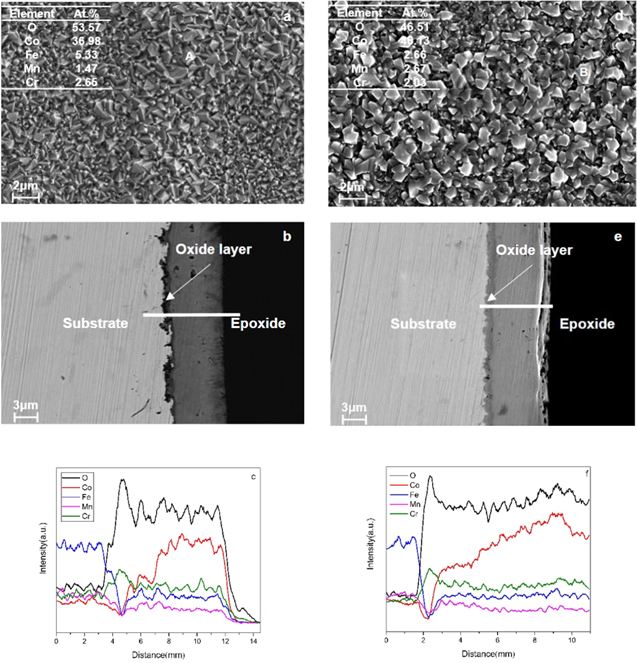
Figure 5. SEM surface morphology, cross-section and EDS line scan of the coated Fe–Cr alloy after 1000 h cyclic oxidation at 750 °C in air for 1000 h: (a, b & c)1.0 wt% Mn; (d, e & f)3.0 wt%.
Download figure:
Standard image High-resolution imageElectrical Conductivity of the Oxide Scale
Regarding the oxide scale obtained during the 1000 h cyclic oxidation, the Arrhenius plot of the ASR is exhibited in Fig. 6. With the temperature increasing, the ASR values decline within 600 °C–800 °C. Besides, log(ASR/T) has a linear proportion to 1/T, implying the electrical behavior of semi-conductors. However, for the coated Fe-Cr-1.0 wt% Mn alloy, the ASR values increased to 35.29 mΩ cm2 at 850 °C. This is because the contribution of the metallic substrate to the ASR cannot be neglected as its resistance is enhanced at high temperature. Moreover, the scale ASR of 5.37 mΩ cm2 at 750 °C decreased significantly in contrast with that of the coated Fe-Cr-3.0 wt% Mn alloy and uncoated Fe-Cr alloys suffering 750 °C oxidation (700 h in air). 26 The lowASR value is corresponding to the oxidation rate and oxide scale thickness of the alloys. The low ASR is caused by thinner Cr-rich oxide, higher electrical conductivity of the mixed (Fe, Mn, Cr Co)3O4 oxide and doped Co3O4 spinel formed on the coated Fe-Cr-1.0 wt% Mn alloy than that of the Cr2O3 and MnCr2O4 formed on the uncoated alloy after long-term oxidation.
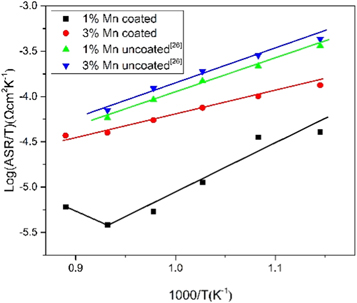
Figure 6. ASR of the coated Fe-Cr alloy cyclic oxidized at 750 °C in air for 1000 h.
Download figure:
Standard image High-resolution imageChromium Deposition
The rise of ΔRp/Rp0, a function of aging time under the OCP condition (synthetic air, 750 °C, with coated or uncoated Fe-Cr-1.0 wt% Mn alloys, 200 h) is displayed in Fig. 7. The initial values of ΔRp/Rp0 were very close. Subsequently, the values increased very slowly for the cell with the coated alloy present, but for the cell with the uncoated alloy present, the value increased quickly from the initial values, showing a significantly higher degradation rate. Additionally, such a degradation rate is positively associated to the concentration of Cr. 29 Therefore, the Co coating has a definitely direct influence on blocking the outward diffusion of Cr.
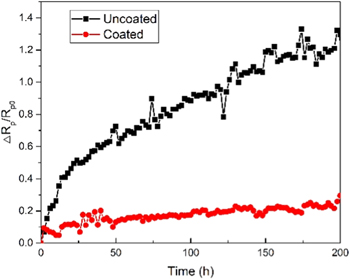
Figure 7. The degradation of ΔRp/Rp0 of cells as a function of aging time in the static air, under open circuit potential at 750 °C in the presence of coated or uncoated Fe-Cr-1.0 wt% Mn alloys for 200 h.
Download figure:
Standard image High-resolution imageFor the LSCF electrode surface exposed to coated and uncoated Fe-Cr-1.0 wt% Mn alloys (750 °C and 200 h), the SEM images (Fig. 8) reveal that the cathode surfaces with coated and uncoated alloys manifest different morphologies, indicating the significant effect of Cr poisoning on the cathode microstructure of the LSCF. On the surface in the presence of the coated alloy, fine particles containing La, Sr, Co, Fe and O, and Cr concentration distributed on the cathode surface cannot be detected (Figs. 8a, 8b). It can be inferred that the fine particles were an LSCF cathode. However, on the surface in the presence of the uncoated alloy, there were distinct crystal facet particles completely covering the entire surface, with a significantly larger grain size than the cathode particles. Moreover, on the surface, the formation of particles seemingly mainly involved Cr, O and Sr because the Sr map overlaps with the Cr map. It can be concluded that the particles are most probably SrCrO4. Accordingly, the metal Co coating can effectively prevent Cr volatilization from the inner Cr2O3 from poisoning the cathode.

Download figure:
Standard image High-resolution image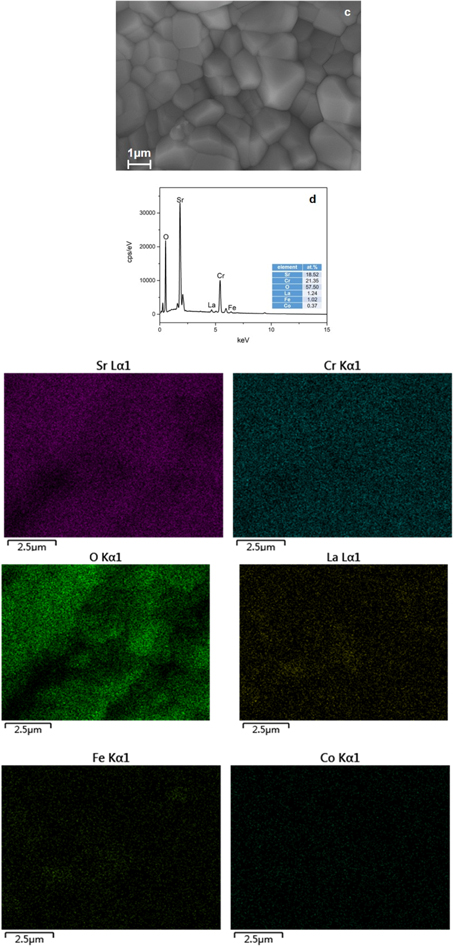
Figure 8. SEM micrographs of the cathode and corresponding EDS patterns after test under open circuit potential at 750 °C in the presence of coated (a & b) or uncoated (c & d) Fe-Cr-1.0 wt% Mn alloys for 200 h.
Download figure:
Standard image High-resolution image
Conclusions
Metal Co coating was successfully attained on two different Mn content Fe-Cr alloys by the electroplating method. The Cr out-diffusion was effectively alleviated because the tri-structure layer was produced on the surface of all the coated alloys. Although Mn ions in the Cr2O3 had high diffusivity, only a small amount of Mn could be obtained from the Co3O4 spinel, and the desired Mn-Co coating was not formed during the oxidation process. The coated Fe-Cr-1.0 wt% Mn alloy has a lower oxidation rate and higher electrical conductivity during the long-term oxidation. Also, it is capable of restraining Cr volatilization from the oxide scale, subjected to thermal growth, from poisoning the cathode. The thermally converted coating presented excellent performance and prospects regarding the metallic interconnect for intermediate temperature SOFCs.
Acknowledgments
This research was financially supported by the National Key Research & Development Program of China (2018YFE0124700), the National Natural Science Foundation of China (51601173, 52272245, U1910209, 51972128), and the Foundation of State Key Laboratory of Coal Combustion (FSKLCCA2212).