
Abstract
Various Ni-rich Liy[Ni1−xMnx]O2 (x = ∼0.08, 0.2, 0.5) materials were synthesized with excess Li precursor in oxygen, dry air or air to understand what happens to the excess Li during synthesis. The Li[Ni1−xMnx]O2 components of the synthesized materials were single phase and synthesis in oxygen produced materials with less Ni in the Li layer. Inductively coupled plasma optical emission spectrometry (ICP-OES) and titration experiments on as-prepared samples and samples that were rinsed with water are useful in the determination of the amount of Li lost during heating, the amount of Li taken in by the material during synthesis and the amount of residual Li present in the samples as impurity phases. Materials synthesized in oxygen and dry air lost a similar amount of Li during heating but synthesis in air resulted in more Li loss. Synthesis in oxygen increased the lithium content, y, in the Liy[Ni1−xMnx]O2 materials. Materials with a higher Mn content can take in more Li to form Li-rich materials with larger values of y. From these experiments, the fate of Li can be tracked to heating loss, residual Li as impurity phases or uptake into the material as a function of Mn content and synthesis atmosphere.
Export citation and abstract BibTeX RIS

This is an open access article distributed under the terms of the Creative Commons Attribution 4.0 License (CC BY, http://creativecommons.org/licenses/by/4.0/), which permits unrestricted reuse of the work in any medium, provided the original work is properly cited.
As lithium ion battery technology expands into more applications, such as electric vehicles and grid storage, layered positive electrode materials remain at the forefront of research attention. Two classes of layered materials, Ni-rich and Li-rich, show potential in improving the energy density and lowering the cost of Li-ion batteries. Ni-rich (Ni > 80%) materials, namely Li[Ni1-x-yMnxCoy]O2 (NMC) and Li[Ni1-x-yCoxAly]O2 (NCA), have already been commercialized but efforts are being made to push the Ni content higher and reduce the Co content. 1–8 Li-rich materials, Li[LixM1-x]O2 (M = Ni+Mn, Ni+Mn+Co), are attractive due to a high specific capacity (>300 mAh g−1) from accessing oxygen redox activity. 7–12
NMC and NCA both stem from substituting the Ni in LiNiO2 (LNO) with Mn, Co or Al. The substitutions help alleviate some of the issues that face LNO such as a large volume change, poor lifetime, thermal instability and sensitivity to the Li content, but these issues are not fully solved. 3–5,8,13–18 Elaborating on the sensitivity of the Li content for Ni-rich materials, issues will arise for a material when there is too little or too much Li used in the synthesis. If the stoichiometry is Li deficient, Ni exists in both the +2 and +3 oxidation states to balance the charge. Some of the Ni2+ will migrate to the Li layer due to Ni2+ being a similar size as Li+, 19 and this negatively impacts Li diffusion, reversible capacity and rate capability. 3–5,8,20–22 On the other hand, excess Li during sintering will result in residual Li compounds that remain on the surface as impurities. These surface impurities have been shown to reduce the capacity, rate capability and capacity retention of materials. 22–28 However, there will be some amount of Ni in the Li layer and formation of residual Li compounds regardless of stoichiometry as the Ni content increases. 3,8,20,21,24–30
Li-rich materials have more Li than transition metals in the material and some of the Li occupy sites on the TM layer. The material can be thought of as a solid solution between LiMO2 (M = Ni, Mn, Co) and Li2MnO3. 7–9,11,12,31–36 Materials with a higher Mn content can take in more excess Li by forming a √3a × √3a superlattice of Li and transition metals in the TM layer. 31,32,36 While Li-rich materials are attractive due to their ability to access oxygen redox capacity and attain very high energy densities in the beginning (∼900 Wh kg−1), the energy density fades quickly due to a high 1st cycle irreversible capacity and voltage fade during cycling. 7–12,32,34,35,37 Many studies have been conducted to understand and mitigate the voltage fade but the issues are as yet unsolved and so far precludes the commercialization of Li-rich materials.
The transition metal compositions of Li-rich materials of interest generally contain less Ni and more Mn than Ni-rich materials of interest. However, with the push to reduce or eliminate Co, 6,15–18,38–47 there may be some overlap in the transition metal compositions. When this is the case, the only difference in the final material is the amount of Li. For example, samples with 50% Ni and 50% Mn can be made as single phases over the range from at least Li1+x[Ni0.5Mn0.5]1−xO2 for 0 < x < 0.25. 31,33,36,48,49 With higher synthesis temperatures, there needs to be some excess Li due to Li loss during heating. 22,49–55 Additionally, having some excess Li may decrease the amount of Ni in the Li layer. 31,36 There are some reports varying the amount of Li used in synthesis to understand the formation of Li-rich materials. 31,36,48,49,56 It may be useful to carefully track the Li content in a Ni-rich material to see whether it is Li-rich and understand the conditions needed to form Li-rich materials.
Many reports on Li-rich materials do not measure the amount of Li in their material after synthesis, meaning their results may be attributed to a composition with more Li than in reality due to heating loss. 9,10,32,34–36,48,57 There are some studies that do measure the amount of Li in their material after synthesis, 31,33,49,56 and it is hard to know how prevalent this is for the hundreds of papers on Li-rich materials. 7,11,12 Careful measurements of Li content in the synthesized materials become more important for Ni-rich compositions due to the possibility of the Li existing as a residual Li impurity and not in the material. This work provides a clear and simple method for tracking where the Li went after synthesis.
Earlier, layered positive electrode materials were synthesized mostly in air but as the compositions become increasingly Ni-rich, syntheses need to be carried out in oxygen. 22,38,50,58–62 As the Ni content increases, a higher proportion of Ni needs to be in the +3 oxidation state to accommodate Li uptake and so synthesis in oxygen promotes the oxidation of Ni2+ to Ni3+. There are few reports closely studying when the switch to synthesis in oxygen is needed, 38 although there are more reports studying Ni-rich samples synthesized in different atmospheres 50,58–60 or varying oxygen pressures or flow rate. 22,61,62 Clearly, the synthesis of Ni-rich materials in oxygen will generally lead to similar or better performing materials. However, it may be beneficial to determine when synthesis in air can produce materials with similar performance, as this can lead to lower processing costs.
To better understand the fate of Li in the synthesis of Ni-rich material, this work synthesized various Ni-rich Liy[Ni1−xMnx]O2 (x = ∼0.08, 0.2) with excess Li (Li/transition metal (TM) ratio in synthesis of 1.15). Syntheses were carried out in either oxygen, dry air or air to explore the impact of oxygen partial pressure (oxygen and dry air) and moisture and CO2 (dry air and air). Additionally, two series of Li1+x[Ni0.5Mn0.5]1-xO2 samples were synthesized with varying amounts of excess Li (Li/TM ratio in synthesis of 1.00–1.27, leading to 0 ≤ x ≤ 0.12) in oxygen and in air to help understand the impact of Mn content (or Ni content). The synthesized materials were characterized by X-ray diffraction (XRD), scanning electron microscopy (SEM), inductively coupled plasma optical emission spectrometry (ICP-OES), pH titrations and electrochemical testing.
Experimental
Synthesis
Samples were synthesized using metal hydroxide precursors obtained from Hunan Zoomwe Zhengyuan Advanced Material Trade Co., Ltd. (Zoomwe). Three precursors were used in this work: Ni0.8Mn0.2(OH)2 (D50 ∼ 16 μm) and Ni0.5Mn0.5(OH)2 (D50 ∼ 4 μm) which will be denoted as NiMn 80/20 and NiMn 50/50, as well as a core shell precursor consisting of an 8 μm Ni(OH)2 core and a 0.75 μm thick Ni0.8Mn0.2(OH)2 shell which will be denoted as NiMn-CS. NiMn-CS has an average Ni content ∼92%. Previous work has shown that similar NiMn core shell materials generally lose their core shell structure and have a uniform Mn distribution when heated to 800 °C due to interdiffusion. 46,47 This work synthesized the materials at 850 °C, so it is assumed that NiMn-CS behaves similarly to a material with ∼92% Ni and ∼8% Mn. A fourth precursor, Ni0.375Mn0.625(OH)2, was used for thermogravimetric analysis (TGA) and will be denoted as NiMn 37.5/62.5.
The precursor materials were mixed with Li2CO3 (Alfa Aesar, 99%) for a total mass of 2.5 g before heating in a lithium/transition metal (TM) molar ratio of 1.15 except for NiMn 50/50, which varied the Li used from a Li/TM ratio of 1.00 to ∼1.27 (corresponding to 0 ≤ x ≤ 0.12 in Li1+x[Ni0.5Mn0.5]1-xO2). NiMn 50/50 samples synthesized in oxygen were mixed with LiOH·H2O (Nemaska) instead of Li2CO3. The mixtures were ground together by mortar and pestle until homogenous. Samples were heated in a box furnace if synthesized in air, otherwise samples were heated in a tube furnace (4.4 cm diameter) with a gas flow of 60 sccm. Two gasses were used in this study, oxygen (Praxair, 99.993%) and compressed air (Praxair, < 2 ppm H2O and < 0.5 ppm CO2, denoted as dry air). The NiMn-CS and NiMn 80/20 samples were heated in the furnaces at 850 °C for 12 h then at 800 °C for 5 h, 55,63 while NiMn 50/50 samples were heated in the furnaces at 1000 °C for 10 h. All heating steps used a heating rate of 10 °C min−1. Lithiated samples were ground once more before characterization.
X-ray diffraction (XRD)
XRD patterns of samples were collected with a Siemens D8 diffractometer equipped with a Cu target X-ray tube and a diffracted beam monochromator. Samples were measured in the scattering angle (2θ) range of 15°–70° for 3 s at intervals of 0.02°. Rietveld refinements were performed on XRD patterns of synthesized samples. Materials were refined based on a hexagonal α-NaFeO2 structure with the R-3m space group. 15,22,46,47 Li was assumed to occupy 3a sites (lithium layer) while the 3b sites (metal layer) contained Ni, Mn and excess Li and 6c sites contained oxygen. The exchange of Ni and Li between 3a and 3b sites was allowed by constraining a one for one replacement. The refined Ni content in the Li layer is accurate to ±0.5%.
Scanning electron microscopy (SEM)
SEM imaging was carried out using a NanoScience Phenom G2 Pro Desktop SEM to image samples. Powder samples were prepared by mounting on adhesive carbon tape.
pH titrations
pH titration curves of solutions extracted using the "pour method" 44 were performed on a Mettler Toledo G20 compact titrator. The pour method consists of vacuum filtering 40 ml of deaerated distilled water through about 0.1 g of positive electrode powder and collecting the filtrate for titration analysis. The pour method exposes the powder to water for about 5 s, which is enough to dissolve residual Li species but minimizes ion-exchange of Li for H. 29,44 A second pour of 40 ml of deaerated distilled water was performed on each sample to confirm the dissolution of most of the residual Li. The acid titration of the filtrate was carried out using 0.0520 M HCl (prepared with deaerated distilled water) as the titrant.
Inductively coupled plasma optical emission spectrometry (ICP-OES)
ICP-OES measurements were carried out using a Perkin Elmer Optima 8000 ICP-OES Spectrometer to determine the elemental composition of samples (as metal ratios). Standard solutions of 0, 0.5 and 1 μg ml−1 for Li and 0, 1 and 2 μg ml−1 for Ni and Mn were prepared by diluting the standards in 2% HNO3. 8–10 mg of unrinsed sample was dissolved in 2 ml of aqua regia (1:3 HNO3:HCl) before dilution in 2% HNO3. The rinsed sample was obtained by air drying the residue from the pour method for less than 1 h, 10–12 mg of rinsed sample was used to account for residual moisture.
Thermogravimetric analysis (TGA)
TGA measurements were carried out on NiMn 37.5/62.5 samples using a TA Instruments SDT Q600. NiMn 37.5/62.5 precursors were mixed with Li2CO3 in a Li/TM ratio of 1.2 and ground before loading into the sample pan. Experiments went from room temperature up to 1050 °C at a heating rate of 10 °C min−1 under an air flow rate of 100 ml min−1.
Coin cells
NiMn-CS materials underwent the separation of particle aggregates before electrochemical testing. 55 NiMn-CS and NiMn 80/20 positive electrodes for electrochemical testing were prepared as described elsewhere. 64 A mixture was formed by combining the active material, Super-S carbon black (Timcal) and polyvinylidene fluoride (PVDF, Arkema, Kynar 301F) in a ratio of 92:4:4 by mass. Appropriate amounts of N-methyl-2-pyrrolidone (NMP, Sigma-Aldrich, 99.5%) was added to form a slurry and mixed in a planetary mixer (Mazerustar) for 300 s. This slurry was then coated onto Al foil using a 150 μm notch bar and dried in an oven at 110°C. Dried electrodes were calendared at a pressure of ∼2000 atm, punched into discs (12.75 mm diameter, electrode material loading of 9–12 mg cm−2) and dried in vacuum overnight at 110 °C. 2325-type coin cells were then assembled using a positive electrode, two pieces of Celgard 2300 separator (Celgard) and a Li metal negative electrode using 1.0 M LiPF6 (BASF, 99.9%) in fluoroethylene carbonate (FEC, BASF) and dimethyl carbonate (DMC, BASF) mixture (FEC:DMC 1:4 v/v) as the electrolyte. Electrochemical testing for NiMn 50/50 samples was conducted for diffusion studies and there were a few differences in the procedure. 65–67 The active material: Super S: PVDF ratio was 84:8:8 and a 40 μm notch bar was used, leading to electrode material loadings of only 0.8–1.0 mg cm−2. Only one piece of Celgard separator was used during coin cell assembly and 1.2 M LiPF6 in EC: dimethyl carbonate (EC:DMC, 1:1 v/v, BASF) was used as the electrolyte.
Electrochemical testing was performed on coin cells using an E-One Moli Energy Canada battery testing system. Cells were cycled between 3.0–4.3 V (vs Li/Li+) at 30 °C. Cells were cycled 2 times using a current density of 10 mA g−1 (∼C/20), cycled 50 times using a current density of 40 mA g−1 (∼C/5) for capacity retention testing then finally cycled 2 more times using a current density of 10 mA g−1. NiMn 50/50 cells were not tested for capacity retention due to the lower loadings, one piece of separator and different electrolyte used.
Results and Discussion
Materials characterization
Figure 1 shows the XRD patterns of the NiMn-CS and NiMn 80/20 samples synthesized under different atmospheres (Figs. 1a1–1b3) and of the NiMn 50/50 samples synthesized in O2 and in air (Figs. 1c1–1d3). An expanded view of the (003) and the (104) reflections (Figs. 1a2–1d2) and an expanded view of the impurity region (Figs. 1a3–1d3) are shown. All materials synthesized were single phase materials and peaks associated with short-range ordering between Li and other metals in the TM layer were not observed except in NiMn 50/50 samples (Figs. 1c3, 1d3). 9,32,34,35,48 The expanded view of the impurity region (Figs. 1a3–1d3) shows that all the synthesized materials did not have an appreciable amount of surface impurities, 22–28 as could be detected by XRD, except for NiMn-CS, which showed some traces of Li2O for the sample synthesized in dry air. 55
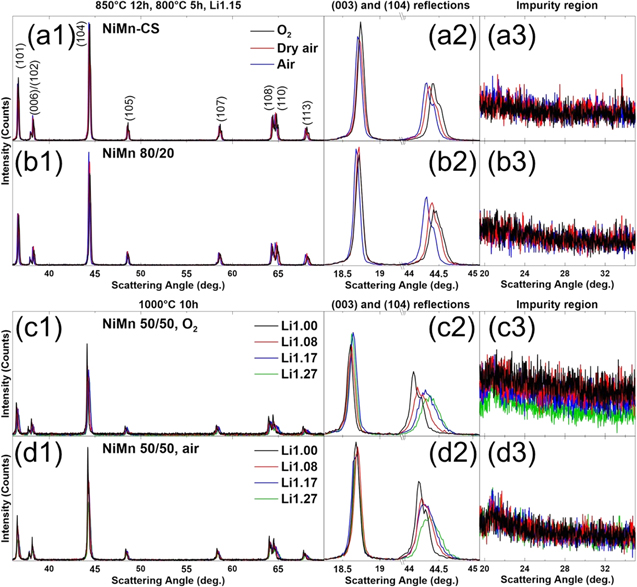
Figure 1. XRD patterns (Cu Kα radiation) of NiMn-CS (a1)–(a3) and NiMn 80/20 (b1)–(b3) samples synthesized under different atmospheres, collected from 35°−70° (a1)–(b1) along with the expanded views of the (003) reflection (a2)–(b2), the (104) reflection (a2)–(b2) and the Li impurity region (a3)–(b3). XRD patterns and expanded views for NiMn 50/50 synthesized in O2 (c1)–(c3) and in air (d1)–(d3) are shown in the lower panels. Labels above the left panels denote the consistent conditions for the connected panels (one for (a)–(b), another for (c)–(d)).
Download figure:
Standard image High-resolution imageA closer look at Figs. 1a2–1d2 shows that some materials have a broader (104) reflection peak. Figure 1a1–1d1 show that other reflections of those materials have broader peaks as well. The materials with most noticeable peak broadening are NiMn 80/20 synthesized in oxygen and NiMn 50/50 synthesized in both atmospheres at higher Li amounts. This peak broadening may be indicative of a material being Li-rich, since it has been suggested that the existence of Li in the TM layer may induce non-uniform stress. 51 Later experiments confirm that the materials experiencing peak broadening are Li-rich, and this may be a qualitative method to identify when a material is Li-rich.
Figure 2 shows the Rietveld refinement results for the XRD patterns (shown in Fig. 1) of the NiMn-CS and NiMn 80/20 samples synthesized under different atmospheres (Figs. 2a1–2a2) and of the NiMn 50/50 samples synthesized in O2 and in air (Figs. 2b1–2b2). The materials synthesized in oxygen have the smallest unit cell volumes (Figs. 2a1–2b1) and the lowest amount of Ni in the Li layer (Figs. 2a2–2b2), although the NiMn 80/20 sample synthesized in dry air and NiMn 50/50 samples synthesized in air show only a small increase compared to oxygen synthesis. Looking only at the materials synthesized in oxygen, as the Mn content of the material increases, the Ni content in the Li layer increases as well. This is due to Mn being in a +4 oxidation state which pushes more Ni to the +2 oxidation state to maintain charge balance, and Ni2+ has a similar ionic radii as Li 19 and is prone to migration into the Li layer. 3–5,8,20–22 For a given composition, less Ni in the Li layer likely indicates that the material took in more Li, since that would increase the average oxidation state of Ni and reduce the amount of Ni2+.
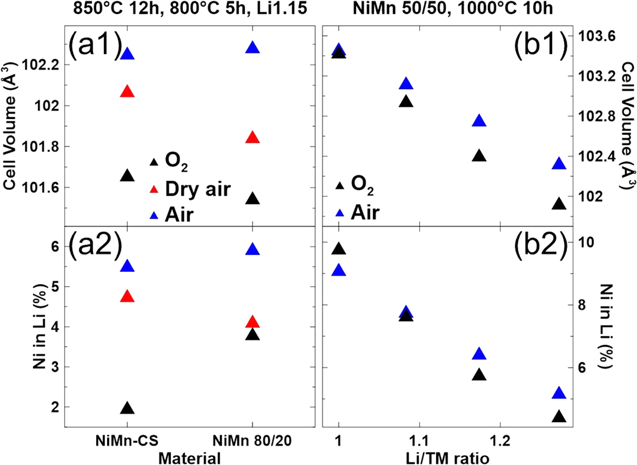
Figure 2. The calculated unit cell volume (a1) and amount of Ni in the Li layers (a2) for NiMn-CS and NiMn 80/20 samples synthesized under different atmospheres are shown on the left while the calculated unit cell volume (b1) and amount of Ni in the Li layers (b2) for NiMn 50/50 synthesized in O2 and in air are shown on the right.
Download figure:
Standard image High-resolution imageFigure 3 shows the SEM images of the NiMn-CS and NiMn 80/20 samples synthesized in oxygen, dry air and air. It appears that the synthesis conditions used in this work formed single crystalline particles for NiMn-CS materials but not for NiMn 80/20. This is likely due to materials with higher Ni content requiring lower temperatures for accelerated particle growth, so NiMn-CS samples experienced faster particle growth than NiMn 80/20 samples at the same heating temperature. 52–55 However, while NiMn 80/20 retained its polycrystalline morphology, the primary particles have grown. The synthesis atmosphere does not seem to affect the morphology or particle size for both NiMn-CS and NiMn 80/20 materials.
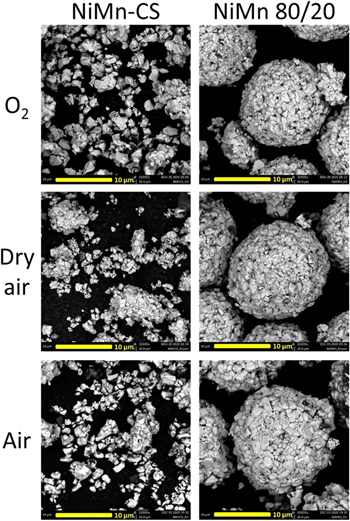
Figure 3. SEM images of NiMn-CS and NiMn 80/20 synthesized under different atmospheres.
Download figure:
Standard image High-resolution imageTable I shows the normalized atomic ratios of unrinsed and rinsed NiMn-CS and NiMn 80/20 samples as measured by ICP-OES. Atomic ratios were normalized to Ni + Mn = 1. Since the Ni and Mn ratios were not expected to change significantly, this method allows the amount of Li to be tracked whether in excess or deficiency. The synthesized samples were used as is for sample preparation and denoted as unrinsed samples, while the rinsed samples were obtained by air drying the residue from the pour method. As can be seen later, the pour method can dissolve residual Li species while minimizing the amount of ion exchange occurring, allowing the determination of the Li content of the material in the absence of residual Li species.
Table I. Elemental analysis of the unrinsed and rinsed samples using ICP-OES. Atomic ratios were normalized to Ni + Mn = 1.
| Unrinsed | Rinsed | |||||
|---|---|---|---|---|---|---|
| Li | Ni | Mn | Li | Ni | Mn | |
| NiMn-CS O2 | 1.100 | 0.912 | 0.088 | 1.009 | 0.912 | 0.088 |
| NiMn-CS dry air | 1.107 | 0.914 | 0.086 | 0.925 | 0.912 | 0.088 |
| NiMn-CS air | 0.976 | 0.914 | 0.086 | 0.906 | 0.913 | 0.087 |
| NiMn 80/20 O2 | 1.095 | 0.789 | 0.211 | 1.097 | 0.786 | 0.214 |
| NiMn 80/20 dry air | 1.126 | 0.790 | 0.210 | 1.040 | 0.786 | 0.214 |
| NiMn 80/20 air | 1.001 | 0.789 | 0.211 | 0.979 | 0.786 | 0.214 |
The minimal deviation of normalized Ni and Mn atomic ratios for NiMn-CS and NiMn 80/20 samples give confidence to the Li/TM ratio determination of the samples. The Li/TM ratios of the unrinsed samples can serve as an estimate of the amount of Li that was lost during the synthesis procedure. Samples were prepared with a Li/TM of 1.15 before heating and samples synthesized in oxygen and dry air were measured to have a Li/TM ratio of ∼1.10. Materials synthesized in air had a much lower Li/TM ratio, suggesting that Li loss during synthesis is much higher when synthesizing in air. 50 The Li/TM ratios of the rinsed samples are indicative of the Li content of the electrode material, since residual Li species are expected to be dissolved during the pour method rinse. For rinsed NiMn-CS samples, only the sample synthesized in oxygen was fully lithiated, the samples synthesized in dry air and in air were both Li-deficient. The Li/TM ratios for rinsed NiMn 80/20 samples were all higher than the NiMn-CS sample synthesized in the same atmosphere. Rinsed NiMn 80/20 samples synthesized in oxygen and dry air appeared to be Li-rich, while the sample synthesized in air was slightly Li-deficient at a Li/TM ratio of 0.98. The Li/TM ratios for rinsed materials support earlier observations (Fig. 2a2) that Li uptake affects the Ni content in the Li layer, with Li-deficient NiMn-CS and NiMn 80/20 samples showing more Ni in the Li layer.
The Li/TM ratios of the rinsed samples show the impact of synthesis temperature and Mn content on the uptake of Li into the material. Samples synthesized in oxygen can take in more Li, likely due to the oxidizing nature of the atmosphere which pushes more Ni to the +3 oxidation state. It seems that a higher Mn content is needed to form Li-rich materials, as the rinsed NiMn-CS sample synthesized in oxygen only has a Li/TM ratio of 1.009. On the other hand, the rinsed NiMn 80/20 sample synthesized in oxygen has a Li/TM ratio of 1.097 and even the rinsed NiMn 80/20 sample synthesized in dry air has a Li/TM ratio of 1.04. It is likely that as the Mn content of a material increases, the synthesis atmosphere required does not have to be as oxidizing since less Ni3+ is needed for charge balancing with more Mn4+ present. This work supports this idea, as the rinsed NiMn-CS sample synthesized in dry air was Li-deficient but the rinsed NiMn 80/20 sample synthesized in dry air was not. It is expected that synthesis in air and dry air have similarly oxidative atmospheres, but the increased Li loss during air synthesis 50 explains why the Li/TM ratios of rinsed samples synthesized in air are lower than rinsed samples synthesized in dry air.
The difference between the Li/TM ratio of the unrinsed and the rinsed sample is the amount of Li lost during the pour method rinse. The amount of Li lost is assumed as all dissolved residual Li species in this work. In reality, the short exposure time of water to the samples (∼5 s) may still allow for some small amount of ion exchange to occur. 29,30,44 NiMn-CS samples had more residual Li than NiMn 80/20, which is reasonable since residual Li is known to occur in materials with more Ni. 22–28 For both NiMn-CS and NiMn 80/20 samples, synthesis under dry air results in the most residual Li.
Figure 4 shows the pH titration results for NiMn-CS and NiMn 80/20 samples synthesized under different atmospheres and NiMn 50/50 samples synthesized in air. Titration curves of NiMn-CS (Fig. 4a1), NiMn 80/20 (Fig. 4a2) and NiMn 50/50 (Fig. 4a3) are shown on the left and the initial pH (Fig. 4b1) and residual Li content (Fig. 4b2) as determined by the titration curves which are sorted by material and synthesis atmosphere are shown on the right. For Fig. 4a1–4a3, duplicate titration experiments on the same sample are indicated by lines of the same type, replicate samples are indicated by lines of a different shade and the second pour results are indicated by dashed lines. For Fig. 4b2, the samples are indicated by the colour, the residual Li species are indicated by the texture, and residual Li contents as determined by ICP-OES (Table I) are indicated by a green cross.

Figure 4. pH titration curves of solutions extracted using the "pour method" from (a1) NiMn-CS, (a2) NiMn 80/20 and (a3) NiMn 50/50 samples. Duplicate experiments on the same sample are indicated by lines of the same type, replicate samples are indicated by lines of a different shade and the second pour results are indicated by dashed lines. The initial pH (b1) and residual Li content (b2) are plotted by synthesis atmosphere and material. For panel b2, the samples are indicated by the colour, the residual Li species are indicated by the texture, and residual Li contents as determined by ICP-OES are indicated by a green cross.
Download figure:
Standard image High-resolution imageFor the samples in Figs. 4a1–4a3, 2 ml g−1 corresponds to roughly 1% residual Li by mole fraction compared to the lithium in LiMO2. It is important to note that the second pour results for all samples showed very little Li in solution (<1%) regardless of the amount of residual Li in the first pour. This supports previous work that the pour method can sufficiently dissolve residual Li species in just one pour, while the second pour gives an idea of the scale of ion exchange occurring. 29,44 Looking at the first pour results, there is a clear trend of increasing residual Li content with decreasing Mn content. NiMn-CS samples have a maximum of around 15% residual Li, NiMn 80/20 samples have a maximum of around 6% residual Li and all NiMn 50/50 samples have under 1% residual Li, even for the NiMn 50/50 sample synthesized with a Li/TM ratio of 1.27. In terms of synthesis atmosphere, it is clear that synthesis in dry air results in the highest residual Li content, but NiMn-CS samples synthesized in oxygen have more residual Li than samples synthesized in air, while NiMn 80/20 samples synthesized in air have more residual Li than samples synthesized in oxygen. Titrations on replicate samples and replicate batches give consistent results for the most part, but samples synthesized in air seem to have more variation in residual Li contents.
While it may not be intuitive why NiMn-CS samples synthesized in oxygen have more residual Li than samples synthesized in air but the opposite occurred for NiMn 80/20 samples, the reason can be gleaned by considering ICP-OES results in Table I. It was shown that synthesis in air lost more Li during the heating, 50 so there was less excess Li to form residual Li. Additionally, synthesis in oxygen promotes the uptake of Li by oxidizing Ni. This explains the NiMn-CS residual Li trend (Fig. 4a1); synthesis in dry air formed the most residual Li because similar Li loss occurred during syntheses in oxygen and dry air, but more Li was able to go into the sample synthesized in oxygen. A higher Mn content allows the material to take in more Li by requiring less oxidative atmospheres during synthesis, which is why NiMn 80/20 samples contained less residual Li. The rinsed NiMn 80/20 sample synthesized in oxygen took in all the excess Li not lost during heating to form a Li-rich material, leaving minimal Li to form residual Li. The NiMn 80/20 sample synthesized in air lost more Li during heating but some Li still formed residual Li, which explains the residual Li trend observed for NiMn 80/20 samples (Fig. 4a2). For NiMn 50/50 samples (Fig. 4a3), all the excess Li went into the material, so all samples showed minimal residual Li amounts.
Figure 4b1 shows that the initial pH of a solution can be used as an estimate of the amount of residual Li on a sample. This can be observed in Figs. 4a1–4a3 as well, the higher the initial pH, the more acid is needed to bring the solution down to pH 3.3. However, the correlation may not be exact, so the initial pH should only be used as a qualitative method to estimate the amount of residual Li.
The equivalence points in the titrations (Figs. 4a1–4a3) were used to quantitatively determine the amount of residual Li by species, 22,23,30,44 and the residual Li contents of the samples are shown in Fig. 4b2. All titrated samples contained some amount of carbonate impurities (assumed in this work as all Li2CO3 for simplicity but not true in reality) 25,26 but not all materials contained quantifiable amounts of LiOH. However, LiOH was the most abundant residual Li species for NiMn-CS samples synthesized in oxygen and dry air and for NiMn 80/20 samples synthesized in dry air. Compared to samples synthesized in other atmospheres, samples synthesized in air have more carbonate species. It may be that the residual Li is reacting with the moisture and CO2 in the air to form more carbonate species. 24–26 If carbonate impurities are mainly formed from reaction with ambient air, then the smaller amounts of carbonate species on other samples may be due to surface reactions when the samples were exposed to air after synthesis or possibly during the titration experiments. A higher carbonates content in NiMn-CS samples support this, since it is known that compositions with more Ni are more sensitive to air and moisture. 22–28 Further supporting this idea is the NiMn 80/20 sample synthesized in oxygen, since it is expected that most, if not all, the excess Li was taken in.
As discussed earlier, ICP-OES can also determine the amount of residual Li by taking the difference between the Li/TM ratio of unrinsed and rinsed samples, and the amounts determined by ICP-OES are also shown in Fig. 4b2 as green crosses for the 6 samples. Residual Li amounts determined by ICP-OES agreed with the titration results for the most part, although ICP-OES determined a slightly higher residual Li amount than titrations for samples synthesized in dry air.
Electrochemical characterization
Figure 5 shows the voltage vs specific capacity (V vs Q, Figs. 5a1–5b1) and the differential capacity vs voltage (dQ/dV vs V, Figs. 5a2–5b2) for NiMn-CS (Figs. 5a1–5a2) and NiMn 80/20 (Figs. 5b1–5b2) samples cycled between 3 V and 4.3 V as well as dQ/dV vs V for NiMn-CS and NiMn 80/20 cells cycled between 3 V and 4.7 V (Fig. 5c) and NiMn 50/50 cells cycled between 3 V and 4.6 V (Fig. 5d). Solid and dashed lines represent two duplicate cells.

Figure 5. Cell voltage as a function of capacity (a1)–(b1) and differential capacity as a function of cell voltage (a2)–(b2) for NiMn-CS (a1)–(a2) and NiMn 80/20 (b1)–(b2) samples synthesized under different atmospheres and cycled between 3 V and 4.3 V. Differential capacity as a function of cell voltage for NiMn-CS and NiMn 80/20 cells cycled between 3 V and 4.7 V (c) and NiMn 50/50 cells cycled between 3 V and 4.6 V (d). The data was collected at 30 °C using a specific current of ∼10 mA g−1 (C/20).
Download figure:
Standard image High-resolution imageThe V vs Q curves of NiMn-CS samples (Fig. 5a1) show that synthesis atmosphere can impact the capacity of the material by ∼25 mAh g−1. The ∼4.2 V feature in the dQ/dV vs V curves (Fig. 5a2) is broader and occurs at a higher V when the Ni content in the Li layer increases (Fig. 2a2) which is also when the material is more Li deficient (Table I). Conversely, the synthesis atmosphere does not affect NiMn 80/20 samples as much, and the V vs Q (Fig. 5b1) and dQ/dV vs V (Fig. 5b2) curves show less noticeable differences. It has been reported that the amount of residual Li can be correlated with the voltage when the cell begins charging, 25–27,55 but that is not observed in Figs. 5a1–5b1. The NiMn-CS and NiMn 80/20 samples synthesized in dry air contain the most residual Li (Fig. 4b2), but the voltages when the cells begin charging are very similar to samples synthesized in oxygen. In fact, for both compositions, the samples synthesized in air have the highest voltage when cells begin charging, even though synthesis in air forms the least amount of residual Li for NiMn-CS samples and the intermediate amount of residual Li for NiMn 80/20 samples (Figs. 4 b2). However, synthesis in air forms the most carbonate species for both compositions, so perhaps the voltage when the cells begin charging are more sensitive to carbonate content rather than total residual Li content.
To confirm whether materials are Li-rich and can access oxygen redox capacity, 7–12,34,35 cells were tested to a higher upper cutoff voltage of 4.7 V for NiMn-CS and NiMn 80/20 cells (Fig. 5c) and an upper cutoff voltage of 4.6 V for NiMn 50/50 cells (Fig. 5d). NiMn-CS samples synthesized in dry air and air were omitted from Fig. 5c because ICP-OES showed the samples were quite Li-deficient (Table I). An expanded view of the region of interest is provided in Fig. 5c, and oxygen redox capacity can be observed for NiMn 80/20 samples synthesized in oxygen and dry air but not for the NiMn 80/20 sample synthesized in air and the NiMn-CS sample synthesized in oxygen. This supports the ICP-OES results in Table I, showing that the higher Li ratio of the NiMn 80/20 sample synthesized in oxygen had more oxygen redox capacity than the NiMn 80/20 sample synthesized in dry air. Figure 5d shows that for NiMn 50/50 samples synthesized in air, any excess Li will be result in oxygen redox capacity. This supports earlier observations that all the excess Li atoms were taken in by the material (Fig. 4a3) and that less oxidizing atmospheres are required for materials with higher Mn content (Table I).
Figure 6 shows the specific capacity vs cycle number for the NiMn-CS and NiMn 80/20 samples synthesized in oxygen, dry air and air. Data for NiMn-CS samples are shown in open circles, while data for NiMn 80/20 samples are shown in crosses, and the colours denote the synthesis atmosphere. Data for duplicate cells are shown. No capacity retention tests were performed for the NiMn 50/50 samples since the cells were constructed for diffusion studies (lower loadings, only one piece of separator and a different electrolyte).

Figure 6. Specific capacity as a function of cycle number for NiMn-CS and NiMn 80/20 samples synthesized under different atmospheres and cycled between 3 V and 4.3 V.
Download figure:
Standard image High-resolution imageFor both NiMn-CS and NiMn 80/20 samples, the samples synthesized in oxygen had the highest initial specific capacity and the highest specific capacity after cycling tests, followed by the samples synthesized in dry air and finally the samples synthesized in air had the lowest specific capacity after testing. The NiMn-CS sample synthesized in dry air seemed to experience a lower rate of capacity fade than the NiMn-CS sample synthesized in oxygen. Previous work has shown that Ni-rich materials with a higher initial specific capacity had worse capacity retention, and this may explain the trends observed in Fig. 6. 3–6,17,42
The presence of residual Li (Fig. 4b2) may also correlate with the capacity retention of the samples. However, considering the amount of residual Li (Fig. 4b2), there also does not seem to be any correlation with the capacity retention of the sample. The samples synthesized in dry air had the most residual Li for both compositions. Yet while the NiMn-CS sample synthesized in dry air had a smaller specific capacity and experienced slower capacity fade than the NiMn-CS sample synthesized in oxygen, the NiMn 80/20 sample synthesized in dry air performed similarly to the NiMn 80/20 sample synthesized in oxygen. However, the amount of carbonate species on the sample may be correlated to the capacity retention of the material, similar to the correlation between the amount of carbonate species and the cell voltage when initially charged as hypothesized for Figs. 5a1–5b1. For NiMn-CS samples, the sample synthesized in oxygen had the least amount of carbonate impurities, followed by the sample synthesized in dry air then the sample synthesized in air, and this tracks well with the capacity retention of the samples. For NiMn 80/20 samples, the samples synthesized in oxygen and dry air had similarly low amounts of carbonate impurities and the sample synthesized in air had more carbonate impurities, and this also tracks well with the capacity retention of the samples.
There are many different parameters that impact the cycling performance of a material. Only a few parameters were considered for Fig. 6: initial specific capacity, Ni content in the Li layer, amount of residual Li and amount of carbonate species. The initial capacity of the Ni-rich NiMn-CS samples and amount of carbonate species seem to correlate with the capacity retention of the samples, whereas the Ni content in the Li layer and the amount of residual Li seem to have little to no correlation with the capacity retention. In this study, only 2 conditions (different synthesis atmospheres and compositions) were used to vary the 4 parameters (initial capacity, Ni content in the Li layer, amount of residual Li and amount of carbonate species) considered. The testing conditions may also vary other parameters not considered (amount of volume change experienced, surface reactivity, etc.) and there are also other conditions (heating protocol, amount of Li, etc.) not explored, so more work is needed to deconvolute the different correlations.
Tracking the Li during synthesis
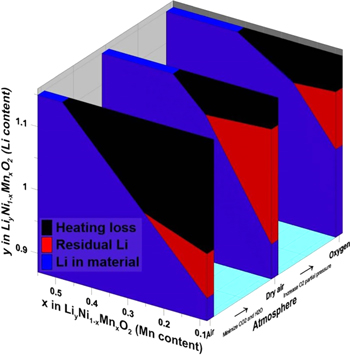
Figure 7 shows the summary of the Li/TM ratio of materials during synthesis and the expected behaviour of materials with various Mn content. Figure 7a shows the relative mass loss as a function of temperature for the TGA experiments on 2 NiMn 37.5/62.5 samples heated to 1050 °C in air with a Li/TM ratio of 1.2. Figure 7b shows the maximum amount of Li a material can take in if all the Ni are oxidized to Ni3+ as a function of the Mn content. Figure 7c shows the Li/TM ratios of materials before heating, after heating and after rinsing as a function of Mn content for syntheses in oxygen (top), dry air (middle) and air (bottom). Figure 7c summarizes the expected behaviour, as indicated by dashed lines of the corresponding colour, of materials with a given Mn content starting with a Li/TM ratio of 1.15 and heating at 850 °C for 12 h then at 800 °C for 5 h. 55,63 Data points for the NiMn 50/50 sample synthesized in air had a starting Li/TM ratio of 1.17 and the sample was heated at 1000 °C for 10 h and the heating loss was not measured. Instead, a heating loss estimate based on a starting Li/TM ratio of 1.17 and the expected behaviour is provided.

Figure 7. Normalized TGA data (a) for 2 NiMn 37.5/62.5 samples heated to 1050 °C in air with a Li/TM ratio of 1.2. The maximum amount of Li a material can take in (b) if all the Ni are oxidized to Ni3+ as a function of the Mn content. A summary (c) of the Li/TM ratio of materials before heating, after heating (850 °C 12 h, 800 °C 5 h) and after rinsing as a function of the Mn content of the material for various synthesis atmospheres. Dashed lines of the corresponding colour indicate the expected behaviour of materials with a given Mn content starting with a Li/TM ratio of 1.15 and heating at 850 °C for 12 h then at 800 °C for 5 h. The NiMn 50/50 data points were for heating at 1000 °C for 10 h with an unmeasured amount of heating loss, an estimate based on a starting Li/TM ratio of 1.17 and the expected behaviour is provided.
Download figure:
Standard image High-resolution imageFigure 7a shows TGA experiments of NiMn 37.5/62.5 precursors mixed with Li2CO3 in a Li/TM ratio of 1.2 and heated to 1050 °C. There are some slight differences in the final relative mass indicating perhaps some small error in the starting Li/TM ratio. However, both samples showed no mass loss from 600 °C–1050 °C, indicating that there is no Li loss due to heating for these higher Mn materials. Figure 7b shows the calculated maximum amount of Li a material can take in if all the Ni is oxidized to Ni3+ during synthesis. This could happen during syntheses in oxygen, and may occur for syntheses in dry air or air at higher Mn contents, as suggested earlier. Figure 7b suggests that in this work using a Li/TM ratio of 1.15, materials with a Mn content of > 0.35 will take in all the Li during synthesis.
Figure 7c shows the difference between the starting Li/TM ratio and the measured Li/TM ratio of unrinsed samples (Table I) can be seen as the amount of Li loss due to heating. The heating loss is expected to be consistent for a given heating protocol except for syntheses in air, which may have higher Li loss due to reactions with moisture and CO2. 50 For syntheses in air, it is assumed that the heating loss decreases as the Mn content increases to account for the fact that many of the NiMn 50/50 materials are Li-rich (Fig. 5d). However, it is noted that the Li/TM ratio of unrinsed samples synthesized in dry air and air both saw a similar increase when the Mn content increased, so more work tracking the heating loss would clear up this speculation.
The expected amount of heating loss shown in Fig. 7c is quite speculative for materials with higher Mn content. Figures 7a and 7b support the expectation that Li loss due to heating is reduced for materials with higher Mn. This may occur because all the Li is taken in by the material before the temperature is high enough to start losing Li. However, the authors note that some studies using ICP have measured lower Li/TM ratios in synthesized NiMn 50/50 materials than used in synthesis, likely due to heating loss. 33,49 An interesting report 31 measured no loss of Li in NiMn 50/50 after synthesis, but Li loss was measured for materials with 30%, 40%, 60% and 80% Mn. More work is needed to have a more definitive understanding of the heating loss of Li in various materials.
The difference between the Li/TM ratio of unrinsed samples and rinsed samples (Table I) can be seen as the amount of residual Li on a sample. This is confirmed using titration experiments to show that residual Li amounts as measured by titrations and ICP-OES agree quite well (Fig. 4b2). The experiments in this work show that more residual Li forms from materials with higher Ni/lower Mn and this supports literature. 22–28 Titrations on NiMn 50/50 samples synthesized in air (Fig. 4a3) show minimal residual Li amounts, so it is expected that NiMn 50/50 samples synthesized in other atmospheres will also have minimal amounts of residual Li. The extrapolation of the Li/TM ratio of unrinsed samples (relatively constant for oxygen and dry air synthesis and slightly increasing for air synthesis) and the Li/TM ratio of rinsed samples (increasing for all synthesis atmospheres) shows the lowest Mn content at which residual Li is expected to be minimal for the various synthesis atmospheres, but this is highly speculative and a "?" symbol is labeled at this point to indicate that.
The Li/TM ratio of rinsed samples (Table I) indicates the amount of Li in the material. For all synthesis atmospheres tested, the Li/TM ratio of rinsed samples increased when the Mn content increased. As discussed earlier, this is likely due to more Mn4+ requiring less oxidation of Ni2+ to Ni3+ to accommodate Li. For materials synthesized in oxygen, full uptake of the Li not lost to evaporation occurs at a Mn content of 0.2 or slightly less, and the Li/TM ratio of the synthesized material will depend on the heating loss. Full uptake of the Li occurs at a slightly higher Mn content for materials synthesized in dry air, perhaps around a Mn content of 0.25. For materials with a high enough Mn content, it will not be necessary to synthesize in oxygen since synthesis in dry air is expected to form similar products. Synthesis in air is slightly more complicated. Full uptake of the Li may actually occur at a slightly lower Mn content than synthesis in dry air, but the Li/TM ratio of the synthesized material will be lower due to a higher heating loss. 50 More work is needed to confirm the trends expected in this work and to confirm the suitability of synthesis in air for materials with higher Mn content. As mentioned, Fig. 7 shows the expected behaviour of materials with a given Mn content starting with a Li/TM ratio of 1.15 and heating at 850 °C for 12 h then at 800 °C for 5 h. Similar studies but varying the Li/TM ratios and heating profiles would give a fuller understanding of the impact of synthesis conditions on the composition and performance of synthesized materials.
Conclusions
This work synthesized various Ni-rich Liy[Ni1−xMnx]O2 (Mn contents ∼8%, 20% and 50%) with excess Li in oxygen, dry air or air to understand what happens to excess Li during synthesis. The Li[Ni1−xMnx]O2 components of the synthesized materials were single phase and synthesis in oxygen produced materials with less Ni in the Li layer. The pour method was confirmed to be a suitable method to dissolve residual Li while minimizing ion exchange. ICP-OES experiments on the unrinsed and rinsed samples are useful in the determination of the amount of Li lost from heating, the amount of Li taken in by the material during synthesis and the amount of residual Li. Materials synthesized in oxygen and dry air lost a similar amount of Li during heating but synthesis in air resulted in more Li loss. Synthesis in oxygen helped the material take in more Li during synthesis and materials with a higher Mn content can take in more Li to form Li-rich materials. Residual Li determination from titrations agrees with ICP-OES results, with the advantage of being able to discern residual Li species. Synthesis in dry air produces the most residual Li but synthesis in air produces the most carbonate impurities, and materials with less Mn content form more residual Li. The electrochemical performance of materials is more impacted by synthesis atmosphere for materials with lower Mn content. Materials determined to be Li-rich by XRD and ICP-OES are confirmed to be able to access oxygen redox capacity. From these experiments, the fate of excess Li can be tracked to heating loss, residual Li or uptake into the material as a function of Mn content and synthesis atmosphere. Figure 8 shows a simple summary of expected behaviour for materials with a given Mn content synthesized with a Li/TM ratio of 1.15 and heated to 850 °C for 12 h then 800 °C for 5 h.
Figure 8. A simple summary of expected behaviour for materials with a given Mn content synthesized with a Li/TM ratio of 1.15 and heated to 850 °C for 12 h then 800 °C for 5 h.
Download figure:
Standard image High-resolution image
Acknowledgments
The authors would like to acknowledge NSERC and Tesla Canada for funding this work under the auspices of the Industrial Research Chair program. AL thanks the Walter C. Sumner Foundation for financial support. NP thanks the Vidyasirimedhi Institute of Science and Technology (VISTEC) for financial support. RV thanks the Ernst Jaakson Memorial Fund for financial support. DO acknowledges the support of the China Scholarship Council. The authors thank Yiqiao Wang, Shuo Yin and Haohan Wu of Zoomwe for providing the precursors used in this work.