
Abstract
Polymer electrolyte membranes (PEMs) for fuel cells are chemically degraded by ·OH radicals, generated from H2O2, which is produced by a reaction of hydrogen adsorbed on the Pt anode with O2 diffusing through the PEM. In order to obtain a clue for designing the anode catalyst with low production rate of H2O2 and high activity for the hydrogen oxidation reaction (HOR), we have examined the H2O2 production rate at Pt catalysts as a function of particle size dPt ranging from 2 nm to 20 nm over a practical temperature range between 20 and 80 °C in 0.1 M HClO4. The H2O2 production rate [per geometric area with 1.5 to 2-layer height of catalyst layer] was found to decrease with increasing dPt, accompanied by a penalty of decreased mass activity for the HOR. The use of Pt skin-covered PtCo/C is shown to be an attractive potential solution, providing a breakthrough in simultaneously achieving low H2O2 production and high HOR activity.
Export citation and abstract BibTeX RIS

This is an open access article distributed under the terms of the Creative Commons Attribution Non-Commercial No Derivatives 4.0 License (CC BY-NC-ND, http://creativecommons.org/licenses/by-nc-nd/4.0/), which permits non-commercial reuse, distribution, and reproduction in any medium, provided the original work is not changed in any way and is properly cited. For permission for commercial reuse, please email: permissions@ioppublishing.org.
Polymer electrolyte fuel cells (PEFCs) have been developed for applications of fuel cell vehicles and residential cogeneration systems. The use of very thin polymer electrolyte membrane (PEM) provides a great benefit in the performance (low ohmic resistance and high back-diffusion rate of water), but the increase in the crossover of H2 and O2 through the PEM induces three penalties, i.e., (1) decreased cathode potential (voltage efficiency), (2) decreased fuel efficiency, and (3) decreased membrane durability due to chemical degradation. The increased permeation rate of O2 through the PEM from the cathode results in the increase in the production rate of H2O2 at Pt nanoparticles (NPs) supported on carbon (Pt/C) anode used for the hydrogen oxidation reaction (HOR), and ·OH radicals generated via a reaction of H2O2 with impurities (such as Fe2+) decompose PEMs. 1 The incorporation of radical scavengers such as Ce3+ into PEMs has been effective in mitigating the decomposition rate, 2 although it has a serious disadvantage, i.e., ion-exchange of Ce3+ lowers the proton conductivity of the electrolyte, both the membrane itself and the ionomer in the cathode catalyst layer resulting in severe polarization loss. 3,4
Very recently, we have proposed a strategy of attacking the root problem, by suppressing the H2O2 production via the use of a Pt skin-covered PtCo alloy NP catalyst supported on carbon (Ptskin‒PtCo/C) at the anode, which also exhibited high HOR activity. With this anode catalyst, the lifetime of the PEM was remarkably longer than that for a commercial Pt/C catalyst in an accelerated stress test of a single cell. 5 In order to establish strategies for developing practical catalysts with higher performance, it is essential to clarify the particle size dependence of H2O2 formation rate and HOR activity for Pt and Pt-alloy catalysts. While the effect of particle size of Pt or Pt alloys on the HOR rate has been reported, 6–10 no literature is available, to the best of our knowledge, for particle size-dependence of H2O2 production rate during the HOR. In the present work, as the first step, we focus on the particle size effect of Pt anode catalyst on the rates of both H2O2 production and the HOR at 20 to 80 °C.
Experimental
Figure 1 shows transmission electron microscope (TEM) images and particle size distribution histograms of five Pt catalysts used in this work. High-resolution TEM (HRTEM) images are also shown in the inset. Three kinds of them were Pt NPs supported on carbon black (CB: specific surface area = 800 m2 g−1), with average sizes dPt of 2.1, 2.8, and 3.7 nm, which were prepared by the nanocapsule method (43 to 48 mass% Pt) 11,12 and used in our previous work for the oxygen reduction reaction. 13 These are denoted as n-Pt/CB. Two commercial Pt catalysts were used: Pt NPs with dPt = 7.4 nm supported on graphitized carbon black (c-Pt/GCB, TEC10EA50E-HT, 50 mass%-Pt, Tanaka Kikinzoku Kogyo, TKK) and a Pt black with dPt = 19.5 nm (TPT-200, Tokuriki Honten Co., Ltd.). The distribution of Pt NPs for n-Pt/CB was uniform with a very narrow standard deviation σd = ca. 10%, while the values of σd were large ca. 20% for c-Pt/GCB and ca. 40% for Pt black. Typical lattice fringes observed in HRTEM images were assigned to the lattice distance between Pt(111) planes. X-ray diffraction (XRD) patterns of these catalysts are shown in Fig. S1 (available online at stacks.iop.org/JES/169/014516/mmedia) in the Supplementary Material. The values of crystallite size dXRD of n-Pt/CB and c-Pt/GCB based on the Scherrer equation agreed well with dPt obtained by TEM observation described above. This indicates that these NPs consisted of single crystallites of well-controlled size. On the other hand, the value of dXRD being smaller than dPt and the broad size distribution of Pt black particles suggests that the latter consisted of one to three crystallites. In addition to these catalysts, two commercial catalysts, c-Pt/CB (TEC10E50E, 50 mass%-Pt, dPt =2.4 ± 0.5 nm, TKK) and c-Pt/C (TEC10F30E, 30 mass%-Pt on carbon support with 780 m2 g−1, dPt = 2.3 ± 0.7 nm, TKK), were also used as reference catalysts (widely used in the anodes of PEFCs).

Figure 1. TEM images and particle size distribution histograms of (a)–(c) n-Pt/CB; (d) c-Pt/GCB; and (e) Pt black. Inset: HRTEM image.
Download figure:
Standard image High-resolution imageThe electrochemical experiments were conducted with a channel flow double electrode cell (CFDE) technique, in a manner similar to that reported previously. 5 The working electrode (WE) was prepared by Nafion coating a thin, uniform layer of Pt catalyst, which was dispersed on a glassy carbon (GC) substrate with geometric surface area of 0.04 cm2. The thickness of the Nafion coating was ca. 0.1 μm. The amount of each supported catalyst was maintained at a constant Pt loading mPt = 8 μgPt cm−2, corresponding to ca. 1.5-layer height of carbon particles. 13 The mPt for Pt black was 86 μgPt cm−2 (ca. 2-layer height of Pt particles) to cover the GC surface uniformly. All electrode potentials E are referred to the reversible hydrogen electrode RHE(t), whose temperature was the same as that of the cell (t °C). A platinum wire was used as the counter electrode. The electrolyte solution, 0.1 M HClO4, was prepared from reagent grade chemicals and Milli-Q water (Millipore Japan Co., Ltd.), and purified in advance with pre-electrolysis methods. 14
The electrochemically active area (ECA) of each catalyst was evaluated by a hydrogen adsorption charge in the cyclic voltammogram measured in N2-saturated 0.1 M HClO4 solution at 0.05 V s−1. Hydrodynamic voltammograms for the HOR at the WE under a laminar flow of 0.1 M HClO4 saturated with H2 and H2 containing 10% air were recorded by scanning its potential from 0 to 0.1 V at 5 mV s−1 at temperatures from 20 to 80 °C. H2O2 emitted from the WE during the HOR was detected at a Pt collecting electrode (CE, located at downstream of WE, as illustrated in Fig. 2) held at 1.4 V.
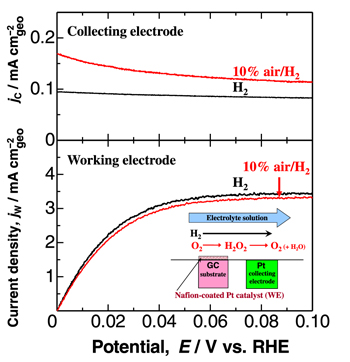
Figure 2. Hydrodynamic voltammograms on Nafion-coated n-Pt/CB (dPt = 2.1 nm) working electrode (WE) in H2- and 10% air/H2-saturated 0.1 M HClO4 at 80 °C and mean flow rate of 20 cm s−1. The potential sweep rate for the WE was 5 mV s−1, while the potential of Pt collecting electrode was held at 1.4 V.
Download figure:
Standard image High-resolution imageResults and Discussion
Evaluation of H2O2 production rate and HOR mass activity of Pt catalysts based by CFDE technique
Typical hydrodynamic voltammograms for the HOR on n-Pt/CB catalyst WE at 80 °C are shown in Fig. 2. In 0.1 M HClO4 electrolyte solution saturated with pure H2, the current density jW at the n-Pt/CB WE for the HOR commenced at 0 V and reached the diffusion limit at about 0.06 V. The HOR current density jC on the Pt CE at 1.4 V was nearly constant irrespective of the WE potential and about 1/40 of the limiting current density at WE. This is because the HOR rate was suppressed considerably on the less active PtOx surface formed at high potential of 1.4 V. The value of jC was found to increase in 10% air/H2 saturated solution, indicating that H2O2 emitted from the WE was oxidized under a diffusion-control condition at the PtOx surface. Similar behavior is seen for all catalysts and temperatures (Fig. S2). Then, the H2O2 production current density, j(H2O2), was calculated as a function of potential as follows:

where Ceff is the collection efficiency at the CE experimentally obtained to be 0.29. 13,15
The kinetically-controlled current Ik for the HOR at 0.02 V was calculated by the following equation:

where I is the observed current at 0.02 V under a given solution flow rate, and IL is the limiting current at the same flow rate. The kinetically-controlled mass activity, MAk, at 0.02 V for the HOR was determined by dividing Ik by the mass of Pt on the GC substrate. We calculated MAk values in 10% air/H2−0.1 M HClO4 solution, because they were measured simultaneously with jC (10% air/H2) for j(H2O2).
Dependence of H2O2 production rate j(H2O2) on dPt at 20 to 80 °C
Figure 3 shows the potential dependence of j(H2O2), normalized to the geometric area, for the various Pt catalysts at 80 °C. The values of j(H2O2) for all catalysts increased at less positive potentials, with a steep increase at E < 0.03 V, and were continuing to rise at E = 0 V (corresponding to open circuit). This is consistent with the accelerated degradation of PEMs at open circuit in a single cell. 16–18 It is also noted that j(H2O2) decreased with increasing dPt. This is to be expected, since the specific surface area decreases with increasing dPt, as discussed later.
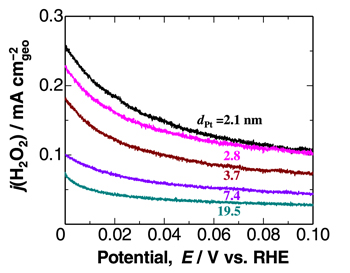
Figure 3. Potential dependence of H2O2 production current density, j(H2O2), on various Pt catalysts measured in 10% air/H2-saturated 0.1 M HClO4 at 80 °C.
Download figure:
Standard image High-resolution imageIt was found that the dependence of j(H2O2) at 0 V on dPt was fitted well with a simple equation at each temperature from 20 to 80 °C as shown by solid line in Fig. 4a:

where a and b are constant at a given temperature and the latter parameter corresponds to the j(H2O2) at bulk Pt, i.e., the lowest limit. As shown in Fig. S3, the value of j(H2O2) was nearly independent of the mean flow rate Um of the solution at 30 to 80 °C, i.e., independent of the supply rate of O2 to the catalyst. This is consistent with our previous result that the j(H2O2) values obtained in 10% air/H2-saturated solution and pure O2-saturated solution were nearly the same, suggesting that the rate-determining step for the H2O2 production should include a potential-dependent limiting species adsorbed on Pt other than the O2 molecule or H2 molecule.

Figure 4. (a) Dependence of j(H2O2) at 0 V on dPt. Each solid line is a least-squares fit to the equation: j(H2O2) = a dPt −1 + b; (b) Plots of j(H2O2) at 0 V as a function of ECA (measured at 40 °C). Solid lines are linear least-squares fits for each temperature.
Download figure:
Standard image High-resolution imageThe most reasonable candidate for the limiting species in H2O2 production is some form of adsorbed hydrogen, either underpotentially deposited hydrogen (HUPD) or overpotentially deposited hydrogen (HOPD). Since the value of electrochemically active area, ECA, corresponding to the amount of hydrogen atoms adsorbed, is inversely proportional to dPt −1, j(H2O2) at 0 V is plotted as a function of ECA in Fig. 4b. The j(H2O2)@0 V value was indeed linearly proportional to the ECA at 20 to 80 °C. In our previous work, 5 the production of H2O2 was correlated with the onset for the formation of HOPD on the Pt surface at E ≤ 0.1 V, based on the potential dependence of j(H2O2) (as in Fig. 3), similar to that of HOPD observed by in situ FTIR. 19 As elucidated by the density functional theory (DFT) calculations of Ishikawa and coworkers, HOPD and HUPD can be distinguished by their adsorption state, e.g., HOPD at an atop site and HUPD at a bridged site for Pt(111) 20,21 and Pt(100). 21 Based on our DFT calculations, a reaction mechanism for the reduction of O2 to H2O2 by HOPD reasonably explained the suppression of j(H2O2) at a Pt skin-PtCo alloy, compared with Pt. 5 While ECA is dominated by the amount of HUPD per unit mass of Pt measured in N2-saturated solution (p[H2] ≈ 0, 0.05 V ≤ E ≤ 0.4 V), the amount of HOPD per Pt mass in H2-saturated solution around 0 V can be considered to be proportional to the ECA value or, more specifically, a certain fraction of ECA. The bridging configuration (HUPD) is more stable than the atop one (HOPD) and can be considered to be in thermal equilibrium on Pt(111) and Pt(100). 20–22 An HOPD/HUPD ratio can be estimated based on the calculated energies and are highly dependent upon the numbers of adsorbed hydrogen atoms and water molecules (see Table SI), as well as the temperature. The effect of water is significant, because the HOPD species has been shown to hydrogen-bond with water, whereas the HUPD species does not. The effect of even single water stabilizes the HOPD state by approximately 14 kJ mol−1 with high Had coverage (see details in the Supporting Material).
Our previous DFT calculations showed that the HUPD is converted to HOPD to react with adsorbed O2, initially forming an adsorbed HO2 as a metastable intermediate. 5 The O2 can adsorb in an end-on fashion to surface Pt atoms that are surrounded by a hexagon of Pt atoms with adsorbed HUPD. The latter can then be thermally converted to HOPD, which then can react with the adsorbed O2. 5 The presence of water makes the formation of the HOPD more favorable, as already noted. We have calculated energies for the conversion of HUPD to HOPD on Pt surfaces with high Had coverage, and found that, for high H coverage and the presence of water, the value can be as low as 12.6 kJ mol−1 (Table SI). This reaction pathway seems highly likely. Further research work to clarify the reaction mechanism is in progress.
It can also be seen in Fig. 4 that thej(H2O2)@0 V increased with decreasing temperature. This trend is opposite to the HOPD/HUPD ratio, which increases with temperature. Such a decrease in H2O2 production rate at elevated temperature can be ascribed to the well-known decrease in the coverage of HUPD and thus, by extension, HOPD with increasing temperature, as evidenced from several studies on low-index Pt single crystal surfaces. 23,24 This decrease is driven by the increase in entropy for the solution-phase hydrated proton and thus increasing stability for this species with increasing temperature. It has been reported that the degradation rate of the PEM increased significantly with temperature, 25,26 in spite of the decrease in the j(H2O2) with temperature shown in the present work. The accelerated degradation rate of the PEM at elevated temperature suggests that the increase in the rate constant for the radical decomposition reactions might be much larger than the decrease in H2O2 production rate.
Dependence of HOR mass activity on dPt at 20 to 80 °C
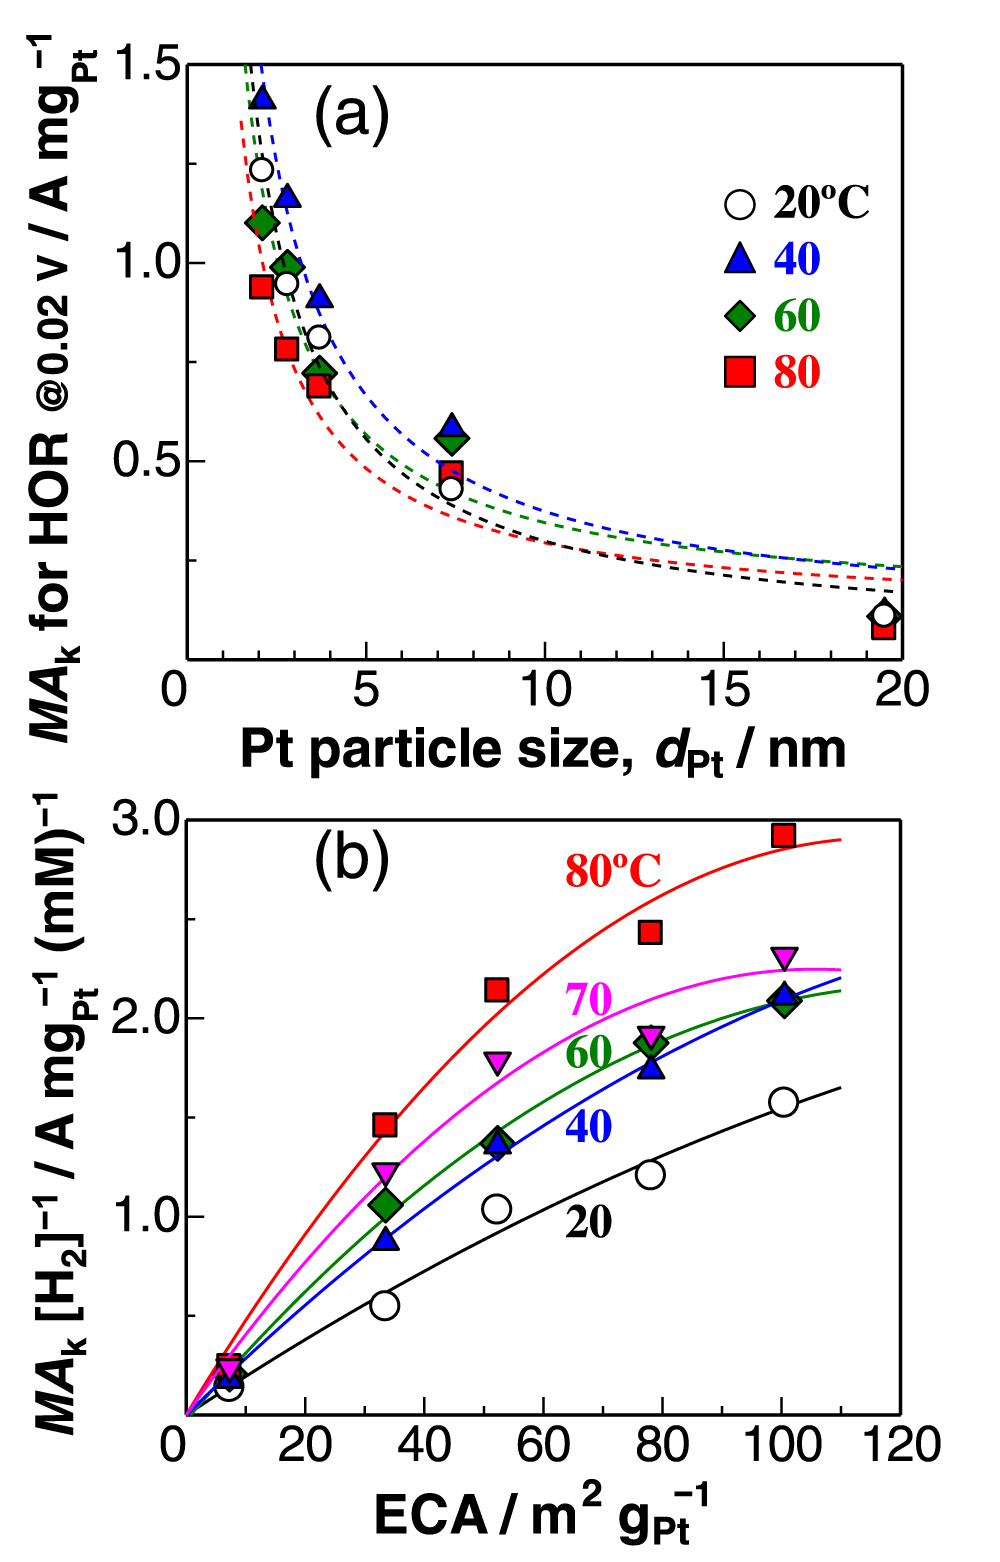
Thus, to minimize H2O2 production for the durability of PEM, the Pt particle size dPt should ideally be as large as possible: Pt black exhibited the lowest j(H2O2). In contrast, the kinetically-controlled mass activity MAk for the HOR drastically decreased with increasing dPt, as shown in Fig. 5a. Then, we focus on the effect of temperature on MAk. Since the solubility of H2, [H2], decreases with increasing temperature, the MAk values normalized by the solubility [H2] at each temperature are plotted as a function of ECA in Fig. 5b. The MAk [H2]−1 values increased with temperature. At 20 °C, the MAk [H2]−1 value was nearly proportional to ECA. With increasing temperature, the increase in MAk [H2]−1 with ECA gradually slowed down, specifically for dPt ≤ 3.7 nm, whose relation was fitted with a second-order (parabolic) polynomial.
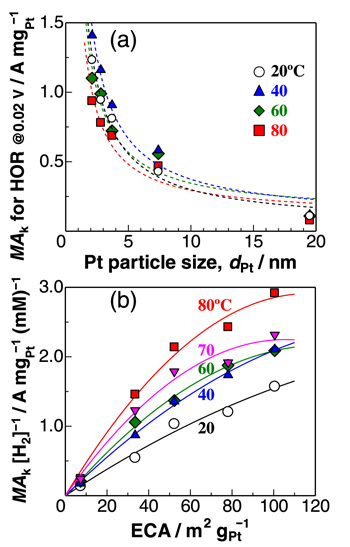
Figure 5. (a) Relation between kinetically-controlled mass activity MAk for the HOR at 0.02 V and ECA in 10% air/H2-saturated 0.1 M HClO4. Each dotted line is a least-squares fitting for dPt −1 dependency; (b) Plots of MAk [H2] −1 (normalized by H2 solubility) as a function of ECA (measured at 40 °C). Solid line is a least-squares fitting with the second order equation at each temperature.
Download figure:
Standard image High-resolution imageHere, we discuss such a dependence of MAk for the HOR on ECA or dPt briefly. The surface of Pt NPs usually consists of low-index facets such as (111) and (100), as well as (110), which corresponds to the edges between two (111) facets. Marković et al. have reported for Pt single crystal electrodes in 0.05 M H2SO4 that the exchange current densities for the H2 oxidation/H2 evolution increased in the order (111) ≪ (100) < (110) at 274 K and (100) < (111) < (110) at 333 K. 27 Such a temperature-dependence was explained by the order of activation energy ΔH‡(111) > ΔH‡(100) > ΔH‡(110). In our previous work, 28 we proposed a HOR mechanism to account for a significant variation of HOR activities on a series of Pt skin-covered Pt alloys with and without adsorbed CO at 70 and 90 °C. After the H2 dissociation at the step/edges (Tafel step), the dissociated H atoms can "spillover" to the (111) terraces, which can accommodate larger numbers of atoms, prior to the oxidative charge transfer reaction (Volmer step):


The Tafel step can be, of course, directly followed by the Volmer step (oxidation of Had(step) at step/edges), i.e., high activity at Pt(110). 27 Because the spillover rate should increase with elevating temperature, the contribution of the HOR rate at (111) terraces should increase with temperature, consistent with a remarkable increase in the HOR activity at Pt(111) (large activation energy). 27 It is suggested that the parabolic change in MAk with ECA at higher temperatures (Fig. 5b) can be ascribed to a decrease in the fraction of (111) terrace sites with decreasing dPt. Further discussion for the dependence of HOR activity on dPt will be presented elsewhere.
Trade-off relation between j(H2O2) and MAk for the HOR
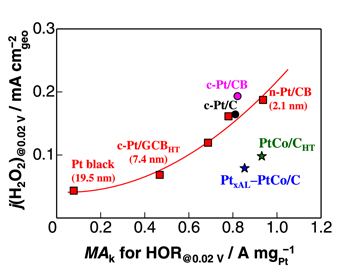
The j(H2O2) values at 0.02 V and 80 °C on various catalysts are plotted as a function of MAk at 0.02 V in Fig. 6. Data points for a series of Pt catalysts with dPt from 2.1 to 19.5 nm examined in this work are fitted well with a second-order polynomial, which shows the trade-off relationship between high HOR mass activity and low durability, due to the high H2O2 production rate. The data for c-Pt/CB and c-Pt/C catalysts lie near the trade-off curve. In contrast, Pt skin-covered PtCo alloy NPs supported on carbon (780 m2 g−1), PtxAL‒PtCo/C (prepared in house) and PtCo/CHT (prepared by TKK), exhibited appreciably low j(H2O2) while maintaining high MAk for the HOR. 5 The value of j(H2O2) on PtxAL‒PtCo/C was less than half of that on c-Pt/C or c-Pt/CB having comparable MAk. A similar level of excellent performance for PtCo/CHT is demonstrated, superior to n-Pt/CB with dPt = 2.1 nm. Hence, it is essential to design anode catalysts that break away from the trade-off curve for the pure Pt catalysts, toward the right (high mass activity for the HOR) and lower (low production rate of H2O2). Specifically, one important key is to design the catalyst surface such that the HOPD coverage is low.
Figure 6. Plots of j(H2O2) at 0.02 V as a function of MAk for the HOR at 0.02 V on various catalysts in 10% air/H2-saturated 0.1 M HClO4 at 80 °C. The solid line is plotted for the Pt catalysts with dPt ranging from 2.1 nm to 19.5 nm, fitted with a second order polynomial; this exemplifies the trade-off between HOR activity and durability (see text). Data for c-Pt/CB, c-Pt/C, PtxAL‒PtCo/C, and PtCo/CHT are cited from Ref. 5.
Download figure:
Standard image High-resolution image
Conclusions
We have clarified the Pt particle size effect on the H2O2 production rate j(H2O2) and the kinetically-controlled mass activity MAk for the HOR on Pt hydrogen anode catalysts with particle sizes from 2.1 nm (carbon-supported Pt NPs) to 19.5 nm (Pt black) in 10% air/H2-saturated 0.1 M HClO4 over a practical temperature range between 20 and 80 °C for PEFCs. The j(H2O2) was found to be inversely proportional to dPt, converging to the lowest limit on Pt bulk. The dependences of j(H2O2) on the potential, ECA, and temperature are well explained by a mechanism for the reduction of O2 to H2O2 by HOPD. In contrast, the MAk for the HOR increased with ECA, whose dependence gradually changed with temperature. A clear strategy for developing novel anode catalysts is to break away from the trade-off between the HOR mass activity and the H2O2 production rate, i.e., low durability, that we observed for conventional pure Pt catalysts.
Acknowledgments
This work was supported by funds for the "R&D of novel anode catalyst project" in "Collaborative industry-academia-government R&D project for solving common challenges toward dramatically expanded use of fuel cells" from the New Energy and Industrial Technology Development Organization (NEDO) of Japan.