
Abstract
The oxidation of iodide in NaI-AlBr3, NaI-AlCl3, and NaI-GaCl3 molten salts was analyzed using simulation software to extract relevant kinetic parameters. The experimental oxidation potentials were ordered AlCl3 < AlBr3 < GaCl3, with higher oxidation potentials correlating with softer Lewis acidity of the metal halide. An iodide oxidation and metal halide speciation model was developed and simulated to fit the electrochemical response, enabling determination of electrochemical charge transfer parameters and chemical equilibrium constants. NaI-AlBr3 displayed the fastest electron transfer rates yet showed the lowest current densities. All salts revealed smaller than expected current densities, explained by equilibrium between various species, where some are not electrochemically active at the studied potentials. These equilibrium reactions are due to the various metal halide species, controlling the reactant concentration of iodide and the resultant current. We hypothesize the electrochemically active iodide species, present as a metal halide monomer (MX3I−), is decreased dramatically from the expected concentration, sequestered as a more stable metal halide dimer species (M2X6I−) with a higher oxidation potential. Traditional Tafel analysis of the experimental data supports the validity of the simulations. These results increase understanding of iodide oxidation in low-temperature Lewis acidic molten salts and inform task-specific molten salt design.
Export citation and abstract BibTeX RIS
Molten salts are an attractive medium for electrochemical energy storage due to their high charge density, high electrical conductivity, and large potential stability windows. 1–3 Coupled with molten sodium, molten salts have been used to store energy in commercialized ZEBRA batteries employing a NaAlCl4 molten salt electrolyte. 4,5 More recently, work has focused on lowering the battery operating temperature from 300 to <150 °C to decrease system-level costs and increase the deployment of grid scale energy storage. 6–10 To further decrease the operating temperature to just above sodium's melting temperature (98 °C), our group has developed NaI-based catholyte chemistries where NaI is complexed with a metal halide (e.g. AlCl3, AlBr3, GaCl3), forming a Lewis acid-base adduct and enabling stable battery cycling at 110 °C via the I−/I3 −/I2 redox. 7,11,12 From these reports, it is clear that the choice of the metal halide Lewis acid used in the molten salt has an outsized influence on overall battery performance. Besides changes in operating potential, the iodide reaction kinetics are significantly varied. 13,14
Iodide oxidation is typically regarded as an electrochemical-chemical (EC) reaction whereby I− is first electrochemically oxidized to I2 at the electrode, followed by chemical reaction with I− to form I3 −. 15–17 At higher potentials, I3 − may be further oxidized to I2. These processes have been well-characterized in a variety of aqueous, nonaqueous, and even various ionic liquid environments, demonstrating that the equilibrium constant for the chemical reaction I− + I2 → I3 − is large (103−107) and favors I3 − formation, though its exact value varies with solvent. 15,18–20
In the metal halide molten salts of interest, iodide speciation becomes more complicated, 1,21–25 though the two oxidation waves associated with oxidation of I−-containing and I3 −-containing species are still observed. 26 Specifically, in NaI-MX3 systems, where the I− is a Lewis Base and the MX3 is the Lewis acid (M = Al, Ga; X = Cl, Br) a Lewis Acid-Base adduct is formed. Additionally, the MX3 species is shown to primarily exist as a dimer (M2X6) in acidic melts (high mol% of MX3), which can also interact with the I− forming a dimer species (M2X6I−) or breaking the dimer apart to form a monomer species (MX3I−). 25,27 A chemical equilibrium between these species can be stated: 21

Here chemical reactions are labeled with a C prefix (C1), while the electrochemical reactions are referenced with an E prefix (e.g. E1). At acidic concentrations, such as the low NaI concentrations (<35 mol%) used in this work, the free I− concentration is expected to be negligible. 21,23,28 Based on reports of NaCl-AlCl3, the oxidation potential of M2X6I− is expected to be significantly higher than that of MX4I−. 29 Thus, the equilibrium of metal halide species controls the concentration of reactant available for oxidation, and the specific iodide-containing species themselves influence the rate of diffusion and electron transfer, as opposed to a simple free iodide species. 30
Modeling of electrochemical data is a powerful technique that can be used to extract both rate constants and chemical equilibrium constants from recorded data. To better understand the relationship between the kinetics of iodide oxidation and speciation in these molten salt systems, this report compares the performance of 25 mol% NaI in AlBr3, 35 mol% NaI in AlCl3, and 25 mol% in GaCl3. (These compositions are fully liquid at the targeted temperatures and represent a compromise in phase stability.) By leveraging carbon fiber microelectrodes, uncompensated resistance contributions from IR losses at high currents or variations in double layer capacitance were minimized, 31,32 while the composition of the molten salt remained nearly constant throughout experimentation due to the small amount of charge passed. Understanding the interplay between the electrochemical and chemical performance on the metal halide molten salt system will inform catholyte design for Na-metal halide batteries and will enable future design of task-specific molten salts for iodide oxidation applications.
Experimental
Chemicals and materials
All chemicals were purchased and used as received. Potassium chloride (KCl, Fisher Scientific), potassium ferricyanide (K3Fe(CN)6, Spectrum Chemical MFG) were used as received. Sodium iodide (NaI, 99.99%, ultra-dry, Alfa Aesar), aluminum tribromide (AlBr3, 99.999%, ultra-dry, Alfa Aesar), aluminum trichloride (AlCl3, 99.999%, ultra-dry, Alfa Aesar), and gallium trichloride (GaCl3, 99.999% ultra-dry, Alfa Aesar) were ampouled under argon by the manufacturer and were opened and used in an argon-filled glovebox (<0.2 ppm H2O, O2) for all molten salt experiments. The reagents are specified to have < 100 ppm residual water content. Aqueous solutions were made in 18.2 MΩ*cm DI water.
Electrolyte preparation
Compositions of the NaI-MX3 electrolyte are labeled as Y mol% NaI-MX3, where the Y is the mol% of NaI in the salt with the rest being the identified MX3 compound. Appropriate masses of reagents were weighed to obtain mixtures of salts with either (1) 75 mol% AlBr3–25 mol% NaI, (2) 65 mol% AlCl3–35 mol% NaI, or (3) 75 mol% GaCl3–25 mol% NaI. Approximately 17 g total salts were added to a 20 mL glass vial, mixed, sealed, and then melted using a hot plate with an aluminum block machined to tightly hold the vial in the center of the block. The large block prevented any temperature fluctuations in the molten salt test vial throughout all molten salt experiments. A thermocouple was inserted in a small hole near the molten salt sample vial to control the temperature of the hot plate. A schematic of the experimental setup is provided elsewhere. 14 The salts were initially heated to 90 °C or 100 °C for up to 2 h or until uniform, then cooled to room temperature overnight. Prior to data collection, the salts were heated to 120 °C for at least 1 h to allow the salt to reach thermal equilibrium. Molten salt concentrations were calculated using the number of moles weighed out and the salt volume calculated from a photograph at 120 °C in a vial of measured dimensions. The calculated initial NaI concentrations were found to be 6.1 M, 3.1 M, and 3.4 M for the 35 mol% NaI-AlCl3, the 25 mol% NaI-AlBr3 and the 25 mol% NaI-GaCl3 respectively.
Electrochemical measurements
Cyclic Voltammetry (CV) and chronoamperometry (CA) experiments were performed using a Gamry Reference 600+ potentiostat, in a standard 3-electrode configuration, with a sodium metal reference electrode utilizing a sodium ion conducting β''-alumina tube (Ionotec, UK) as the separator between the sodium metal and the molten salt and a tungsten rod (1.5 mm diameter, 99.95% metals basis, Alfa Aesar) as the counter electrode. All potentials are referenced to Na/Na+. The working electrodes were carbon fiber ultra-microelectrodes (UMEs) (Bioanalytical Systems Inc., 11 ± 2 μm diameter). Before the molten salt experiments, the electrodes were polished on 1200 grit silicon carbide polishing paper, then on a nylon polishing pad with 0.05 μm alumina suspension, and finally cleaned by sonicating in DI water to remove any alumina particles. The electrochemically active surface area of each working electrode was obtained by measuring the steady state diffusion-limited current in a 5 mM aqueous ferricyanide solution with 1 M KCl supporting electrolyte, using a platinum wire counter electrode and a commercial Ag/AgCl reference electrode (BASi). The radius, a, of the electrodes was calculated according to the steady-state current, iss , expected for a disk-shaped UME, 32,33 iss = 4nFDCb a, where n is the number of electrons, F is Faraday's constant, D is the diffusion coefficient of ferricyanide (D = 7.6 × 10⁻⁶ cm2 s−1) 32,34 and Cb is the bulk concentration of ferricyanide.
Electrochemical simulation
All simulations were completed using DigiElch 8.F (Gamry Instruments). Upon importing experimental CV data into DigiElch, a model was constructed by adding in charge transfer and chemical reactions and fitting the associated parameters using DigiElch's non-linear regression data fitting algorithm. The parameters obtained from the iterative data fitting were then adjusted manually until there was an agreeable match between the simulation and the experimental data for the forward scans only. All models were created using a set temperature of 120 °C and followed the Butler-Volmer formulation of electrode kinetics, as seen in Eq. 1 below for a 1 step, 1 electron process.

Where iBV is the current associated with the Butler-Volmer kinetics at the electrode, A is the area of the electrode, F is Faraday's constant (defined earlier), R is the gas constant, T is the temperature in Kelvin, ko is the standard heterogeneous electron transfer coefficient, E is the applied potential, Eo is the standard reduction potential for the given reaction, CO and CR are the bulk concentrations of the oxidized and reduced species, respectively. To accurately reflect the significant contribution of edge effects seen in the diffusion profile of disk ultramicroelectrodes, semi-infinite 2D diffusion conditions were incorporated with the disk shaped electrode geometry. 31 The calculated radii of the electrodes were input into the simulation software for a given set of data. The "smart" pre-equilibrium setting was enabled, allowing for an automatic calculation of the initial concentrations of the present species based on the equilibrium constants of the related chemical reactions. An x-grid expansion factor of 0.5 and a y-grid expansion factor of 1.0 was used, and data points were generated every 1 mV, standard DigiElch simulation parameters.
Results and Discussion
In order to better understand the differences in iodide oxidation in acidic NaI-MX3 molten salt systems, compositions with MX3 = AlBr3, AlCl3, or GaCl3 were melted in an argon-filled glovebox and interrogated in a standard 3-electrode electrochemical cell. A general model, involving many complex electrochemical and chemical reactions for iodide oxidation and speciation was developed and used in conjunction with the electrochemical simulation software DigiElch to fit the experimental data and elucidate the electrochemical and chemical processes at play. Afterwards, traditional Tafel analysis was used to corroborate select results from the electrochemical simulations.
For AlBr3 and GaCl3, 25 mol% NaI was used to obtain a fully molten salt at 120 °C. To avoid AlCl3-rich precipitates and obtain a fully molten salt, 35 mol% NaI was needed in AlCl3 (35 mol% NaI in AlBr3 or GaCl3 contains NaI-rich precipitates). Images of these salts can be seen in Fig. 1 where the 25 mol% NaI in AlBr3 and GaCl3 and 35 mol% NaI-AlCl3 are fully molten but the 25 mol% NaI-AlCl3 contains a substantial amount of solids, precluding it from being used in the tests. By only using fully molten compositions, the composition of the liquid phase is precisely known and any deviation from the calculated mass transport limited current can be attributed to a species that is not electrochemically active at the test potentials.
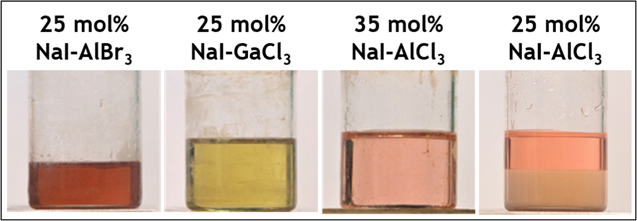
Figure 1. Pictures of molten salt compositions at 120 °C. All are fully molten except for the 25 mol% NaI-AlCl3.
Download figure:
Standard image High-resolution imageCyclic voltammetry
CVs of the molten salt systems at a carbon fiber UME are presented in Fig. 2A. As expected, the iodide oxidation potentials are ordered AlCl3 < AlBr3 < GaCl3. All CVs contain two closely placed oxidation waves; this behavior is most clearly seen in the GaCl3 melt. This behavior is consistent with our previous reports 13,14 and other reports of NaI oxidation in molten salts, where the waves were associated with oxidation of I− and higher order polyiodides. 26,35,36 The first wave is attributed to the electrochemical oxidation of iodide and the second wave is attributed to the electrochemical oxidation of triiodide. The various CVs were not run to higher potentials as the formation of bubbles, leading to dramatic current fluctuations was observed.
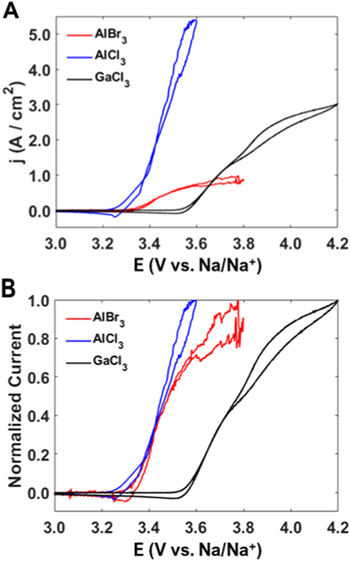
Figure 2. (A) Cyclic voltammograms at a carbon fiber UME in 25 mol% NaI in AlBr3, 35 mol% NaI in AlCl3, or 25 mol% NaI in GaCl3. (B) CVs in (A) normalized by maximum current. All measurements were recorded at 100 mV s−1 and 120 °C.
Download figure:
Standard image High-resolution imageThis ordering is predicted by Hard-Soft Acid Base (HSAB) theory, where softer Lewis acids such as GaCl3 will bond more strongly with soft bases such as I−. 37,38 AlCl3, on the other hand, is a hard acid and is not expected to bond as strongly. The absolute hardness, η, of the Lewis acids can be calculated according to Parr and Pearson 39 from the molecules ionization energy (IE) and the electron affinity (EA) by the relation, η = ½(IE-EA) with a larger value of η indicating higher hardness and a low value of η indicating softness. Using the values for the electron affinity and ionization energy for each molecule (The IE is 12.8 eV 40 for AlCl3, 12.2 eV 40 for AlBr3 and 11.5 eV 41 for GaCl3 and the EA is 1.0 eV 39,40 for AlCl3 and 1.81 eV 42 for GaCl3). For AlBr3, a value of 1.4 eV was approximated for the electron affinity (the average of the values from AlCl3 and GaCl3) as a referenced value was not found (any EA value from 0.6–2.4 eV would still lead the hardness of AlBr3 to be between that of AlCl3 and GaCl3). From this relationship and the discussed IE and EA values, we calculate that the hardness values for AlCl3, AlBr3 and GaCl3 are 5.9, 5.4 and 4.9 eV, respectively. This confirms the decreasing acidity as discussed previously and with I− having a η value of 3.7 eV, 39 it is predicted that I− will bond more strongly to GaCl3. The increased oxidation potential observed for the GaCl3 molten salt indicates that more energy is required to oxidize the MX3I− as the oxidation wave is shifted to potentials 250–300 mV higher than those of the AlCl3 or AlBr3 melts.
While the AlCl3 melt is expected to have the largest current density by virtue of increased NaI concentration (35 mol% vs 25 mol%), the AlBr3 melt displays about one third the maximum current of the GaCl3 melt. This was surprising as the similar compositions should mean the currents would be relatively close in value (slightly different diffusion coefficients would change the observed currents but cannot fully account for the large difference). By evaluating the different calculated diffusion coefficients (presented later) the 25 mol% NaI-AlBr3 should have 60% of the observed currents from the 25 mol% NaI-GaCl3 melt, but instead it is only 30%. This large deviation may indicate that there is a rather large amount of iodide that is unavailable to be oxidized. Curiously, normalizing the CVs by maximum current more clearly reveals that the AlBr3 melt possesses the steepest rise in current for the first oxidation reaction at the foot of the wave. This qualitatively suggests that the NaI-AlBr3 system displayed faster electron transfer kinetics compared to the other two systems. Further investigation of the experimental CV curves by simulating the electrochemical responses can reveal more of the phenomena that is occurring in these systems and quantitatively investigate the underlying reasons for these observations.
Model development
Using the recorded CV data and previous reports as a guide, the well-accepted EC reaction pathway for iodide oxidation was adapted to the complex NaI-MX3 system. Scheme

Scheme 1. Model for electrochemical-chemical reaction of iodide described by electrochemical reactions E1–E2 and chemical reactions C2–C7.
Download figure:
Standard image High-resolution imageHaving established initial chemical equilibrium, the working electrode potential may be increased sufficiently to drive electrochemical reaction E1, shown at marker ii in Scheme


The second oxidation wave in the CVs is described by the electrochemical charge transfer reaction of Eq. E2. Here an electron is removed from the newly-formed MX3I3
− species, yielding I2 and the radical MX3I · as denoted near marker iii in Scheme
Model parameters
Having created a framework in which to house the EC reactions, it is now necessary to identify the parameters which describe the individual reactions of E1–E2 and C2–C7. For every species present, it is necessary to define a diffusion coefficient and a concentration. Diffusion coefficients for MX3I− were calculated using a previously described chronoamperometric analysis method requiring no a priori knowledge of reactant concentration. 13,14,17,44 This is critical, as it does not assume all NaI creates I−-species available for oxidation; some may be "locked up" in the more electrochemically stable species M2X6I−. The utilized method of analysis takes advantage of the fact that when the time dependent current for a microdisk electrode, i(t), is normalized to its respective steady state current equation, iss , (defined earlier for a disk electrode) the resulting straight line gives a slope, from which the diffusion coefficient can be easily calculated. 17,44 The diffusion coefficients for the iodide reactant species in the 120 °C melts were calculated to be 3.10 × 10⁻⁶ cm2 s−1, 4.40 × 10⁻⁶ cm2 s−1, and 4.92 × 10⁻⁶ cm2 s−1 for 25 mol% NaI-AlBr3, 35 mol% NaI-AlCl3, and 25 mol% NaI-GaCl3, respectively. In these experiments, migration is not considered as the electrolyte is highly concentrated and very conductive. Additionally, the small current magnitudes (resulting from the use of UMEs) should not result in any significant voltage drop that would otherwise lead to increased ion (reactant) flux to the electrode. The diffusion coefficients for all other species, except I·, were approximated by scaling the diffusion coefficient by the relative molecular radius as predicted by the Stokes-Einstein equation. The diffusion coefficient of these species could be varied by an order of magnitude without appreciably influencing the simulation results. The diffusion coefficient for I· was set to 10−10 cm2 s−1, in an effort to mimic adsorption of I· on the electrode surface.
Concentrations for all species were initially set to zero, except for MX3 and MX3I−. The initial concentrations of MX3 and MX3I− were derived from the calculated concentration of NaI in the molten salt, and chemical reactions C2–C7 were used by DigiElch to equilibrate all species before running simulations according to the input equilibrium and rate constants.
For each chemical reaction an equilibrium constant (Keq) and forward rate constant (kf) must be specified. All values, determined after fitting the electrochemical data, are compiled in Table I. For Eq. C2, the value of the equilibrium constant was taken from references that calculated the values for the NaCl-AlCl3 system (at 175 °C). 21,23 This value was used across all three NaI-MX3 systems to approximate the simple dimerization reaction of the Lewis acid MX3. In all cases, this value is quite high, consistent with the known preference for metal halide molecules to exist primarily as M2X6, and not MX3. Order of magnitude changes (10–100x) to Keq for C3 will not significantly affect the electrochemical behavior of the system, or the simulation output. Without detailed knowledge, changing this value would be subjective.
Table I. Summary of Keq and kf for the chemical reactions in Eqs. C2–C7. Values for C4, C5, and C7 were fixed and not fitted to experimental data. No Keq values for C4, C5, and C7 are listed as they were automatically calculated by the simulation software from the other entries.
| C2 | C3 | C4 | C5 | C6 | C7 | |||||||
|---|---|---|---|---|---|---|---|---|---|---|---|---|
| Keq | kf | Keq | kf | Keq | kf | Keq | kf | Keq | kf | Keq | kf | |
| AlBr3 | 2.8 × 10⁷ | 1.0 × 10⁷ | 4600 | 1.0 × 10⁴ | — | 1.0 × 10¹⁰ | — | 1.0 × 10¹⁴ | 500 | 1.0 × 10⁴ | — | 1.0 × 10¹⁰ |
| AlCl3 | 2.8 × 10⁷ | 1.0 × 10⁷ | 900 | 1.0 × 10⁴ | — | 1.0 × 10¹⁰ | — | 1.0 × 10¹⁴ | 500 | 1.0 × 10⁴ | — | 1.0 × 10¹⁰ |
| GaCl3 | 2.8 × 10⁷ | 1.0 × 10⁷ | 1300 | 1.0 × 10⁴ | — | 1.0 × 10¹⁰ | — | 1.0 × 10¹⁴ | 500 | 1.0 × 10⁴ | — | 1.0 × 10¹⁰ |
Keq for Eq. C3 was initialized using a value from literature for the equivalent reaction in the NaCl-AlCl3 system at 175 °C. 21 This value was then optimized until the simulation agreed with the experimental CV data. Keq in C2 primarily controlled the maximum current in the simulation CV, by way of controlling the concentration of electroactive reactant MX3I−. Equations C4, C5, and C7 were assumed to strongly favor the forward reaction, and kf was fixed at 1010 or 1014. The values for Keq for these reactions are not listed in Table I as they are automatically calculated by the simulation software based on the other equilibrium and rate constants entered. For C6, all values were chosen to be the same, reflecting our assumption that the complexation of the free iodine species (I2) in the melt with MX3I− was similar. A suitable literature reference to use as a starting point could not be identified and the chosen value provided a good match to the experimental data. Further refinement of C6 values is possible, but for the purposes outlined here, the applied values revealed the important and desired thermodynamic and kinetic trends.
Overall, chemical reaction C3 was found to most strongly influence the fitting results. On the other hand, Eqs. C2 and C6 could be varied by an order of magnitude and without strongly influencing the quality of the fit to the electrochemical data. For this reason, the values of C2 and C6 are the same for all salt systems, and these values should not be taken as precise indicators of their actual values.
For electrochemical reactions E1 and E2, a standard state potential (Eo), heterogeneous electron transfer rate (ko), and charge transfer coefficient (α), must be specified. These values were determined by fitting the model to the electrochemical data; no values were fixed. Unlike the chemical parameters, all electrochemical parameters were highly sensitive. Small changes in these parameters resulted in gross changes to goodness of fit.
Kinetic analysis results
The outlined chemical/electrochemical model was simulated with the listed constants and showed excellent agreement between the simulated CVs and experimental data, as seen in Fig. 3. Values of all electrochemical parameters of interest are compiled in Table II. In agreement with the CVs, Eo for both E1 and E2 are ordered AlCl3 < AlBr3 < GaCl3, consistent with softer Lewis acidity requiring increased oxidation potentials. Consistent with observations of AlBr3 having the steepest slope in CVs in Fig. 2B, AlBr3 displayed in the largest ko in reactions E1, followed by GaCl3 and then AlCl3. Likewise, values α for AlBr3 and GaCl3 were significantly higher than that of AlCl3 for E1. The rates for ko changed for E2 and were observed to still be largest for AlBr3, but AlCl3 and GaCl3 switched place. Surprisingly, for E2, GaCl3 showed the largest value for α, followed by AlBr3, and with AlCl3 still displaying the smallest value. Despite superior values of its electrochemical parameters and similar diffusion coefficients, AlBr3 displayed by far the lowest overall current densities in CVs in Fig. 2. This discrepancy can be accounted for in the relative concentrations of MX3I− available for oxidation, listed in Table II. Here it is seen that only 1.37 M AlBr3I− (only 44.2% of added NaI) is predicted to be present, compared to the larger available concentrations of 4.91 M AlCl3I− (80.6% of added NaI) or 2.41 M GaCl3I− (70.5% of added NaI). Thus, despite superior electron transfer rates, the decreased concentration of AlBr3I− decreased the maximum current of the AlBr3 melt and depressed currents to less than a third of the GaCl3 melt, which contains the same mol% NaI and similar mol L−1 concentration of the liquid melt.

Figure 3. Comparison of experimental data with those generated by simulation of the model for (A) 75 mol% AlBr3–25 mol% NaI, (B) 65 mol% AlCl3–35 mol% NaI, and (C) 75 mol% GaCl3–25 mol% NaI.
Download figure:
Standard image High-resolution imageTable II. Summary of parameters for electrochemical reactions E1 and E2 with calculated initial and equilibrium concentrations of reactant.
| E1 | E2 | MX3I− Concentration | |||||||
|---|---|---|---|---|---|---|---|---|---|
| Eo (V) | ko (cm s−1) | α | Eo (V) | ko (cm s−1) | α | Initial (mol l−1) | Equilibrium (mol l−1) | Reactant available (%) | |
| AlBr3 | 3.79 | 0.80 | 0.64 | 3.93 | 0.70 | 0.61 | 3.10 | 1.37 | 44.2 |
| AlCl3 | 3.49 | 0.014 | 0.49 | 3.69 | 0.30 | 0.50 | 6.09 | 4.91 | 80.6 |
| GaCl3 | 4.00 | 0.26 | 0.63 | 4.17 | 0.09 | 0.77 | 3.42 | 2.41 | 70.5 |
The decrease in AlBr3I− concentration is most strongly controlled by reaction C3, with Keq values listed in Table I. Here it is seen that the forward reaction, forming unreactive M2X6I−, is most strongly favored for AlBr3, and least strongly favored for AlCl3. The enthalpies of dimerization (reaction C2) for AlCl3 and AlBr3 are nearly identical, as seen in the literature 27 and predicted by Table I. Thus, the difference in C3 Keq is mainly attributed to the relative formation energy of MX3I− vs M2X6I−. For Al2Br6, the more diffuse charge density across the less electronegative Br− ligand likely increases the relative stability of the bridging I in Al2Br6I− vs Al2Cl6I−. That Keq for GaCl3 in reaction C3 is intermediate AlCl3 and AlBr3 is consistent with this prediction; Cl− ligands are more electronegative than Br− ligands, and Al is more polarizable than Ga.
While it is tempting to suggest increasing the initial NaI concentration to increase the resulting AlBr3I− concentration, addition of more NaI results in precipitation of NaI-rich solids; 14 the concentration of iodide in the liquid phase cannot be increased enough to significantly raise the current observed in CV. In order to increase the AlBr3I− concentration, alternative Lewis bases must be added, or the temperature must be increased (contrary to the goal of a low temperature battery catholyte).
From these results, it is observed that the standard heterogenous electron transfer rate for MX3I− oxidation is positively correlated with the M2X6I−/MX3I− equilibrium constant (C3). Put another way, metal halides that create more acidic melts at a given composition (M2X6I− is also Lewis acid) tend to have faster heterogenous electron transfer rates from MX3I− to the electrode. In these acidic melts, the MX3I− anion is less stable, instead forming M2X6I−. While on an absolute potential scale, (e.g. vs Na/Na+), it may be easier to remove an electron from AlCl3I− than AlBr3I−, the relative lack of stability (higher C3 Keq) of AlBr3I− vs AlCl3I− in the melt could also be interpreted as a relatively increased partial charge transfer rate from AlBr3I− to AlBr3, (forming the dimer species) vs AlCl3I− to AlCl3. In this sense, it is not surprising that an increased homogenous reaction rate, donating partial charge from AlBr3I− to AlBr3, would also correlate to an increase in the heterogenous reaction rate, donating electron from AlBr3I− to the electrode. However, exact comparison of kf and kb for reaction C3 could not be performed since kf was fixed at 10,000 for each system and Keq was varied. These considerations may inform ways to engineer the salt systems by adding additives to the salts or combining Lewis acids to making ternary or quaternary combinations to increase both available reactant concentration and electron transfer rates.
Verification of model results
In an effort to support the findings from the model and increase confidence in the extracted values, we compared the simulated values of α from the electrochemical reaction E1 to the experimentally derived values. The experimental α values were derived from traditional Tafel analysis performed on the forward scan of the CVs in Fig. 2. 32 The fits to the electrochemical data are presented in Fig. 4. α values extracted from these plots were 0.66, 0.54, and 0.59 for the AlBr3, AlCl3, and GaCl3, melts, respectively. These values compare favorably with the α values of 0.64, 0.49, and 0.63 determined from fits of the model to the electrochemical data (Table II, Reaction E1). This agreement between the simulated complex model and traditional Tafel analysis lends credibility to the model.

Figure 4. Tafel analysis of MX3I− oxidation from the CVs in Fig. 1. The slopes from the fits were used to calculate the charge transfer coefficients (α) directly from the experimental data and compared with the electrochemical model.
Download figure:
Standard image High-resolution image
Conclusions
Electrochemical simulations were used to extract relevant kinetic parameters for iodide oxidation from CVs recorded at carbon fiber UMEs in a series of molten compositions comprised of different Lewis acidic metal halides. Using reports from the literature, an EC model for iodide oxidation was developed, simulated in the software DigiElch, and fit to the experimental electrochemical data. Specifically, 25 mol% NaI in AlBr3, 35 mol% NaI in AlCl3, and 25 mol% NaI in GaCl3 were interrogated at 120 °C to ensure a fully molten state with 100% of the iodide incorporated into the melt. Excellent fits were obtained with the model, allowing determination of electrochemical parameters Eo, ko, and α. As expected, standard state oxidation potentials (Eo) were ordered AlCl3 < AlBr3 < GaCl3, consistent with softer Lewis Acidity predictions from HSAB. Curiously, the AlBr3 melt displayed the largest values of ko and α, yet showed the lowest current densities in CV. This discrepancy was accounted for by the speciation of the molten salts. Fitting of chemical equilibrium constants revealed that the concentration of AlBr3I− was significantly lower than that of AlCl3I− or GalCl3 −, explained by the relative equilibrium of AlBr3I− and Al2Br6I−. Constrained by stability of the liquid phase, the NaI-AlBr3 system is ultimately limited in current density by this speciation. On the other hand, the lower values of ko and α in the AlCl3 melt were overcome by the much larger percentage of the expected value of available iodide reactant compared to AlBr3 melts. Together, these results increase understanding of iodide oxidation in low-temperature Lewis acid-base molten salts and inform design of task-specific molten salts for low-temperature iodide oxidation. Additionally, this study helps reveal important considerations to advance these systems and how to selectively control the reactive nature of the species in order to maximize the reactivity and the available reactant concentrations.
Acknowledgments
This work was supported by the U.S. Department of Energy's Office of Electricity through the Energy Storage Program, managed by Dr. Imre Gyuk. Sandia National Laboratories is a multi-mission laboratory managed and operated by National Technology and Engineering Solutions of Sandia, LLC, a wholly-owned subsidiary of Honeywell International, Inc., for the U.S. Department of Energy's National Nuclear Security Administration under contract DE-NA0003525. This paper describes objective technical results and analysis. Any subjective views or opinions that might be expressed in the paper do not necessarily represent the views of the U.S. Department of Energy or the United States Government.
Author Contributions
The manuscript was written through contributions of all authors. All authors have given approval to the final version of the manuscript.