
Abstract
Waste biomass shows great potential as a carbonaceous electrode material candidate for energy storage devices due to its abundant element composition and renewability. Here, we propose a facile approach to prepare N/O/P tri-doped hierarchical porous carbon electrode materials via forming a hydrogel with chitosan and phytic acid through electrostatic and hydrogen bonding. The as-samples exhibit large specific surface area, hierarchical pore structure and plentiful heteroatom doping. As the electrode materials, APC-2 achieves high specific capacitance of 320 F g−1 at 1 A g−1 and extraordinary cycling stability with 97% capacitance retention after 10000 cycles. Remarkably, by P-doping the voltage window of assembled symmetric supercapacitor is widened to 1.3 V in alkaline electrolyte and 1.7 V in neutral electrolyte. The energy density is up to 15.82 W h kg−1 at the power density of 850 W kg−1 in Na2SO4 electrolyte. These outstanding performance indicated that the facile conversion of renewable biomass hold prominent prospect for the sustainable applications in energy storage devices.
Export citation and abstract BibTeX RIS
The fossil fuels rapid consumption and the environmental pollution containment make the energy structure change to sustainable and renewable energy, which in turn requires new energy generation technology and energy storage device. 1–4 In which, supercapacitor has attracted much attention due to its ultrahigh power density, fast charge/discharge and long cycle life. 5–7 However, compared with batteries, the lower energy density seriously limits its wider practical application. 8–11 As one of the basic components of supercapacitor, the electrochemical properties of electrode materials for supercapacitor need further breakthrough. 3,12–14 Carbon materials with striking specific surface area, excellent conductivity and stable physicochemical properties have become the extremely potential electrode material for supercapacitor. 15–18 Great progress has been made in the synthesis of carbon electrode materials from various precursors, such as graphene, carbon nanotubes, and conductive polymers (polyaniline and polypyrrole). However, the preparation process is complex and the capacitance is relatively insufficient, which hinders the large-scale production of their practical application. 19–22 Natural biomass is considered as an ideal precursor for the preparation of porous carbon materials because of its advantages of low-cost, resource-abundant and eco-friendly, 23–25 such as waxberry, 6 cellulose, 26 and fresh ginger. 27
Although there have been many researches on the biomass as electrode materials to assemble devices, they show inferior electrochemical performance at high working potential window. 28 One effective approach is through heteroatoms doping to increase the electrical conductivity, provide additional pseudocapacitance and widen the operating potential window to improve electrochemical performance. 29,30 For instance, O atom doping can accelerate ion transport in the electrolyte by improving the wettability of the material surface. 31,32 N doping can change the electronic structure inside the carbon material and can also provide a small amount of pseudocapacitanc. 19,27,33–35 P doping can promote the edge plane wrinkling and create more defects and active sites for ion adsorption. Compared with N doping, P doping has higher electron contribution capacity, which is conducive to broaden the voltage window to effectively improve the electrochemical performance of supercapacitor. 16,36–38 Whereas, although there have been many reports about P doping, most of them used phosphorus containing chemicals, which were expensive and harmful to the environment. 39 So, phosphorus-containing phytic acid from biomass derivatives (widely found in the seeds of plants) used as dopant can effectively avoid the above problems. 39 In addition, multiple heteroatoms doped carbon materials can produce synergistic effect and have better electrochemical characteristics than single atom doped carbon materials. 1,40 Therefore, designing multi-doped carbon materials in an environmentally friendly is of significance.
The hierarchical porous structure for carbon electrode materials can realize higher specific capacitance and higher energy density by increasing the specific surface area and ion diffusion channel. 41 Generally, micropores provide a large specific surface area, but ions are difficult to penetrate into these pores. In contrast, the ion transport in macropores and mesopores is much easier, but their specific surface areas are not enough. Therefore, hierarchical porous carbon materials can simultaneously provide enough ion adsorption sites and shorten the ion diffusion distance, thus enhancing the electrochemical performance of supercapacitor. 12,33,42
Chitosan is the deacetylated derivative of chitin which contains abundant N and O atoms, and thus is deemed as a remarkable precursor for multi-doped carbon electrode materials. Here, a simple and universal way is proposed to fabricate N/O/P tri-doped hierarchical porous carbon from chitosan with phytic acid as dopant and KOH as activator. The dopant of phytic acid can not only dissolve chitosan and adjust gel structure, but also act as P, O source and porogen. The optimized APC-2 material has outstanding specific surface area (1650 m2 g−1), microporous-mesoporous structure, and plentiful heteroatom content. When APC-2 is applied as electrode materials, it has high capacitance performance and high cycle stability. What's more, by P-doping the operating voltage of assembled symmetrical supercapacitor can up to 1.3 V in alkaline electrolyte and up to 1.7 V in neutral electrolyte, respectively.
Experimental
Synthesis of APCs
First, chitosan (1.6 g) was dissolved in phytic acid with mass fraction of 50% and stirred at 60 °C for 2 h to form hydrogel. Then, the completely dissolved hydrogel was transferred to the freezing dryer for 24 h. After that, pyrolyze the obtained mixture at 400 °C and held for 2 h (2 °C min−1), and then carbonize at 850 °C for 2 h (5 °C min−1) under N2 flowing. According to the amount of phytic acid added (0.005 mol, 0.01 mol, 0.015 mol), the obtained carbon materials were named PC-1, PC-2 and PC-3 respectively.
Subsequently, 1 g PC-2 was thoroughly mixed with 2 g, 2.5 g or 3 g KOH respectively, and followed by grinding and carbonization at 800 °C (heating rate is 3 °C min−1) for 1 h under the protection of N2. Using 1 M HCl and distilled water to wash the as-obtained materials until the solution is nearly neutral and then placed in the oven overnight. For comparison, the resulting carbon materials were named APC-1, APC-2 and APC-3 from low to high according to the amount of KOH added.
Characterization
The morphological feature of all samples was analyzed by the scanning electron microscope (SEM, JSM-7610F). X-ray diffraction (XRD, Bruker D8 Advance) and Raman spectroscopy (Renishaw inVia) were applied to character the hierarchical porous structures of the carbon materials. X-ray photoelectron spectra (XPS, ESCALAB 250XI) was used to measure the chemical composition on the surface of samples. The SBET, total whole volume (Vtot) and pore size distribution of all samples were calculated based on Brunauer-EmmettTeller (BET) and density functional theory (DFT) through the Nitrogen adsorption and desorption curves (Micromeritics ASAP 2020 analyzer).
Results and Discussion
The synthetic process of APCs was schematically illustrated in Figs. 1a and 1b. Firstly, dissolved chitosan and phytic acid were combined together to form a chitosan-phytic acid hydrogel through electrostatic interaction and hydrogen bonding. Then, carbonize and activate of the chitosan-phytic acid gel precursors to obtain the APCs. In which, the amino group (–NH2) in chitosan took place protonated reaction to form –NH3+ under the action of hydrogen ion (H+) in phytic acid, and solvation occurred to break the original hydrogen bond of chitosan. The ratio of chitosan to phytic acid can affect the structure of gel and ultimately affect the morphology and properties of the obtained carbon materials. Next, the gel precursor was pyrolyzed at 400 °C for 2 h, and carbonized at 850 °C for 2 h in N2 atmosphere. In this process, chitosan was the main source of C, N and O, and phytic acid was not only the main source of P, but also catalyzed the conversion of carbon to low molecular level due to its rich phosphate group. Lastly, KOH activation further enriched the pore structure, and obtained N/O/P tri-doped hierarchal porous carbon APCs. 12,43 The activated process involved K reduction and C oxidation. 26
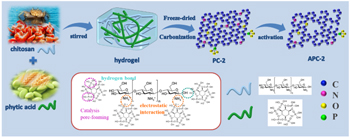
Figure 1. Schematic illustration of synthesis of porous carbon materials APC-2.
Download figure:
Standard image High-resolution imageFirstly, KOH was reduced to K2CO3 and metallic K at 400 °C–600 °C. Next, above 700 °C, K2CO3 was pyrolyzed into K2O and gassy CO2. Lastly, K2O further reacted to form metallic K. In the course of the reaction, carbon materials realized high microporosity. 16,26,44
The morphology and microstructure of the samples were characterized via SEM, as shown in Figs. 2a–2f. In Fig. 2a, the PC-1 added 0.005 mol phytic acid showed a block structure. Interestingly, the SEM image of PC-2, PC-3 (Figs. 2b–2c) also showed the block structure, but the block of carbon materials became smaller, and the thickness became thinner. This phenomenon was attributed to the difference in amount of phytic acid, thus affecting the degree of loose of the carbon aerogel. Figure 2d–2f showed the morphology of PCs by KOH activation. With the addition of a small amount of KOH, the edge of bulk carbon materials began to become loose (APC-1) (Fig. 2d). As the amount of KOH increases, the morphology of carbon materials gradually changed from block structure to honeycomb structure (Figs. 2e–2f). This was because in the pyrolysis process, KOH can react with the surrounding C, and then leave porous structure in carbon materials after washing with HCl. In addition, Figs. 2g–2j demonstrated the N/O/P elements were homogeneously doped in the carbon skeleton.

Figure 2. SEM images of (a) PC-1, (b) PC-2, (c) PC-3, (d) APC-1, (e) APC-2, (f) APC-3. (g)–(i) EDS elemental mappings of the APC-2.
Download figure:
Standard image High-resolution imageXRD and Raman spectroscopy were used to further analyze the crystallographic structure of the carbon materials, as shown in Figs. 3a and 3b. The XRD measurement revealed that two characteristic peaks located at 23.4° and 43°, which are consistent with the (002) and (100) planes respectively, indicating the amorphous nature of all as-prepared samples (Fig. 3a). 43 According to Bragg equation (2dsin θ = λ), the (002) peak of APC-2 and APC-3 shifted to a lower angle than that of PCs, demonstrating that the layer spacing was expanded due to more defects, which was consistent with the more loose morphology shown by SEM images. Raman spectroscopy was shown in Fig. 3b to evaluate the degree of graphitization of carbon materials. It can be seen that all samples reveal two obvious peaks at about 1340 cm−1 and 1590 cm−1, 45,46 which could be assigned to the D-band (sp3-type disordered carbon) and the G-band (sp2-type graphitized carbon), respectively. 14,24,47,48 The ID/IG ratios of PC-1, PC-2, PC-3, APC-1, APC-2, APC-3 were 0.987, 1.001, 1.027, 1.049, 1.055, 1.098, respectively. Distinctly, APCs exhibited a relatively high ID/IG ratio in comparison to PCs, indicating with the increase of the phytic acid and activation dose, the disorder of the as-prepared carbon materials was gradually enhanced, which might be caused by the deeper etching degree of the carbon skeleton by the phosphate radical group and KOH.

Figure 3. (a), (b) XRD patterns and Raman spectra of carbon materials.
Download figure:
Standard image High-resolution imageThe pore structure and specific surface area of carbon materials have conferred electrode outstanding functional properties in energy storage. Nitrogen adsorption and desorption curves were applied to analyze the pore size distribution of carbon materials, as shown in Fig. 4a. The resulting isotherms indicated that APCs displayed a combined isotherm of type I and IV, revealing the presence of micropores and mesopores. 11 It can be seen that adsorption-desorption isotherm showed a dramatic increase at low pressure of 0.1 < P/P0 < 0.45 with an abrupt inflection point for P/P0 ≈ 0.1, which indicated the abundance of micropores in samples. Furthermore, desorption branch of carbon materials with P/P0 > 0.45 demonstrated the presence of a slight hysteresis loop (type-IV isotherm), displaying that a mass of mesopores existed in samples. 7,14,49 In addition, the pore size distributions of carbon materials were calculated and shown in Fig. 4b. It can be observed that the pore diameters of the samples were basically distributed between 0.5–10 nm, with both micropores (<2 nm) for abundant active sites and mesopores (2–50 nm) for rapid ion transport. 42 The calculated total specific surface areas, total/micropores pore volumes were summarized in Table I. Based on the Brunauer–Emmett–Teller (BET) formula, the APC-2 exhibited a specific surface area of 1650 m2 g−1 and a pore volume of 1.37 cm3 g−1, which was much higher than PC-2 (1140 m2 g−1 and 0.788 cm3 g−1). This phenomenon can put down to KOH activation resulted in the increase of micropores, which increased the surface area of carbon materials and was conducive to the increase of active sites. Moreover, the SBET and pore volume of APC-1 and APC-3 can be respectively up to 1900 m2 g−1, 2020 m2 g−1, 1.51 cm3 g−1 and 1.24 cm3 g−1. It can be found that although the APC-2 owned lower surface area and pore volume in APC-x samples, it exhibited the best capacitive performance. The reason may be that the chemically accessible specific surface area was affected by the unique pore size distribution of porous materials. Large specific surface area can provide more active sites for ion adsorption, but if ions were adsorbed through pores, additional pores (such as mesopores and macropores) were needed. The optimal pore size distribution can help increase the effective surface area and achieve the best capacitance performance. Therefore, the excellent porosity structure of APC-2 was more favorable for ion adsorption and ion diffusion, thus being beneficial to improve the energy storage capacity.
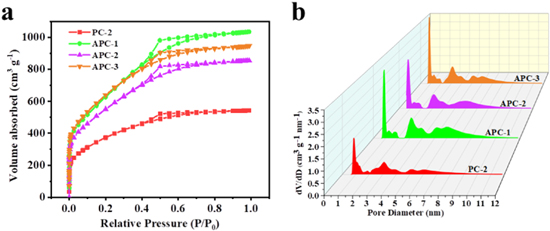
Figure 4. (a), (b) N2 adsorption/desorption isotherms and the pore size distribution of PC-2, APC-1, APC-2, APC-3.
Download figure:
Standard image High-resolution imageTable I. Specific surface areas, total pore volumes and chemical composition of PC-2, APC-1, APC-2, APC-3.
| Samples | SBET | Smic | Vtot | Vmic | Chemical Composition (at%) | |||
|---|---|---|---|---|---|---|---|---|
| (m2 g−1) | (m2 g−1) | (cm3 g−1) | (cm3 g−1) | C (at%) | O (at%) | N (at%) | P (at%) | |
| PC-2 | 1140 | 553 | 0.788 | 0.247 | 84.77 | 10.28 | 2.30 | 2.65 |
| APC-1 | 1900 | 791 | 1.510 | 0.379 | 93.11 | 3.88 | 1.56 | 1.45 |
| APC-2 | 1650 | 808 | 1.370 | 0.457 | 92.78 | 4.77 | 1.31 | 1.15 |
| APC-3 | 2020 | 1070 | 1.240 | 0.391 | 94.11 | 4.06 | 0.95 | 0.88 |
XPS was applied to characterize chemical states of specified elements in carbon materials. In Fig. 5a, the full spectrum exhibited four peaks, which were consistent with C 1 s (at 284.6 eV), N 1 s (at 400 eV), O 1 s (at 530 eV), and P 2p (at 134 eV), indicating the N, O and P atoms were successfully embedded into carbon skeleton. High-resolution spectra of samples further research the chemical nature of N, O and P elements, as shown in Fig. 5b–5d and Fig. S1a–I (available online at stacks.iop.org/JES/168/100534/mmedia). The O 1 s XPS spectra can be fitted into three different signals with binding energy of 531.5 eV, 532.4 eV and 533.7 eV, assigning to C–O, C=O, and O=C–O bonds, respectively. 6,50 Additionally, in the high resolution N 1 s spectra, four peaks at 398.7 eV, 399.6 eV, 401 eV and 404.2 eV were assigned to pyrrolic-N, pyridinic-N, quaternary-N and pyridine-N-oxide, respectively. 1,19 It has been reported that pyrrolic-N can contribute extra free or delocalized electrons to the carbon materials to improve the pseudocapacitance of electrodes. Pyridinic-N had excellent electron donor characteristics, which improved the catalytic activity in the electron transfer process and effectively improved the electrochemical performance. 51 Moreover, quaternary-N and pyridine-N-oxide can provide higher electron conductivity and faster electron transfer rate, which was conducive to enhance the storage capacity of devices. 29,32 The P 2p spectra displayed three chemical environments of phosphorus, corresponding to the P-C (132.6 eV), P-O (133.5 eV) and P-N (134.5 eV) bonds in Fig. 5d, revealing the successful doping of phosphorus in samples. 52 Additionally, it can be seen that all the samples above contained N, O and P elements, but their contents varied due to the different preparation processes in Table I. Compared with PCs, the APCs samples revealed less N, O, and P contents, which might be ascribed to KOH activation leading to the increase of more unstable and easy loss elements. In conclusion, APC-2 had the most considerable specific surface area, pore volume and element contents, therefore these advantages made it a promising electrode material for electrochemical energy storage.
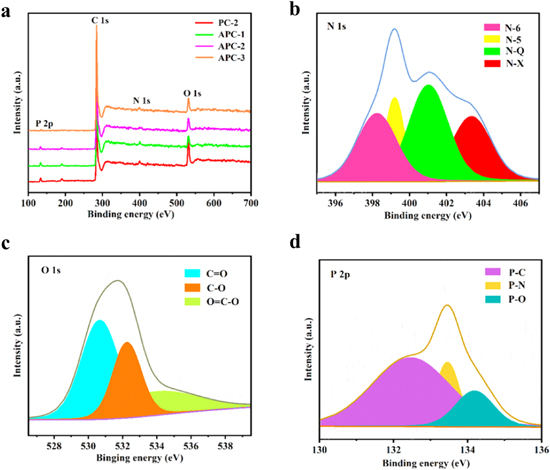
Figure 5. (a) The full XPS spectra of PC-2, APC-1, APC-2, APC-3. The high-resolution XPS spectra of APC-2 (b) N 1 s, (c) O 1 s, (d) P 2p.
Download figure:
Standard image High-resolution imageThe electrochemical performances of as-prepared PCs and APCs electrodes were studied in a three-electrode system with an potential range of −1 to 0 V using 6 M KOH solution as the electrolyte. 53–55 In Figs. 6a and S2a, the cyclic voltammetry (CV) curves of all samples showed a rectangular shape at a scan rate 100 mV s−1, suggesting outstanding capacitive performance for electrodes. 56,57 However, the PC-2 notably displayed a smallest CV integral area, indicating the relatively poor energy storage ability. Inversely, the CV curve of APC-2 possessed the larger integral area, revealing the existence of ideal electric capacity performance due to the outstanding specific surface area and porous structure. More importantly, by adding the biomass derivative phytic acid, there was a weak redox reaction in CV curve of APCs, which was caused by extra pseudocapacitance from P-doping. Additionally, the galvanostatic charge/discharge (GCD) curves of carbon materials displayed a linear and symmetrical isosceles triangle shape in Figs. 6b and S2b. The results also proved the samples took on the distinguished electrochemical performance of supercapacitor, consisted with the CV test. 58,59 The APC-2 presented the longer charging/discharging times, showing the great electrochemical reversibility and electrochemical performance. According to GCD curves further calculation, the specific capacitance of APC-2 was significantly higher than other carbon materials at similar current densities. For example, the APC-2 showed a high capacitance of up to 320 F g−1 at a current density of 1.0 A g−1, which was higher than APC-1 (212.8 F g−1), APC-3 (317.2 F g−1), individually. Using the CV and GCD further researched the capacitance property of APC-2 at various scan speeds between 2 mV s−1 and 100 mV s−1 and current densities from 1 A g−1 to 50 A g−1, respectively. In Fig. 6c, the CV profiles of APC-2 almost remained the same rectangle shapes with the scan rate increased from 2 to 100 mV s−1, showing fast kinetics for electric double-layer formation and pseudocapacitive behavior. The GCD profiles of carbon materials at different current densities from 1 A g−1 to 50 A g−1 were shown in Fig. 6d. These profiles kept the hardly similar isosceles triangle shape, which proved that the samples had a good rate capability and can adapt to charge/discharge process even at the large current density. Additionally, these results indicated that more P-doping may enhance the wettability of the carbon surface and accelerated ion transport. However, we can see that when the current densities were gradually increased to 50 A g−1, the isosceles triangle slowly distorted, which might be ascribed to the reduction of effective ion concentration at electrode/electrolyte interface with uninterruptedly increase of current density. Compared APC-2 with other carbon electrode materials, it was found that APC-2 had a great advantage in the performance of specific capacitance (Fig. S3).
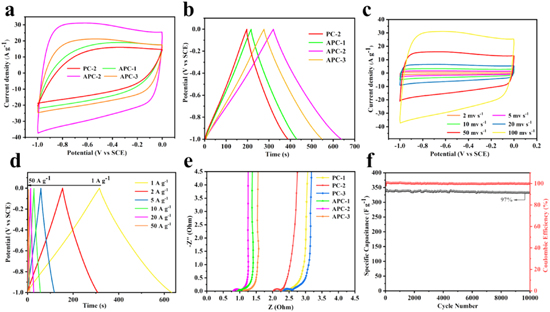
Figure 6. Electrochemical measurement in 6 M KOH: (a), (b) the CV curves at the scan rate of 100 mV s−1 and GCD curves at the current density of 1 A g−1 of PC-2, APC-1, APC-2, APC-3. (c), (d) CV curves at different scan rates and GVD curves at different current densities of APC-2. (e) Nyquist plots of PC-2, APC-1, APC-2, APC-3. (f) Cycling performance at after 10000 circles at 1 A g−1.
Download figure:
Standard image High-resolution imageFurthermore, the capacitive performance of the carbon materials can be analyzed by electrochemical impedance spectroscopy (EIS) measurements in the frequency range of 0.01 Hz-100 kHz at open circuit potential. In Fig. 6e, the Nyquist plot of all samples revealed the enhanced kinetics for ion diffusion and charge transfer. 60,61 The value of equivalent series resistance (Rs) can be expressed by x-intercept in the high-frequency part, related to the resistance of the electrode material and the electrolyte. The value of charge transfer resistance (Rct) can be represented by diameter of semicircle, which was matched with the electrical double layer and faradaic redox reaction. Moreover, the nearly vertical line in low frequency region of the Nyquist plot exhibited low ion diffusion resistance. 26,33,35,43 To be noted, the equivalent series resistance of PC-1, PC-2, PC-3, APC-1, APC-2 and APC-3 were 2.23, 2.01, 2.31, 0.7, 0.5 and 1.01 Ω, respectively. The APC-2 with the almost vertical line in low frequency and smallest semicircle diameter in high frequency exhibited the lowest interface resistance than other electrodes attributed to the N/O/P doping and hierarchically porous structure. In addition, the specific capacitance retention rate of sample APC-2 was 97% after 10000 cycles, with an average attenuation of 0.03% per 100 cycles (Fig. 6f). At the same time, the coulomb efficiency of APC-2 sample maintained 99%-100% after 10000 charge-discharge cycles, demonstrating the excellent structural stability during the charge/discharge process.
Considering the practical application of supercapacitors, the APC-2 was assembled as electrode active material into a symmetric supercapacitor APC-2//APC-2 (KOH) in a two-electrode system using the 6 M KOH electrolyte. 62,63 The Fig. 7a showed CV curves of the APC-2//APC-2(KOH)at 100 mV s−1 scan rate under different voltage windows. The device exhibited typical rectangular shape, indicating an ideal capacitive behavior, 64–67 and breaking the traditional 0–1.0 V operating voltage window limit, which can be attributed to the effective P-doping in the electrode active material. We studied the CV curves at different scanning rates (Fig. 7b) and the GCD curves at different current densities (Fig. 7c) to further investigate the electrochemical performances of APC-2//APC-2 (KOH). The results showed that the CV curves can maintain a similar rectangular shape at different scanning rates (from 2 to 100 mV s−1), and there was no obvious distortion even at higher scanning rates, proving the good electric double-layer capacitance behavior. 68 It can be ascribed the porous structure provided the ions diffusion channel to rapidly transfer to the electrolyte surface. In Fig. 7c, the all curves of GCD at different current densities exhibited the symmetrical triangle shapes, indicating the good rate capability and the highly reversible charge-discharge process. 53,69–73 The symmetric device delivered a specific capacitance of 211.23 F g−1 at the current density of 0.5 A g−1. In addition, the Ragone plot revealed the energy density and power density of the device at different current densities in Fig. 7d. The energy density can achieve 11.15 W h kg−1 at the power density of 162.5 W kg−1, and which still remained 8.85 W h kg−1 at a high power density of 1625 W kg−1. In order to meet the practical requirements of high output voltage and current of the APC-2//APC-2 (KOH) device in practical applications, two APC-2//APC-2 (KOH) devices were measured in series and in parallel, respectively. As can be seen from the GCD curve, the operating voltage can extend from 0 to 2.6 V when connected in series, while still maintained the similar symmetrical triangular shape. Additionally, when the two devices were measured in parallel, the discharge time can be extended to twice the single capacitor in the same voltage range, indicating the great potential for high energy output. At the same time, two supercapacitors in series were used to supply power to other equipment. It can be observed that two APC-2//APC-2 (KOH) devices can provide power for red LED bulbs for about 2 min after series connection. To evaluate the applications of the prepared supercapacitors in flexible devices, the CV curves of an all-solid symmetric supercapacitor APC-2//APC-2 (KOH) was measured at different bending angles. As shown in Fig. 7f, the CV curves showed negligible variation after bending at various angles from 0°, 45°, 90°, 135° and 180°, demonstrating the good flexibility and feasibility in wearable devices.
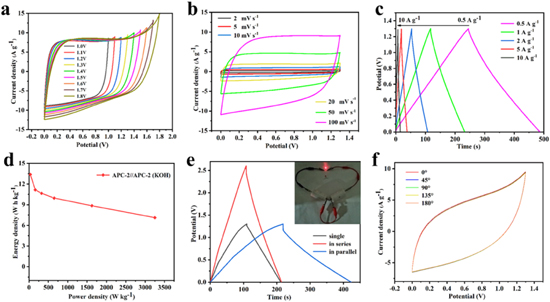
Figure 7. Electrochemical properties of APC-2//APC-2 symmetric supercapacitors in 6 M KOH: a) CV curves at different voltage windows with sweeping speed of 100 mV s−1. (b), (c) CV curves at different scan rates and GVD curves at different current densities. (d) Ragone plot. (e) The GCD curves at 1 A g−1 of the devices in series and in parallel. (f) CV curves at 100 mV s−1 after bending with angle (0°, 45°, 90°, 135° and 180°).
Download figure:
Standard image High-resolution imageThe voltage window in KOH electrolyte can be limited by the decomposition voltage of water. In contrast, the neutral electrolyte containing the same amount of H+ and OH- will not react with the electrode to generate H2 or O2. Therefore, it was expected to provide a wider voltage window than alkaline electrolyte. The strong solvation of Na+ and SO4 2− was conducive to maintain the stability of the electrolyte even under high voltage, 29 so the symmetrical supercapacitor was assembled with a voltage range of 0–1.7 V using 1 M Na2SO4 electrolyte. The CV and GCD tests at diverse scan speeds from 10 mV s−1 to 1000 mV s−1 and current densities between 1 A g−1 and 50 A g−1 were applied to manifest electrochemical performance of device, individually. In Figs. 8a and 8b, we can observe that the GCD curves and CV curves showed the symmetrical triangle and rectangle shapes, revealing the excellent rate performance and ideal reversibility. The CV curves of the APC-2//APC-2 (Na2SO4) at 100 mV s−1 scan rate under different voltage windows was shown in Fig. 8c. The device exhibited typical rectangular shape, indicating an ideal capacitive behavior. The cyclic stability of APC-2//APC-2 (Na2SO4) under 5000 cycles at 5 A g−1 was shown in Fig. S4. It shows that even after 5000 cycles, APC-2//APC-2 (Na2SO4) retained 84% of its initial specific capacitance, indicating excellent cycling stability. The performance of power density and energy density has also been effectively improved (Figs. 8d). The device had an energy density of 17.3 W h kg−1 at a power density of 212.5 W kg−1. And when the power density was increased to 21.25 kW kg−1, the energy density can still maintain 11.81 W h kg−1.

Figure 8. Electrochemical properties of APC-2//APC-2 symmetric supercapacitors in 1 M Na2SO4: (a) GCD curves at different current densities. (b) CV curves at different scan rates. (c) CV curves at different voltage windows with sweeping speed of 100 mV s−1. (d) Ragone plot.
Download figure:
Standard image High-resolution image
Conclusions
In summary, we have successfully synthesized N/O/P tri-doping hierarchical porous carbon materials through using chitosan as biomass precursor and N/O source, phytic acid as solvent, porogen, and P/O source. The hierarchical pore structure ensured effective electron and ion transport routes and provided more adsorption sites. The N/O/P heteroatoms doping increased the electric conductivity and provided additional pseudocapacitance. As electrode materials, APC-2 displayed high specific capacitance and good cycling stability. Additionally, the as-prepared symmetrical supercapacitor exhibited a wide voltage window and excellent flexibility.
Acknowledgments
This work was supported by the National Natural Science Foundation of China (21776061, 21978069); the program for Science & Technology Innovation Team in Universities of Henan Province (19IRTSTHN029).