
Abstract
Li-ion batteries are being widely used in planetary missions, based on their impressive performance characteristics, including high specific energy, long life, and the ability to operate over a wide temperature range. Custom large-format Li-ion cells were used in the early planetary missions, e.g., Mars Rovers, Mars Landers, and Mars and Jupiter Orbiters. At the same time, several other robotic missions have utilized and are planning to utilize commercial 18650 lithium-ion cells, e.g., Mars Express, Lunar Reconnaissance Orbiter, Europa Clipper, as well as human-rated astronaut Extra-Vehicular Activities. Interest in commercial 18650 lithium-ion cells for NASA missions has increased in recent years due to distinct advantages over custom large-format cells, including higher specific energy and energy density, enhanced safety and reliability, modularity and redundancy in the battery design, and simpler charge methodology. Multiple commercial 18650 cells are available which can provide a specific energy of ∼250 Wh kg−1 (20%–50% over custom cells) and a power density of ∼2 kWkg−1. Selected cell types with different chemistries and from multiple high-quality manufacturers, including the MJ1, M36, HG2 models from LG Chem; the 35E, 36 G and 30Q models from Samsung; the BJ and GA models from Sanyo/Panasonic; and the VC7 from Sony/Murata, were evaluated for their applicability in space applications. The performance tests included cycle life at different temperatures and depths of discharge, and high-power characterization at different temperatures; to supplement typical electrical measurements of voltage, capacity, and energy, Electrochemical Impedance Spectroscopy (EIS) was used to characterize the health of some cells on an ongoing basis. In addition, destructive physical analysis was carried out on these cells to analyze their electrode materials and correlate them with their performance characteristics. The demonstrated performance of several cells indicated their viability for further extensive space-qualification prior to their implementation in space missions.
Export citation and abstract BibTeX RIS

This is an open access article distributed under the terms of the Creative Commons Attribution Non-Commercial No Derivatives 4.0 License (CC BY-NC-ND, http://creativecommons.org/licenses/by-nc-nd/4.0/), which permits non-commercial reuse, distribution, and reproduction in any medium, provided the original work is not changed in any way and is properly cited. For permission for commercial reuse, please email: permissions@ioppublishing.org.
A decade since their inception in 1991 by Sony, 1,2 lithium-ion batteries were first used in space missions at the beginning of this century, replacing the aqueous batteries that were used in previous missions, e.g., nickel/cadmium, nickel/hydrogen and silver/zinc. Starting with the successful Mars Exploration Rover mission (MER) in 2003, which extended over 15 years on Mars, 3,4 several robotic planetary missions employed Li-ion batteries, e.g., Mars Phoenix Lander (2007), Mars Science Laboratory Rover (MSL, 2011), Mars Atmosphere and Volatile Evolution Orbiter (MAVEN, 2013), Mars InSight Lander (2018), and the recent Mars Perseverance Rover (2020). These batteries were fabricated by EaglePicher Technologies with flat-plate prismatic cells in different sizes and capacities (5–55 Ah), which contained mesocarbon microbead (MCMB) anodes, LiNi0.8Co0.2O2 cathodes, and a low-temperature electrolyte with an equi-proportional ternary mixture of ethylene carbonate (EC), dimethyl carbonate (DMC) and diethyl carbonate (DEC), developed at JPL. 5 For the Mars Insight Lander and Mars Perseverance Rover, however, due to the obsolescence of materials used in previous missions, slightly different materials were used, i.e., a graphite anode, and a LiNi0.8Co0.15Al0.05O2 cathode; the Insight lander battery also has an ester-containing electrolyte to enable operations down to −35 °C. 6,7 Even larger prismatic cells (195 Ah) from GS Yuasa are being used in the International Space Station (ISS) and in many Geosynchronous Earth Orbit (GEO) and Low-Earth Orbit (LEO) satellites, while Saft's cylindrical cells find their place European satellites. In parallel, the European Space Agency launched a Mars orbital mission in 2003, Mars Express, with a lithium-ion battery built from commercial 1.2 Ah 18650 cylindrical cells made by Sony with a hard carbon anode and a LiCoO2 cathode. Subsequently, NASA has utilized these Sony HC 18650 cells in many robotic missions, including the Kepler Space Telescope (2009), Lunar Reconnaissance Orbiter (LRO, 2009), and also in LEO/GEO satellites. Likewise, Li-ion batteries with E-One Moli Energy's ICR18650J cells are being used successfully in astronauts' portable life support system (PLSS) during Extra-Vehicular Activities (EVA).
While the large-format cells used in missions such as MER, MSL, Mars InSight, and Mars 2020 provide custom solutions often with desired characteristics of low temperature performance and long calendar/cycle life, the commercial-off-the-shelf (COTS) 18650 cells also offer several advantages of their own. Because of their high-volume and highly automated production of hundreds of thousands of cells per day, the cells tend to have excellent consistency and uniformity.
The cells can be combined in parallel to construct virtual cells of desired capacity, or more commonly in a series-parallel network, which provides modularity and redundancy for the batteries. The low cell-to-cell variability combined with adequate cell screening and appropriate matching obviates the need for cell voltage monitoring and cell balancing electronics, and considerably simplifies battery charging. 8 Additional safety features available in certain COTS 18650 cells, i.e., a positive thermal coefficient (PTC) which limits the current, a current-interrupt device (CID) which safeguards against overcharge, and shut-down separators which eliminate ion transport channels at higher temperatures, also provide improved safety and reliability for the batteries. Further, the small cells allow easier modifications to battery designs to mitigate the risk of thermal propagation within the pack in the event of a thermal runaway failure of any cell. More importantly, the specific energy and energy density of COTS 18650 cells have grown more rapidly in the last two decades, driven largely by the needs of portable electronics, overtaking the large format cells in these metrics by 40%–100%.
Considering these advantages of COTS 18650 Li-ion cells, NASA is actively investigating various Li-ion cell technologies, especially from recognized cell manufacturers, for use in future robotic and human missions. Two robotic missions of significance are the upcoming Europa Clipper, which is a multiple fly-by (or orbiter) mission to Jupiter's moon Europa, likely to launch in 2023, and a future surface mission concept to the same destination (Europa Lander). Europa Clipper will utilize Li-ion batteries containing 18650 MJ1 Li-ion cells from LG Chem. The subsequent Europa Lander mission concept will consist of three spacecraft: lander, cruise stage and descent stage. The lander will be powered by a high-energy Li/CFx primary battery and the cruise stage spacecraft, which will carry the lander to Europa, will be functionally similar to Europa Clipper and likely have similar batteries. The descent stage will assist in deorbiting the lander from the cruise stage and perform the Entry, Descent and Landing (EDL) operations, similar to the landing sequence of the Mars Rovers, Curiosity and Perseverance. The descent stage was originally designed with thermal batteries to support multiple high-power pulses corresponding to various pyro events during powered descent. However, our analysis revealed that the COTS 18650 Li-ion cells could not only provide similar power densities as the thermal batteries, but also deliver about double the specific energy along with the advantages of reliability and testability before spacecraft integration and launch, which is not possible with thermal batteries.
COTS 18650 Li-ion cells
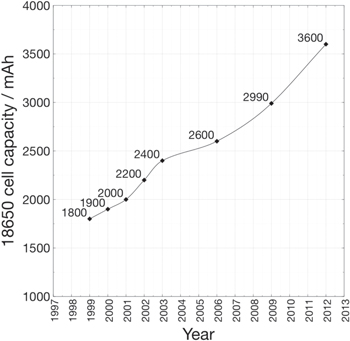
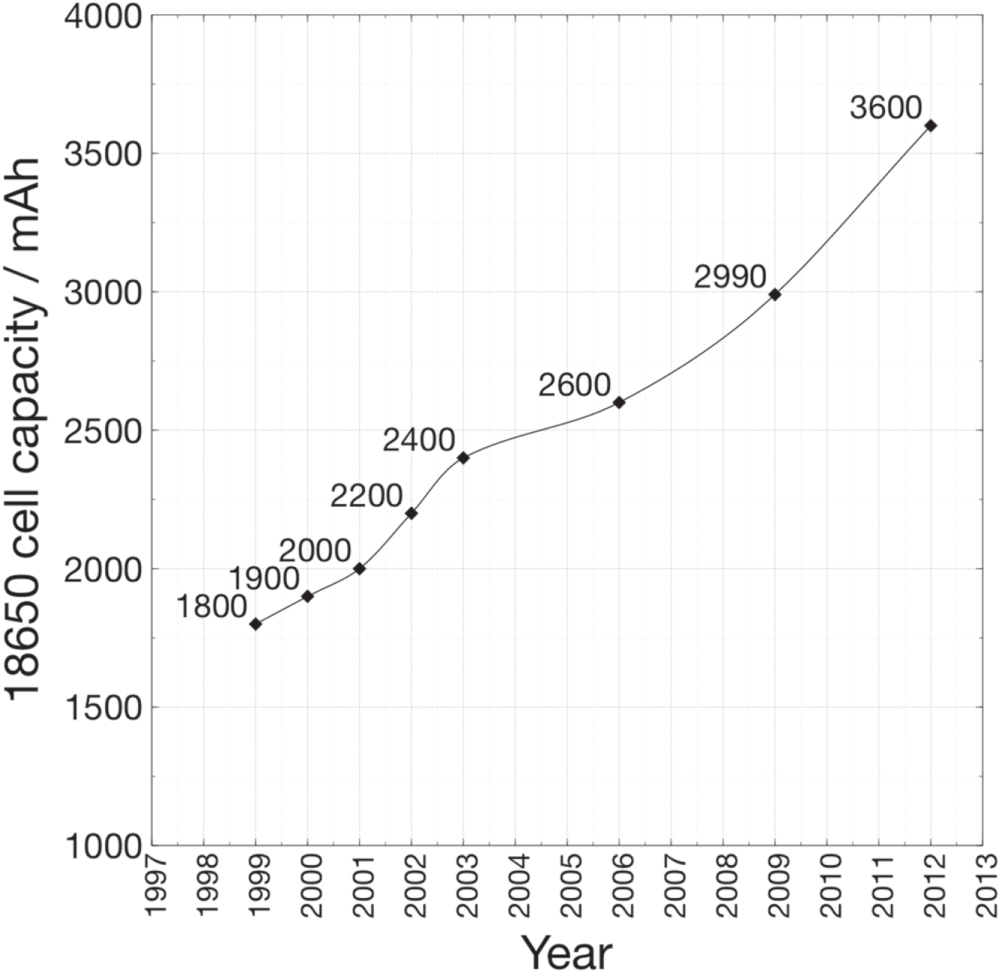
Since the inception of lithium-ion batteries, a product of the pioneering works of the three Nobel laureates, Goodenough, Whittingham and Yoshino, 9 there have been many developments both in cell chemistry and cell design. The volumetric energy density and proportionately the specific energy have roughly doubled, through a combination of improved active materials and better engineering of the 18650 cell (Fig. 1). 10,11 Blomgren has provided an excellent review on the development and future of lithium-ion batteries. 12 In addition, Quinn et al. 13 and Preger et al. 14 have recently reported the performance of commercial 18650 cells under cycling conditions.
Download figure:
Standard image High-resolution imageThe evolution of different classes of cathode materials for lithium batteries was well described by Whittingham. 15 The cathodes commonly used in the COTS Li-ion cells of interest include the original LiCoO2 (LCO), 16 LiMn2O4 (LMO), 17 LiNi0.80 Co0.15Al0.05O2 (NCA), 18 and layered LiNixMnyCo1-x-yO2 (NMC) with various transition metal atomic ratios such as Ni:Mn:Co = 1:1:1, 19 5:3:2, 6:2:2 and 8:1:1, 20 the last of which is supposedly being used in Tesla's Panasonic cells. Even higher-Ni (90%) NMC cathodes are being developed 21 but are not yet implemented in commercial cells. Increasing Ni content in the NMC cathodes improves the capacity. Their specific capacities range from 155–200 mAh g−1. 20 The anodes constitute various forms of carbon compounds, i.e., hard carbon, meso-carbon microbead (MCMB), or graphite, often mixed with small amounts of silicon, especially in high-capacity cells. Some of these materials, e.g., 811 NMC cathodes and Si-blended graphite anodes may have adverse effects on the cyclic stability, due to lack of adequate interfacial stability, but are being implemented in some high-energy cells. Cell design modifications that are implemented for improving the gravimetric and volumetric energy densities include denser electrodes, thinner separators, thinner current collectors, and also thinner cans in some cases. Catering to different applications for LIBs, various cells have been optimized either for energy (portable electronic devices, mobile phones and battery electric vehicles) or for power (power tools, hybrid electric vehicles). When it comes to cell design and active material selection, there is a necessary trade-off between power and energy, and different approaches are adopted by the manufacturers. It is interesting to note that some of the recent COTS 18650 cells show impressive specific energies together with high power densities, as will be shown here. It would be interesting to investigate the power–energy ratios of the COTS 18650 cells, in conjunction with their cycle life. Recently, we have reported the performance of Panasonic NCR18650B cells for Mars CubeSats (MarCO). 22
For the benefit of future NASA missions, we have evaluated in this study a number of recent commercial 18650 lithium ion cells in a variety of performance tests, including cycle life, rate capability, and impedance over a range of temperatures and current rates. The cells were dissected and subjected to chemical analysis to identify the cell chemistries, i.e., composition and morphology, and determine the physical characteristics of the cell components. For these technologies to be applicable to selected outer planets, e.g., Jupiter-system missions, the batteries need to be resilient to high intensity radiation environments, which was examined using 60Co source and will be reported in a companion paper.
The cells tested here may be classified qualitatively as high-energy or high-power designs. High energy cells include LG M36 and MJ1, Murata VC7 (formerly Sony), Samsung 35E and 36 G, and Sanyo GA (also branded as Panasonic); the high power cells include LG HG2 and Samsung 30Q. Due to differences in availability of these various products, and constraints in the capacity of test equipment, not all the cells were included in every test condition.
Experimental
All cells were tested over a voltage range of 3.00–4.10 V; the charge voltage is limited to 4.1 to enhance battery lifetime. Manufacturers typically rate cells based on the maximum voltage of 4.20 V and minimum voltage of 2.5 V. However, the nameplate capacities for the limited voltage range of interest were assigned as 2.90 Ah for high energy cells and 2.60 Ah for high power cells, based on preliminary tests, and these capacities were used to define C-rates. Electrical characterization was carried out on Maccor 4000 series battery cyclers with cells in an Espec Criterion test chamber with convective temperature control. All charges were run in constant current/constant voltage mode with the current tapering to C/50. During cycling, charge and discharge steps were separated by 15-min rest steps. DC resistance was calculated by current interrupt using 5 s, 1 A discharge pulses: dV/dI was calculated between the bottom of the discharge pulse and 1 h after the end of the pulse. Pulses were performed between 100% and 20% state-of-charge in 20% increments, with 20% of the cell's nameplate capacity discharged at C/5 in between pulses. Two-hour rests separated each pulse and discharge step. AC resistance was measured at 1 kHz using a Hioki BT3554 four-point probe. Electrochemical impedance spectroscopy (EIS) was carried out using a Princeton Applied Research VersaSTAT MC with VersaStudio 3 software at an AC amplitude of 5 mV with cells in a Tenney Jr test chamber with convective temperature control. Whenever possible, cell temperatures were monitored during testing using a thermocouple affixed to the side wall.
Results and Discussion
Chemistry, morphology and physical characteristics of cell components
Cells were dissected and electrodes and other cells components were extracted for analyses to evaluate the variations in the chemistry and physical characteristics of cell components. Prior to destructive physical analysis, cells were subjected to deep discharge for safety reasons. The cells were discharged successively to 3.00 V, 2.00 V, and 1.00 V, and subsequently shorted with < 5 Ω resistors. Cell cans were cut in such a manner as to preserve the header for analysis whenever possible. Electrodes and separators were isolated and lengths, widths, and thicknesses were recorded. Electrode samples were also characterized by scanning electron microscopy (SEM), using a Zeiss 1550 VP SEM equipped with an Oxford X-Max SDD attachment for energy dispersive X-ray spectroscopy (EDS) and X-ray diffraction (XRD) using a Rigaku MiniFlex II with a Cu anode (λ = 1.541 Å). Electrolyte samples were collected by rinsing separator samples with d6-dimethyl sulfoxide and characterized by 1H,19 F and 31 P nuclear magnetic resonance spectroscopy (NMR) using a Varian 400 MHz spectrometer.
Physical dimensions of cell components
The physical characteristics of the cell components, including anodes, cathodes, separator and can thicknesses are listed in Table I. The height of the electrodes or jelly roll is around 59 ± 1 mm. The lengths of the electrodes, both anodes and cathodes, are generally in the range of 600 ± 20 mm for the high energy cells. For the two high-power cells, Samsung 30Q and LG Chem HG2, the electrodes are longer by about 50%. The electrodes are also thinner for these two high-power cells, measuring about 100 μm for both anodes and cathodes. In contrast, the high-energy electrodes are considerably thicker at 170–200 μm and 150–160 μm for anodes and cathodes, respectively. Electrode thicknesses were not measured for Samsung 35E, 36 G and Sony VC7 cells. The thickness of the separators ranges from 13–20 μm and the cans are about 150–200 μm (6–8 mil) thick.
Table I. Physical characteristics of cell components in various 18650 Li-ion cells.
| Cell | Anode L (mm) | Anode W (mm) | Anode thick. (mm) | Cathode L (mm) | Cathode W (mm) | Cathode thick. (mm) | Separator thick. (mm) | Can thick. (mm) |
|---|---|---|---|---|---|---|---|---|
| Sanyo GA | 622 | 58 | 0.18 | 611 | 58 | 0.15 | 0.018 | 0.15 |
| Samsung 30Q | 943 | 58 | 0.11 | 900 | 58 | 0.10 | 0.018 | 0.15 |
| Samsung 35E | 603 | 60 | 616 | 58 | 0.015 | |||
| Samsung 36 G | 622 | 60 | 568 | 59 | 0.013 | 0.20 | ||
| LG HG2 | 961 | 59 | 0.10 | 917 | 58 | 0.10 | 0.013 | 0.18 |
| LG M36 | 653 | 60 | 0.18 | 606 | 60 | 0.16 | 0.020 | |
| LG MJ1 | 660 | 60 | 0.17 | 610 | 59 | 0.16 | 0.015 | 0.19 |
| Panasonic BJ | 603 | 60 | 0.20 | 584 | 55 | 0.15 | 0.018 | |
| Sony VC7 | 603 | 60 | 616 | 59 | 0.018 | 0.19 |
XRD of anodes and cathodes
Figure 2 shows the XRD pattern of the anodes from the first batch of the cells. As labelled in the figure, all the anodes show strong peaks suggesting some graphitic form of carbon. It is interesting to note that the peaks corresponding to Si are absent, which implies that Si is absent, or present in a small quantity undetectable by XRD, or in the amorphous form.
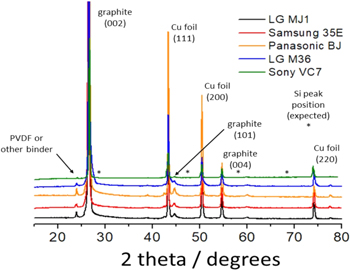
Figure 2. XRD data for anodes extracted from the COTS 18650 cells.
Download figure:
Standard image High-resolution imageFigure 3 shows the XRD pattern of cathodes from these cells. As labelled in the figure, the diffraction patterns contains peaks typical for a LiMO2 layered structure plus Al foils. Specifically, the cathode compositions include lithium nickel manganese cobalt oxide with different ratios of Ni, Mn and Co (NMC) or, lithium nickel cobalt aluminum oxide (NCA); in some cases the addition of manganese spinel oxide, LiMn2O4 (LMO) was also detected.
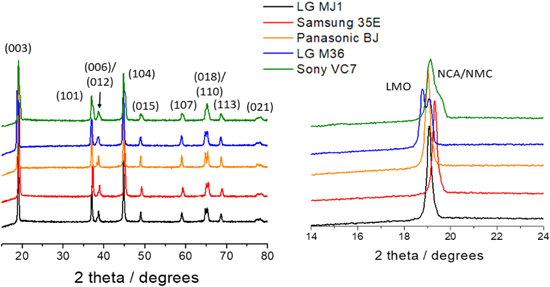
Figure 3. XRD data for cathodes extracted from the COTS 18650 cells, indexed as layered oxide phase (NCA/NMC). The figure on the right highlights details of the first major peak, revealing the compositional variations of the cathodes.
Download figure:
Standard image High-resolution imageSEM and EDS
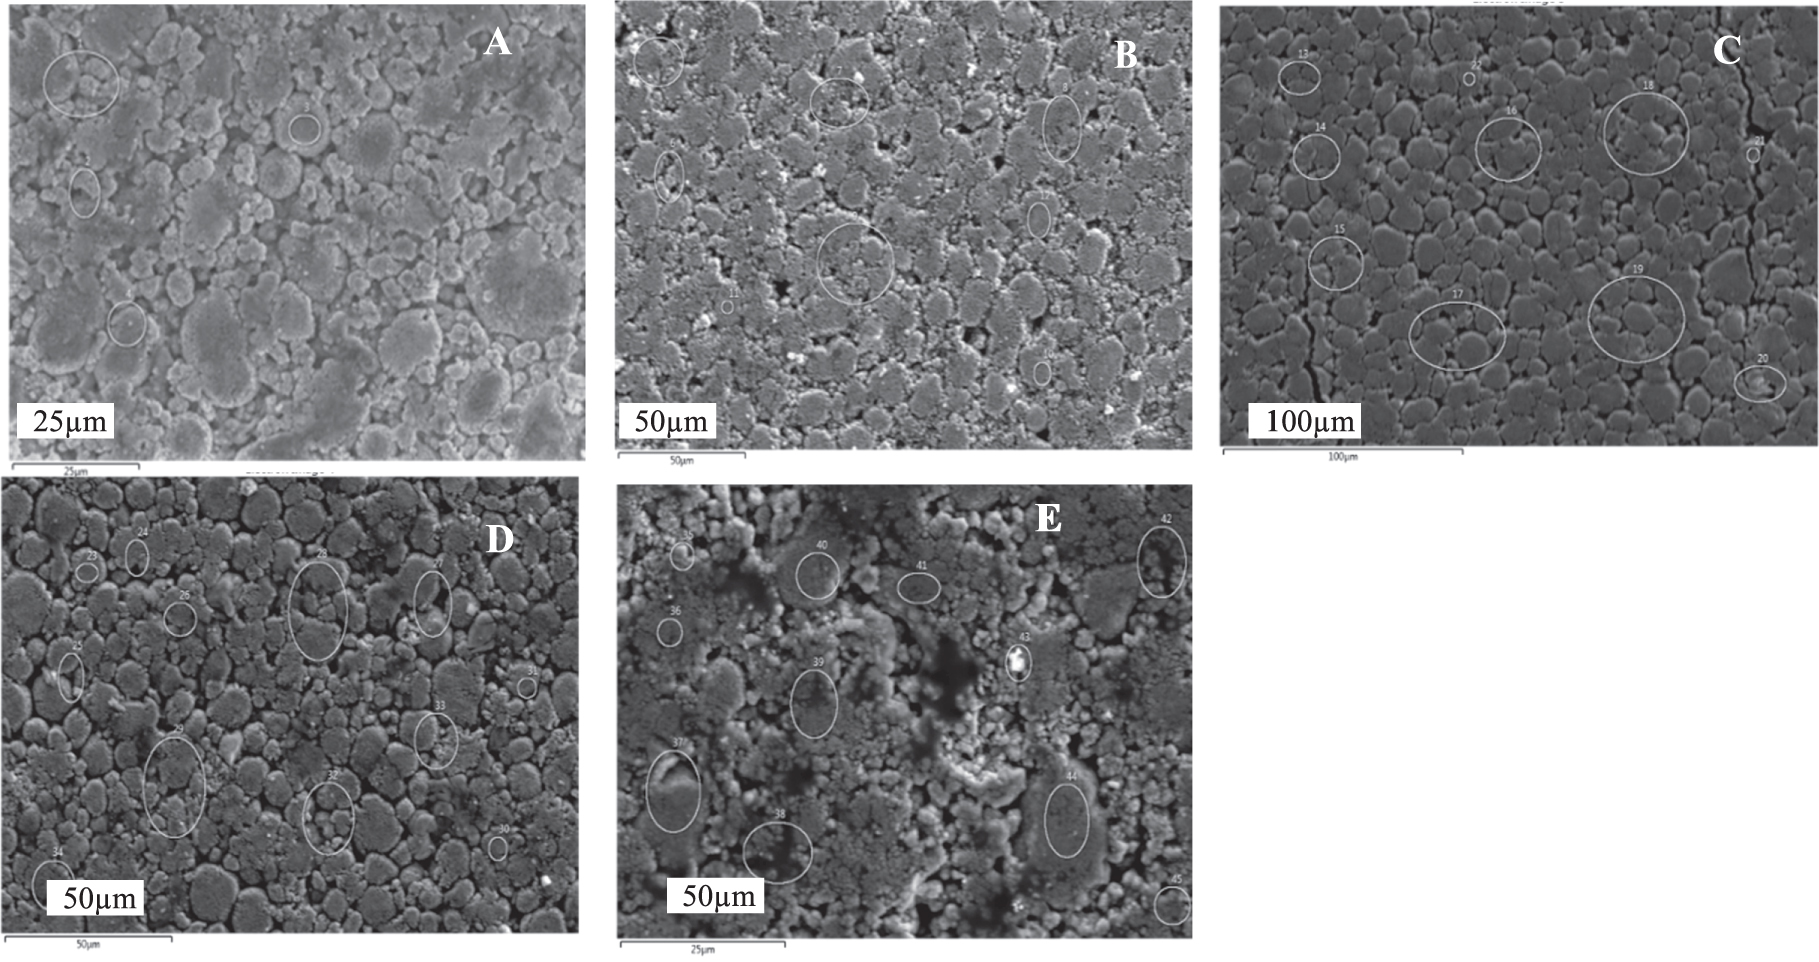
In order to understand the morphology and quantitively identify the composition, SEM examination and EDS analyses were made on the cathodes. Figure 4 shows the SEM images and EDS analysis of the cathodes from LG Chem MJ1 cells, for example.
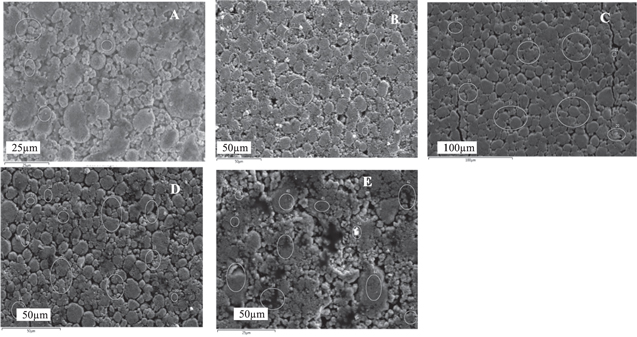
Figure 4. SEM images of cathodes from (A) LG Chem MJ1, (B) Samsung 35E, (C) Panasonic BJ, (D) LG Chem M36 and (E) Sony VC7 cells.
Download figure:
Standard image High-resolution imageThe cathodes typically contain primary particles of ∼1–5 μm, agglomerates of which form secondary particles of 25 μm. Energy-dispersive X-ray spectroscopy (EDS) measurements were made at various locations on the cathodes and anodes to quantitatively identify electrode material compositions. All the cathode EDS spectra are shown in Fig. S1 (supplementary figures) and the results are summarized in Table II.
Table II. Compositions of cathode, anode and electrolyte in commercial Li-ion cells.
| Cell | Anode composition | Cathode composition | Electrolyte |
|---|---|---|---|
| LG M36 | Graphite | NCA + LMO | EC, DMC; LiPF6, LiFSI |
| LG MJ1 | Graphite | NMC | EC, DMC; LiPF6, LiFSI |
| Panasonic BJ | Graphite | NCA | EC, DMC; LiPF6, LiFSI |
| Samsung 35E | Graphite + Si | NCA | EC, DMC; LiPF6, LiFSI |
| Sony VC7 | Graphite | NCA | EC, DMC; LiPF6, LiFSI |
| Sanyo GA | Graphite + Si | NCA | |
| Samsung 30Q | Graphite + Si | NCA |
Electrolytes
We inferred the major components of the electrolyte through 1H, 19 F and 31 P NMR analysis of d6-DMSO washings obtained from separator samples. 1H spectra indicated the organic solvent species present, while 19 F and 31 P spectra allowed us to identify the lithium salts (often in combination with their hydrolysis products). A number of minor species were also observed in a number of cases, but these were not able to be assigned unambiguously. No quantitative analysis was attempted due to likely solvent evaporation and salt hydrolysis during the DPA process and storage before sample preparation.
Summary of DPA analysis
Table II gives the summary of the compositional analysis of the cathodes, anodes, and electrolytes from these cells. All the cells have essentially graphite as the anode material, which in some cases (LG Chem M36 and Murata VC7) is less crystalline. There was also a small amount of Si detected in the Samsung 35E cells. Based on the XRD and EDS data, the cathodes are either.
NMC with 80%–90% of Ni, NCA, or a blend of NCA and LMO (in LG Chem M36). The electrolyte in all these cells is a blend of carbonates (EC and DMC), with LiPF6 salt as well as LiFSI in small quantities, apparently as an additive, or in some cases in higher concentration as part of a mixed salt system.
Initial discharge characteristics
For establishing the relative capacities, the cells were subjected to three cycles at C/5 charge and discharge rates and the capacities in the third cycles were used for comparison. DC resistance values were obtained using current pulses at 1 A for 5 s at every 20% SOC from 100%–20%. Table III lists the performance characteristics of the cells from this initial testing, i.e., capacity, specific energy and energy density from discharges at C/5 at 20 °C. The data presented is the mean of each cell measured.
Table III. Performance characteristics of 18650 cells at 20 °C.
| Cell | LG MJ1 | LG M36 | Samsung 35E | Samsung 36 G | Panasonic BJ | Murata VC7 | Panasonic GA | Samsung 30Q | LG HG2 |
|---|---|---|---|---|---|---|---|---|---|
| Capacity (Ah) | 2.96 | 2.79 | 2.90 | 2.87 | 2.89 | 2.79 | 2.83 | 2.58 | 2.53 |
| Specific Energy (Wh kg−1) | 231 | 213 | 220 | 218 | 227 | 214 | 220 | 205 | 202 |
| Energy Density (Wh l−1) | 653 | 619 | 639 | 634 | 629 | 613 | 622 | 569 | 561 |
| DC resistance, 80% SOC (mΩ) | 46 | 39 | 45 | 49 | 67 | 43 | 48 | 53 | 27 |
| 1 kHz impedance, as received (mΩ) | 28 | 25 | 21 | 23 | 37 | 26 | 24 | 13 | 15 |
For comparison, the capacity ranges from 2.79 to 2.96 Ah for the energy cells and from 2.53 to 2.58 Ah for the power cells. Corresponding specific energies are 202 to 231 Whkg−1. The specific energy ranking, in decreasing order, is MJ1 > BJ > GA = 35E > 36 G > VC7 > M36 > 30Q > HG2. One surprising result is the relatively higher capacity of the Samsung 35E compared to the 36 G, which nominally has a higher nameplate capacity. It is surmised that 36 G may overtake the 35E when charged and discharged over the full rated voltage range (i.e., 2.50–4.20 V), which is planned for a future study. The energy cells have 1 kHz impedance values of 21–28 mΩ, with the Panasonic BJ a relative outlier at 37 mΩ; the power cells have lower impedance, at 13–15 mΩ. It must be mentioned that 1 kHz impedance measurements reported here were made at room temperature as received; this is nominally at 25% SOC, but this was not controlled experimentally. Furthermore, the Panasonic BJ cells were not tested until several years after receipt, during which time they were stored in a freezer; this may be one contributing factor to their higher impedance. DC resistance measurements were made by current interrupt, with a 1 A discharge pulse 5 s in duration. In most cases, similar trends are observed between the AC and DC measurements; it is puzzling why the Samsung 30Q DC resistance measurement is relatively high.
Cycle life
Cells were cycled at C/5 charge and discharge rates (0.52 or 0.58 A based on the nameplate capacities discussed above) between 3.00 and 4.10 V, with 15 min rests between steps. Before beginning the +20 °C cycle life test and every 100 or 200 cycles thereafter, EIS was performed on each cell at +20°C after charging to 4.10 V. The 0 °C cycle life cells were also characterized for +20 °C capacity and DC resistance by current interrupt every 100 cycles, before returning to 0°C and resuming cycling.
Cycle life at 20 °C
Figure 5 shows cycle life performed at +20 °C in a temperature-controlled chamber expressed in terms of capacity, percent capacity retained, specific energy and watt-hour efficiency. The first batch of cells, i.e., LG Chem MJ1, Samsung 35E, LG Chem M36, Panasonic BJ, and Murata VC7 have completed ∼1400 cycles with good capacity retention and are continuing to cycle. One of the two 35E cells failed open after 200 cycles, possibly due to internal pressure build- up causing a current-interrupt device (CID) to open; the other 35E cell continued to cycle. Some of the cells which were added to this test later, e.g., LG Chem HG2 and Samsung 30Q, Samsung 36 G and Panasonic GA have completed about 800 cycles so far. Figure 5A shows the variation of capacity during cycling of these cells, while the capacity retention is displayed in Fig. 5B. Figure 5C provides the variation of the specific energy of the cells during cycling and the energy round-trip efficiency is shown in Fig. 5D.
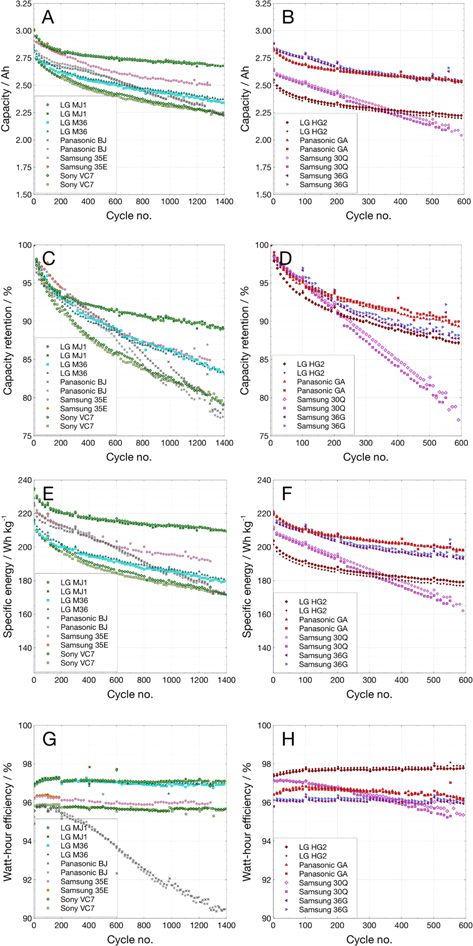
Figure 5. Cycling of COTS 18650 cells at C/5 over 3.0 to 4.1 V at 20 °C: (A), (B) Capacity; (C), (D) Capacity Retention; (E), (F) Specific energy; and (G), (H) Energy efficiency.
Download figure:
Standard image High-resolution imageThe LG Chem MJ1 cells displayed best cycle life, with the highest initial specific energy (>230 Wh kg−1) as well as the best capacity retention during cycling (90% capacity retention after 1100 cycles). Both Samsung 35E and Panasonic BJ have an initial specific energy of 220 Wh kg−1 and retained about 80% of the capacity after 1100 cycles. Both LG Chem M36 and Murata VC7 start off with ∼210 Wh kg−1 and retain about 85% and 82%, respectively after 1100 cycles. In the recent batch of cells, Samsung 36 G and Panasonic GA cells show ∼220 Wh kg−1 initially and a retention of ∼95% over 500 cycles. The high-power cells, Samsung 30Q and Lg Chem HG2 have 200–210 Wh kg−1 with comparable fade rate during cycling.
The round-trip efficiencies (Fig. 5B) average around 96%, with the exception of LG Chem MJ1 cell with higher (97%) and Panasonic BJ cell with lower efficiencies. The two high-power cells, LG Chem HG2 and Samsung 30Q show even higher energy efficiency >97.5%, as expected from their lower cell overpotentials during charge and discharge.
EIS vs cycling .–EIS was performed on the +20 °C cycle life group cells every 100 cycles to attempt to characterize the impedance growth. Cells were charged to 4.10 V (100% state of charge) before each measurement. Figure 6 shows the Nyquist or complex plane impedance plots of the first batch of cells measured at +20 °C after every 200 cycles.

Figure 6. EIS of COTS 18650 cells during 100% DOD cycling at 20 °C: (A) LG Chem MJ1, (B) LG Chem M36, (C) Samsung 35E, (D) Murata VC7, (E) Panasonic BJ, (F) LG HG2, (G) Samsung 30Q,. (H) Samsung 36 G, and (I) Panasonic GA.
Download figure:
Standard image High-resolution imageThe above Nyquist plots of all the cells show two distinguishable loops. In all these cases, there is a gradual increase in the cell impedance upon cycling, especially at low frequencies. These changes may be understood quantitatively in terms of the changes in the anode and cathode behavior during cycling, as detailed below.
The EIS behavior may be correlated to the electrochemical processes within the cells, using appropriate equivalent circuit model. A simplified representation of an electrochemical process is an equivalent circuit comprising a resistance in series with a parallel resistor-capacitor network representing the charge transfer kinetic process, and a Warburg element characteristic of an ideal semi-infinite linear diffusion in some cases, as described in detail in Ref. 23. Recently, Choi et al., have provided a good review on the modeling and applications of electrochemical impedance spectroscopy for lithium-ion batteries. 24 Each of the electrode responses in a Li-ion is typically represented by a series resistance, a high-frequency loop corresponding to the interphase layer and a low frequency loop corresponding to charge transfer kinetics and a Warburg impedance characteristic of diffusion across the interphase layer or electrode bulk. The solid electrolyte interphase (SEI) layer, which is generated by the decomposition of the electrolyte and/or its reactions with the electrodes has a more profound influence on the electrochemical characteristics of anode than cathode. The individual EIS response at the anode and cathode may be experimentally determined separately in half-cells or in three-electrode cells. We have routinely used the EIS technique with the above equivalent circuit to quantify the interfacial and kinetic effects of graphite anode and metal oxide cathodes, especially with different electrolytes, which affect the SEI characteristics. 25,26
The EIS response of the overall Li-ion cell is a series combination of the responses from individual electrodes, with surface film and kinetic effects of graphite anode metal oxide cathode, expressed over characteristic frequency ranges depending on relative anode and cathode kinetics.
In the absence of a reference electrode, it is no doubt difficult to assign the semicircles or Warburg impedance to anode or cathode. However, it was shown in our earlier studies with three-electrode cells with electrodes used in prototype cells containing MCMB anode and lithium nickel cobalt oxide cathode, that the high-frequency semicircle relates to the anode SEI and the low-frequency relaxation loop relates to the cathode kinetics. 27 We used similar assignments here for the analysis of the EIS data in Fig. 6, using the equivalent circuit in Fig. 7. For an improved fit, the capacitive elements were replaced with constant-phase elements (CPE), whenever needed. Figure 8 shows the changes of the series ohmic resistance (Fig. 8A), SEI resistance on the anode (Fig. 8B) and the charge transfer or polarization resistance (Fig. 8C) at the cathode at various stages of cycling.

Figure 7. Equivalent circuit for the EIS of a Li-ion cell: Rs is the series bulk resistance, RSEI and CPESEI are the resistance and capacitance of the anode SEI, CPEdl is the double layer capacitance, RCT is the charge transfer resistance and W is the Warburg impedance of the cathode.
Download figure:
Standard image High-resolution image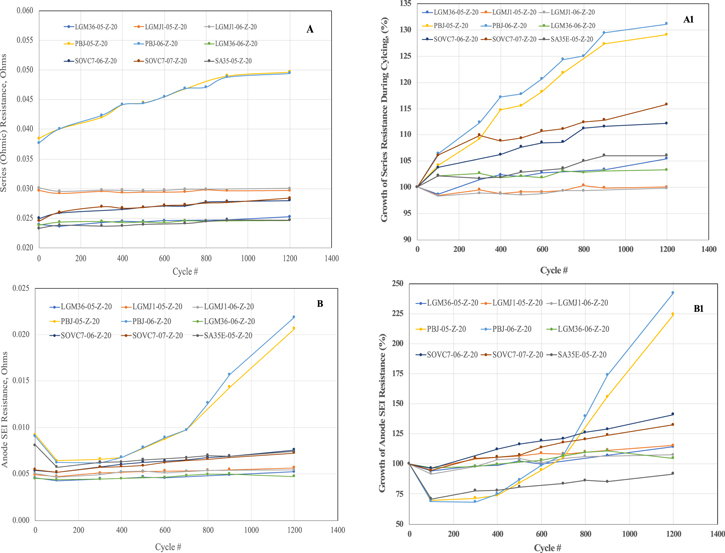
Download figure:
Standard image High-resolution image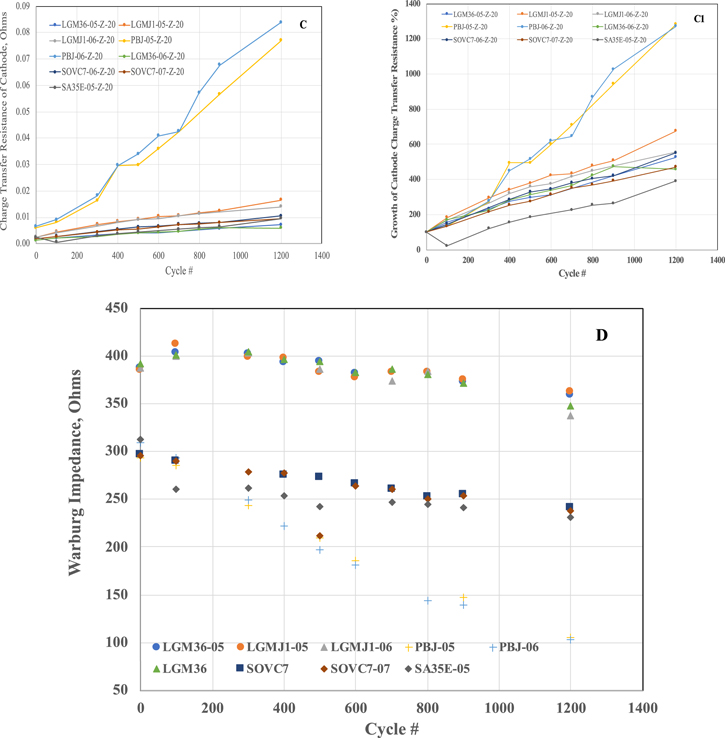
Figure 8. Analysis of the EIS data of the cells at 25 °C vs cycle life (Fig. 5): (A) Cell ohmic resistance, (B) Anode SEI resistance, (C) Cathode charge transfer resistance and (D) Cathode Warburg impedance. The corresponding A1, B1 and C1 plots show the growth of these values during cycling.
Download figure:
Standard image High-resolution imageExcept for the Panasonic BJ cells, the series ohmic resistance of the cells is ∼25–30 m Ω and shows little change during cycling (Fig. 8A). The LG Chem M36, Sony and Samsung cells have the lowest series resistance of 24 mΩ increasing to ∼25–27.5 mΩ after 1200 cycles. The MJ1 cells on the other hand, have ∼30 mΩ before cycling, which showed no change during cycling. Both the BJ cells have higher series resistance of 43 m Ω even before cycling, which increase to 55 m Ω after 1200 cycles, suggesting that the electrolyte is relatively resistive and becomes even more resistive in the course of cycling compared to the rest of the cells.
Except for the Panasonic BJ cells, the anode SEI resistance values of the cells are ∼5 mΩ for M36, MJ1, Samsung and Sony cells, before cycling (Fig. 8B). These values have increased little, by ∼1 mΩ over 1200 cycles, suggesting a robust and stable SEI in both cases. In contrast, the Samsung and Sony cells have shown slightly higher increase in the anode SEI resistance by 2–3 mΩ to 7 mΩ after 1200 cycles. As with the series resistance, the Panasonic BJ cells have slightly higher initial SEI resistance of ∼7 mΩ, which had decreased initially during cycling from 100–400 cycles but thereafter increased rapidly to 21–22 mΩ, once again suggesting an instability of the anode/electrolyte interphase, which is also reflected in rapid capacity fade during cycling.
The cathode charge transfer resistance estimated from the low frequency semi-circle shows similar trend (Fig. 8C). The M36 cells have the lowest charge transfer resistance of 1.3 mΩ initially, which increased to 5–6 mΩ after cycling. The Samsung and Sony cells have an initial value of 2.0 mΩ increasing to ∼10 mΩ. The MJ1 cells have slightly higher charge transfer resistance of 2.4 mΩ, which increased to 15 mΩ. This is surprising and not expected from the
Lowest capacity fade rate shown by the MJ1 cells during cycling. Probably the stable anode SEI of the MJ1 cells may be compensating for the increase of cathode polarization resistance. Alternately, the effects of cathode impedance (at low frequencies) may be evident only at higher discharge rates, but not at the moderate rate of C/5 used for cycling. The Panasonic BJ cells, are once again out of family, with an initial charge transfer resistance of 6 mΩ increasing sharply to ∼80 mΩ after 1200 cycles, which is consistent with their poor cycle life.
The Warburg impedance, which is related to the diffusion coefficient of Li + ion, is in the range of 300–400 mΩ for most of the cells; the LG Chem MJ1 and M36 cells have Warburg impedance closer to 400 mΩ, while the Samsung and Sony cells have the values closer to 300 mΩ. In all these case, these values are constant during cycling, suggesting little change in the cathode bulk. The Warburg impedance of the Panasonic BJ cells is also ∼300 mΩ initially, but is quickly reduced to ∼100 mΩ, which may be due to a fragmentation of the cathode particles during cycling.
Cycle life at 0 °C
Often, Li-ion batteries are expected to operate at lower temperatures in planetary missions. Even though the delivered capacities are lower at low temperatures, the cycle life is generally found to be better, unless the temperature is low enough to cause complications from lithium plating. Cells were cycled at 0 °C, with both charge and discharge at C/5 between 3.00 and 4.10 V and 15-min rests between steps. Figure 9A shows the cycle life of LG Chem MJ1, LG Chem M36, Samsung 35E, Murata VC7 and Panasonic BJ cells. Before beginning the cycle life test and every 100 cycles thereafter, a characterization test was performed at +20°C to measure capacity and DC resistance by current interrupt.
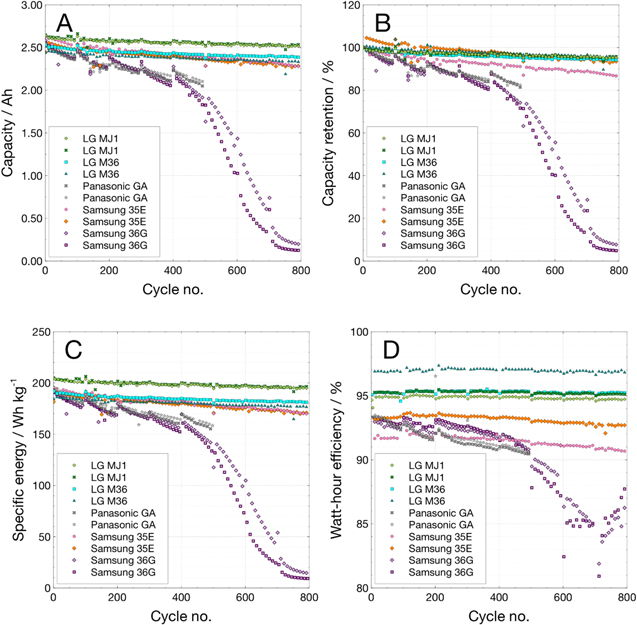
Figure 9. Cycling of COTS 18650 cells at C/5 over 3.0 to 4.1 V at 0 °C: (A) capacity, (B) capacity retention, (C) specific energy, and (D) energy efficiency.
Download figure:
Standard image High-resolution imageAll the cells have shown high specific energy of ≥190 Wh kg−1 at 0 °C, with LG Chem MJ1 cells offering the highest specific energy of ∼205 Wh/kg. Once again, the LG Chem MJ1 and LG Chem M36 cells display the highest capacity retention during cycling, with 97% of initial capacity after 250 cycles, followed by Samsung 35E with 94%. Both Samsung 36 G and Panasonic GA cells show lower retention of ∼89% and some recovery after each 100 cycles, when the +20 °C characterization was performed.
Table IV summarizes the collected data on capacity fade due to cycle life at both +20 °C and 0 °C, expressed as percent capacity lost after 500 cycles compared to the first cycle at that temperature. The MJ1 cell has a fade rate of ∼7% at 20 °C, which is reduced to ∼4% at 0 °C. Both LG M36 and Samsung 35 E cells also have their fade rate reduced from ∼10% to 4% and 6%, respectively. In general, the fade rate is lower during cycling at 0 °C, compared to cycling at 20 °C.
Table IV. Capacity loss as a result of cycle life testing.
| Capacity loss after 500 cycles, % of initial | ||||||||||
|---|---|---|---|---|---|---|---|---|---|---|
| LG MJ1 | LG M36 | Panasonic | Panasonic | Samsung | Samsung | Murata | LG HG2 | Samsung | ||
| BJ | GA | 35E | 36 G | VC7 | 30Q | |||||
| 500 cycles @ 20 °C | −7.27 | −10.07 | −10.02 | −9.55 | −10.34 | −11.46 | −12.82 | −12.11 | −19.09 | |
| 500 cycles @ 0 °C | −3.88 | −3.86 | — | −18.54 | −6.2 | −28.52 | — | — | — | |
| Average capacity fade (% per cycle) by cycle life segment | ||||||||||
| Cycle segment | LG MJ1 | LG M36 | Panasonic | Panasonic | Samsung | Samsung | Murata | LG HG2 | Samsung | |
| BJ | GA | 35E | 36G | VC7 | 30Q | |||||
| +20 ºC | 1–100 | −0.043 | −0.038 | −0.035 | −0.048 | −0.024 | −0.032 | −0.048 | −0.056 | −0.038 |
| 101–200 | −0.013 | −0.021 | −0.013 | −0.015 | −0.021 | −0.034 | −0.029 | −0.021 | −0.036 | |
| 201–500 | −0.007 | −0.012 | −0.011 | −0.009 | −0.015 | −0.013 | −0.017 | −0.011 | −0.034 | |
| 0 ºC | 501–1000 | −0.003 | −0.006 | −0.015 | — | −0.006 | — | −0.008 | — | — |
| 1–100 | −0.014 | −0.019 | — | −0.066 | −0.042 | −0.083 | — | — | — | |
| 101–200 | −0.010 | −0.023 | — | −0.071 | −0.024 | −0.085 | — | — | — | |
| 201–500 | −0.004 | −0.006 | — | −0.026 | −0.009 | −0.056 | — | — | — | |
DC resistance vs cycling at 0 °C.–Performing EIS on this group of cells was not practical due to the particular circumstances and location of the test. In lieu of this, every 100 cycles the cells' DC resistance was measured at 0 °C, and then the cells were warmed to 20 °C where capacity and DC resistance were measured. DC resistance was measured by current interrupt with a discharge pulse of 1 A at 100%–20% SOC in 20% increments. Figure 10 shows these resistance values. Some cells showed a decrease in measured resistance between the initial measurement and after the first 100 cycles. LG M36 and MJ1 showed very little change in the resistance values over the course of 800 cycles; Samsung 35E showed an initial decrease of resistance followed by growth of roughly 12%–15%, while the Panasonic GA displayed a growth of roughly 20%–40% over 500 cycles (Panasonic GA cells have completed fewer cycles than the other cells in this comparison). Samsung 36 G cells nearly tripled in resistance over the course of 800 cycles (missing data points for these cells are a result of the DC pulse triggering a low voltage limit and not completing the measurement). These resistance growth trends are consistent with the relative cycling performance of these cells shown in Fig. 9.
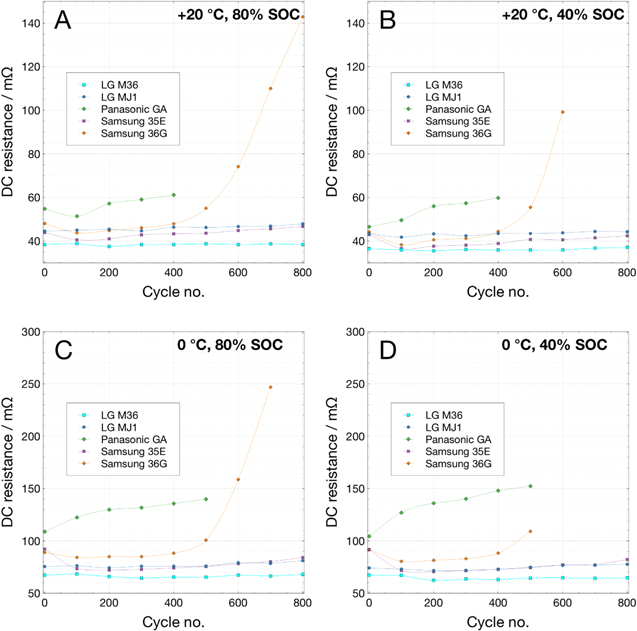
Figure 10. DC resistance vs state-of-charge measured by current interrupt at 20 °C at (A) 80% SOC and (B) 40% SOC, and at 0 °C at (C) 80% SOC and (D) 40% SOC, over the course of 100% DOD cycling at 0 °C on LG M36, LG MJ1, Panasonic GA, Samsung 35E, and Samsung 36 G.
Download figure:
Standard image High-resolution imagePartial depth of discharge cycling
For applications requiring long cycle life, batteries are designed such that the depth-of- discharge (DOD) in each cycle is low. Cycle life of aqueous batteries, especially nickel-cadmium and nickel-hydrogen batteries, improves exponentially as the depth of discharge is reduced, e.g., reducing the depth of discharge by half from 80% to 40% can improve the cycle life from 2000 to 20,000. This may be related to the mechanical or even thermal stresses that the electrodes experience at deeper discharges, contributing to faster degradation. Similar effects are observed for lithium-ion batteries also, with the cycle life increasing by several fold at low depths of discharge. 28 Additionally, it is preferred to adopt a lower charge voltage together with low DOD; for example, for a DOD of 40%, it is better to cycle from 90% state-of-charge (SOC).
to 50% SOC, compared 100%–60% SOC. During cycling of Li-ion cells with high charge voltages, there are electrolyte-induced degradation processes occurring both at the anode and cathode, and there is also the risk of lithium plating at the anode, especially at high charge currents. The higher the depth of discharge, the higher the utilizable energy, but the cycle life will be shorter, which may be due to the increased mechanical stresses during deep lithiation-delithiation, and thermal effects from increased heat dissipation rates from the cells at deep discharges. Selecting appropriate depth of discharge for the required mission life is a strategy used in electric vehicles, as well in space applications, including satellites, orbiters and long-duration rovers. An electric vehicle (EV) battery, for example, cycles between 80%–20% SOC with the 20% capacity at either end acting as a reserve. Typically sized for a range of 250 miles per cycle, the battery will need to survive over 4000 cycles at 60% depth of discharge, to provide one million miles. Some of the cells tested here display impressive cycle life even at 100% depth of discharge, retaining 80%–90% of their initial capacity, suggesting that at 60% depth of discharge, the cycle life may be expected to be ∼ 10,000 cycles, which, combined with the higher specific energy of these cells compared to current EV battery technologies, may translate to be ∼2.5 million miles.
In contrast to the electric vehicles that typically undergo one discharge-charge cycle per day, the Earth-orbiting satellite and planetary orbiters have more challenging cycling profiles. The batteries are required to provide power for a short time during eclipse (loss of solar exposure for photovoltaic power) and must be quickly recharged back to the original state-of-charge. One typical scenario of this kind is a 90-min cycle comprising 30 min of discharge followed by 60 min of charge, accumulating 16 cycles per day or 5840 cycles per year. The battery is expected to support the mission for several years, with an anticipated cycle life of tens of thousands of such cycles. With this fixed duty cycle, higher depth of discharge implies higher discharge current as well as charge current. Cycle life in these instances is defined as the number cycles until the discharge voltage drops below the minimum cell voltage (typically 3.0 V).
In order to assess suitability for satellite and orbiter applications, the cells were evaluated in a 90-minute cycle regime at two different depths of discharge: 20 and 40%. The discharge current was selected based on a cell's nameplate capacity to achieve the desired DOD in 30 min, and the charge current was two-thirds of the discharge current (with a constant voltage taper) to ensure complete recharging of the cells in 60 min. Figure 11 shows the performance (two cells of each type) during LEO cycling at 20% depth of discharge, each segment comprising 498 lEO cycles and two 100% DOD cycles, with the 500th cycle determining the cell capacity. The discharge rate corresponds to C/2.5 and the charge rate to C/3.75. Figure 11A (left) shows the variation of the End-of-Discharge Voltage (EODV, after 30 min), Fig. 11B shows the capacity the cells during LEO cycling, measured at 100% DOD every 500 cycles, and Fig. 11C shows the capacity retention (%) during cycling.

Figure 11. Cycling of COTS 18650 cells in LEO cycling mode at 20% depth of discharge at 20 °C:. (A) EODV, (B) cell capacity and (C) Capacity retention during cycling.
Download figure:
Standard image High-resolution imageThe EODV increases marginally after each 500 cycles, due to the cells being recovered during the (100%) capacity measurement at a slower discharge rate of C/5. In the mix, there is one power cell (Samsung 30Q) for comparison. So far, the cells have completed 6500 cycles, and the cells exhibit stable EODVs, except in the case of Samsung 35E cell, which showed an initial decrease but has recovered subsequently. As expected, the power cell Samsung 30Q has higher EODV, indicative of its ability to support high discharge and charge currents with less polarization. All the cells retain impressive capacities of >90% of initial values after 6000 cycles.
Figure 12 shows the performance of cells cycled under LEO conditions at 40% depth of discharge (two cells in each case), with the cell capacities determined after each 500 lEO cycles. The discharge and charge rates were selected to conform to the 90-minute cycle described earlier and correspond to C/1.25 and C/1.875, respectively. Figure 12A (left) shows the variation of the EODV, Fig. 12B shows the capacity of the cells during LEO cycling, measured at 100% DOD every 500 cycles and Fig. 12C shows the capacity retention (%) during cycling.

Figure 12. Cycling of COTS 18650 cells in LEO cycling mode at 40% depth of discharge at 20 °C: (A) EODV and (B) Cell capacity (at 100% DOD) and (C) Capacity retention during cycling.
Download figure:
Standard image High-resolution imageIn all the cases except the Panasonic GA cell, the EODV is stable through 6500 lEO cycles at 40% DOD so far. The Panasonic GA cell sustains larger capacity fade during cycling, and further studies are needed to understand its poor performance; one of the two GA cells under test at 40% DOD failed open after 4500 cycles, while the other is still ongoing. Samsung 30Q displays higher EODV, as expected from its ability to support high discharge and charge currents, followed by the LG Chem cells, MJ1 and M36, which retain an impressive 85%–89% of their initial capacities after 6500 cycles. Panasonic GA cell and to some extent Samsung 35E display rapid capacity fade with the capacity reducing to 75% and 85%, respectively. Extrapolating this behavior from Fig. 13, which illustrates the cycle life at different depths of discharge and is termed as the Wohler curve, the cycle life at 100% DOD is estimated to be 3000 cycles (to 80% capacity), cycle life at 40% extrapolated to be 25,000 (to 40% SOC) and the cycle life at 20% depths of discharge extrapolated to the 60,000 cycle (to 20% SOC). This is similar to the Wohler's curve for Li-ion batteries,
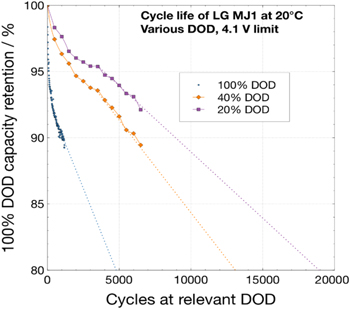
Figure 13. Cycling of LG Chem MJ1 cells at different depth of discharge: 100% DOD, 40% DOD and 20% DOD. Cycle life extrapolated at 100% DOD is 3000 cycles; 40% DoD:25000 cycles and 20% DOD 60000 cycles.
Download figure:
Standard image High-resolution imagewhich is a plot of depth of discharge (%) vs the number of cycles realized from the battery, developed through modeling. 29 Based on this data, it is clear many of these cells, e.g., LG Chem MJ1 and M36 and Samsung 35E are expected to provide more than 4000 cycles at 60% depth of discharge, with impressive useable specific energies of 120 to 140 Wh kg−1.
Capacity fade during cycling
Many papers in literature describe the performance degradation of Li-ion cells during cycling, which are briefly discussed here. In a lithium-ion cell, there are several processes that contribute to the capacity fade during cycling under normal conditions of operation, i.e., SEI formation due to electrolyte decomposition, 30 SEI re-formation caused by cracking of the layer, a decrease in accessible surface area and porosity due to SEI growth, contact loss of active material particles due to volume changes during cycling, cathode electrolyte interphase (CEI) growth, cathode surface restructuring 31 and transition-metal dissolution from the cathode that can cross over and affect the anode SEI, 32 phase changes in the insertion materials 33 and crack propagation and fracturing of electrode particles, 34,35 increasing Li consumption for film formation. In the non-optimum operating conditions, e.g., during overcharge and charging at high rates, especially at low temperatures, 36 there may be issues related to lithium deposition on the anode and electrolyte oxidation at the cathode releasing gaseous products. All these processes cause loss of lithium inventory and loss of both anode and cathode active materials.
With several processes occurring due to different causes and at different rates, either independently or through an interdependence, it is difficult to model the capacity degradation during cycling. 37 Each of these degradation processes have been modeled separately. 38,39 Recent models of capacity degradation 40 suggest three phases of capacity fade: Phase-1 corresponding to a rapid initial capacity drop, as Li is consumed during SEI formation/ reformation, Phase-2 reflecting a moderate drop in capacity following an almost a linear degradation, associated with loss of Li inventory in side reactions, possibly bulk effects in the electrodes, and Phase-3 showing rapid capacity fade leading a quick cell failure, attributed to lithium plating and subsequent impedance increase. 41 The recent comprehensive data on various Li-ion cells reported by Preger et al. 14 is consistent with this trend.
We have attempted to elucidate analytical expressions for the cycle life behavior presented in Fig. 5. In almost all cases, except LG chem MJ1 cells, the cycle life curves show different fade rates, indicative of different fade mechanisms in operation, maybe even concurrently (Fig. 14). In all the cases, fade rate is high initially and levels off, which may be attributed to the SEI formation. Subsequently, the fade slows down, showing an almost linear fade rate in all the cases. Only in the case of Panasonic BJ cells, the fade rate becomes steeper, implying the onset of the third mechanism dealing with possibly lithium plating. Analytically, the capacity life follows a simple exponential decay in the case of LG Chem MJ1 cells, which may be fortuitous. In all the other cells, it is difficult to establish a simple correlation. Instead, the cycle life trends as third or even fourth-order polynomial equations, highlighting the complexity of describing the capacity fade using simple kinetics equations for a single degradation mechanism, and the need to invoke multiple degradation processes within the cells (Fig. 14).
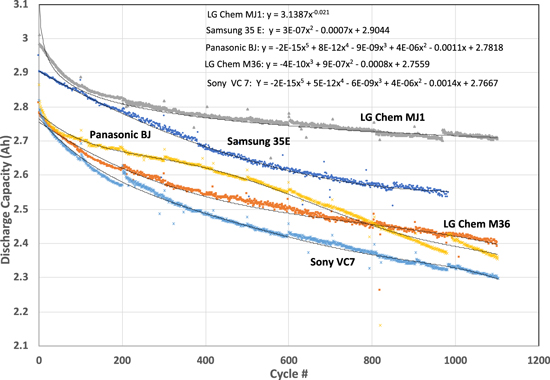
Figure 14. Cycle life trends of COTS 18650 cells at 100% DoD and 20 °C, showing the complexity of the performance degradation involving multiple processes and the difficulty in expressing the fade by simple analytical expressions.
Download figure:
Standard image High-resolution imageDischarge rate characterization vs temperature
Discharge rate tests were performed at various temperatures from +20 °C to –20 °C; each discharge followed a C/10 charge to 4.10 V performed at the same temperature as the discharge. Temperature rise during discharge was recorded by a thermocouple affixed with Kapton tape to the cell side wall. Fig. S2 shows discharge curves of four cell types, LG Chem M36, Samsung 35E, Murata VC7, and Panasonic BJ, at various currents ranging from C/20 to 1.5 C rates at 25 °C. Panasonic BJ cells display impressive rate capability with over 90% capacity retained at 1.5 C with only small decrease in the discharge voltage. LG Chem M36 also provides ∼90% capacity at 1.5 C, but the discharge voltage is reduced. Both Murata VC7 and Samsung 35E deliver ∼80% capacity at 1.5 C and show a greater reduction in discharge voltage.
Figure 15 shows the variation of specific energy of four cell types, LG Chem MJ1, LG Chem M36, Samsung 35E, and Murata VC7, vs discharge current at different temperatures, something similar to Ragone plots.

Figure 15. Specific energy vs discharge current of COTS 18650 cells at different temperatures: (A) 20 °C, (B) 0 °C and (C) −20 °C.
Download figure:
Standard image High-resolution imageOnce again, MJ1 gives the highest specific energy at all the currents tested, with close to 210 Wh kg−1 at 3 A and 25 °C, followed by Samsung 35E and LG Chem M36. Murata VC7 also functions well at high currents giving ∼180 Wh kg−1 at 3 A and 25 °C. At 0 °C, the specific energy of MJ1 continues to be highest with ∼170 Wh kg−1 at 3 A followed by M36 with 158 Wh kg−1, 13 4 Wh kg−1 for Murata VC7 and 121 Wh kg−1 for Samsung 35E. Both Murata VC7 and Samsung 35E show considerable reduction in performance at high rates, delivering only 134–122 Wh kg−1 at 0 °C. At – 20 °C, the cells provide ∼100 Wh kg−1 at 0.5 A (∼C/6) or lower. At higher discharge currents, the specific energy drops sharply to 30–70 Wh kg−1 at C rate, with both MJ1 and Samsung SE on the low end and M36 and Murata VC7 on the high end.
High rate discharge (3C)
As evident from the above discharge characterization tests, these cells provide impressive power densities in addition having high specific energies. Even though most of the applications do not require higher discharge than 1 C rate, there are applications, e.g., planetary ascent vehicles, planetary aerial vehicles (helicopters) and electric aircraft, which require much higher power densities. The first batch of cells, i.e., LG Chem MJ1, M36, Samsung 35E, Panasonic BJ and Murata VC7 cells were evaluated at a high continuous discharge current of 9.6 A (3.3 C rate) at temperatures from 20 °C to 50 °C (Fig. 16). These tests were performed in a convective thermal chamber, and also with the chamber turned off following a 4 h soak at the relevant temperature. The cell temperatures were monitored during discharge.
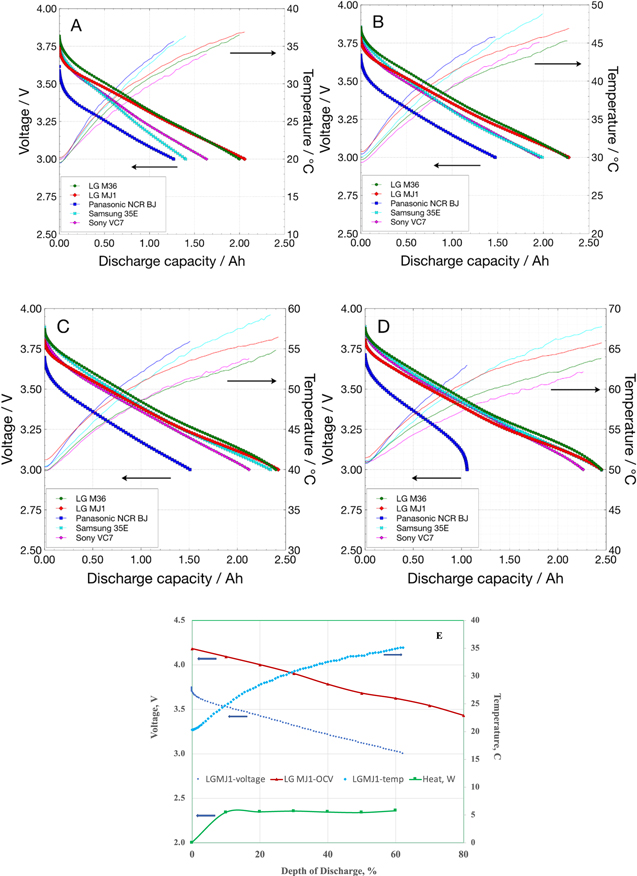
Figure 16. Discharge curves (dotted) and increase in cell temperatures (lines) during high rate (3 C, 9.6 A) discharge of COTS 18650 cells at different temperatures with convective control: (A) 20 °C, (B) 30 °C, (C) 40 °C and D) 50 °C. Figure 14E shows the heat generation rate during the high rate discharge at 20 °C.
Download figure:
Standard image High-resolution image
Both LG Chem MJ1 and M36 cells show impressive performance providing more than 2 Ah capacity even at room temperature at 9.6 A, which continues to improve at warmer temperatures. In contrast, Samsung 35E and Murata VC7 cells provide ∼1.5 Ah capacity at 20 °C, 2 Ah at 30 °C and >2 Ah capacity only at warm temperatures of 40 °C–50 °C. The Panasonic BJ show reduced performance of ∼1 Ah at the high rate even at warm temperatures. In all cases, there is considerable self-heating of the cells, with the cell temperatures increases by ∼16 °C–18 °C at all start temperatures. The steady state heat dissipation at the 3 C discharge rate is estimated to be 4 W, estimated using the open circuit values as thermo-neutral potentials, which was shown to be a valid assumption. 42 The heat rate of 4 W is substantial and is about 6% of the energy released during thermal runaway. 43,44 In short, the cells can indeed provide high power densities of ≥700 W kg−1 in a continuous mode with appreciable capacities, especially at warm temperatures, but their high rates of heat dissipation needs to be managed with suitable thermal designs.
Conclusions
Commercial 18650 Li-ion cells were deemed to be advantageous over large-format custom Li-ion cell technologies, due to their higher specific energy, superior production quality, better cell uniformity, enhanced safety and simpler battery management, and were evaluated for future NASA and other aerospace applications. In addition to the routine electrical characterization tests, including cycle life at different depths of discharge and discharge rate capability, EIS was used for understanding the effects of cycling. Also, destructive physical and chemical analyses were carried out on the cells to characterize the cell components. Overall, all the cells, i.e., specifically cells from LG Chem, Samsung, Murata, and Panasonic have shown high specific energies and impressive cycling characteristics. Although many of the cells performed admirably in these tests, the LG MJ1 cell has outperformed the rest, delivering the highest specific energy, best cycle life, and the most capacity even at 9.6 A discharge rate. The MJ1, the LG M36, and the Samsung 30Q cells gave the most stable end-of-discharge voltage over 5500 cycles during cycling at 20% and 40% depth of discharge cycling. Though not demonstrated here, the two power cells, LG HG2 and Samsung 30Q have shown indications of performing well at 3 C rate, implying that these cells could be candidates to replace thermal batteries in high-power applications, e.g., for the Entry Descent and Landing sequences in space missions. In summary, the commercial 18650 cells are extremely promising, by virtue of their enhanced energy densities, cyclability and durability, and may be implemented to benefit future space missions, including planetary lander, rovers, orbiters and satellites, and many commercial applications, especially electric vehicles.
Acknowledgments
This work carried out at the Jet Propulsion Laboratory, California Institute of Technology, under a contract with the National Aeronautics and Space Administration (80NM0018D0004) and was supported by NASA Engineering and Safety Center (NESC) and Europa Lander (Descent Stage) project. The authors would like to thank Nathan Dalaney, the summer intern from UC Santa Cruz, for assisting in the impedance analyses.