
Abstract
The release of gases through electrolyte decomposition is a problem of prominent concern in the Li-ion battery industry, due to the negative impact of gassing on cell safety and performance. The development of new electrolytes and additives is essential in enabling low-gassing batteries. Organosilicon (OS) molecules, which merge a silane with a Li+ coordinating functionality, have been developed by Silatronix® as additions to conventional carbonate electrolytes, demonstrating critical high thermal and voltage stability to enable next-generation Li-ion batteries. In this study we report performance testing and fundamental mechanistic studies to investigate gassing phenomena in advanced Li-ion chemistries under storage test conditions. Novel organosilicon nitriles developed by Silatronix® as well as common gas reducing additives (i.e. 1,3-propanesultone, succinonitrile) were evaluated in a 4.35 V Graphite/NMC622 (LiNi0.6Mn0.2Co0.2O2) multi-layer pouch cell. Potential synergies between OS materials and these additives were investigated. The dependence of gassing on electrolyte composition and test conditions was investigated, and connections between gassing behavior and electrode surface chemistry are also reported. Key experimental results show that all OS concentrations reduce gas generation during 60 °C storage, and higher OS content provides greater benefit. Overall, we show that organosilicon additives substantially reduce gassing from carbonate-based electrolytes while maintaining cell performance.
Export citation and abstract BibTeX RIS
Gas produced in pouch cell batteries during storage or cycling is a significant problem in the battery industry. The swelling of the pouch cell during the life of the battery can negatively impact performance and represents a safety risk. 1–3 Research in reducing gassing in battery cells has found several different electrolyte additives that are successful in mitigating gas production. 1,3-propanesultone (PS) is one example that has shown gassing reduction from multiple studies. 4–9 Nitriles have also been investigated for their ability to stabilize cathode interfaces in batteries, with a few examples showing reduced gassing due to this effect. 10–12 However, no additive package has been found to completely reduce gassing, and therefore the innovation of novel electrolyte additives is needed. Additionally, gaining an understanding of the origin of different gas species and the conditions under which they form will enable rational design of electrolyte formulations with superior thermal stability and reduced gassing.
Previously, organosilicons have been investigated as battery electrolyte solvents and additives with high voltage and high thermal stability. 13–15 Organosilicons have been shown to significantly decrease thermal degradation of the electrolyte. 14,15 Mechanistic investigations found that organosilicons protect lithium hexafluorophosphate against degradation. 14,15 Therefore organosilicons are interesting materials for stabilizing battery electrolytes and electrodes against the degradation that causes gassing. In this paper, we investigate gassing in 4.35 V Graphite/NMC622 (LiNi0.6Mn0.2Co0.2O2) multi-layer 250 mAh pouch cells during high temperature (60 °C) storage for 4 weeks, through experiments designed to test the effect of the electrolyte formulation on gassing, including different carbonate solvents, OS additives, and/or other additives. Total gas volume is measured by the Archimedes method, and gas composition is analyzed with a dual-column gas chromatograph with a thermal conductivity detector (GC-TCD), as reported previously by Xiong et al. 16
We report significant reduction in the gas produced by pouch cells after storage at 60 °C with the addition of several OS molecules to carbonate-based electrolytes, including two different organosilicon nitrile molecules (OS3-A and OS3-B) with the general structure shown in Fig. 1 and OS3-B being more fluorinated than OS3-A. Further reduction in gas can be achieved with increasing OS3-A content. Combining 1,3-propanesultone (PS) and OS3-A results in a synergistic effect with gassing reduced further than either additive alone. We show that the beneficial effect of organosilicon additives on gassing in pouch cells is more active per molecule than additives such as PS and succinonitrile (SN), and gassing reduction with OS3-A is observed broadly across different storage voltages. Our investigations of the fundamental gassing mechanisms in pouch cells utilize X-ray photoelectron spectroscopy (XPS) surface analysis and nuclear magnetic resonance spectroscopy (NMR). We find that OS reduces gassing primarily via protection of ethylene carbonate (EC) and propose mechanisms to explain these results.
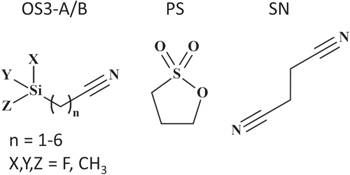
Figure 1. Structures of additives studied for gas reduction in this paper.
Download figure:
Standard image High-resolution imageExperimental
Electrolyte preparation
All carbonate solvents and LiPF6 were purchased electrochemical grade from Gotion (water content < 20ppm). Vinylene carbonate (VC) and 1,3 propanesultone (PS) were purchased from BASF. Succinonitrile (99%) was purchased from Alfa Aesar. The OS3-A and OS3-B were Silatronix® electrochemical grade (>99.8% purity, <20 ppm water). The control electrolyte was a blend of EC, ethyl methyl carbonate (EMC), and diethyl carbonate (DEC) in the ratio EC/EMC/DEC 1/1/1 by volume, with 0.5 vol% VC and 1 M LiPF6. All electrolytes were prepared and stored in an argon glove box. All electrolyte solvents and additives were prepared and are reported by volume unless otherwise noted.
Pouch cell testing
Dry, pre-packaged 250 mAh graphite/NMC622 multi-layer pouch cells were obtained from LiFun (China). The cells were dried under vacuum at 60 °C for 48 h then filled with approximately 1 g of electrolyte in an argon glove box. After filling, the cells soaked at 30 °C for 36 h. All cell testing was conducted in temperature-controlled chambers using Maccor battery cyclers. The cells were formed at 45 °C at C/50 for two complete cycles (3.0 V–4.35 V) with a degassing step at 4 V during the first charge. For the storage experiments, the cells were cycled twice at C/5 (3 V–4.35 V) then charged at C/5 to 100% state of charge (SOC) at 4.35 V, or charged to another specified voltage (4.2 V or 4.0 V for voltage dependence storage experiment). The cell volume was measured at 100% SOC using the Archimedes method. The cells were stored at 60 °C for 4 weeks. After storage, the cells were allowed to cool to room temperature and cell volume was measured by the Archimedes method as described previously. 17 The cell gas volume reported is the difference between the volume measured before 60 °C storage and after 60 °C storage. Then 30 °C capacity retention testing was conducted. First the cells were discharged to 3 V to determine the retained capacity after storage. Then, the cells were cycled at C/5 for two complete cycles to determine the recovered capacity after storage.
Gas chromatography analysis of gas generated in pouch cells
Gas generated during 60 °C storage was extracted from the pouch cells after storage using a gas tight syringe (Hamilton 1710N—100 μl) through an adhesive foam septum (Quantek Instruments). The gas was injected into an Agilent 6890 N Gas Chromatograph (TCD detector) equipped with a dual column system: HP-Plot Q (30 m length, 0.32 mm ID, 20.00 μm film thickness, 7 inch cage) and HP-PLOT Molesieve (20 m length, 0.32 mm ID, 25.00 μm film thickness, 7 inch cage). The dual column system allowed separation of permanent gases (N2, O2, H2) and other gaseous components (CO2, CO, methane, ethane, ethylene) and has been described previously for full analysis of battery gas compositions. 16 The system was calibrated using several standard gas mixtures to allow accurate quantitative analysis for H2, CO2, CO, N2, O2, methane, ethane, ethylene, propane, and propylene. For all calibrated species, 5% and 1% mixtures in argon (custom, Praxair) were used. Quantities of propane, propylene, and ethylene were negligible and therefore are not shown in figures reporting gas compositions. The GC program was optimized to provide separation of the required gaseous species: 20 °C min−1 ramp from 50 °C to 70 °C, −20 °C min−1 ramp from 70 °C to 50 °C, 35 °C min−1 ramp from 50 °C to 250 °C, and 8 min hold at 250 °C. Argon was used as the carrier gas (29.7 psi pressure). An example of one of the raw GC chromatograms showing separation of all gas components is in the Supporting Information (Fig. S1 available online at stacks.iop.org/JES/168/030533/mmedia).
Electrolyte recovery analysis
Liquid electrolyte was recovered from the multi-layer pouch cells after storage using a gas tight syringe (Hamilton 1710N—100 μl) through the adhesive foam septum (Quantek Instruments). The liquid was diluted in 0.75 ml of acetone-d6 (Oakwood Chemicals) for 1H -NMR analysis (16 scans) in a Bruker-Avance-500 with a DCH cryoprobe (Paul Bender Chemical Instrumentation Center, University of Wisconsin-Madison). Additive percent concentrations were calculated from the integrals of the following peaks in the 1H-NMR spectra, calibrated to the EC peak integration and referenced to acetone-d6 at 2.05 ppm: VC (7.59 ppm, singlet), PS (2.65 ppm, multiplet), SN (2.96 ppm, singlet), OS3-A (0.25 ppm, doublet), EC (4.57 ppm, singlet), EMC (3.70 ppm, singlet), and DEC (1.24 ppm, triplet). Percent volume of each additive was calculated by molecular weight (g mol−1)*peak integral/(number of protons*density (g ml−1)). Spectra were processed with MestreNova 11.0.0.
X-ray photoelectron spectroscopy surface analysis
For surface analysis, the cells were disassembled at 50% SOC in an argon glove box. Pieces of the anode and cathode were excised from the jelly-roll, rinsed three times with electrochemical grade dimethyl carbonate, and dried at room temperature overnight under vacuum (∼50 mTorr). The samples were loaded into an air-free XPS sample holder (Vacuum Transfer Module, Thermo Fisher) to prevent contamination during transport to and loading into a Thermo k-alpha X-ray photoelectron spectrometer with Al source (Nanoscale Imaging and Analysis Center, University of Wisconsin-Madison). Spectra were collected with a 200 μm spot size and 45° detection angle. Survey scans (0–1400 eV, 5 scans) were collected at 1 keV. Multiplex scans were taken for C(1s), N(1s), Si(2p), and S(2p). XPS spectra were processed with CasaXPS (version 2.3.19), and multi-plex spectra were referenced to the adventitious carbon peak at 284.8 eV. After defining quantification regions for every element observed in the survey spectra, atomic percent concentrations of each element of interest were calculated by CasaXPS as a function of the total surface elemental composition, using the Scofield response factors, which are appropriate for the XPS instrument used in this study.
Results and Discussion
Organosilicon nitrile additives effect on gassing
In this study, gassing in Gr/NMC622 pouch cells was investigated after aging through storage at 60 °C for 4 weeks. Our choice of high temperature storage as the aging condition was motivated by multiple previous studies demonstrating significant gassing in commercial pouch cell batteries after storage at 60 °C. 7,10,18 We designed these experiments to test the impact of additives such as the organosilicons OS3-A and OS3-B (structures in Fig. 1) on pouch cell gassing. Figure 2 shows the volume and composition of gas produced in pouch cells during storage for the control electrolyte and with 1, 2, and 3% OS3-A (Figs. 2a–2b), and 3% OS3-B (Figs. 2c–2d). Since we observe some batch-to-batch variability in the absolute gassing volume from pouch cells, throughout this paper each additive is compared to control cells that were run with the same batch. The discharge capacities of these cells after formation/condition, retained capacity after storage, and recovered capacity after storage are shown in the Supporting Information (Fig. S2). These results show that cells with the OS3-A additive maintain high retained capacity after storage, with a small decrease in capacity seen for 3% OS3-A (10 mAh) relative to the control. There is no significant difference in the recovered capacity between the control and the OS3-A-containing electrolytes.

Figure 2. Gas evolved in Gr/NMC622 multi-layer pouch cell batteries after 4 weeks of storage at 60 °C after charging to 4.35 V for control electrolyte (EC/DEC/EMC 1/1/1 + 0.5% VC + 1 M LiPF6, black bars) and for 1% OS3-A (dark blue bars), 2% OS3-A (red bars), 3% OS3-A (light green bars), and 3% OS3-B (light blue bars) electrolytes. (a) and (c) Total volume measured by Archimedes' method and (b) and (d) gas components identified and quantified by GC-TCD. All electrolyte compositions by volume.
Download figure:
Standard image High-resolution imageFigure 2a shows the total gassing volume decreases with added OS3-A, with gassing further decreased by the addition of more OS3-A. Figure 2c shows that 3% OS3-B also shows a significant decrease in gassing compared with the control, the same effect as OS3-A. With 3% of either OS, the gassing is reduced by 59%–61% relative to the control electrolyte. The composition of these gases as identified and quantified by dual-column GC are shown in Figs. 2b and 2d. These gases include, in order of decreasing quantity produced in the control: CO > CO2 > methane > ethane > hydrogen > ethylene. The addition of OS3-A or OS3-B reduces the quantities of all gas species relative to the control electrolyte, and greater concentrations within the OS3-A additive concentration series reduces each species even more. While OS3-A and OS3-B affect all gas species, the reductions in CO2 are the most significant. With either 3% OS3-A or 3% OS3-B, the volume of CO2 has been reduced by 98% relative to the control electrolyte. Therefore, we report two organosilicon nitrile additives that show significantly reduced gassing after 60 °C storage, and while this benefit is seen for all gas species, the greatest percent reduction occurs with CO2. These results show that both OS3-A and OS3-B have the same gas reduction mechanism, highlighting organosilicons as additives of high interest for their ability to stabilize batteries against gas-forming degradation mechanisms, and suggesting the function of gas reduction may be achieved by a broad category of organosilicon structures. Further studies on the impact of organosilicon structure are on-going. For the rest of this study, we focus on the OS3-A additive. The significance of these volume reduction and gas composition results on the mechanisms of gassing and how OS3-A impacts them will be discussed later in this paper.
Synergistic effects of OS3-A and propanesultone
1,3-propanesultone (PS) is a known gas-reducing additive, 4–9 and therefore the effect of combining PS and the novel gas reducing additive OS3-A is of interest. Previous literature reports on the concentration effect of PS as an additive showed the best gas reduction with 3 wt% PS (equivalent to 2.4 vol%), 8 motivating our choice of the same concentration of PS in this study. The discharge capacities of the 2.4% PS, 2.4% PS + 1% OS3-A, and 2.4% PS + 3% OS3-A cells after formation/condition, retained capacity after storage, and recovered capacity after storage are shown in the Supporting Information (Fig. S3). These results show that cells with the OS3-A additive maintain high retained capacity after storage, with a small decrease in capacity seen for 2.4% PS + 3% OS3-A (15 mAh) relative to the 2.4% PS cell. There is also a slight decrease in the recovered capacity with the addition of 3% OS3-A (8 mAh).
Figure 3a shows the total gas volume from pouch cells after 4 weeks storage at 60 °C with the control electrolyte, as well as electrolytes formulated with 1–3 vol% OS3-A, 2.4 vol% PS, and 1–3 vol% OS3-A + 2.4 vol% PS. In accord with the literature reports, 2.4 vol% PS reduces gassing relative to the control electrolyte. 4–7 Figure 3a shows that 2.4 vol% PS (patterned black bars) has a similar gas volume reduction to 1 v% OS3-A (dark blue bars), both with 36% gas reduction compared to the control. Adding OS3-A to electrolytes with 2.4% PS results in a further stepwise reduction of gassing, with 2.4% PS + 3% OS3-A having the lowest gas volume of all electrolyte formulations tested in this study (66% reduction relative to control electrolyte). The absolute volumes of the three main gas species of these samples are shown in Fig. 3b, with the full composition quantification shown in the Supporting Information (Fig. S4). Like OS3-A, PS is shown to significantly reduce CO2. Unlike OS3-A, however, PS does not cause a significant reduction in CO or methane. This indicates that these two additives operate with distinct mechanisms. Furthermore, reduction of CO2 is enhanced by the combination of PS and OS3-A, with no CO2 produced with 2.4% PS + 3% OS3-A. Therefore, we observe a beneficial synergistic effect on gas reduction with combined OS3-A and PS. The addition of OS3-A further reduces CO2 and provides an additional reduction in CO (the primary gas produced in these samples) and methane otherwise not observed with 2.4% PS alone.
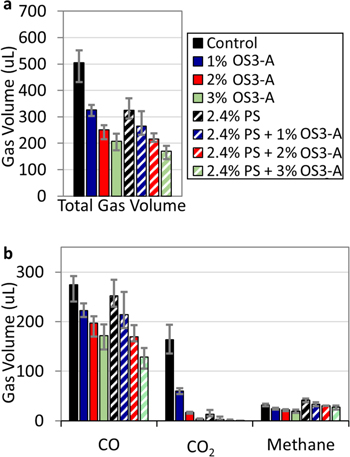
Figure 3. Gas evolved in Gr/NMC622 multi-layer pouch cell batteries after 4 weeks of storage at 60 °C after charging to 4.35 V for control electrolyte (EC/DEC/EMC 1/1/1 + 0.5% VC + 1 M LiPF6, solid black bars) and for electrolytes with 1% OS3-A (solid dark blue bars), 2% OS3-A (solid red bars), 3% OS3-A (solid light green bars), 2.4% PS (patterned black bars), 1% OS3-A (patterned dark blue bars), 2% OS3-A (patterned red bars), 3% OS3-A (patterned light green bars). (a) Total volume measured by Archimedes' method and (b) primary three gas components identified and quantified by GC-TCD. Full gas component analysis in Supporting Information (Fig. S4). The error bars represent the maximum and minimum values of three or more repeat measurements. All electrolyte compositions by volume.
Download figure:
Standard image High-resolution imageComparison of OS3-A and other gas reducing additives
In addition to PS, succinonitrile (SN) is a known battery additive that has been previously shown to reduce gassing in batteries, including cells with LCO, NMC111, and NMC422 cathodes. 10–12,17,19,20 However, the effect of SN on gassing in NMC622 has not yet been reported, and our study here provides a direct comparison of SN with the novel organosilicon nitrile additive OS3-A. Figure 4a shows the total gas volume evolved from the control electrolyte as well as the electrolyte with 3% OS3-A, 0.75% SN, or 1.5% SN. The concentrations of SN were chosen to correspond to the same moles of additive as 3 vol% OS3-A (1.5 vol% SN) and the same moles of nitrile as 3 vol% OS3-A (0.75 vol% SN), considering that SN contains two nitrile functionalities per molecule. Both concentrations of SN reduce gassing by 20% relative to the control, with no effect from increasing SN concentration. By comparison, Fig. 2a shows that 3% OS3-A reduces gassing by 57% and further reduction in gassing can be achieved with increasing concentration of OS3-A.

Figure 4. Gas evolved in Gr/NMC622 multi-layer pouch cell batteries after 4 weeks of storage at 60 °C after charging to 4.2 V for control electrolyte (EC/DEC/EMC 1/1/1 + 0.5% VC + 1 M LiPF6, solid black bars) and for electrolytes with 3% OS3-A (solid light green bars), 0.75% SN (patterned light orange bars) and 1.5% SN (patterned orange bars). (a) Total volume measured by Archimedes' method and (b) primary three gas components identified and quantified by GC-TCD. Full gas component analysis in Supporting Information (Fig. S5). The error bars represent the maximum and minimum values of three or more repeat measurements. All electrolyte compositions by volume.
Download figure:
Standard image High-resolution imageIn order to make a direct comparison between the novel additive OS3-A and the commercial gas reducing additives SN and PS, we compare the percent volume reduction of each additive relative to the control sample as a function of the additive percent in the electrolyte by volume (vol%), by mass (mass%), and by mole (mol%). These normalizations allow assessment of the additive's activity per volume, per weight, and per molecule. Figure 5 shows that for every method of unit normalization, OS3-A has greater activity per unit than SN or PS in this study. While there was only one concentration of OS3-B tested, it shows the same high activity trend per unit as OS3-A. Further, Fig. 5a shows that the increase in volume reduction vs control by OS3-A does not occur linearly with regards to concentration in %vol, but rather, the relationship can be fit with a logarithmic trend line (dashed green line in Fig. 5a), where even low concentrations (1 vol%) of the organosilicon additive provide significant volume reduction.
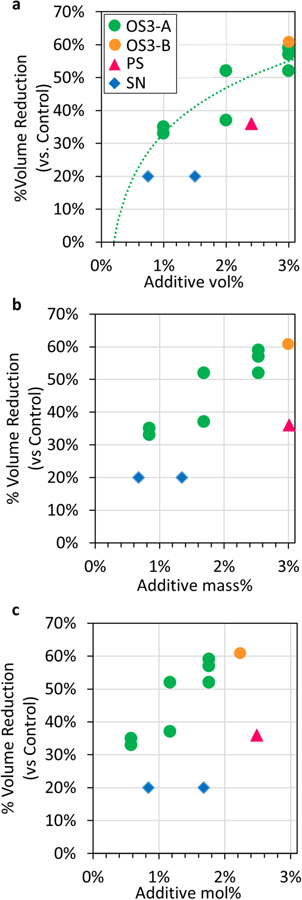
Figure 5. Percent volume reduction relative to the control electrolyte in Gr/NMC622 multi-layer pouch cell batteries after 4 weeks of storage at 60 °C after charging to 4.35 V for additives OS3-A (green circles), OS3-B (brown circles), SN (blue diamonds), and PS (pink triangles). As a function of (a) additive volume % in electrolyte, with logarithmic fit (green dashed line), (b) additive mass % in electrolyte, and (c) additive mole % in electrolyte.
Download figure:
Standard image High-resolution imageMechanistic understanding of the effect of voltage on gassing
In order to understand the fundamental mechanisms that give rise to the observed gas species in battery pouch cells after storage and the ability of additives to reduce them, we tested storage conditions after charging Gr/NMC622 multi-layer pouch cells to different voltages (4.0 V, 4.2 V, and 4.35 V). Figure 6a shows that the volume of gas evolved from both control and 3% OS3-A cells increases in the order 4.0 V < 4.2 V < 4.35 V. At 4.0 V, the volume of gas is the same for the control and 3% OS3-A electrolytes, while at 4.2 V and 4.35 V the cells with 3% OS3-A reduced gassing by 43%–45% relative to the control. The gas components in Fig. 6b show that all gas species increase with voltage, but the greatest increase is seen for CO and CO2. Storage at 4.0 V generated only a small volume of CO2.
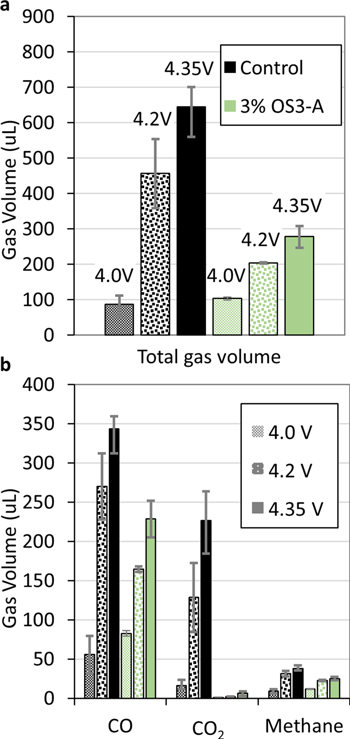
Figure 6. Gas evolved in Gr/NMC622 multi-layer pouch cell batteries after 4 weeks of storage at 60 °C after charging to 4.0 V (hashed bars), 4.2 V (dotted bars), and 4.35 V (solid bars) for control electrolyte (EC/DEC/EMC 1/1/1 + 0.5% VC + 1 M LiPF6, black bars) and electrolyte with 3% OS3-A (light green bars). (a) Total volume measured by Archimedes' method and (b) primary three gas components identified and quantified by GC-TCD. Full gas component analysis in the Supporting Information (Fig. S6). The error bars represent the maximum and minimum values of three or more repeat measurements. All electrolyte compositions by volume.
Download figure:
Standard image High-resolution imageIn the following section, we discuss the likely origins of CO2 in batteries during storage in this experiment based on the current scientific understanding. Literature studies of the voltage dependence of CO2 evolution have shown that direct oxidation of EC to produce CO2 occurs only at voltages > 5 V vs Li/Li+. 21 Between 4.3 V and 5 V, CO2 is evolved via oxidation by reactive oxygen species generated by oxygen released from the metal oxide cathode. 21–24 The exact voltage of lattice oxygen release depends on the cathode composition 21,24 and the storage/cycling temperature. 23 For NMC622 at 25 °C, lattice oxygen release occurs at 4.54 V. 24 Increasing the temperature from 25 °C to 50 °C causes a 60 mV decrease in the NMC622 oxygen release from 4.42 V to 4.36 V. 23 Therefore under the conditions of this study at 60 °C, the release of lattice oxygen is likely to occur around 4.36 V or at a slightly lower voltage. Thus, we propose that the primary mechanism of CO2 generation during storage at 4.35 V in this study is oxidation of EC via reactive oxygen formed from the cathode. The release of oxygen may also be accompanied by greater transition metal ion dissolution, 25 which can deposit on the anode and enhance formation of H2, CO, and ethylene gasses. 26
Below the oxygen evolution voltage, reported sources of CO2 include 1) oxidation of Li2CO3 (∼4.1–4.2 V vs Li/Li+) from cathode surface contamination; 27 2) oxidation of solid-electrolyte interphase (SEI) layer formation products after migration to the cathode including Li2CO3 (∼4.1–4.2 V) 22,24 and lithium ethylene dicarbonate (LEDC, unknown oxidation voltage on NMC); 28 3) production of Li2CO3 and LEDC during SEI formation followed by thermal reaction with LiPF6 (no voltage dependence); 29,30 4) thermal reaction of carbonate solvents with POF3 (no voltage dependence), 31 and 5) hydrolysis of EC (no voltage dependence). 32 The hydrolysis of EC was shown to be a minor process unless water or hydroxide was added (based on the rate reported for 60 °C, 32 over 4 weeks only ∼2 × 10⁻¹ μl total CO2 should be generated from hydrolysis of EC). Therefore, we eliminate EC hydrolysis as a major contributor to CO2 in this study.
The large increase in CO2 from 4.0 V to 4.2 V suggests that the majority of CO2 at 4.2 V is generated by a potential-dependent mechanism. Since 4.2 V is not a high enough voltage to induce oxygen release or direct EC oxidation, the primary mechanism of CO2 at 4.2 V is likely oxidation of Li2CO3 or LEDC. 27,28 Hatsukade et al. showed that the majority of Li2CO3 surface contamination is consumed after the first two cycles, and any CO2 evolving from this source is negligible in subsequent cycles. 33 Therefore, in this study, CO2 produced during storage (which comes after a degassing step during formation cycles) could not derive primarily from Li2CO3 surface contamination, but could come from Li2CO3 or LEDC generated from EC in situ at the anode, followed by migration to the cathode. We observe CO2 generated in significant quantities during storage at 4.2 V with the control electrolyte, indicating that the anode SEI is not stable after formation, but continues to dissolve and cause further anode-electrolyte reactions (and reactions at the cathode, through SEI species migration) throughout storage. Continuous SEI dissolution or decomposition has been reported previously, as a mechanism of capacity loss. 34–36
The volume of CO2 generated from the control during storage at 4.0 V is 7% of the CO2 generated at 4.35 V. All electrochemical sources of CO2 are reported at or above 4.1 V, 21–24 therefore the source of CO2 at 4.0 V is likely a thermal reaction mechanism of Li2CO3 or EC 29,31 rather than a potential-driven reaction. Li2CO3 may form in situ during storage or during charging immediately prior to storage through mechanisms previously reported including decomposition of SEI components or reduction of EC. 22 Thermal decomposition products of PF6 − (HF, PF5, POF3) have been reported to react with EC or Li2CO3 with CO2 as a product. 29–31
In summary, we propose different mechanisms are responsible for the different volumes of CO2 generated at 4.35 V, 4.2 V, and 4.0 V storage. At 4.35 V, the primary mechanism is proposed to be oxidation of EC due to reactive oxygen released from NMC622. At 4.2 V, oxidation of Li2CO3 or LEDC originating as anode reduction products is proposed as the CO2 source. Finally, a relative minor source of CO2 during storage at 4.0 V is thought to evolve through potential-independent hydrolysis or thermal decomposition of EC or Li2CO3. Importantly, Fig. 6b shows that the additive OS3-A reduces CO2 generation at all of these voltages by 94%–97%. Thus, we propose that OS3-A acts in a multi-functional manner to stabilize the battery electrolyte. We explore this hypothesis with more experiments later in this paper.
As with CO2, CO is produced at higher volumes with increasing storage voltage (Fig. 6b). The origin of CO is more complex than CO2, since CO has been shown to form at both cathode and anode, 27 and by both EC and other carbonate solvents. 27 The OS3-A additive decreases CO evolution only at 4.2 V and 4.35 V and not at 4 V, indicating that the organosilicon additive is active only on high-voltage mechanisms of CO evolution. Similarly, OS3-A reduces methane only at 4.2 V and 4.35 V storage. For CO and methane, the percent reduction with OS3-A is 25%–39% relative to the control, while OS3-A reduces CO2 by 94%–98%. Thus, the mechanism(s) of OS3-A to reduce gassing are highly active on CO2 at all voltages, but have only a moderate effect on methane and CO, only at higher voltages.
Mechanistic understanding of gassing from binary and single solvent blends
Understanding the mechanism of gassing in batteries necessitates understanding which components of the electrolyte give rise to each gas species. The complexity of commonly used ternary blend electrolytes, such as the control used in this study (EC/EMC/DEC), prevents identification of which carbonates contribute to gassing. Towards this end, we formulated the following single and binary carbonate solvent electrolytes, each with 1 M LiPF6: EC/DEC 9/1 mol/mol; EC/DEC 1/9 mol/mol; EC/EMC 9/1 mol/mol; EC/EMC 1/9 mol/mol; and pure EMC + 0.5 vol% VC (no other solvent). While the ideal experiment to isolate gas from each solvent would be electrolytes with a single solvent, this was not possible for EC and DEC; EC is solid at room temperature, and a pouch cell formulated with DEC + 0.5% VC was not able to cycle successfully. This may be due to the poor ability of most linear carbonates to provide a stable SEI layer even for limited cycling. 37 Therefore we performed this experiment with an EMC + 0.5% VC electrolyte, as well as four binary electrolyte formulations with combinations of EC/EMC and EC/DEC. In these binary electrolytes, one solvent represents 90 mol% of the electrolyte and thus will represent the primary source of gas within the cell. These electrolytes were used in Gr/NMC622 multi-layer pouch cells and stored for 4 weeks at 60 °C after charging to 4.35 V, following which the evolved gas was analyzed by Archimedes' method and gas chromatography.
Figure 7a shows the gas components generated from the EMC + 0.5% VC electrolyte pouch cell. Unlike the ternary blend control electrolyte shown in Fig. 2b, no CO2 is produced when EMC is the only carbonate solvent. In the same manner, Fig. 6b shows in the EMC-rich binary blend (EC/EMC 1/9 by mole) very little CO2 is produced, while there is significant CO2 evolved for the EC-rich blend (EC/EMC 9/1 by mole). Similar behavior is observed for the EC/DEC binary blends. The EC-rich binary blend (EC/DEC 9/1 by mole) shows significant quantities of CO2 while the DEC-rich binary blend (EC/DEC 1/9 by mole) evolves very little CO2 (Fig. 6c). These results show that EC is the only significant source of CO2 in the pouch cell under the aging conditions of this study, and not the linear carbonates. Other studies have also identified EC as the primary source of CO2. 38,39 While these studies also showed some CO2 derived from non-EC sources (11% from DEC and 37% from non-solvent sources; 39 some from DMC 38 ), in all cases EC is the primary source of CO2, and under the conditions tested in our studies, non-EC sources of CO2 are negligible.
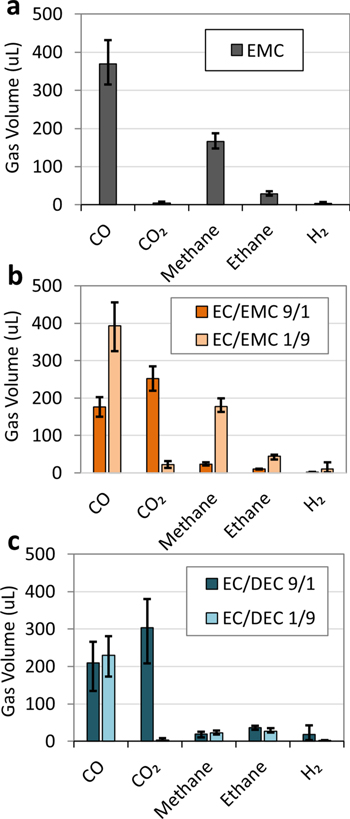
Figure 7. Composition of gas (from GC-TCD) evolved in Gr/NMC622 multi-layer pouch cell batteries after 4 weeks of storage at 60 °C after charging to 4.35 V for (a) EMC + 0.5 vol% + 1 M LiPF6 electrolyte, (b) EC/EMC 9/1 mol/mol + 1 M LiPF6 (dark orange bars) and EC/EMC 1/9 mol/mol + 1 M LiPF6 (light orange bars), and (c) EC/DEC 9/1 mol/mol + 1 M LiPF6 (dark blue bars) and EC/DEC 1/9 mol/mol + 1 M LiPF6 (light blue bars). Full gas component analysis in Supporting Information (Fig. S7). The error bars represent the maximum and minimum values of two or more repeat measurements. All electrolyte compositions by volume.
Download figure:
Standard image High-resolution imageFigures 7a–7c show that unlike CO2, CO is evolved in significant quantities both in electrolytes with primarily linear carbonates (100% EMC, EC/EMC 1/9, and EC/DEC 1/9) as well as electrolytes with primarily EC (EC/EMC 9/1, EC/DEC 9/1). Thus, CO originates from both linear and cyclic carbonates, as well as possibly from non-solvent sources consistent in all cells. Electrolytes with EMC as a primary solvent show a significant increase in the quantity of CO evolved, showing that EMC is a definitive source of CO. Previous studies on battery gassing has also shown the generation of CO from EC 22,38,39 and DMC. 38
Figure 7a shows that in addition to CO, EMC + 0.5% VC also evolves methane and ethane. Methane and ethane are also seen in Fig. 7b when EMC is the primary solvent in a binary blend. In Fig. 7c, ethane is also seen when DEC is present in the electrolyte. When EC is the primary solvent, methane and ethane are low, leading to the conclusion that the alkane gases are produced by solely by the linear carbonates. A previous study has also shown that DEC degrades to form ethane. 39 This degradation mechanism producing alkane gases has been shown by computation to apply generally to linear carbonates. 40 These findings are consistent with our observations in this study.
From the binary and single solvent electrolyte studies, we conclude that EC is the sole source of CO2, significant amounts of ethane and methane are derived from EMC, and CO is produced in all cells with linear or cyclic carbonates. Considering the primary reduction of gas with OS3-A or OS3-B comes from the significant reduction of CO2 (Fig. 2b), and we have shown that CO2 is generated solely by EC, we conclude that these organosilicon nitriles inhibit EC decomposition to CO2.
Electrolyte recovery
In order to better understand the mechanism by which additives reduce gassing, we tracked the concentration of each additive in the electrolyte using NMR spectroscopy on electrolyte recovered from the cell after formation and after 60 °C storage. As described in more detail in the methods section, the electrolyte is extracted directly from the pouch cell. This method allows for electrolyte analysis from full-format pouch cells and therefore represents an accurate picture of the electrolyte after aging conditions.
Figure 8a shows the concentration (vol%) of OS3-A in the electrolyte as prepared, recovered from the cell after formation, and recovered from the cell after 4 weeks of 60 °C°C storage after charging to 4.35 V (same cells as the gassing data shown in Fig. 2). The concentrations of OS3-A in the fresh electrolyte closely matches the nominal volume percentages. After formation, OS3-A reduces to 70%–77% of the initial concentration. After high temperature storage, there is no further change in the concentration of OS3-A. By contrast, Fig. 8b shows that the concentration of VC in the electrolyte decreases almost to zero after formation (88%–100% consumption), and after 4 weeks of storage at 60 °C, VC is fully consumed. Therefore, the action of VC functions through its consumption (which we show occurs almost completely within formation). This is consistent with literature reports stating that VC is reductively polymerized on the anode during the first charge, 41,42 which has been shown to be a stable component of the SEI layer which reduces capacity fade. 43 By contrast, the OS3-A additive is not fully consumed during formation, and its action in reducing gas during high temperature storage is not a function of further consumption of OS3-A. These results lead us to three hypotheses for how OS3-A reduces gas: (1) protective surface films formed during formation; (2) a protective effect of the OS3-A remaining in solution, or (3) a combination of both OS3-A in the surface layer and in solution. The surface analysis data in the next section was used to help assess these hypotheses.

Figure 8. Concentration (volume %) of additives in electrolyte, fresh electrolyte (solid grey bars) and after extraction from Gr/NMC622 multi-layer pouch cells after formation (patterned grey bars) or 4 weeks of 60 °C storage after charging to 4.35 V (black solid and patterned bars), for (a) OS3-A and (b) VC measured by 1H-NMR The error bars represent the maximum and minimum values of two or more repeat measurements. Dashed lines show nominal concentration for each component as a visual reference. All electrolyte compositions by volume.
Download figure:
Standard image High-resolution imageAs Fig. 8a shows, the presence of 2.4% PS in addition to OS3-A does not affect the consumption of OS3-A. Figure 9 shows the PS concentration in fresh electrolytes and after 4 weeks of 60 °C storage. Like OS3-A, PS concentration in the electrolyte is reduced after high temperature storage but not completely consumed (unlike VC). However, unlike OS3-A, the consumption of PS is greater with addition of increasing OS3-A. Without OS3-A, there is a 0.7 vol% reduction in PS. With 3% OS3-A, there is a 1.5 vol% reduction in PS. These data, combined with the gas reduction benefit observed in Fig. 3, indicates that OS3-A shows an interesting beneficial synergy with PS. To better understand this synergy and the mechanism of individual additive consumption and effect on gassing, we performed surface analysis on the anodes and cathodes recovered from cells following 60 °C storage using XPS.
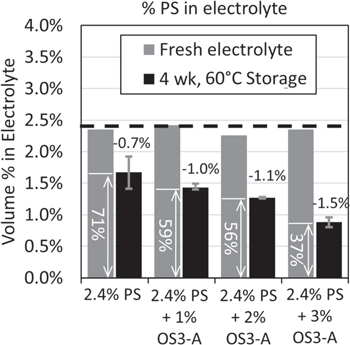
Figure 9. Concentration (volume %) of 1,3-propanesultone (PS) in fresh electrolyte (grey bars) and after extraction from 4.35 V Gr/NMC622 multi-layer pouch cells after 4 weeks of 60 °C storage (black bars) measured by 1H-NMR spectroscopy.
Download figure:
Standard image High-resolution imageSurface analysis
Surface analysis was performed on the Gr/NMC622 multi-layer pouch cells with control, OS3-A, and PS electrolytes after 60 °C storage after charging to 4.35 V in order to understand the effect of the gas-reducing additives (Figs. 2–3) on the surface layers of these batteries. The atomic composition of each electrode surface was determined from the survey spectra as described in the experimental section. OS3-A is the only species in these electrolytes that contains nitrogen or silicon, and therefore these element signals are used as indicators of the presence of OS3-A or related decomposition species in the surface layer. PS is the only species that contains sulfur within the electrolytes, and therefore an observed sulfur signal indicates PS or related decomposition species in the surface layer. The control electrolyte samples were analyzed to provide a background signal in these elements in case of trace impurities or contamination. The multiplex spectra for these samples are shown in Supporting Information Figs. S8–S10.
Figure 10 shows the percent atomic composition of nitrogen (Fig. 10a), silicon (Fig. 10b), and sulfur (Fig. 10c) for each electrolyte formulation. Figures S8–S10 in the Supporting Information show the individual element region XPS spectra for these samples. As Fig. 10a shows, there is significant nitrogen signal on both the anode and the cathode in all samples containing OS3-A, with or without 2.4% PS. Increasing OS3-A in the electrolyte increases the % nitrogen particularly on the cathode. Note that there is some nitrogen on the control electrodes due to contamination from an unknown source and it is unclear whether the % nitrogen on the anodes with OS3-A and 2.4% PS is statistically significant relative to this contamination. For all other samples, the nitrogen observed on samples containing OS3-A is significantly higher than the contamination levels (Fig. S8).
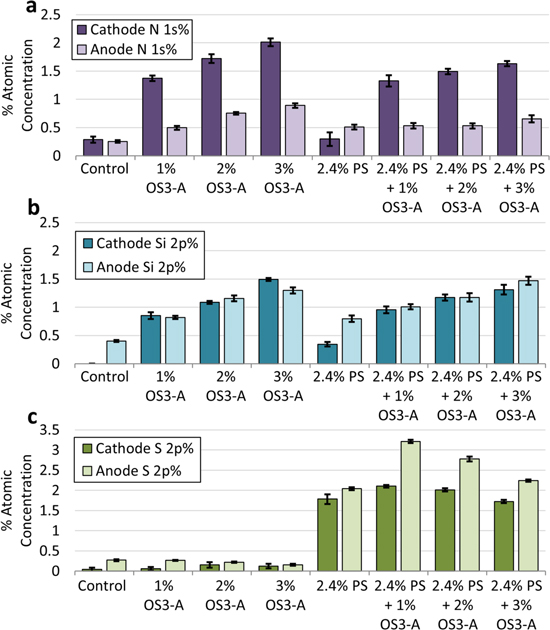
Figure 10. Surface atomic composition quantified by XPS of (a) nitrogen, (b) silicon, and (c) sulfur for cathodes (dark bars) and anodes (light bars) recovered from 4.35 V Gr/NMC622 multi-layer pouch cells after 4 weeks of storage at 60 °C for control (EC/DEC/EMC 1/1/1 + 1 M LiPF6), 1% OS3-A, 2% OS3-A, 3% OS3-A, 2.4% PS, 2.4% PS + 1% OS3-A, 2.4% PS + 2% OS3-A, and 2.4% PS + 3% OS3-A electrolytes. Error bars represent standard deviations of six measurements. All electrolyte composition by volume.
Download figure:
Standard image High-resolution imageFigure 10b shows that there is significant silicon signal on the anode and the cathode in the samples containing OS3-A, with or without 2.4% PS. In the case of silicon, the atomic % is similar on both the anode and the cathode. Together with the nitrogen data, this shows that OS3-A or its decomposition products are incorporated into the surface layers of both the anode and the cathode after 4 weeks of high temperature storage.
Analysis of the sulfur atomic % in Fig. 10c shows that the samples with 2.4% PS in the electrolyte have significant sulfur signal on both the anode and the cathode, indicating that, like OS3-A, the PS additive is incorporated into the surface layers of both electrodes. These results are consistent with previous reports of XPS on electrodes cycled with PS. 4,44,45
Proposed mechanism of gas reduction with OS additives
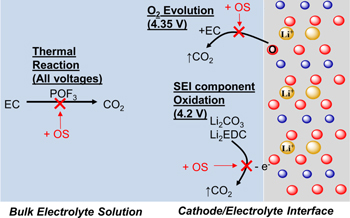
The study of the effect of voltage on gas generation during 60 °C storage in multi-layer Gr/NMC622 pouch cells (Fig. 6) shows that the OS3-A additive reduces CO2 gassing by up to 98% for all mechanisms, which includes bulk electrolyte EC thermal decomposition as well as reactivity at the electrode (Li2CO3 oxidation and EC oxidation by oxygen evolution). OS3-A reduces methane and CO by up to 40%, but only at voltages ≥ 4.2 V. The binary and single solvent study in Fig. 7 showed that CO2 is derived solely from EC, while CO is generated by both linear carbonates and EC, and methane comes primarily from EMC. Finally, XPS and NMR studies respectively showed that OS3-A is incorporated into the anode and cathode surfaces, while a significant portion (70%–77%) remains unreacted in the bulk electrolyte. Based on these observations, we propose that the organosilicon nitrile additives act in a bifunctional manner to stabilize the electrolyte against gassing during high temperature storage, through 1) forming a protective cathode surface layer and 2) protecting EC against thermal degradation in the bulk electrolyte solution. Figure 11 is a graphical summary of the proposed mechanisms of OS molecules in eliminating CO2 gassing at different storage voltages.
Figure 11. Graphical mechanisms proposed for organosilicon nitrile (OS) eliminating CO2 gassing during lithium-ion battery 60 °C storage.
Download figure:
Standard image High-resolution image
3% OS3-A or OS3-B eliminates 98% of CO2 during storage at or above the oxygen evolution voltage (4.35 V 23 ), indicating that the organosilicon additive has an effect at the cathode-electrolyte interface that either prevents oxygen evolution or inhibits its reaction with EC to form CO2. Just below the oxygen evolution voltage, at 4.2 V, the primary mechanism of CO2 evolution reported is the oxidation of unstable or soluble SEI components (Li2CO3 and LEDC) migrating from the anode to the cathode, 22,29,35,36 and OS3-A inhibits CO2 formation at this voltage as well. Considering the cathode-electrolyte interface effect of OS3-A at 4.35 V, we hypothesize that the effect at 4.2 V in reducing oxidation is also due to a similar effect. The XPS surface analysis showed that there is silicon and nitrogen incorporated into the cathode surface, providing evidence that OS3-A may be forming a protective surface layer on the cathode to inhibit these oxidation mechanisms that form CO2. Furthermore, greater volume % of the OS additive in the electrolyte increases both %N and %Si on the cathode (Figs. 10a and 10b), while simultaneously decreasing evolved CO2 (Fig. 2). These results are consistent with previous reports of nitriles stabilizing the cathode-electrolyte interface. 10–12,46
By contrast, 4.0 V is lower than the voltages reported for electrochemical mechanisms of CO2 evolution, therefore it is likely that the primary mechanism of CO2 generation here is through a thermally-driven reaction of EC with POF3 31 or PF5 47 as reported previously. OS3-A has been reported to protect PF6− against thermal decomposition to POF3 and other phosphate and fluorine products. 14,15 The NMR electrolyte recovery showed that there is a significant amount (70%–77%) of OS3-A remaining in the electrolyte bulk solution. We propose that the protection of PF6− by OS3-A against degradation is active during the high temperature storage experiments in this study, in addition to the inhibition of oxidation reactions occurring at the cathode-electrolyte interface at higher voltages. We postulate that together these mechanisms of OS additives provide exceptional reduction of CO2 relative to the control (up to 98%) in lithium-ion batteries.
The sultone additive PS may function in a similar mechanism as the OS additives to reduce gassing from Gr/NMC622 pouch cells during 60 °C storage, given the incorporation of sulfur into the anode and cathode surface layers (Fig. 10c), however, a much larger consumption of PS is needed to provide this benefit.
Conclusions
Studying gassing during high temperature storage, we found that two fluorinated organosilicon nitrile additives, OS3-A and OS3-B, can significantly reduce gassing compared to the control. All gas species are reduced by the addition of these OS additives, with the greatest reduction seen for CO2. Further studies with OS3-A demonstrated that gassing can be reduced further with increasing additive concentration, with 3% OS3-A causing a 61% total gas reduction relative to the control electrolyte, and a 98% reduction in CO2 alone. Combined with the known gas reducing additive 1,3-propanesultone, up to 66% gas reduction occurs, more than either additive individually, indicating a synergistic effect between these additives. Compared head-to-head with propanesultone and with succinonitrile, OS3-A had the highest activity (% gas reduction/molecule) of the three additives.
We also investigated the mechanisms driving gassing during battery high temperature storage, and the effect of OS3-A on these. By performing storage experiments at different voltages (4.35 V, 4.2 V, and 4.0 V), for cells with the control electrolyte we observed lower volumes of evolved CO2 with decreasing voltage in a manner consistent with different mechanisms previously described: primarily from EC reaction with oxygen evolved from NMC622 at 4.35 V, primarily oxidation of migrated SEI components at 4.2 V, or primarily bulk thermal-driven reactions of EC at 4.0 V. The mechanisms of OS3-A to significantly reduce CO2 were shown to be active on all CO2 generation mechanisms at these voltages. We show through binary and single-solvent studies that EC is the sole source of CO2 generation, and therefore the effect of OS3-A is to protect EC from decomposition mechanisms leading to CO2 formation. Surface analysis and NMR studies showed that OS3-A is not fully consumed through this protective function but is present both on the cathode surface and simultaneously in the bulk electrolyte solution. We propose a bifunctional mechanism of action for OS3-A, through inhibiting salt degradation in the electrolyte as well as providing a protective surface layer on the cathode. Overall, OS molecules show superior gassing reduction and this report enhances our understanding of OS molecules as additives for improving battery safety and performance with regard to lithium-ion battery electrolyte stability.
Acknowledgments
This work was supported by the Office of Naval Research Grant ONR N00014-19-C-1009. The authors gratefully acknowledge use of facilities and instrumentation at the UW-Madison Wisconsin Centers for Nanoscale Technology (wcnt.wisc.edu) partially supported by the NSF through the University of Wisconsin Materials Research Science and Engineering Center (DMR-1720415). A generous gift from Paul J. and Margaret M. Bender enabled the NMR spectrometer to be purchased.
Disclaimer
Any opinions, findings, and conclusions or recommendations expressed in this material are those of the author(s) and do not necessarily reflect the views of the Office of Naval Research.