
Abstract
In-situ synchrotron X-ray tomography has been used to observe the initiation and propagation of pits during atmospheric corrosion of aluminium alloy AA2024 under droplets of NaCl and simulated seawater at 21 ± 2 °C and a relative humidity of 85% over a period of 120 min. Each complete tomogram took 300 s to collect (pixel size 0.74 μm). Two metastable pits initiated at intermetallic particles, forming a crevice around the edge of the particles. Three other metastable pits formed at sites with no obvious micron-sized features. Only one pit, which had initiated under a fragment of debris, continued to stable growth. Metastable pits initiated sequentially, and all initiation events were accompanied by the formation of one or more bubbles, presumed to be hydrogen. Pit propagation was spatially non-uniform, with rapid growth in local regions while the remainder of the pit remained passive. The growth rate was highest parallel to the rolling direction of the plate. The highest local current density was estimated from the loss of metal between successive measurements to be ∼0.5 A cm−2. This is the first time that the transition from initiation to propagation of individual localised pits in an aluminium alloy has been characterised in situ.
Export citation and abstract BibTeX RIS

This is an open access article distributed under the terms of the Creative Commons Attribution 4.0 License (CC BY, http://creativecommons.org/licenses/by/4.0/), which permits unrestricted reuse of the work in any medium, provided the original work is properly cited.
Corrosion of aluminium airframe alloys such as AA2024 has been extensively studied in order to improve corrosion resistance and contribute to life prediction of aircraft components, 1,2 It is widely accepted that pit formation on AA2024 is most commonly associated with intermetallic particles, particularly S-phase (Al2CuMg) e.g. 3–5 Dealloying of the reactive Mg and Al components leaves behind a Cu-rich surface which has high cathodic reactivity, e.g. 4,6 Intermetallic particles can also provide a site where a crevice can form between the particle and the adjacent matrix 4,7,8
The alloys contains other micron-sized particles including AlCu, Al6(Fe, Mn), and (CuAl)y(Fe,Mn,Cu)xSi constituent particles which may also be sites at which localised corrosion can develop. 4,7,9 Smaller submicron (0.05–0.5 μm) particles such as Al20Cu2Mn and Al2(MnFe)3Si, 10 these are regarded as less electrochemically active and have not been considered a risk to pit initiation. 7,11 It has also been proposed that intermetallic particles may not be necessary for initiation of pits. Oxide films are not uniform and it has been proposed that pre-existing crystallographic flaws can also result in initiation. 12 Nanoscale voids have also been identified as nucleation sites for localised corrosion. 12,13
Pits in aluminium alloys such as AA2024 may develop into intergranular corrosion (IGC), 1,2 which can lead to stress corrosion cracking. Early work on IGC propagation was carried out using radiography techniques. 14,15 Developments in Synchrotron X-ray tomography have been used to investigate the growth of IGC for alloys AA2024 and AA7050 over time scales of 30–35 min and 4–12 h with a pixel size ≥ 1.3 μm, 1,2 observing the interactions of intergranular fissures with clusters of intermetallic particles and evolution of H2 bubbles during growth. It was clear that propagation of IGC was most rapid in the direction parallel to the plate rolling and long transverse direction. 1,2,16,17 IGC propagation has also been investigated for galvanic couples between AA7050 and stainless steel fasteners. 18,19 Eckermann et al. were able to observe the initiation and then propagation of "exfoliation-like attack" in AA6016 under a microcell, 20 but it was difficult to identify factors that influenced the transition to stable growth owing to the resolution of the images that were produced. Lower temporal and spatial resolution lab-based tomography has been utilised to observe corrosion over days and months. Kinetics on a 99.9% pure Al wire have been studied. Observations of corrosion were made at 1.5 μm pixel size and data collection took approximately 3.5 h. The growth acceleration of corrosion sites was found to be nonlinear and O2 reduction controlled. 21
The aim of this work is to visualise the early stages of the initiation and propagation of pits on AA2024 under atmospheric corrosion conditions including the nature of the interaction between growing pits and intermetallic particles as well as exploring inhomogeneity in pit propagation.
Experimental
A 10 mm AA2024-T3 plate was supplied by Future Metals UK (Table I).
Table I. Table of composition (Future Metals UK).
| Si | Fe | Cu | Mn | Mg | Zn | Cr | Ti | Others | |
|---|---|---|---|---|---|---|---|---|---|
| Cast Analysis Weight % | Max 0.5 | Max 0.5 | 3.8–4.9 | 0.3–0.9 | 1.2–1.8 | Max 0.25 | Max 0.01 | 0.15 | 0.02 |
Pin samples (1 mm diameter) for X-ray microtomography (XMT) measurements were machined from the middle of the plate, with their long axis parallel to the rolling direction as shown in Figure 1a.
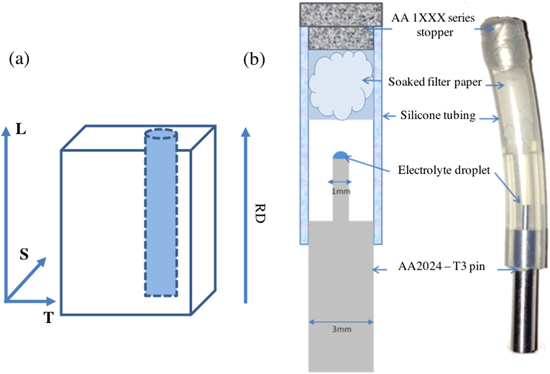
Figure 1. (a) The location of the machined pins relative to the AA2024-T3 plate rolling direction and longitudinal (RD, L), S = short transverse and T = long transverse. (b) the sample holder used for synchrotron tomography experiments, illustrating the cell used for maintaining relative humidity.
Download figure:
Standard image High-resolution imagePrior to each experiment the top surface of the pins were dry-polished with SiC paper. The samples were passed over P800 and P1200 grit (MetPrep Ltd.) for three unidirectional passes, then passed over P4000 grit for six unidirectional passes. Samples were then rinsed with methanol and left to passivate for one hour before applying a salt solution droplet.
Two solutions were used: NaCl (Sigma Aldrich) to make up a saturated NaCl solution (6.1 M), and substitute ocean water made according to ASTM standards (D 1141–98 (2013) 22 ), without the addition of trace NaF. An Eppendorf research plus microlitre pipette was used to deposit 0.2 μl ± 0.04 μl of the chosen solution on top of the polished pin surface giving a defined chloride deposition density (mass of chloride per unit area - CDD) as shown in Table II . Salt droplet, chloride deposition density (CDD) and relative humidity used for the two samples tested. Table II Saturated KCl provides an equilibrium relative humidity of 85.11 ± 0.29 at 20 °C. 23 The salt deposition densities and RH were selected to ensure the initiation of corrosion in the two hour scanning period. It should be noted that the time between the deposition of the droplet and the measurement may have been insufficient to allow the concentration of the droplet to equilibrate with the relative humidity within the cell at the beginning of the measurement.
Table II. Salt droplet, chloride deposition density (CDD) and relative humidity used for the two samples tested.
| Sample | Salt Droplet | CDD μg cm−2 | Relative humidity maintained by KCl |
|---|---|---|---|
| 1 | Ocean Water—ASTM standards (D 1141–98), without the addition of trace NaF. | ∼1400 | 85% |
| 2 | 6.1 M NaCl | ∼5400 | 85% |
X-ray tomography measurements were carried out at the TOMCAT beamline at the Swiss Light Source (SLS). 24 Pins were set up in cells, as shown in Figure 1b. These were constructed from silicone (Versilic) tubing containing filter paper soaked with saturated KCl with KCl crystals on top to control the relative humidity at 85%. 23 The containers were then sealed using a commercially pure aluminium stopper and petroleum tape. There was an interval of five minutes between the application of the droplet and the start of the first scan. The temperature of the experimental hutch was 21 ± 2 °C. Measurements were made with parallel beam, monochromatic X-rays at an energy of 21.9 keV selected by a double multi-layer monochromator. X-rays were directed perpendicular to the sample axes. The sample was placed 25 mm from the detector (PCO.2000, PCO AG, Kelheim, Germany), X-rays were then converted into visible light by a 20 μm LuAG scintillator. The corresponding images were magnified with a x10 lens onto the detector giving a pixel size of 0.74 μm. A series of radiographs (projections) were collected as the sample rotated through 180° about the vertical axis. 1201 projections were collected, each with a 160 ms total exposure time, flat field and dark field projections were taken for each scan, giving a data collection time of 300 s per complete tomogram. 160 ms per each 1201 projection, gave a 192 s data collection period. Raw projections (radiographs) were collected as.tif image files. Three dimensional tomograms were then reconstructed using a gridding method algorithm developed at TOMCAT. 25 ImageJ 26 and Fiji software 27 alongside Avizo FEI 8 (Windows 7, Enterprise 2009, Microsoft) were used for subsequent image processing.
Results
Initiation of pits
Figure 2 shows the initiation of a pit on Sample 1 (Table II- ocean water). The sample was scanned continuously, and data for a complete tomogram was accumulated at 5 min intervals, until the measurement ended at 45 min. Figure 2(i) shows a radiograph of the sample towards the beginning of the measurement (after 5 min) and both the droplet and pin can be observed. The bright outline of the droplet is a result of slight phase contrast enhancement. 28 Figure 2(ii) shows a vertical section through the reconstructed tomogram at 40 min into the experiment, 5 min before any corrosion can be detected. White intermetallic particles can be seen within the metal and a bubble, assumed to be H2, can be seen on the metal surface. Close inspection of the metal in the vicinity of the bubble on adjacent sections did not show any obvious corrosion at this time point. Figure 2(iii) shows the vertical section in which the first pit can be identified. The region of this corrosion pit is highlighted with a square. The area delineated by the red square is then shown at higher magnification in Figure 2(iv) at 35, 40 and 45 min, where the first pit can be observed at the centre of the red circle at 45 min. Looking at the same location at 35 and 40 min, no obvious microstructural feature can be seen to correlate with the initiation of the pit. Figure 2(v) shows a horizontal section parallel to the surface of the sample through the pit at the centre of the red circle. Again, no obvious microstructural features are observed at the initiation site in the images.
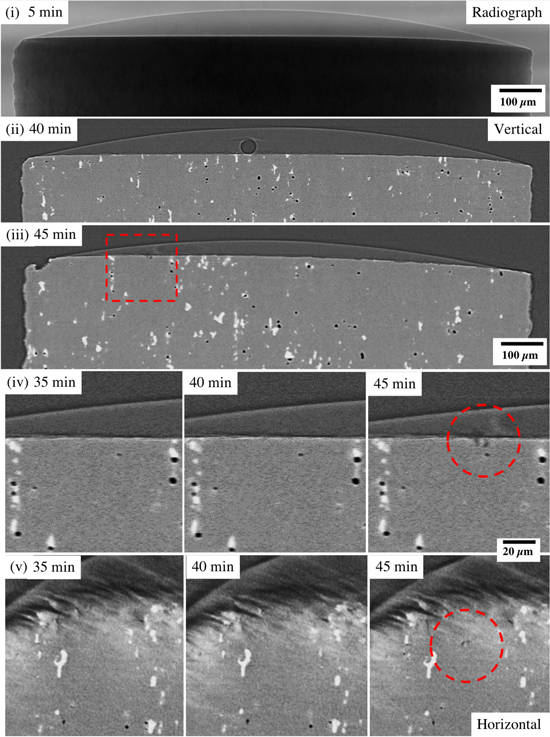
Figure 2. Evolution of corrosion on Sample 1 (substitute ocean water) with conditions shown in Table II: (1) radiograph at the start of the experiment, (ii) vertical section through the first sighting of H2 at 40 min, (iii) vertical section through the sample at the location of the first pit (within the red square) at 45 min, (iv) higher resolution image of the location of the pit in (ii) before initiation (35 and 40 min), and after initiation (45 min, red circles), and (v) horizontal sections of the tomograms shown in (iv).
Download figure:
Standard image High-resolution imageFigure 3 shows tomographic sections of the Sample 2 (Table II—NaCl) had developed five pits. Figure 3(i) shows a vertical section through the largest pit on the sample (above the red horizontal bar). A large bubble (assumed to be H2) can be seen within the droplet. The droplet is larger and higher than Sample 1 due to the difference in salt type and concentration, in relation to the RH. Figure 3(ii) shows a horizontal section through Figure 3(i). The horizontal slice shown cuts through all five pits that have initiated. The largest pit is indicated with a red arrow. The top surface of the pin was not completely horizontal, so the tomographic section cuts both metal and droplet (in which a smaller H2 bubble can be seen). Figure 3(iii) and 3(iv) show regions of Figure 3(ii) at higher magnification, showing cross sections of the five pits labelled A-E (D is the largest pit highlighted in (i) and (ii)).
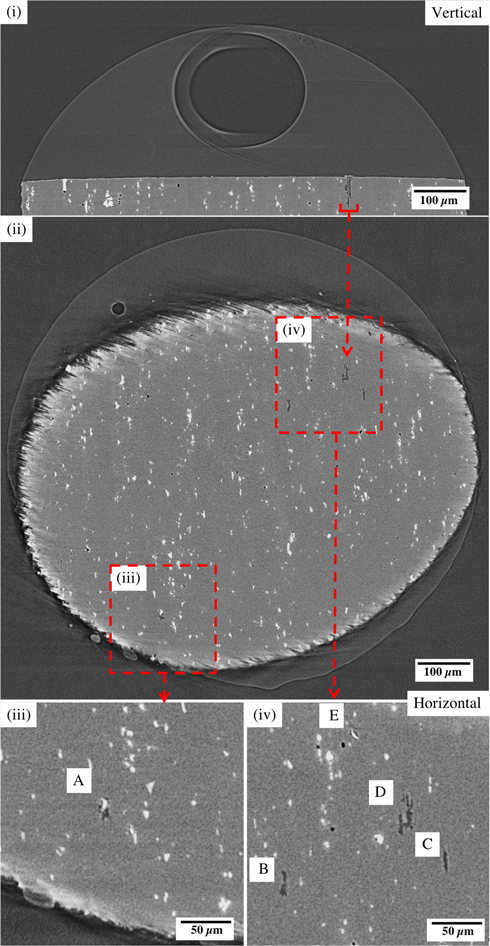
Figure 3. Sections of tomograms for Sample 2 (NaCl, see Table II) from the last 5 min of a 120 min measurement: (i) vertical section though the largest pit (above the red horizontal bar), (ii) horizontal section through all pits. (iii) and (iv) are higher resolution sections of the pits in (ii). Pits in (iii) and (iv) are labelled A-E.
Download figure:
Standard image High-resolution imageFigure 4 contains a series of vertical sections of tomograms from the NaCl sample showing the development of each of the pits identified in Figure 3. Each row in Figure 4 shows the development of an individual pit at the times indicated. For each pit, the first image shows the last image where no pit can be observed, and the second image shows the first sign of the pit. Every pit appears to initiate with the formation of one or more hydrogen bubbles, which are not evident in later images (with the exception of pit D). The hydrogen bubbles may detach and or dissolve into the solution once the pit ceases to grow. Yellow arrows have been used to highlight H2 bubbles and red arrows to show the movement in time between each pit and the next. It can be seen that the pits initiate sequentially, with A starting at 75 min, B at 80 min, C at 85 min and D at 90 min A, B and C can be considered metastable i.e. do not grow beyond the first 5 min measurement. For example, typical metastable pitting events on a high strength aluminium alloy have been observed to last for ∼5–10 s. 29 Pit D becomes stable and grows until 115 min with formation of multiple H2 bubbles, and then E initiates at 120 min.
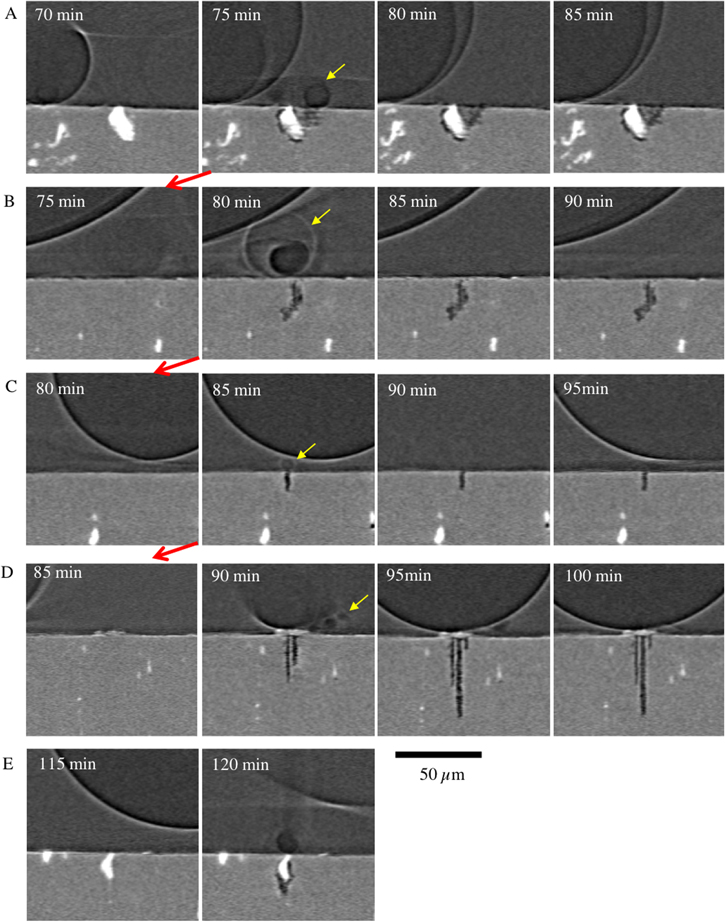
Figure 4. A series of tomograms of Sample 2 (Table II, Figure 3) collected at the times indicated. Each row A-E shows growth of an individual pit (See Figure 3). For each site, the second image in the series shows the first image where corrosion can be seen. Red arrows indicate the movement of time backwards at 5 min intervals to the scan before the initiation of each site.
Download figure:
Standard image High-resolution imageFigure 5 shows magnified tomograms of vertical sections of the single pit on Sample 1 (substitute ocean water) and the five pits on Sample 2 (NaCl) before (left image) and after (right image) initiation. In each case, a hydrogen bubble is found above the initiated pit (indicated with red broken lines). On the NaCl sample, two pits (A and E) have initiated at intermetallic particles with a clear indication of crevice formation between the particle and the matrix. Two other pits (B and C) on the NaCl sample and the pit on the substitute ocean water sample (ocean water) have initiated where there is no clearly visible heterogeneity (this was carefully checked by exploring the surrounding microstructure in 3D). Pit (D) initiated at the location of a deposit on the surface, which has provided an occluded site for a pit to initiate.
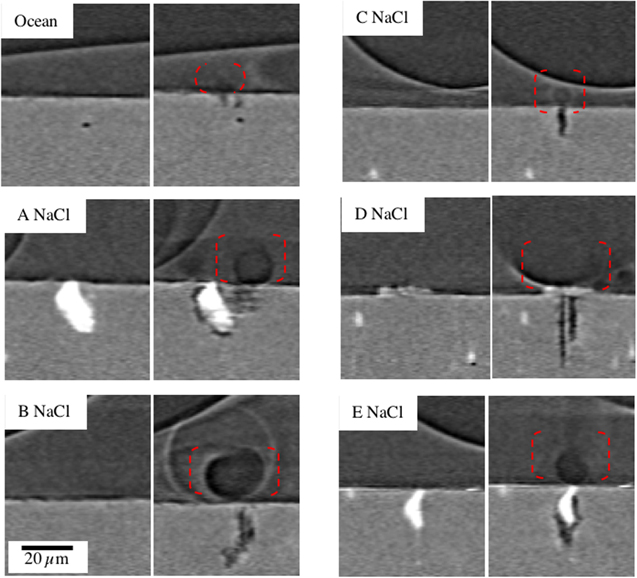
Figure 5. A series of tomogram sections from both samples 1 (Substitute ocean water) and 2 (NaCl) with conditions show in Table II. Samples were exposed at a temperature of 22 ± 2 °C. For each site, A vertical section is shown of the last tomogram before corrosion initiated and the first section showing corrosion.
Download figure:
Standard image High-resolution imagePropagation of pits
Figure 6 shows a series of tomographic sections of pit D (NaCl sample, Figure 3(iv)). The first row is a horizontal section near the top of pit D as a function of time. It can be seen that there is relatively little change in the width of the pit mouth from 100 min onwards. The last image is the horizontal section at 120 min: this image is shown at the beginning of each of rows b-d together with a red dotted line indicating the location of the vertical section shown in the row. Row (b) shows vertical sections through the initial pit mouth, where the debris forms a clear crevice and the perimeter of a hydrogen bubble is in contact with the crevice-former. A corrosion fissure can be seen propagating downwards from the crevice-former (parallel to the rolling direction of the plate, L), together with a secondary fissure that has its mouth in a different vertical section. In the plane of the section, the primary fissure grows between 90 and 95 min, but no further. The secondary fissure does not grow further in depth but becomes wider at 105 min Row (c) shows a vertical section away from the initiation point and surface debris. There is no corrosion in this section until 95 min and there is then substantial thickening at 100 min, but not after that. Row (d) is a vertical section parallel to the plane of the plate. Again, the growth is discontinuous, with substantial changes at 110 min Row (e) is a 3D rendering of the shape of the pit. At each time step, the additional corroded volume is indicated in a new colour. It can be seen that the propagation of the pit is highly inhomogeneous. It appears to take place via relatively localised bursts of dissolution followed by some local repassivation. It is notable that the mouth of the pit is passive, showing colours from earlier time steps. The growth initially takes place along the longitudinal direction, L, parallel to the rolling direction of the plate (shown in red and green). The second burst of growth occurs in the long transverse, T, while growth pauses in the L direction. In the following scan, the growth returns to the L direction (fuchsia) while the growth in the T direction then stops. This discontinuous growth is not seen in lower temporal resolution tomography. 1,2 The growth rates are slower in the short transverse (S) direction, which is consistent with previous tomographic work on intergranular corrosion. 1,2
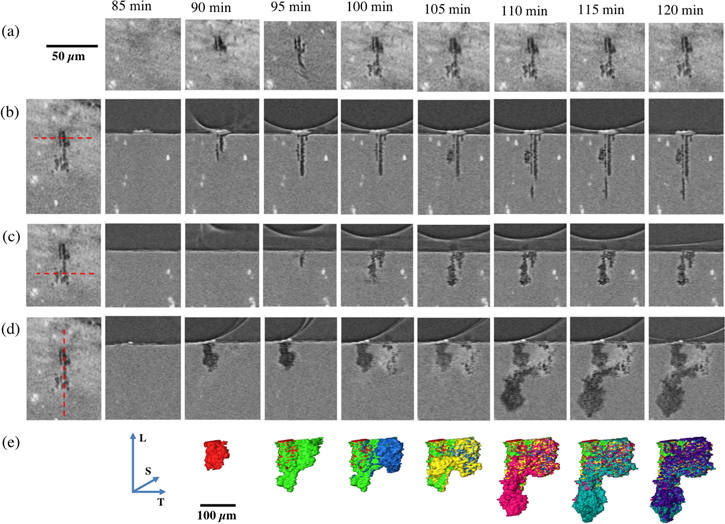
Figure 6. Pit D (Sample 2, NaCl) (a) horizontal sections of the pit at time intervals shown. The first image of rows (b)-(d) is a copy of last image in row (a), with a red broken line showing the location of the vertical section for that row; (b)–(d) show time series of vertical sections at the location indicated in the first column (broken red line); Row (e) shows volume renderings of pit D at the times indicated at the top of each column. Each colour change reveals the addition of metal loss at each time interval. L S and T directions are shown by blue arrows.
Download figure:
Standard image High-resolution imageFigure 7 shows the growth of the five pits in Sample 2 (NaCl). Figure 7(i) shows the depth of the deepest fissure (parallel to the axis of the sample, i.e. L, the rolling direction). It again appears that there is growth in depth of only one pit at any one time. Figure 7(ii) shows the growth in the width of the pit mouth parallel to the short transverse direction (S). There does not appear to be any change in the width of any pit mouth following the initiation of the pit, suggesting that repassivation may have taken place at the pit mouth. Figure 7(iii) shows the volume of each pit as a function of time. For pits A-D, it is clear that only one pit is active at any one time. However, the largest pit, D, continues to increase in volume at the same time that pit E initiates. This may be because E is located near pit D (∼100 μm away) and so there may be local acidification. Pit E also has an easy (highly occluded) path for dissolution along the perimeter of the intermetallic particle.
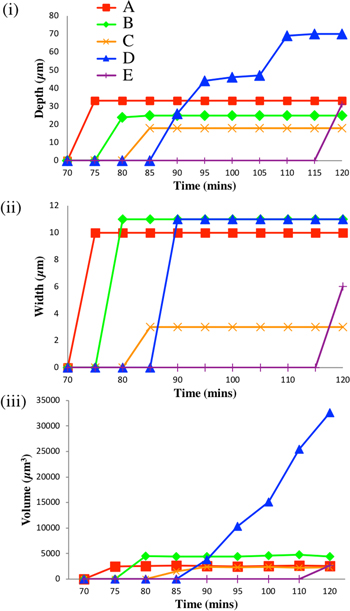
Figure 7. Growth parameters as a function of time for pits A-E (Sample 2, NaCl): (i) depth of the deepest fissure relative to the metal surface (L, parallel to plate rolling direction); against time, (ii) growth of the pit mouth in the short transverse direction (S), and (iii) pit volume.
Download figure:
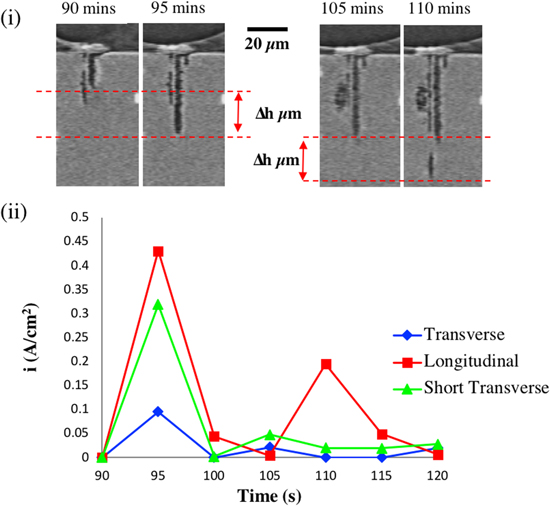
Standard image High-resolution imageFigure 8 compares the maximum dissolution rates of fissures in the L, T and S directions for pit D. For each time step, every vertical section that intersected the pit (for LS, ST and LT planes) was examined for the beginning and end of the interval. For example, Figure 8(i) shows one of the L S vertical sections after 90 and 95 min, and again at 105 and 110 min. For each section in each orientation, the greatest growth of the fissure was measured, and the largest value for that fissure was noted. The maximum fissure growth in each of the three directions at each time interval was converted to a current density using Faraday's Law and assuming that the metal is pure Al. This is a minimum dissolution current density as it assumes that the dissolution rate is constant throughout the 300 s data collection time. The current density will be higher if dissolution takes place in shorter bursts. As noted above, metastable pits may have a duration of ∼5–10 s. 29 It can be seen that in all three directions, the highest dissolution rate occurs during pit initiation, and is more rapid in the L and T directions. The L direction shows the highest dissolution rate once the pit is propagating. Other tomographic studies have not had high enough temporal resolution to measure current density. 1
Figure 8. Maximum measured fissure growth parallel to the three perpendicular directions L (longitudinal), S (short transverse), and T (transverse) as a function of time for Pit D (NaCl); (i) illustrates the method for evaluating growth in the LS section with the maximum fissure growth at the times indicated; (ii) maximum fissure growth in each direction as a function of time converted to an estimated minimum average local current density (ii) using Faraday's Law (assuming pure Al) and assuming continuous growth of the fissure during the 5 min measurement.
Download figure:
Standard image High-resolution image
Discussion
From observations in Figure 2, 4 and 5, it can be seen that the pit initiation process is very rapid, with a burst of dissolution generating electrons that lead to rapid reduction of water forming one or more hydrogen bubbles. In order to evaluate the contribution of hydrogen evolution to metastable pit growth, the volume of the pit was determined from the tomogram and converted to the equivalent size of bubble that would be formed if hydrogen evolution was the only cathodic reaction. In all cases the volume of the bubble observed was substantially smaller than the value required to grow the pit (<4%), so even if there was some loss of bubble volume as a result of dissolution of hydrogen into the solution, it is likely that reduction of water is not the only cathodic charge transfer process taking place, for example discharge of the double layer and oxygen reduction towards the perimeter of droplets.
This limited observational study showed a range of initiation sites for metastable pits. In Figure 5 two of the six showed "classical" sites where a crevice grew rapidly between along the perimeter of micron-sized intermetallic particles. Another formed under an unidentified piece of debris that clearly provided an occluded site that favoured dissolution. However, the other three formed at site with no micron-sized features. Given the pixel size used in this work (0.74 μm), it is not possible to rule out sub-micron microstructural features such as dispersoid particles, small fragments of debris, or features of oxide films. Observation of the single pit on the ocean water sample showed similar behaviour to the initiation events on the NaCl sample. Atmospheric corrosion of aluminium alloys has been shown to have different behaviour in ocean water than that of NaCl. While there are differences in the propagation, the initiation of the pit showed very similar initiation behaviour. 30
For a metastable pit to propagate, the rate of metal ion production in the cavity must be high enough to maintain the concentrated acidic pit chemistry given the rate of escape of metal ions out of the cavity. 31 The rate of dissolution increases with interfacial potential, and the rate of diffusion out of the cavity decreases with its depth. It is notable that metastable pits A-D initiated sequentially. It may be that the drop in potential associated with an initiation event lowers the probability of the next one initiating until the interfacial potential rises again to increase the rate of metal ion production within the pit. 32 The only case where two sites were increasing in volume at the same time was the last measurement in which pit D was propagating and pit E was initiated. Pit D was the only metastable pit that was able to propagate, and this may well have been favoured by the occluded site provided by the surface debris, which helped to limit diffusion of metal ions out of the growing pit. 32 Pit E was able to grow rapidly in depth along the perimeter of the intermetallic particle. It may also be that this tight crevice geometry facilitated rapid propagation by limiting diffusion of metal ions out of the pit despite a lower interfacial potential near Pit D. As noted above, it may also be the case that the cluster of pits B-E in an area of ∼200 × 200 μm may have also led to local acidification, further favouring dissolution over passivation.
Pit D was the only one in this study to propagate for any length of time. The growth was highly inhomogeneous, with some areas growing at high rates, with adjacent passive areas. This behaviour is well known for aluminium both from the work of both Frankel on the propagation of pits in 2D Al thin films, 33 and also the phenomenon of tunnel etching of aluminium, where (100) faceted pits propagate from the bottom of the pit with passive walls. 34 The close proximity of active and passive regions in the pit D show high levels of instability. Similar concurrent growth of IGC along both L and LT directions has been observed both with tomography 1 and radiography 14,15 The current study has shown slightly higher growth in the L and LT directions; however growth is highly discontinuous at the microscopic scale.
In AA2024, the alloy microstructure plays a major role in corrosion morphology. The alloy may be particularly susceptible to intergranular corrosion (IGC) if heat treatment, leads to copper depletion in the matrix adjacent to grain boundaries. The microstructure of rolled plate has elongated grains parallel to the rolling direction, L, favouring a high rate of intergranular corrosion in the L direction. 2 As shown above, the greatest rate of fissure propagation was found in the L direction, and it is likely that the fissures are propagating along grain boundaries (IGC). The greatest current density for this pit was ∼0.5 A cm−2. As noted above, this value assumes continuous steady growth of the fissure over 300 s, and could be substantially higher if the dissolution took place over a significantly shorter time. For example the work of Gupta et al. indicated that typical metastable pits in high strength Al aluminium alloys are 5–10 s in duration 29 . If the initial growth of Pit D had taken place over 5–10 s, the current density would have been in the range of ∼15–30 A cm−2. This is consistent with the current densities observed in Frankel's 2D pit work on thin film Al, which are in the range of 18–30 A cm−2 33 as well as foil penetration measurements of IGC, which gave current densities 0.5–10 A cm−2 35 .
The in situ observational study described in this paper highlights the factors that lead to initiation and inhomogeneous propagation of pits in AA2024 under atmospheric corrosion conditions.
Conclusions
This in situ synchrotron X-ray tomography observational study of the initiation and growth of localised pits during atmospheric corrosion of aluminium alloy AA2024 has shown the following features:
- 1.Pit initiation is a relatively rapid process temporal and spatial resolution of this method was high enough to capture the initiation of multiple metastable sites before one site continued to propagate.
- 2.Pit initiation can take place at intermetallic particles, forming narrow crevices around the periphery of the particle. However, occlusion of metastable pits is important for pit propagation, and this can also be provided by debris on the surface. Initiation of metastable pits is also possible at sub-micron features that could not be observed at the resolution shown in the current study.
- 3.NaCl and substitute ocean water samples saw similar pit initiation behaviour, with sites in both electrolytes initiating concurrently with a H2 bubble.
- 4.It appears that only one metastable pit can grow at any one time, and this may be associated with a drop in interfacial potential associated with pit initiation. However, one metastable pit that developed a deep crevice around the perimeter of an intermetallic particle was able to initiate while a stable pit continued to propagate. The two pits were ∼200 μm apart, so the local solution pH may have been lowered by propagation of the growing pit.
- 5.The growth parallel to the rolling direction of the plate (L) and LT was significantly greater than the S directions.
- 6.The maximum current density of dissolution along the L direction was estimated to ∼0.5 A cm−2. However, the true rate is likely to be substantially higher as the calculation was based on the assumption that the loss of material took place over the 300 s data collection interval.
- 7.The largest pit propagated in a highly inhomogeneous manner, with a small fraction of the surface active at any one time, and the remainder passive. Interior being passive with local growth activity shown with bursts of dissolution, which may be as high as 30 A cm−2.
Acknowledgments
Sarah J M Glanvill was funded by the School of Metallurgy and Materials (University of Birmingham, UK) and Diamond Light Source, Ltd. We acknowledge the Swiss Light Source for time on TOMCAT and would like to thank Dr Peter Modregger and Professor Marco Stampanoni for their support and assistance at the beamline.