
Abstract
There is growing interest in the development of Li-metal-based solid state batteries, driven by their promise in improving the energy density to satisfy electric vehicle requirements. In this contribution, we examine the status of Solid polymer electrolytes (SPEs) based solid state batteries for electric vehicle applications using a continuum scale mathematical model. We examine LiFePO4 (LFP) cathode/lithium metal anode batteries containing three different electrolytes, namely (1) a liquid electrolyte, (2) the polystyrene-b-poly(ethylene oxide) (SEO) block copolymer electrolyte, and (3) a single-ion conducting (SIC) block copolymer electrolyte, with the liquid electrolyte serving as the baseline for the comparison. By using an optimization procedure, we assemble "virtual" batteries to identify the optimal design that maximizes energy density while allowing the power requirements of electric vehicles (EVs) to be satisfied. Results show the present status of different SPEs are still below what is considered acceptable and further improvements are needed to achieve electric vehicle targets. The optimization studies conducted here show that for low transference number electrolytes (∼0.2) the conductivity target is 5 × 10⁻³ S cm−1, while for a unity transference number electrolyte this target decreases to 4 × 10⁻⁴ S cm−1. These targets provide guidance for polymer synthesis researchers to develop better polymers for use in EVs.
Export citation and abstract BibTeX RIS
List of Symbols

| specific surface area of active material, 1 m−1 |
| b | Bruggeman coefficient |

| lithium concentration, mol m−3 (i = 1, 2) |

| diffusion coefficient, m2 s−1 (i = 1, 2) |

| Faraday's constant, 96485 C mol−1 |

| mean molar activity of the salt |

| exchange current density at the surface of active material, A m−2 |
| iapp | applied current density, A m−2 |

| local current density by redox reaction at surface of active material, A m−2 |

| rate constant of redox reaction at surface of active material, (A m−2)/(C mol−1)/(mol m−3)1.5 |

| thickness, m (i = pos, sep) |

| universal gas constant, 8.314 J/(mol K) |
| r | radial position in the1D spherical particle domain, m |

| radius of active material, m |

| absolute temperature, K |
| t | time, s |

| lithium-ion transference number with respect to solvent velocity |

| open-circuit voltage, (V) |

| distance from current collector/cathode interface, m |

| the number of cations into which the salt dissociates, 1 |

| charge number of cation, 1 |
| Greek | |

| anodic and cathodic transfer coefficients, 0.5 |

| volume fraction of electrolyte phase |

| volume fraction of solid phase at cathode |

| volume fraction of AB, PVDF at cathode |

| ionic conductivity, S m−1 |

| electronic conductivity, S m−1 |

| electrical potential, V (i = 1, 2) |
| Subscripts | |
| eff | effective value |
| max | maximum |
| pos | positive electrode |
| sep | separator |
| 1 | solid phase |
| 2 | electrolyte phase |
As the market for EVs expands, numerous researchers and companies are focusing on the use of lithium metal anodes, which can enable the higher energy densities required to extend the driving range of EVs and decrease lower cost. 1 However, the implementation of lithium metal anode batteries has been hindered by several safety issues that emerge from lithium dendrite growth in flammable liquid electrolytes. SPEs have been studied as one of the promising candidates for use in lithium metal batteries because of the advantages of their nonflammability and relatively higher mechanical properties as compared to liquid electrolytes. 2,3 In general, for all-solid-state battery application, the solid polymer electrolyte should inherently possess good ionic conductivity (>10−4 S cm−1); a high transference number; high chemical, thermal, and electrochemical stabilities; and good mechanical strength. However, compared to existing batteries based on liquid electrolytes, SPEs currently have several limitations, such as low ionic conductivity under room-temperature conditions, which can significantly hinder its application in EVs. Hence, research on next-generation SPEs is being conducted to improve their transport properties.
There have been attempts to use the polymer electrolyte as a separator in a battery cell using a lithium metal anode and a metal oxide cathode. After the discovery of poly(ethylene oxide) (PEO) in 1973, 4 PEO polymer electrolyte was demonstrated with lithium salt and it was shown to possess relatively good ionic conductivity compared to other polymers. 5,6 Because the PEO polymer is predominantly crystalline at room temperature, the PEO polymer electrolyte requires a high operating temperature (above 60 °C) where ion transport is appreciable. However, at these temperatures, the PEO polymer does not possess sufficient mechanical strength to prevent lithium dendrite growth, so it is not suitable for application as the SPE. 7
To overcome the poor mechanical properties of conventional polymer electrolytes, block copolymer electrolytes (BCEs) with the ion-conducting "soft" phase and the non-conducting "hard" phase have been proposed. Several groups has demonstrated good performance of solid-state lithium metal cells based on BCEs. 8–13 One of the representative BCEs is the polystyrene-b-poly (ethylene oxide) (SEO) block polymer, which is made of the hard-glassy material, polystyrene, as the non-conducting phase. 14–16 The reported SEO polymer electrolyte can achieve better mechanical properties while maintaining high ionic conductivity on the order of 10−3 S cm−1 at 80 °C, but with a lower transference number. Typically, a low transference number can lead to ion concentration gradients that can result in limiting the applied current density. 17 Bouchet et al. 3 reported on the synthesis of a new single ion conducting (SIC) polymer electrolyte based on anionic BAB triblock copolymers and showed good performance with the solid-state lithium metal cells. The SIC polymer electrolyte tethers the anion to the block copolymer so that only the cation moves, with the result that the transference number can be made to be close to 1. Thus, this SIC polymer electrolyte showed a high transference number, as well as mechanical and thermal stability. However, its low ion conductivity compared to the other SPEs still remains a challenge.
While evaluating SPE's for batteries have been a focus past studies, 18–21 with the significant progress in properties the last decade, there is renewed interest in these materials. We, along with other research groups, have been evaluating the ability of these systems to prevent dendrites taking into consideration mechanical properties of the SPE's and lithium metal, linked to the transport properties. These simulations have shed light on the requirements for SPE's to prevent dendritic growth. While dendrite prevention remains an important challenge, Li-metal/SPE/cathode systems will also need to satisfy the power requirements for EV's and be able to achieve energy densities that are better than today's Li-ion systems. This paper is aimed at complementing the mechanical property targets with targets for ionic properties to ensure that SPE's have all the requirements needed for commercialization.
With this in mind, the first objective of this contribution is to evaluate the present status of state-of-the-art SPE's for EVs by comparing their performance to that of liquid electrolytes, the presently used electrolyte, using Li metal anode and lithium iron phosphate (LiFePO4) cathode. LiFePO4 was chosen because of the oxidative stability issues with SPE's. We choose to use the liquid electrolyte system as the baseline because of the attempts being made to develop additives to planarize Li plating. 22,23 A second objective of the paper is to establish targets for SPE's in order to make the performance of Li-metal/SPE/LiFePO4 all solid-state batteries comparable to equivalent liquid electrolyte batteries. We achieve these two objectives by developing a mathematical model for Li-metal based SPEs (both with low and unity transference number) and verify the model's applicability with experimental data. This model is then used to optimize the design (volume fraction of the different phases and thickness) to maximize the energy density while simultaneously allowing the power density requirements for EVs are satisfied. This approach mimics the experimental protocol that would be used by battery makers, while rapidly allowing comparisons without time-consuming electrode preparation and testing. The theoretical approach presented here also allows us to perform simulations to determine the material requirements needed to ensure that SPE's achieve performance comparable to that of liquid electrolytes.
Simulations suggest that the LiFePO4/SEO/Li cell can achieve 73% of the energy density of a LiFePO4/liquid-electrolyte/Li cell, while the LiFePO4/SIC/Li cell achieves 67% of the energy density. The optimization studies conducted here show for that for low transference number electrolytes (∼0.2) the conductivity needed to achieve liquid-like performance is 5 × 10⁻³ S cm−1 while for a unity transference number electrolyte this target decreases to 4 × 10⁻⁴ S cm−1. These targets provide guidance for polymer synthesis researchers to develop better polymers for use in EVs.
Model Description
In this work, we have modeled three lithium metal anode batteries with different electrolytes: the liquid electrolyte, the SEO polymer electrolyte, and the SIC polymer electrolyte. Figure 1 shows a schematic of lithium metal batteries consisting of the LFP cathode, lithium metal anode, separator, Al current collector, and Cu current collector. Note that liquid electrolytes based in lithium metal batteries are the same as conventional lithium-ion batteries, except that the negative electrode uses lithium metal. In the case of the SPEs-based cells, a block copolymer consisting of the conducting phase and non-conducting phase is used as the separator, so the cathode electrode has three phases including the solid phase of the active material. The content of the conducting phase component, such as the PEO polymer, is related to the ionic conductivity because it determines the tortuosity of the lithium-ion path. In addition, the mechanical strength of SPEs depends on the amount of the non-conducting phase. Note that we did not consider the effect of the ratio of the conducting phase to the non-conducting phase for SPEs. In this work, we used the given transport properties of each SPEs without adjusting, as presented in the literature. 3,10,24

Figure 1. Schematic of an all-solid-state battery with lithium metal used in this study. For the SPEs-based cells, the cathode composite electrode consists of carbon-coated LiFePO4 in SPE. The Li-metal is used as an anode electrode. Each SPE is used as a separator, that is, to separate the cathode composite electrode and the Li-metal anode. Please note that there is a separator with a porosity of 0.46 in the case of a liquid electrolyte-based cell.
Download figure:
Standard image High-resolution imageWe adopted a well-known physics-based model developed by Newman and coworkers to capture the behavior of the battery. 18,19,25–27 This model can describe the microscopic to mesoscopic-scale physics based on the concentrated-solution theory, modified Ohm's law, porous-electrode theory, and intercalation kinetics, concentrated-solution theory is used to calculate the transient concentration profile of lithium-ion in the electrolyte. To obtain the transient ionic potential in the electrolyte, we used the modified Ohm's law that includes the potential driven by migration and diffusion effects. Fick's second law is used to solve the lithium diffusion in the active particle material. The generalized Ohm's law is used to solve the solid phase potential across the positive electrode. Then, the rate for electrochemical reaction at the active particle surface is described by the Butler-Volmer equation. Model equations used in this study are summarized in Table I; additional details of the model are described in the literature. 28–31 We make use of the following assumptions in applying this model: all of the cells' electrodes are based on carbon-coated LiFePO4 active particles to enhance their electric conductivity. In general, LiFePO4 has been reported to undergo phase separation during Li insertion/extraction and several models have been proposed to address phase transition behavior in this material. 32–36 While the present work does not take phase change into consideration, in order to keep the calculation simple, we refer the reader to papers in the literature, including the work by the Bazant group on generalized the phase-field models. 37–40 In addition, we neglect heat generation in the cells.
Table I. Summary of governing Eq. 1 through (6).
| Governing equations | Boundary conditions | |
|---|---|---|
| Mass balance in the solid phase |
 (1) (1) |

|

| ||
| Mass balance in the electrolyte phase |
 (2), (2), 
|
|
 (for liquid electrolyte) (for liquid electrolyte) |
| |
| (i = pos or sep) | ||
| Charge balance in the solid phase |
 (3) (3) |
|

|
| |

|

| |
| Charge balance in the electrolyte phase |
 (4) (4) |

|
 (i = pos or sep) (i = pos or sep) |
![${i}_{0,Li}\left[\exp \left(-\displaystyle \frac{{\alpha }_{a}F}{RT}\left({\phi }_{2}\right)\right)-\exp \left(\displaystyle \frac{{\alpha }_{c}F}{RT}\left({\phi }_{2}\right)\right)\right]$](https://content.cld.iop.org/journals/1945-7111/167/13/130520/revision4/jesabb70bieqn43.gif)
| |
| Current balance |
 (5) (5) | |
| Reaction rate by Butler—Volmer equation |
![${i}_{n}={i}_{0}\left[\exp \left(\displaystyle \frac{{\alpha }_{a}F}{RT}\left({\phi }_{1}-{\phi }_{2}-U\right)\right)-\exp \left(-\displaystyle \frac{{\alpha }_{c}F}{RT}\left({\phi }_{1}-{\phi }_{2}-U\right)\right)\right]$](https://content.cld.iop.org/journals/1945-7111/167/13/130520/revision4/jesabb70bieqn45.gif) (6) (6) | |

| ||
We performed model calibration for three cells using the experimental data and the cell properties' values presented in the literature. 3,10,24,29,30 A LiFePO4/liquid-electrolyte/Li cell was set at 1,000 mol m−3 of the initial salt concentration, with a transference number of 0.363 as a constant and an operating temperature of 25 °C. In this cell, a separator with a porosity of 0.46 is placed between the two electrodes, and the liquid electrolyte is filled.
For the LiFePO4/SEO/Li cell, the composite electrode was 70 wt% LiFePO4, 25 wt% SEO polymer electrolyte with LiTFSI salt (1,660 mol m−3), and 5 wt% carbon black. The operating temperature was set to 90 °C. All transport properties—transference number, thermodynamic factor, ionic diffusion coefficient, and ionic conductivity—were as a function of the salt concentration were taken from the literature. 17,24 According to recent literature, there is a great deal of controversy about the transference number of the SPEs. The Bruce–Vincent method 41,42 of determining the transference number by using the steady-state current experiment has been the most commonly used. The transference number obtained by using this method always has a positive value. Pesko et al. 43 have proposed a new method for obtaining transference numbers based on the Newman theory, 28 which, in turn, is based on concentrated-solution theory. They found that the transference numbers obtained by the Newman theory for both the PEO and SEO polymer electrolytes have a negative value at a specific concentration of salt; as a result, they argued that the negative transference number indicates the presence of an ion cluster with negatively charged triplets. Very recently, Rosenwinkel and Schönhoff 44 obtained the transference number of the PEO polymer electrolyte with LiTFSI salt by e-NMR (nuclear magnetic resonance) and showed that this value is similar to that obtained by the Bruce–Vincent method. It has not been clearly verified which transference number is correct for polymer electrolytes. Thus, to avoid confusion, the simulations for this study were carried out by using both the transference numbers obtained from the Bruce–Vincent method and Newman's approach to SEO polymer-based cells.
For the LiFePO4/SIC/Li cell, the formulation of the composite cathode was 60 wt% LiFePO4, 32 wt% SIC, and 8 wt% carbon black. The cathode electrode is 70  thick and has a porosity of 31.8%. The value we used for the ionic conductivity of the SIC polymer electrolyte was about 1.8e-5 S cm−1 at an operating temperature of 80 °C. The transference number was set to 1, which means that there is no gradient of salt concentration in the electrolyte during operation. Therefore, the LiFePO4/SIC/Li cell does not solve the concentration profile in Eq. 2 in Table I. The temperature dependence of the solid diffusion coefficient is considered using the Arrhenius relation at the activation energy of 26 kJ mol−1 45
and reference temperature of 25 °C (298.15 K).
thick and has a porosity of 31.8%. The value we used for the ionic conductivity of the SIC polymer electrolyte was about 1.8e-5 S cm−1 at an operating temperature of 80 °C. The transference number was set to 1, which means that there is no gradient of salt concentration in the electrolyte during operation. Therefore, the LiFePO4/SIC/Li cell does not solve the concentration profile in Eq. 2 in Table I. The temperature dependence of the solid diffusion coefficient is considered using the Arrhenius relation at the activation energy of 26 kJ mol−1 45
and reference temperature of 25 °C (298.15 K).
For three cells, all effective diffusivity and conductivity were determined by using the Bruggeman equation to connect the porosity to the tortuosity, as presented in Table I. The model was fit to experimental data in order to estimate the Bruggeman coefficient. For the LiFePO4/SIC/Li cell an exponent of 1.0 yielded the best fit to the data. The other specification parameters or operating conditions are presented in Table II.
Table II. List of model parameters for calibration.
| Parameters | Liquid electrolyte cell | SEO polymer-based cell | SIC polymer-based cell |
|---|---|---|---|
Electrode thickness, 

| 70 29,30 | 17 10 | 70 3 |
Separator thickness, 

| 675 29,30 | 34 10 | 70 3 |
Active material radius, 

| 36.5 29,30 | 72ad | 36.5ad |
Positive paste electric conductivity,  (S m−1) (S m−1) | 10 46 | 10 46 | 10 46 |
Solid diffusion coefficient,  (m2 s−1) (m2 s−1) | 4.5e-19ad | 4.5e-19ad | 4.5e-19ad |
Activation energy for solid diffusion coefficient,  (kJ mol−1) (kJ mol−1) | 26 45 | 26 45 | 26 45 |
| Bruggeman coefficient, b | 1.5 | 1.5 | 1.0 |
| Concentration solid maximum (mol m−3) | 22806 | 22806 | 22806 |
Transference number, 
| 0.363 | Refs. 17, 24 | 1.0 |
Electrolyte ionic conductivity,  (S m−1) (S m−1) | Ref. 47 | Refs. 17, 24 | 1.8e−3 3 |
Electrolyte diffusion coefficient,  (m2 s−1) (m2 s−1) | 3.0e-10 48 | Refs. 17, 24 | n/a |
Initial salt concentration,  (mol m−3) (mol m−3) | 1000 29,30 | 1660 10 | n/a |
Kinetic reaction rate constant in positive electrode, 
| 1.0e-12ad | 5.0e-13ad | 2.0e-13ad |
Exchange current at the anode interface,  (A m−2) (A m−2) | 19.0 29 | 5.5 31 | 5.5 31 |
Electrolyte volume fraction at separator, 
| 0.6 29,30 | 1 10 | 1 3 |
Electrolyte volume fraction at cathode, 
| 0.572 29,30 | 0.456 10 | 0.318 3 |
Volume fraction AB, PVDF at cathode, 
| 0 | 0.068 10 | 0.496 3 |
| Density of LiFePO4 | 3600 | ||
| Molecular weight of LiFePO4 | 157.57 | ||
| Faraday's constant, F(C mol−1) | 96487 | ||
| Gas constant, R (J/(mol K)) | 8.314 | ||
| Temperature, T (°C) | 25 29,30 | 90 10 | 80 3 |
Note: ad adjusted; n/a: not available.
Figure 2 shows the comparisons of the experimental data with the model results for the three cells during constant current discharge. The diffusion coefficient in the solid phase and kinetic reaction rate constant were determined by fitting to the experimental data. Even though we did not apply the model describing the two phases in the active particle, the model results for the three cells match well with the experimental data. Here, Fig. 2b shows the results of using the transference number obtained by the Bruce-Vincent method. Note that similar results were obtained when using the Newman method transference number as shown in Fig. A·1 in the Appendix, which means that the transference number does not significantly affect any limitation in lithium transport because of its thin electrode thickness of 17  m.
m.

Figure 2. Comparisons between the model results and the experimental data for: (a) the LiFePO4/liquid-electrolyte/Li cell, (b) the LiFePO4/SEO/Li cell, and (c) the LiFePO4/SIC/Li cell.
Download figure:
Standard image High-resolution imageAs shown in Figs. 2b and 2c, in the LiFePO4/SEO/Li cell, the initial drop or loss in voltage is small, although capacity decreases remarkably as the c-rate increases. In contrast to this cell, the high transference number of the LiFePO4/SIC/Li cell enables it to minimize capacity reduction at a high c-rate; however, the low ionic conductivity leads to a large potential voltage drop at the initial state. From the above result, it is clear that the LiFePO4/liquid-electrolyte/Li cell has higher specific energy than the other two batteries. However, because each cell design is different, it is difficult to directly compare the difference between two current SPEs-based batteries and the liquid-electrolyte-based battery. Therefore, in the next section, the current status is confirmed through a "fair" (i.e., modeling-based) comparison of the three cells, as well as a simulation of the degree to which transport properties need to be improved to reach the target point.
Results and Discussion
As noted above, each cell has a different design (thickness and volume fraction) making comparisons between them irrelevant. Moreover, practitioners modify on the thickness and volume fractions for each material set to obtain a unique design that takes advantage of each material's individual properties. In this work, we mimic this iterative process by using the mathematical model. We first compare the three cells, fairly by setting them to the same electrode design. Subsequently, to identify the cell design that maximizes the specific energy, we obtain Ragone plots by changing the cathode thickness and porosity or polymer content to examine differences between the current SPEs-based cells and the liquid electrolyte-based cell in terms of specific energy and power. Finally, we present targets for improving the transport properties of transference number, ionic conductivity, and diffusivity for the current polymer or hypothesis polymer suggested in this work to achieve the performance level of the liquid electrolyte-based cell.
Comparison of three cells under the same electrode design
Using the mathematical model, the three cells were set to have the same cathode electrode with a 60- m thickness and a separator with a 20-
 m thickness. The capacity of the Li-metal was set at two times the cathode capacity. Al and Cu current collectors were set to a 5-
 m thickness. The electrode porosity of the LiFePO4/liquid-electrolyte/Li cell was set to 0.46, and the polymer content of the LiFePO4/SEO/Li cell and LiFePO4/SIC/Li cell was set to about 25 wt%, corresponding to about 0.46 of the volume ratios. We assumed that the SPEs-based cells are ideally manufactured to have no pores inside the cathode electrode. Note that Bruggeman coefficient for three cells were set to the same value of 1.5 for a fair comparison.
Figure 3 shows the discharge behaviors of the three cells under the constant current density with C/3-rate. The cut-off voltage was set to 2.5 V, and the operating temperature was set at 25 °C for the LiFePO4/liquid-electrolyte/Li cell and at 90 °C for the SPEs-based cells. The capacities for all the three cells were about 160 mAh g−1; the LiFePO4/liquid-electrolyte/Li has a lower voltage drop than those of the two other cells during the same span of time because of its higher ionic conductivity and smaller concentration gradient. To investigate the cause of voltage drop in the LiFePO4/SEO/Li cell, we performed the simulations with different transference numbers: transference number by Bruce–Vincent method,  transference number by the Newman approach,
  and assumed transference number with 1.0 as shown in Fig. A·2. In case of LiFePO4/SEO/Li cell, it can be seen that the voltage loss due to the concentration gradient is more dominant that the ohmic voltage loss cause by lower conductivity. Note that the voltage loss of the LiFePO4/SIC/Li cell is only from lower conductivity because there is no concentration gradient due to transference number being 1.0. Although the transference number obtained by the Bruce–Vincent method is approximately 0.05 which is a still lower value than the SIC polymer, the LiFePO4/SEO/Li cell seems to have more advantages in terms of energy power than the LiFePO4/SIC/Li cell because of the better ionic conductivity of the SEO polymer electrolyte.
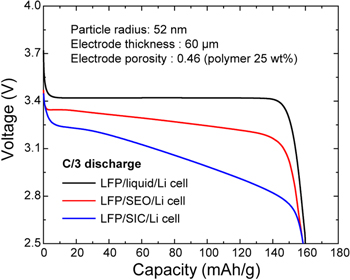
Figure 3. Modeling-based comparison of results of the three cells under the same electrode design: with electrode thickness of 60 μm, porosity of 0.46, particle size of 52 nm (radius), and other operating conditions.
Download figure:
Standard image High-resolution imageTo investigate the significantly low transference number's effects on cell performance, we simulated the LiFePO4/SEO/Li cell with different electrode thicknesses. As shown in Fig. 4a, the low  of the SEO polymer electrolyte can lead to transport limitations under other conditions, such as thicker electrode design. When the electrode thickness is 100 μm, the LiFePO4/SEO/Li cell fails before reaching cut-off voltage (2.5 V) due to transport losses. Figure 4b shows the time-dependent concentration profile in the electrolyte phase when the electrode thickness was set to 100 μm. The concentration of lithium-ions begins to decrease over time due to the reduction reaction in the cathode electrode, and the concentration gradient inside the electrode increases. At 8,012 s, the concentration of lithium-ion reaches zero. As presented in Fig. A·2, if we use the transference number obtained by the Newman approach, the transport limitation can be observed in a LiFePO4/SEO/Li cell even at the electrode thickness of 60 μm. On the other hand, the transport limitations in the LiFePO4/SIC/Li cell are negligible because of the high transference number; however, this cell has a significant voltage drop because of its lower ionic conductivity. While this paper examines the use of C/3 rate for the estimates, higher current operation, for example, fast charging, will requires cell designs with lower thickness and higher porosity.
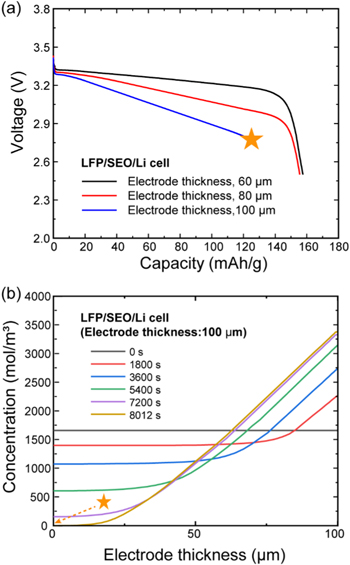
Figure 4. (a) Voltage profile results of the SEO cell when increasing the electrode thickness (60 μm, 80 μm, and 100 μm); and (b) transport limitation of salt inside the SEO polymer electrolyte cell when the electrode thickness is 100 μm.
Download figure:
Standard image High-resolution imageWhile these fixed design simulations provide insights into how the choice of electrolyte impacts performance, in general, the electrode thickness of all batteries is chosen so that it does not exceed a critical thickness, which maximizes discharge capacity without transport limitations. The critical thickness estimate varies with the c-rate; in addition, the porosity varies with the density of the active material's cathode electrode. The transport limit of lithium-ions in the electrolyte can be minimized depending on the choice of the electrode thickness, c-rate, and porosity, resulting in the recovery of capacity loss. In the next section, we compare the optimum points of the three cells when changing the cathode's thickness and porosity.
Optimization for the three cells
For application in the evolving EVs market, having a high specific energy is essential to enabling long driving range, and high specific power is required for achieving a high acceleration rate and for hill-climbing. To identify the highest possible energy level of batteries that also satisfies the power requirements, an optimization procedure as done by Newman and co-workers
26,46
was conducted to compare the Ragone plots for three cells. Here, we estimated the specific energy and power of the three cells using the EV protocol provided by DOE-USABC. Following the USABC manual, the specific energy of the three cells was evaluated from the C/3 discharge until cell voltage reaches cutoff of 2.5 V and the specific power was determined from the 30 s discharge pulse at 1C rate at 80% depth of discharge (DOD) following the Peak Power Test (PPT). Rather than estimate the accurate value of the specific energy, the USABC protocol provides battery practitioner with a simple equation to estimate the average pulse power using small number of measurable parameters. While the specific power can be accurately estimated in the model using the voltage information, we follow the USABC protocol to ensure consistency with established practice. Following the USABC manual the PPT approximately estimates the power capability values at each DOD level using the discharge voltage limit,  and open circuit voltage,
  using,
where  is set to the voltage cutoff with 2.5 V and R, is the discharge cell resistance, defined using,
In designing a battery electrode, the electrode thickness and porosity are the most important factors in enhancing energy density. Thicker electrodes can increase energy densities; however, it will also lead to limitations in its power capability. 49,50 Similarly, reducing electrode porosity enables improved energy density, but at the expensive of increased tortuosity leading to decreased power capability. This leads to an optimum in the thickness and porosity wherein the energy density of maximized while simultaneously satisfying the power requirement. This interplay is shown in Fig. 5 wherein the energy density with changing thickness and porosity is reported in order to identify the design that maximizes the energy density. Each point represents a unique cell design wherein a C/3 discharge is simulated and the energy density reported while ensuring that each design also satisfies the requirements that the cells can sustain a 1 C pulse for 30 s at 80% DOD. Similar to the previous simulation, the thickness of the current collectors was set to 5 μm, the Li-metal capacity was set to be two times that of the cathode, and the separator thickness was fixed at 20 μm for the three electrolytes. In addition, the cathode thickness was allowed to range between 20 μm to 160 μm for all the cells. Thicknesses above 160 μm were not considered because of current manufacturing limitations. The electrode porosity of the liquid electrolyte cell was changed from 10% to 40% by 5% intervals. For the polymer cells, the polymer contents were adjusted from 15 wt% to 40 wt%, which corresponds to a range in porosity from 10% to 40%.
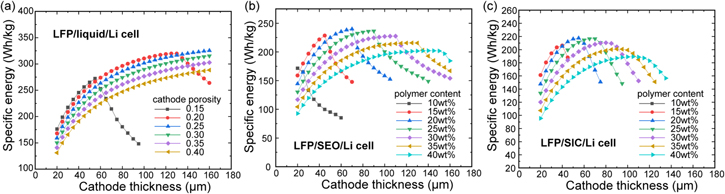
Figure 5. Specific energy optimization of the three cells according to cathode thickness and porosity under the C/3 rate discharge for: (a) LiFePO4/liquid-electrolyte/Li cell, (b) LiFePO4/SEO/Li cell, and (c) LiFePO4/SIC/Li cell.
Download figure:
Standard image High-resolution imageAs shown in Fig. 5a, the LiFePO4/liquid-electrolyte/Li cell has the highest specific energy of 330 Wh kg−1 for an electrode thickness of 160 μm and a porosity level of 25%. As seen in the figure, the energy density curve suggests that the actual optimum is beyond a thickness of 160 μm, however, we eliminate these designs due to practical considerations, as noted above. These results show the need to develop low cost manufacturing methods that can allow higher thicknesses to take advantage of the higher energy that these cells can deliver.
In contrast to the high thickness for the optimal design of the liquid cell, the LiFePO4/SEO/Li cell has an optimum point of specific energy of about 240 Wh kg−1 for polymer content of 20 wt% and electrode thickness of 70 μm, as shown in Fig. 5b. This reduced thickness results mainly from a transport limitation as shown in Fig. 4b. The LiFePO4/SIC/Li cell has an optimum specific energy of 220 Wh kg−1 for a polymer content of 20 wt% and cathode thickness of 55 μm, as shown in Fig. 5c. This cell is not affected by the transport limitation given that the cathode thickness increases due to the high transference number; however, the specific energy decreases because of the low electrolyte conductivity leading to increased cell polarization.
To compare the status of the SPEs-based cells clearly with the LiFePO4/liquid-electrolyte/Li cell, we present the specific energy vs specific power as shown in Fig. 6. The optimized specific energy of the liquid electrolyte cell is about 330 Wh kg−1, which is within 95% of the cell-level target point for EVs suggested by the USABC. The LiFePO4/SEO/Li cell has slightly better usable energy and power levels than the LiFePO4/SIC/Li cell; however, it is still significantly lower than those of the LiFePO4/liquid-electrolyte/Li cell. Note that the operating temperature of the SPEs-based cells is 90 °C. If these cells are operating at room temperature, one can expect significantly lower energy and power levels due to their low ionic conductivity. In general, lower temperatures would lead to lowered transport properties and thereby lead to cell designs that favor smaller thickness and higher porosities. However, the poor conductivity of PEO at room temperatures makes such a battery largely unusable for EV applications.
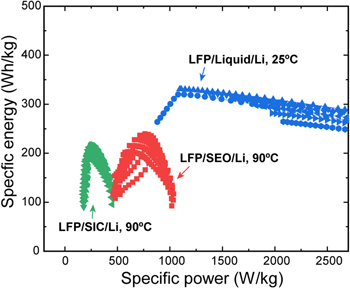
Figure 6. Comparison of specific power vs specific energy (Ragone plot) following the DOE-USABC protocol to compare the status of the three cells.
Download figure:
Standard image High-resolution imageTargets for polymer electrolytes
In general, a specific energy level indicates the total driving distance possible in EV applications, so various studies have been conducted on SPEs-based cells to determine a target-usable specific energy. The poor ionic conductivity for SPEs needs to be resolved before these cells can be expected to achieve the specific energy comparable to the liquid electrolyte-based cell. We investigated how much the ionic conductivity and diffusion coefficient of the SEO and SIC polymer electrolytes needs to be enhanced to reach the specific energy target. For simplicity, a linear relationship of the two properties, based on the dilute solution theory was applied to the LiFePO4/SEO/Li cell. 51 The specific energy was evaluated again under the same operating conditions and other design parameters as shown in the previous optimization work. Figure 7 shows the results of the specific energy for SPEs-based cells when the ionic conductivity increases. In order to reach a specific energy level within 95% of the level of the liquid-electrolyte-based cell, the ionic conductivity needs to improve by about 12 times for the SEO polymer and by about 16 times for the SIC polymer.

Figure 7. Comparison of the predicted specific energy by increasing ratio of conductivity required/based conductivity, which means the enhanced ionic conductivity of: (a) LiFePO4/SEO/Li cell, and (b) LiFePO4/SIC/Li cell.
Download figure:
Standard image High-resolution imageThe main purpose of using the block copolymers as separators is to prevent lithium dendrites from forming on the surface of lithium metal anodes. Thus, a polymer having better ion conductivity, such as the PEO polymers, can be used as an electrolyte at the cathode electrode instead of the block copolymer. One cell using the SEO polymer as the separator and the PEO polymer as an electrolyte for the cathode electrode was investigated further. Figure 8 shows the results of specific power vs specific energy for the three cells when increasing the ionic conductivity. As shown in Fig. 7, the factor required to reach the liquid electrolyte level requires 12 times higher ionic conductivity for the LiFePO4/SEO/Li cell and 16 times higher for the LiFePO4/SIC/Li cell—but only 6 times higher for the LiFePO4-PEO/SEO/Li cell. As presented in Fig. A·3, the LiFePO4/SEO/Li cell needs 20 times higher ionic conductivity to meet the liquid-electrolyte-based cell level of specific energy when we used the transference number obtained by the Newman's approach.

Figure 8. Comparison of increasing factor in which SPEs-based cells should be enhanced to reach specific energy levels of liquid electrolyte-based cells.
Download figure:
Standard image High-resolution imageRecently, research has been conducted toward improving the transference number by fixing the anion of a solid-state electrolyte. 52–54 However, the conductivity become lower due to immobilization of the anion and the low level of ionic dissociation if the anion is grafted on the polymer backbone. 3,19 Thus, there are efforts to improve the ionic conductivity of SPEs by mixing additives such as LLZO powder with high conductivity 55,56 or through alignment of the polymer to reduce the ion path. 57,58 In order to investigate the required ionic conductivity to satisfy the targeted specific energy level as the transference number improves, we simulated hypothetical cells having transference numbers from 0.2 to 1.0 as shown in Fig. 9. The transport parameters for the hypothetical cells with a transference number of 0.2 were set to the same values as the SEO polymer electrolytes with an ionic conductivity of about 0.054 S m−1 and a diffusion coefficient of about 4.7e-12 m2 s−1. Based on the dilute solution theory, the ionic conductivity and diffusion coefficient for the other hypothetical cells were estimated as the transference number increased. Theoretically, if the transference number is 1, the diffusion coefficient cannot be determined because the anion becomes immobile. Therefore, only the conductivity of the hypothetical cell is used for the single-ion simulation. The optimization procedure outlined above was performed for each chosen ionic conductivity. For simplicity, we assume that the ionic conductivity and diffusion coefficient do not vary with salt concentration.
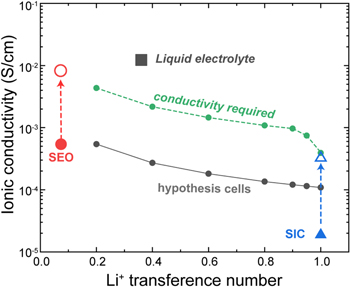
Figure 9. The trend of required ionic conductivity to satisfy the specific energy of the liquid-electrolyte-based cell as the transference number increases.
Download figure:
Standard image High-resolution imageThe results revealed that the required ionic conductivity, which enables a specific energy level as high as the level reached in a liquid electrolyte cell, decreases if the transference number increases. One interesting pattern is observed in the cells with a transference number greater than 0.9, where the required conductivity suddenly decreases. It should be noted that hypothetical cells with a transference number of less than 0.9 require about 8 times higher ionic conductivity. On the other hand, in cells with a transition number greater than 0.9, only 4 times higher ionic conductivity to achieve the targeted specific energy. The result shows the importance of developing high transference number polymers to ensure that the conductivity targets are minimized. However, the advantages are significant only for transference numbers greater than 0.9.
There is growing interest in the use of "hard" ceramics and glasses, instead of polymers, in solid state cells because of higher conductivity (including at room temperature) and mechanical properties compared to polymers with unity transference number. While, the conductivity values of these materials are higher than the targets shown in Fig. 9, we note that the higher density of these materials, compared to polymers, requires a complete evaluation of hard solids in a manner similar to that undertaken here. This will be a subject of a future publication.
Conclusions
In this paper, we conducted mathematical simulations to investigate polymer-based, solid-state batteries for EV application. A mathematical model was used to compare three cells, all with LiFePO4 composite cathode and lithium metal anode, but with different electrolytes: a conventional liquid electrolyte, a SEO polymer electrolyte, and a SIC polymer electrolyte. After model validation, an optimization procedure was implemented using the USABC protocol to maximize energy density with also satisfying the pulse power requirements for different battery designs. Model results show that the optimized specific energy of the LiFePO4/liquid-electrolyte/Li cell is about 330 Wh kg−1, however, the SPEs-based cells achieve less than 75% specific energy of liquid electrolyte-based cell. The model was then used to estimate targets for polymers so that they can achieve the energy density of liquid electrolytes. It was found that SPEs' ionic conductivity needs to increase by about 12 times for the LiFePO4/SEO/Li cell and by about 16 times for the LiFePO4/SIC/Li cell. Note that if SEO were used as a separator, while PEO were used in the cathode composite, the required ionic conductivity only needs to increase by 6 times to reach the level of the LiFePO4/liquid-electrolyte/Li cell. In addition, we performed an optimization study with increasing transference numbers. Increasing transference number allows lowering of the required conductivity, but significant changes only occur at transference numbers above 0.9. These simulations, along with simulations on dendrite growth reported by our group, provide guidance to polymer scientists to ensure development of materials that can aid in developing solid polymer based solid state batteries for EV applications.
Acknowledgments
This research is supported by the Vehicle Technologies Office (VTO), Department of Energy (DOE), USA, through the Battery Materials Research (BMR) program. Argonne National Laboratory is operated for DOE Office of Science by Chicago Argonne, LLC under the contract number DE-AC02-06CH11357.
Appendix
Simultaneously, we simulated the LiFePO4/SEO/Li cell using the transference number obtained through the Newman theory. Figure A·1 presents the comparison of model results with experimental data, and Fig. A·2 shows the comparison results for the three cells under the same electrode design as in the study results shown in Fig. 3. In addition, optimization was performed to find the point that satisfies the specific energy target while increasing the ion conductivity of the SEO polymer electrolyte, as shown in Fig. A·3.

Figure A·1. Comparisons between the model results using the transference number obtained from the Newman theory and the experimental data for LiFePO4/SEO/Li cell.
Download figure:
Standard image High-resolution image
Figure A·2. Comparison of results of the three cells under the same electrode design: with electrode thickness of 60  porosity of 0.46, particle size of 52 nm (radius), and other operating conditions. Note that, for LiFePO4/SEO/Li cell, the red solid line is the result with transference number obtained by Bruce and Vincent method, the magenta solid line is the result with transference number obtained from the Newman theory and red dotted line is the result with transference number with 1.0.
Download figure:
Standard image High-resolution image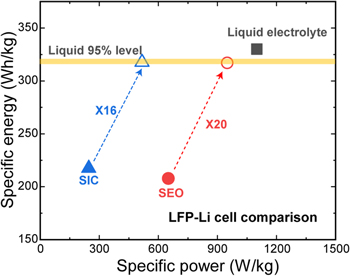
Figure A·3. Comparison of transport parameters for SPEs-based cells that need to be improved to reach the specific energy levels realized in liquid electrolyte-based cells. The LiFePO4/SEO/Li cell needs a transport parameter that is 20 times higher, which is 1.7 times larger than the result of this cell with a transference number obtained by using the Bruce-Vincent method (Newman theory).
Download figure:
Standard image High-resolution image