
Abstract
The operating temperature of a battery strongly affects overall chemical reactions, ion transport, intercalation and deintercalation process, and consequently, efficiency, cycle life, and degradation of battery systems. Therefore, thermal management for battery systems should be optimally designed to secure a highly efficient and reliable operation of the battery systems, which requires characterization and analysis of heat generated during operation. In this paper, a thermal model that includes irreversible and reversible heat source terms is developed and then incorporated into a reduced-order electrochemical model (ROM). The model is validated against the heat generation rate of a large format pouch type lithium-ion battery measured by a developed calorimeter that enables the measurement of heat generation rate and entropy coefficient. The model is seen to be in good agreement with the measured heat generation rates up to 3C from −30 °C to 45 °C. The analysis includes the effects of C-rates and temperatures on the two heat source terms generated during charging and discharging.
Export citation and abstract BibTeX RIS
List of symbols
| A | Sandwich area of the cell (cm2) |
| aα | Anodic intercalation factor |
| ac | Cathodic intercalation factor |
| c | Ion concentration (mol l−1) |
| CC | Constant Current |
| ch | Charge |
| Ds | Diffusion coefficient in electrode (cm2 s−1) |
| De | Diffusion coefficient in electrolyte (cm2 s−1) |
| dis | Discharge |
| EIS | Electrochemical Impedance Spectroscopy |
| F | Faraday constant (96,487 C mol−1) |
| FOM | Full Order Model |
| HGR | Heat Generation Rate |
| I | Current of the cell (A) |
| i0 | Exchange current density (A cm−2) |
| j | Reaction rate (A cm−3) |
| L | Thickness of microcell (cm) |
| l | Coordinate along the thickness of microcell |
| OCV | Open Circuit Voltage (V) |
| Q | Capacity of the cell (A h) |
| R | Resistance (Ω cm2) or universal gas constant (8.3143 J mol−1 K−1) |
| Rs | Radius of spherical electrode particle (cm) |
| RMS | Root Mean Square |
| ROM | Reduced Order Model |
| r | Coordinate along the radius of electrode particle (cm) |
| SOC | State Of Charge |
| SEI | Solid Electrolyte Interphase |
| T | Cell temperature (K) |
| t | Time (s) |
| TMS | Thermal Management System |
| TEM | Thermal Electric Module |
| Ueq | Equilibrium potential (V) |
| Vt | Terminal voltage of cell (V) |
| x | Stoichiometric number of the anode |
| y | Stoichiometric number of the cathode |
| α | Transfer coefficient of reaction |
| δ | Thickness (mm) |
| ε | Volume fraction of a porous medium or strain |
| φ | Electric potential (V) |
| η | Reaction overpotential of electrode (V) |
| κ | Ionic conductivity (S cm−1) |
| σ | Conductivity (S cm−1) |
| α | Anodic |
| ave | Average value |
| c | Cathodic |
| e | Electrolyte phase |
| eff | Effective |
| eq | Equilibrium |
| Li | Lithium-ion |
| max | Maximum |
| OC | Open circuit |
| s | Solid phase |
| surf | Electrode particle surface |
| − | Negative electrode (anode) |
| + | Positive electrode (cathode) |
Electrification of vehicles has become one of the significant design changes in the transportation sector primarily due to the drive to decrease the global average fossil fuel consumption per capita and reduce air pollution associated with internal combustion engines. As electric vehicles increase their market share compared to traditional internal combustion engine-powered vehicles, a need for increasing energy and power density has been seen. This is primarily to relieve range anxiety for the customer, but as the potential of autonomous vehicles is being explored, the need for extra power onboard that enables the integration of x-by-wires has also been seen. The lithium-ion battery is the current state-of-art chemistry that provides consistent and reliable recharging capability as well as high power and energy density. Charging and discharging of a battery involves many complex processes such as charge transport, chemical reactions, and intercalation or deintercalation. Those processes are significantly affected by operating temperature, which affects the transport phenomena that govern efficiency, cycle life, and robustness of the battery. The efficiency of a battery is related to the speed of the localized chemical reactions which are governed by a temperature-dependent reaction. In addition, the charge transport phenomena such as conductivity and diffusivity of materials are affected by temperature and therefore affect the overall efficiency as well. The cycle life of a battery is mainly determined by the presence and degree of side reactions such as lithium plating that consume lithium-ions and electrolytes. The side reaction and lithium plating are significant at temperatures outside of the normal operating conditions, which reduces not only cycle life, but also efficiency. In addition, when a battery is exposed to extremely high temperatures, several chain reactions take place such as decomposition or degradation of materials, which can generate a large amount of heat, release oxygen and flammable gas, cause an internal short circuit, and consequently, thermal runaway.1 Therefore, proper thermal management of the battery is a compelling factor in the battery management system.
Design of a thermal management system (TMS) should consider many factors such as size, weight, type of cooling method, material, and the amount of coolant, all of which directly affect the cost and performance of the system. One of the most important battery characteristics that must be understood for the design of TMS is a heat generation rate (HGR) of the battery. Any erroneous estimation of the heat could result in an oversized or insufficient TMS that decreases the efficiency, could result in excess weight and would result in unnecessary associated costs. Fundamental understanding of the heat generation of a battery can be achieved by using an accurate thermal model, which can help to analyze the heat source terms and optimally design the cell as well as TMS.
There are various thermal models published. One of the most conventional and straightforward equations to calculate the HGR of a battery is as follows2;
where  is an entropy coefficient. The equation has two terms that represent irreversible and reversible heat sources. It allows for the estimation of the HGR based on only three inputs: terminal voltage, current, and open-circuit voltage (OCV). Due to its simplicity and low computation costs, the model is generally preferred for most applications. However, a lumped thermal output does not provide any detailed information relating to the HGR, particularly when considering the location of cell components, heat generation distribution along the thickness direction of the battery cell, and effects of material or internal design changes on the HGR. To this end, other researchers have proposed to estimate the HGR using an electrochemical thermal model.3–8 Using this approach, the irreversible heat source term is typically resolved into several parts that include Joule heating from electrodes and electrolytes, an electrochemical reaction polarization heat, and the heat from contact resistance. For the calculation of the HGR, the thermal model requires the computation of internal variables that are obtained from physics-based electrochemical models. Recently, there have been many suggestions to extend the lumped thermal model to multi-dimensional thermal models that include a rigorous solving of a porous electrode model,6,8 as well as the additional heat source from the current collectors by calculating the potential or current distributions in the current collectors, which can have a significant effect on the distribution of the HGR. However, due to computational complexities, the behavior of the HGR at high C-rates and low temperatures has not been rigorously investigated using an electrochemical thermal model. In addition, according to the analysis of the heat sources during discharging based on the electrochemical thermal model,5 the irreversible HGR profiles were almost constant as a function of a state-of-charge (SOC). Recent work has shown that the internal resistance of the battery and associated irreversible HGR change as a function of SOC.9–11 Therefore, this study focused on the development of a physics-based electrochemical thermal model that can accurately predict all heat sources within a cell under various C-rates and temperatures. For validation, a test station equipped with a calorimeter is used to accurately measure the HGR of the battery. Finally, detailed heat source analysis for the effects of the C-rates and temperatures on the overall HGR is considered.
Review of the Principle of Heat Generation
The heat generation in a battery can be explained with the first law of thermodynamics. Any differential change of internal energy in a closed system is equal to the sum of heat gained or lost and the work done by the system. The first law can be expressed as follows;

where dU is a change of the internal energy, dQ is a change of the heat that can be added to the system (positive) or given off by the system (negative), and dW is the work done by the system. If some of the reactions induce any pressure or volume changes, the amount of heat exchange is no longer equal to the change of the internal energy because some of the heat is converted into work. Hence, enthalpy as a new property is introduced due to the limitation above, which is defined as the sum of the internal energy and the product of pressure and volume of the system.

At a constant temperature, pressure, and volume, the change of the internal energy can be replaced by the change of the enthalpy. The change of the enthalpy can be further expressed via several terms that are related to enthalpy of reaction, phase change, heat capacity, and enthalpy of mixing.2 By neglecting the phase change and enthalpy of mixing, the change of enthalpy in a single phase is expressed as follows;
The first and second terms on the right side of the equation above represent the change of enthalpy caused by reaction and the change of heat energy of the battery by the change of temperature, respectively. Combining Eq. 4 with the first law yields the equation as follows;
where dQ/dt is the heat transfer rate with the surroundings and dW/dt is the electric power of the battery that is generally expressed as the product of terminal voltage and current. Under the assumption that the process is isothermal, the HGR given off to the system is the same as that from the battery. Therefore, the equation above becomes the same as Eq. 1, where the sign of the heat transfer rate switches to express the heat released from the battery is positive.
Coupled Electrochemical and Thermal model
The electric power of the battery in the conventional thermal model is determined only by the product of terminal current and voltage, which does not consider internal chemical reaction processes and detailed prediction of heat distribution in components and the tabs or welds of a cell. Therefore, a detailed formulation is derived.
The internal processes during charging are summarized as a schematic diagram in Fig. 1. In this study, only heat generated inside the cell is considered. During charging and discharging, oxidation and reduction processes take place when electrons and ions are involved. Those charges are transported via migration and diffusion which are driven by gradients in potential and concentration, respectively. During charge transport, some of the power from the charger is dissipated due to internal resistances of the battery and the remaining power is converted to increase or decrease chemical energy of the battery by changing ion concentration in the active materials, which is the actual realized power to the battery cell.
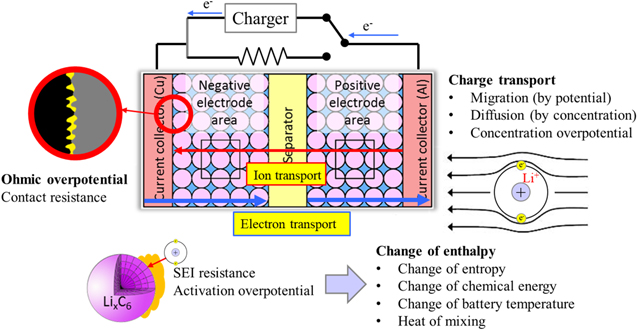
Figure 1. Schematic view of the charging process considering the internal behavior of a cell.
Download figure:
Standard image High-resolution imageThe HGR from the migration of the electrons in the solid phase can be expressed as3;

where  is an averaged current density through the solid phase as expressed4;

where  is effective conductivity of active material.
Due to the high mobility of the electrons, the overall magnitude of the HGR is relatively small. However, when the currents flow through interfaces between the current collectors and active material particles in composite electrodes, the current can be concentrated at the area of microcontact spots, where the real contact area is reduced to only a small portion of the nominal contact area. Accordingly, the reduced area increases a contact resistance and the generated heat is expressed as;

where  is the contact resistance that is experimentally determined from the Ohmic voltage drop during charging and discharging operations.12–14
Similarly, the HGR by ion migration in the electrolyte phase is expressed as;

where  is an averaged current density through the electrolyte phase. Due to the lower mobility of the ions, the HGR by electrolyte is relatively large compared to that of the electrode.
On the other hand, most of the charge transport is determined by migration and as a result, the heat generation from diffusion is negligible. However, the gradient of the ion concentration in the electrolyte induces a concentration overpotential, which decreases the potential across the electrolyte and consequently the current density through the electrolyte phase as follows;
where  is effective ionic conductivity and
  is transference number. The first and the second terms represent the current density from the potential gradient and that from the concentration overpotential, respectively.
At the surface of the active material, a solid-electrolyte interphase (SEI) layer deposited on the active materials of anode electrode acts as an additional ionic resistance prior to intercalation. The associated HGR is expressed as follows;

where  is a potential drop across the SEI layer and expressed as;

During the reaction, the activation overpotential generates heat expressed as;

where  is a reaction rate and
  is the activation overpotential.
Since all reactions take place at the surface of the active materials, the amount of the actual power applied to the battery can be expressed using the change of surface ion concentration of the active materials as follows;
The sum of all equations from (6) to (14) results in the electric power of the battery.
The internal energy of the battery can be rewritten considering reaction rate and heat of mixing, as expressed below;
The difference between the actual power and the change of the internal energy based on Eqs. 14 and 15 represents an additional heat generated in the active materials, which yields a new term that expresses the difference of the lithium-ion concentration at the surface of the particle and averaged ion concentration in the particle as follows;
Lastly, there is a resistance to mass transport in the battery, which leads to the formation of the concentration gradient as ions are transported. When the current is turned off, the concentration gradients relax, which results in the heat of mixing. Most researchers do not consider the heat of mixing because the magnitude of the heat of mixing is very small.3 However, if the heat of mixing is not considered, it is not possible to model the heat that is generated after the current is turned off. For example, when using Eq. 1, the HGR becomes zero if the current is zero. In order to derive an equation for the heat of mixing, it is assumed that there are two components in the system and the total enthalpy is a sum of enthalpies of each component as follows;15
where c and  are ion concentration and partial molar enthalpy of the components A and B. Partial molar enthalpy is a function of temperature, pressure, and concentration. Then the partial molar enthalpy can be expanded from the 2nd order Taylor series.
Under the assumptions of constant temperature and pressure, the equations above can be simplified to an equation for the heat of mixing in a single component as follows16;
Using the derivative of the partial molar enthalpy, the ion concentration can be rewritten from an enthalpy potential that is defined as the voltage corresponding to reaction17 and is expressed as enthalpy per the unit of charge,  The enthalpy voltage is further expressed from the Gibbs–Helmholz equation.18
Therefore, the heat of mixing can be calculated from the entropy coefficient and ion concentration as shown;
All heat source terms are summarized in the appendix. The theoretical calculation of the HGR of a battery requires information on internal variables and parameters of the battery. The internal variables are calculated from a physics-based electrochemical model and the parameter set for the thermal model is obtained by comparing the electrochemical model prediction to the experimental voltage profiles.9
Estimation of reversible heat generation rate based on an empirical method
Estimation of the reversible HGR requires prior measurement of the entropy coefficient. A battery consists of two electrodes that have different chemistry. Therefore, the entropy coefficient needs to be measured in both electrodes, respectively. However, in commercial cells, it is not always possible to measure a change of potential of each electrode separately. Therefore, in this study, a combined entropy coefficient is measured. There are two major experimental methods to find the entropy coefficient. The first one is a calorimetric method that calculates the difference between total heat generated during charging and discharging11 which results in a constant value regardless of state-of-charge. Since the entropy of reaction varies significantly with SOC,18 an experiment considering the effect of SOC needs to be conducted. The other experimental method commonly seen is the potentiometric method, which is more accurate but more time consuming because of the time needed to reach equilibrium.
In this study, an empirical method is applied to estimate the entropy coefficient. The method assumes that the total HGR consists of only reversible and irreversible contributions, while the heat of mixing is neglected. Measurement of the total HGR is carried out in real-time using a calorimeter during charging and discharging at various C-rates. Then, the irreversible HGR is calculated by using Eq. 1, where the reversible HGR is obtained by subtracting the calculated irreversible HGR from the measured total HGR. The coefficient is then calculated by dividing the reversible HGR with the current and absolute temperature. In this study, the data is collected from 1C, 1.5C, and 2C charging and discharging and the empirical coefficient is obtained from averaged results from them. The result is then compared with the measured entropy coefficient.
Measurement of the entropy coefficient
There are two methods to measure the entropy coefficient experimentally depending upon if the battery temperature or SOC is kept constant. The first method involves keeping the temperature constant and measuring voltage by varying SOC at different temperatures. The other method requires keeping SOC constant while varying temperature.11,15,18,19 Since OCV varies linearly with temperature within the reference temperature of 25 °C11,20 but nonlinearly with SOC, the second method is more preferred due to its high accuracy.
The procedure for the measurement of the entropy coefficient is summarized in Fig. 2a. Initially, a battery is charged or discharged to a target SOC point, which is repeated for 21 points from 0% to 100 SOC with a 5% interval. Then, the battery is rested for at least 10 hours until an equilibrium state is reached. At the equilibrium state, the temperature of the battery is changed using the calorimeter. Figure 2b shows the change of the battery temperature with ±10 °C over time, at the temperature change rate of 0.5 °C min−1. At the same time, the change of terminal voltage due to the temperature change is measured as shown in Fig. 2c, where the voltage is measured at the 25% SOC point. Then, the entropy coefficient at given SOC can be obtained by linearly fitting the slope of the voltage to the temperature.
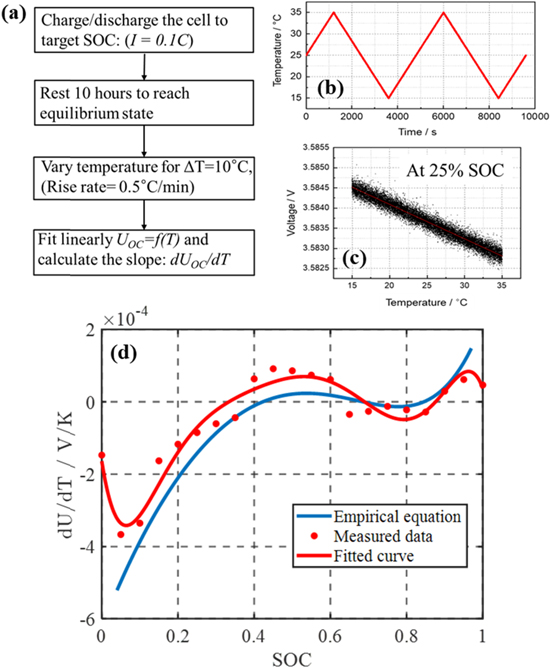
Figure 2. (a) Procedure for the measurement of the entropy coefficient; (b) Change of battery temperature as a function of time; (c) Measured voltage as a function of temperature; (d) comparison of entropy coefficients from the empirical equation and measured data.
Download figure:
Standard image High-resolution imageThe entropy coefficient obtained from two different methods are compared in Fig. 2d. The blue line is the empirical coefficient and the red dots and line are the measured data and fitted curve. The two results show a good agreement except at 0% and 100% SOC. In the case of empirical calculation, CC charging and discharging are applied, and the cutoff voltage is reached earlier than 0% and 100% SOC, which results in the inaccuracy of the measurement. Therefore, the measured coefficient is used for the thermal model. It can be assumed that one fitted curve can be used for the other temperature ranges because the slope of the voltage is constant as a function of temperature as shown in Fig. 2(c). On the other hand, the coefficient is highly dependent on the SOC and especially at low SOC, it has a high negative value that can cause the reversible HGR to be endothermal and exothermal during charging and discharging respectively.
Measurement and Model Validation
Battery temperature is changed by the heat generated and the heat transferred to the surrounding according to the energy equation, which is expressed as;
If the battery is operated in an adiabatic condition, the heat transferred to the environment is zero and all heat generated directly leads to an increase of the battery temperature. If the battery is under isothermal operation, the change of the battery temperature is zero and all heat generated is transferred to the environment. Therefore, a calorimeter that maintains the surface temperature of the testing cell as constant is required for the measurement of the HGR. The calorimeter is developed using thermal electric modules (TEM) that work as a heat pump and a thermostat at the same time. A testing cell is placed between two TEMs and its surface temperatures are measured using thermocouples. When the battery generates heat during charging or discharging, the surface temperature of the battery changes. Then, the TEM absorbs or releases heat to control the battery temperature to a preset reference in a feedback loop.21,22 In this work, it is assumed that the effects of a cross-plane temperature gradient are negligible.
Theoretical calculation of the HGR of a battery requires knowledge of internal variables such as the ion concentration, the potentials in solid and electrolyte phase, or activation overpotential that are immeasurable at the terminal of the battery. Those variables can be calculated from the governing nonlinear partial differential equations (PDE) that describe ion dynamics considering chemical reactions, which is called a full order model (FOM). Even with high accuracy, the FOM is still inappropriate for control purposes in real-time because of computational time. A possible approach is to reduce the order of the FOM by converting PDEs into ordinary differential equations (ODE) and linearize the nonlinear equations, which is called a reduced-order electrochemical model (ROM). There are mainly two types of ROM, which are a single particle model (SPM) and a pseudo-2-dimensional model (P2D). The P2D ROM is used in this study because the SPM cannot calculate the gradients of potential and concentration, which is necessary for the study of the heat generation behavior along the thickness direction. Details of the equations are summarized in the appendix.
The thermal model including ROM is experimentally validated with respect to HGR using pouch type LMO (30%)—NMC (70%) / Graphite cell with a capacity of 26Ah under various C-rates and temperatures. The HGRs from experiments and simulations at 25 °C during charging and discharging with different C-rates are compared in Figs. 3a and 3b, and those during 1C discharging at different temperatures are compared in Figs. 3c and 3d. Generally, the HGRs during charging are smaller than those during discharging at the same C-rate. Besides, the profiles of the HGR from 15 °C to 45 °C are similar but rapidly increase when the temperature is below 0 °C. The detailed analysis of the effect of C-rate and temperature will be discussed in the next section.
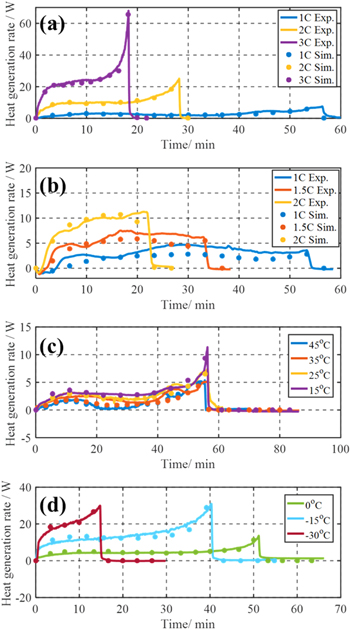
Figure 3. Heat generation rate from experiments and simulation; (a) from 1C to 3C discharging at 25 °C; (b) from 1C to 2C charging at 25 °C; (c) from 45 °C to 15 °C during 1C discharging; (d) from 0 °C to −30 °C during 1C discharging.
Download figure:
Standard image High-resolution imageThe corresponding root-mean-square (RMS) errors of the simulation data are calculated and summarized in Tables I and II. The overall profiles of the HGR from the simulation are in good agreement with those from experiments. However, the difference between the simulated and measured heat generation rate tends to increase at high C rates or low temperatures, which can be caused by the neglected cross-plane temperature gradient from the measurements and the assumptions of the model. In addition, another reason for the difference at low temperatures is the neglected temperature dependency of the entropy coefficient.
Table I. RMS errors of heat generation rates at 25 °C.
| C-rate (1/h) | 1C Disch. | 2C Disch. | 3C Disch. | 1C Ch. | 1.5C Ch. | 2C Ch. |
|---|---|---|---|---|---|---|
| RMSE (W) | 0.74 | 1.52 | 3.87 | 1.30 | 0.74 | 1.39 |
Table II. RMS errors of heat generation rates at 1 C discharging.
| Temp. (°C) | 45 | 35 | 25 | 15 | 0 | −15 | −30 |
|---|---|---|---|---|---|---|---|
| RMSE (W) | 0.59 | 0.71 | 0.74 | 0.70 | 1.12 | 2.28 | 2.99 |
Analysis of the Heat Generation Rate Using the Validated Model
The HGR of the battery is dependent on many factors such as SOC, applied C-rate, temperature, and state of degradation. In this study, the effects of the SOC, C-rate, and temperature on the heat sources are analyzed.
Heat source analysis
The detailed heat sources including the heat from charge transport, overpotentials, and reversible entropic heat are compared during both charging and discharging. The profiles of the HGR from each heat source during 2C constant current (CC) charging and discharging at 25 °C are plotted in Fig. 4 as a function of time and SOC. The most significant heat sources are; (1) change of the entropy, (2) migration from the electrolyte phase, (3) contact resistance, and (4) difference of surface and averaged ion concentration within particles. Each heat source has a different magnitude and tendency as a function of SOC.
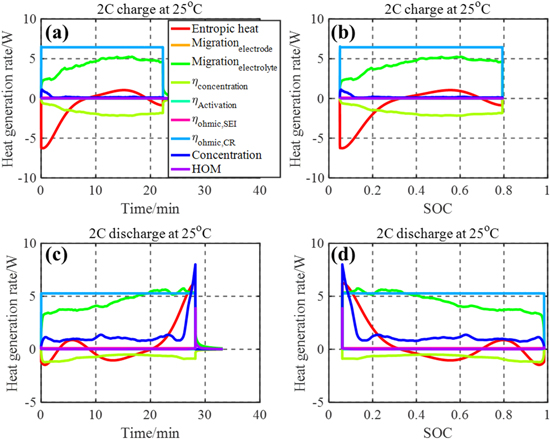
Figure 4. Heat sources during 2C CC at 25 °C; (a) charge as a function of time; (b) charge as a function of SOC; (c) discharge as a function of time; (d) discharge as a function of SOC.
Download figure:
Standard image High-resolution imageAs seen in Fig. 4, the entropic HGR is highly dependent on SOC and mirrored at charging and discharging because of its reversible nature. Additionally, the HGR from the electrolyte phase is much larger than that from the electrode phase because of the different mobility of charges. However, it is reduced by the concentration overpotential, and accordingly, the sign of the HGR resulting from the concentration overpotential is negative. Due to different chemistries composing the anode and cathode active materials, the magnitudes of the HGR by migration during charging and discharging are different at a given C-rate. The HGR due to the contact resistance has the same profile as that of the current, which dominantly contributes to the total HGR. Lastly, the HGR due to the difference of ion concentration within particles is also dependent on SOC and its magnitude is seen to be the largest, especially at low SOC during discharging. In fact, impedances measured by EIS have shown that the charge transfer resistance of the cell is the largest when the voltage is at 0% SOC.23 In addition, the internal cell resistance is dependent upon charging and discharging and the resistance during discharging is larger than that during charging.24 There are other negligible heat sources such as the activation overpotential, SEI resistance at the Beginning of Life (BoL), and the heat of mixing.
The total irreversible HGRs during 1 C charging and discharging for each component are plotted in Figs. 5a and 5b under the assumption that the contact resistance at the interface of the anode electrode and current collector is same as that of the cathode electrode and current collector. The magnitude of the HGR from the cathode electrode for both charging and discharging has a peak at a low SOC where the difference of ion concentration within particles is larger, which leads to a large potential difference. At the anode electrode, the potential does not significantly change with the ion concentration. At the separator, the SOC dependency of the HGR is similar, and the magnitude is small because the only heat generated is due to ion transport. The ratio of magnitude of each heat source to the total heat at the anode and cathode is compared in Figs. 5c and 5d, where the heat from concentration overpotential (yellow) is negative. At the anode electrode, the heat from the contact resistance is dominant with the addition of the heat from SEI resistance, which is unique to the anode electrode. In addition, the heat from the difference in ion concentration within particles is not significant. However, at the cathode electrode in Fig. 5d, the heat from the difference in ion concentration is significant heat source. The migration heat at the electrolyte phase is also a dominant heat source although some amount of heat is reduced by the concentration overpotential. Other heat sources, migration from the electrode, activation overpotential, heat of mixing, are small enough to neglect.
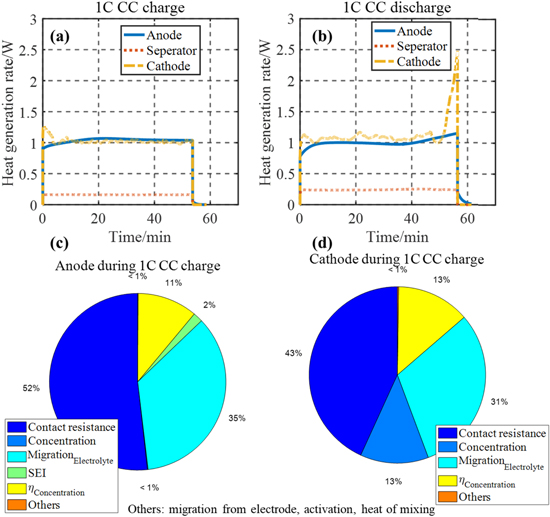
Figure 5. Irreversible heat generation rates at each component; (a) during charging; (b) during discharging; the ratio between heat sources and the total heat during 1C CC charge; (c) at anode electrode; (d) at cathode electrode.
Download figure:
Standard image High-resolution imageEffect of the C-rates on the heat generation rates
In order to analyze the effects of C-rates, the total heat is calculated, which provides a reference for the calculation of efficiency during operations. The total heat during charging and discharging at 35 °C is plotted as a function of C-rates in Fig. 6a. When C-rate increases, Joule heating, which is the main heat source in the battery, increases proportionally to the square of applied current, but the charging or discharging time decreases. As a result, the total heat increases almost linearly as the C-rate increases. In addition, the total heat at charging is always smaller than that at discharging at the given C-rate because of the contribution of the reversible heat. In Fig. 6b, the ratio of the heat from each source to the total heat during charging and discharging is compared as a function of C-rates. The entropic heat is seen to be the largest at a low C-rate but rapidly decreases as C-rate increases. In addition, the profiles at charging and discharging are similar but mirrored because of the reversible process, which is the reason for higher heat during discharging. On the other hand, the irreversible heat sources have a similar trend regardless of charging and discharging. Those heat sources are small at a low C-rate but become dominant as C-rate increases because of the overpotentials.25 Above 1.5 C, the ratio of irreversible heat sources is seen to be relatively constant because the increasing rates of irreversible heat sources are identical.
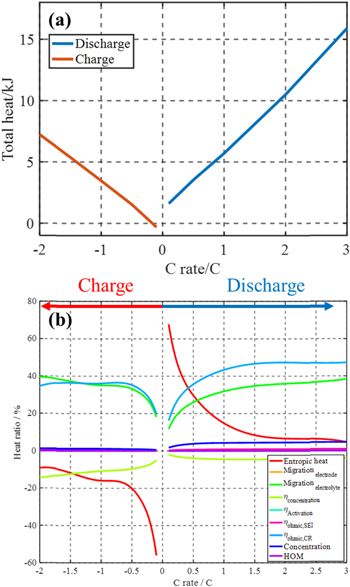
Figure 6. (a). Total heat as a function of the C-rate from both charging and discharging at 35 °C; (b). The ratio of the heat of each source over the total heat as a function of the C-rate.
Download figure:
Standard image High-resolution imageEffect of temperature on the heat generation rate
Since the temperature of a battery can vary during operation, the effect of the operating temperature on the HGR is analyzed with the validated model. For the analysis, the results during discharging are compared due to the higher HGR compared to charging. Different heat sources during 1 C CC discharging at different temperatures are plotted in Fig. 7. The results show that the most dominant heat source at high temperatures is the change of entropy because the battery internal resistance is small at high temperatures, which leads to a small irreversible HGR. On the other hand, the contribution of the contact resistance, ion concentration difference within particles, and ion migration to the overall heat generation rate rapidly increases at low temperatures. The area of microcontact spots of the interface between active material particles and current collectors is caused by a deformation of materials, which is directly related to the strength of the material. At low temperatures, the material strength increases, and the deformation is reduced. Accordingly, the contact area is reduced and the contact resistance increases.26 In addition, the gradient of ion concentrations in particles increases the charge transfer resistance at low temperatures.23 Ion transport at low temperature gets hindered and heat generation rate increases, however some amount of heat is reduced by concentration overpotential.
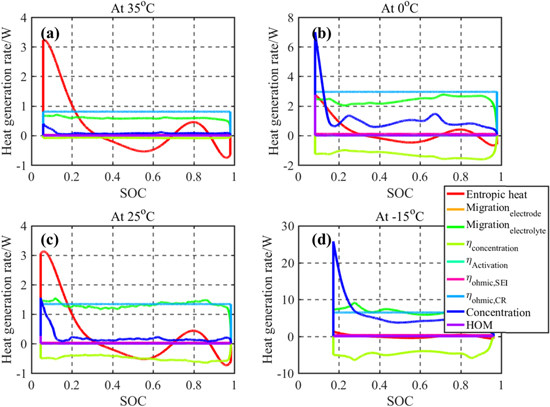
Figure 7. Heat sources during 1C CC discharge; (a) at 35 °C; (b) at 0 °C; (c) at 25 °C; (d) at −15 °C.
Download figure:
Standard image High-resolution imageThe two most dominant irreversible heat sources at low temperatures are plotted in Figs. 8a and 8c. Since the HGR due to the contact resistance follows the same profile as the applied current, only the magnitude of the HGR is plotted as a function of temperature. In addition, the magnitude of the HGR due to the SEI resistance is plotted in Fig. 8b and is seen to increase rapidly at low temperatures even though the HGR is small enough to neglect at the beginning of life. Both resistances exponentially increase at low temperatures.
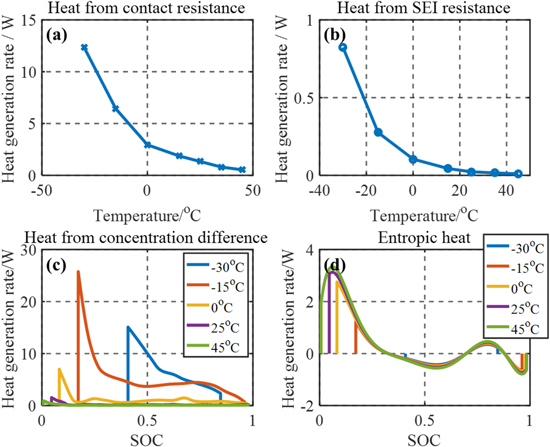
Figure 8. Heat generation rate at different temperatures (a) heat from contact resistance; (b) heat from SEI resistance; (c) heat from ion concentration difference within particles; (d) entropic heat as a function of SOC.
Download figure:
Standard image High-resolution imageThe discharging time is also significantly affected by the operating temperature. Therefore, it is more effective to compare results as a function of SOC. The HGR caused by the difference in the ion concentration within the particles is plotted at various temperatures in Fig. 8c. The overall HGR increases as temperature decreases. However, the peak HGR at −30 °C is smaller than that at −15 °C because the same terminal voltage cutoff occurs at a higher SOC at lower temperatures because of a larger ohmic overpotential at low temperatures, which results in the smaller peak.
The entropic HGRs at various temperatures are plotted in Fig. 8d, where a consistent trend in the entropic HGR is seen. In this study, the entropy coefficient is measured at 25 °C as a reference temperature and used for all temperature ranges. As a result, the absolute temperature does not affect the overall HGR significantly at the given C-rate. On the other hand, at low temperatures, the voltage reaches the cutoff voltage earlier due to increased ohmic overpotential. Therefore, the total heat decreases at lower temperatures due to the reduced discharging time.
Temperature distribution through the plane of a single cell
The thermal model previously introduced assumed that a microcell represents a single cell. In fact, a single cell is composed of multiple microcells that are connected in parallel. Therefore, the validated thermal model for a microcell is extended to predict temperature profiles through the plane of a single cell, which schematic diagram is depicted in Fig. 9. In this study, the number of anode and cathode electrodes is 20 and 19, respectively. Besides, it is assumed that the reactions taking place at all microcells are identical and there are thermal contact resistances between separators and electrodes. The value of thermal contact resistance is assumed to 80% of total thermal resistance in this study.27,28 The dimensions and thermal properties of each component are summarized in Table III.
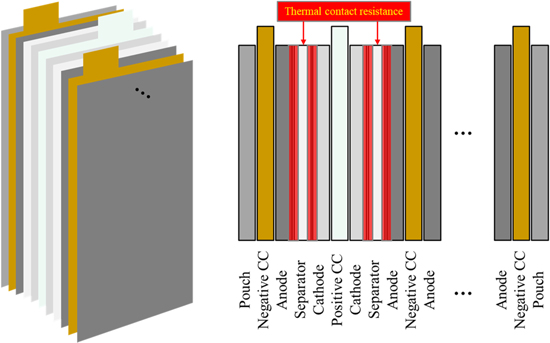
Figure 9. Schematic diagram of a single cell.
Download figure:
Standard image High-resolution imageTable III. List of model parameters.
| Electrochemical parameter (a: manufacture; b: model validation). | ||||
|---|---|---|---|---|
| Negative electrode | Separator | Positive electrode | Unit | |
| Thicknessa, δ | 66 × 10–6 | 31 × 10–6 | 73 × 10–6 | m |
| Particle radius,29 RS | 8 × 10⁻⁶ | — | 9.8 × 10⁻⁶ | m |
| Stoichiometry at 0%b SOC | 0.28 | — | 0.84 | |
| Stoichiometry at 100%b SOC | 0.92 | — | 0.46 | |
| Average electrolyte concentration, ce | 1.2 × 10³ | 1.2 × 10³ | 1.2 × 10³ | mol m−3 |
| Exchange current density coefficient, i0 | 13.2 × 10⁴ | — | 6.79 × 10⁴ | A m−2 |
| Charge transfer coefficient, αa, αc | 0.5, 0.5 | — | 0.5, 0.5 | |
| Solid phase diffusion coefficientb, Ds | 2.28 × 10⁻¹³ | — | 1.04 × 10⁻¹³ | m2 s−1 |
| Solid phase conductivity, σ | 5.4 | —- | 0.2 | S m−1 |
| Bruggeman's porosity exponent, p | 1.5 | 1.5 | 1.5 | |
| Electrolyte phase ionic conductivity, κ |

|
S m−1 | ||
| Li+ transference number, t0+ | 0.363 | 0.363 | 0.363 | |
| Equilibrium potential of anode |

|
|||
| Thermal parameter.30 | ||||
| Components | Material | Density [g cm−3] | Heat capacity [J g−1 K−1] | Conductivity [W cm−1 K−1] |
| Negative CC | Copper | 8.96 | 0.386 | 3.97 |
| Anode | Graphite | 2.1 | 0.71 | 0.1511 |
| Separator | Microporous polymer | 1.4 | 1.551 | 0.0035 |
| Cathode | LMO—NMC | 4.89 | 0.85 | 0.00687 |
| Positive CC | Aluminum | 2.7 | 0.9 | 2.3 |
| Pouch | Aluminum/PET/PPE/Nylon | 1.7 | 1.15 | 0.61 |
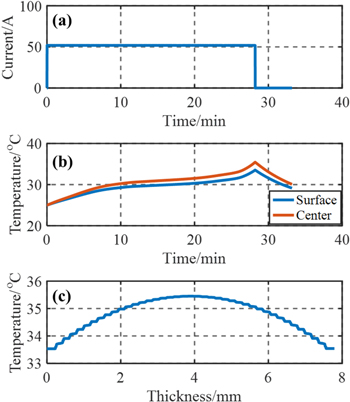
In addition, forced air convection is assumed at both surfaces, where the convection coefficient is set as 30 W m−2 K−1.31 Discharging current and temperature profiles for the single cell level during 2C CC discharging at 25 °C are calculated and plotted in Figs. 10a–10c. The temperature profile is symmetric due to the symmetrical structure and HGR profile. Small ripples in the profile through the plane are caused by thermal contact resistance as well as different HGR profile and thermal properties of the components.
Figure 10. Simulation results at 2C CC discharging; (a) Current profile; (b) Temperature profile through the plane of the single cell vs time; (c) Temperature profile at the end of discharging through the thickness direction.
Download figure:
Standard image High-resolution image
Conclusions
A thermal model is developed from the physics-based reduced-order electrochemical model to estimate the HGR of the battery and the results are validated against experimental data. Then a detailed analysis of the HGR is conducted using the validated thermal model. The analysis has shown that the dominant heat sources of the battery are caused by the contact resistance, migration of the ions within the electrolyte phase, change of entropy, and the difference in the ion concentration within active material particles. Those sources vary with different operating conditions. Therefore, the effects of the C-rates and temperatures on the overall HGR are investigated. The entropic HGR is proportional to the C-rate and its sign depends upon the charging or discharging process. Additionally, the irreversible HGR has a quadratic dependency with the C-rate. Consequently, the entropic heat is dominant at low C-rates, while the irreversible heat becomes dominant as the C-rate increases. In addition, at the same C-rate, the magnitude of total heat during discharging is always greater than that during charging due to the entropic heat and higher charge transfer resistance. It has also been shown that lowering temperature rapidly increases the irreversible HGR because of increased overpotentials, however, the entropic HGR is not affected significantly by the temperature. This paper demonstrates that a physics-based electrochemical thermal model can be used to analyze the effects of operating conditions of various C-rates and temperatures on the HGR which could be used to optimize thermal management systems with respect to cost and efficiency. Future work includes an extension of the thermal model to a multi-dimensional model considering degradation effects at the middle-of-life and end-of-life.
Appendix. A: Summary of heat sources
| Electrode |

|
||
| Charge transport | Migration | Electrolyte |

|
| Diffusion | Negligible | ||
| Overpotential | Activation |

|
|
| Concentration |
|
||
| Ohmic | Contact resistance |

|
|
| Ionic resistance | SEI |

|
|
| The actual power to the battery |
![$\displaystyle \int {j}^{Li}\left[{U}_{eq}\left({c}_{s,surf}\right)\right]dv$](https://content.cld.iop.org/journals/1945-7111/167/12/120503/revision2/jesaba96bieqn21.gif)
|
||
| Change of enthalpy | Change of entropy |

|
|
| Delivered energy |
![$\displaystyle \int {j}^{Li}\left[{U}_{eq}\left({c}_{s,ave}\right)\right]dv$](https://content.cld.iop.org/journals/1945-7111/167/12/120503/revision2/jesaba96bieqn23.gif)
|
||
| Heat capacity |

|
||
| Heat of mixing |
![$\tfrac{\partial }{\partial t}\left[\tfrac{1}{2}F\displaystyle \frac{\partial \left({U}_{OC}-Td{U}_{OC}/dT\right)}{\partial {c}_{s}}\right]\displaystyle \int {\left({c}_{s}-{c}_{s,ave}\right)}^{2}dv$](https://content.cld.iop.org/journals/1945-7111/167/12/120503/revision2/jesaba96bieqn25.gif)
|
||
Appendix. B: Summary of FOM and ROM
| Cell dynamics | FOM | ROM |
| Ion concentration |
|
|
| in electrode | ||
| Ion concentration |
|
|
| in electrolyte | ||
| Ohm's law in electrode |
|
|
| Ohm's law in electrolyte |

|
|
| Electrochemical Kinetics |
![${j}^{Li}={a}_{s}{i}_{0}\left\{\exp \left[\displaystyle \frac{{\alpha }_{a}nF}{RT}\eta \right]-\exp \left[-\displaystyle \frac{{\alpha }_{c}nF}{RT}\eta \right]\right\}\,$](https://content.cld.iop.org/journals/1945-7111/167/12/120503/revision2/jesaba96bieqn34.gif)
|
|
| SOC |
|
|