
Abstract
Striking mechanical and morphological similarities of the stress corrosion cracking (SCC) of carbon steel in ethanolic media with those governed by a cleavage-like mechanism in CO-CO2 aqueous solutions, prompted the investigation of the possibility of ethanol electrochemical oxidation into CO on ferrite (Fe) and cementite (Fe3C) surfaces. Density functional theory computations on (110) surfaces reveal that the catalytic activity of Fe and Fe3C through the α dehydrogenation pathway can significantly reduce the energy barrier of electro-oxidation of ethanol and production of CO to 0.575 and 0.480 eV, respectively. These first principle calculations indicate that at the anodic potentials applied during potentiostatic slow strain rate testing, ethanol electrooxidation to CO is thermodynamically viable on carbon steel, giving further credit to the involvement of cleavage type SCC of carbon steel in ethanolic environments.
Export citation and abstract BibTeX RIS

This is an open access article distributed under the terms of the Creative Commons Attribution 4.0 License (CC BY, http://creativecommons.org/licenses/by/4.0/), which permits unrestricted reuse of the work in any medium, provided the original work is properly cited.
Transgranular cleavage type stress corrosion cracking (SCC) of carbon steel occurs in a very particular set of environments. Anhydrous liquid ammonia, anhydrous ammonia-methanol1–5 and CO-CO2-H2O6 are the key systems to be considered, apart from alcohols.7 The important factor proposed to connect these examples is embrittlement by interstitial species. Analogous to hydrogen embrittlement of steels, nitrogen, carbon, or even oxygen, though not at ambient temperature, could also cause embrittlement.8 The nitrogen or the carbon produced on the surface of iron via ammonia oxidation or CO reduction (dissociative adsorption) can diffuse into steel and assume interstitial positions and adversely affect the local mechanical properties at the crack tip, which could negatively affect the mechanical properties of the structure. Carbon, for instance, could form a brittle phase (cementite Fe3C) within the ferrite structure by reacting with iron. However, the embrittlement effect is highly local since, at ambient temperature, these interstitial species can diffuse only a few nm in a likely interval between crack advance events.2,8 It has been shown that the transgranular SCC in CO-CO2-H2O has a direct relationship with dissolved CO concentration and applied anodic potential.6,9,10 Additionally, it has been observed that the potential range of susceptibility to SCC is where maximum adsorption of CO occurs.6
Through the widespread usage of fuel grade ethanol (FGE), SCC of carbon steel in ethanolic environments has become an important topic in the field of corrosion. The primary study and report of SCC of carbon steel in ethanolic solutions go back to the 1980 s.11 The first comprehensive study on this topic was sponsored by the American Petroleum Institute and published in 2003.12 Since then, failures of ethanol pipes and tanks have been reported along with investigations on possible mechanisms of SCC in ethanolic environments and methods to prevent it. It has been reported that the factor that was found to have the most significant effect on causing SCC was corrosion potential, as influenced by oxygen. Reportedly, the critical potential window of SCC ranges from +0.025 V vs saturated calomel electrode (SCE) to +0.300 VSCE depending on the presence of chloride and methanol as impurities.13–16
Previous studies on in-service carbon steel pipes transporting FGE have reported only intergranular SCC.15 However, transgranular cracks have also been detected in laboratory experiments where the SCC of carbon steel has been studied electrochemically by slow strain rate testing (SSRT) in ethanolic environments.17–21 Speculations on the possible role of hydrogen embrittlement have been refuted in a review paper by one of the authors, arguing that the reported transgranular cracking has occurred under much milder mechanical conditions than any known form of hydrogen embrittlement in ordinary carbon steel.22
Several studies have reported that are said to support a slip dissolution mechanism for alcohol-induced SCC of carbon steel.23–25 Kane et al.23 showed that removing the dissolved oxygen gas from FGE mitigates the SCC susceptibility of carbon steel. Moreover, the presence of chloride ions has been found essential in FGE-SCC of carbon steel.7,26,27 Lou et al.7 showed that both crack density and velocity increased as the potential increased within the tested range. Because the potentials within this range were closely related to the dissolution kinetics, initiation and propagation of these corroded cracks were strongly controlled by the anodic polarization. Such observations, according to the conventional view of SCC mechanisms, point to slip dissolution as the underlying SCC mechanism, where cycles of anodic dissolution followed by plastic deformation and the consequent exposure of fresh surface govern the crack propagation.
Mechanical and morphological similarities between transgranular ethanol SCC of carbon steel with cleavage type SCC in CO-CO2-H2O and anhydrous ammonia environments suggest that slip dissolution may not be the only ethanol SCC mechanism operating.22 The observation of closed sharp transgranular cracks in a recent in situ electrochemical SSRT study by the authors, where the advanced characterization of the crack tip and the crack walls showed no trace of corrosion, further strengthened the possibility of the involvement of a cleavage type SCC mechanism in ethanolic environments.28 Newman proposed the possibility of electrochemical oxidation of alcohols in the cracks that could lead to CO production.22 He hypothesized that similar to CO-CO2-H2O SCC, further local carburization, at the crack tip, could embrittle the structure and promote SCC via a film-induced cleavage type mechanism.
Analogous to CO-CO2-H2O systems where the SCC of carbon steel only occurs in a specific range of potential in which the adsorption of CO on the surface is significant, in ethanolic systems the SCC has also been detected in a particular anodic potential range.6,7,16 Studies on direct-ethanol fuel cells reveal a pH-dependent potential range in which ethanol electrooxidation to CO2 is viable on platinum surface, which compares quite favorably with the SCC threshold potential.29–33 Moreover, ethanol adsorption on Pt has been found to be dissociative, i.e., the C-C bond is broken almost instantaneously, requiring only small overpotentials.30
The equilibrium potential for ethanol electrooxidation to CO2 on Pt at an OH− activity of 1 (pH = 14) is reported as −0.770 vs standard hydrogen electrode (SHE).29 According to the Nernst equation, at neutral pH, this equilibrium potential would shift about 0.420 V (∼7 × 0.060 V) more positive, i.e. −0.35 VSHE. On the other hand, in another study at pH close to 0 using a Pt-based nanoparticle catalysis, the complete oxidation of ethanol is found to start at +0.450 VRHE (which is close to SHE in the conditions of the experiments).30 Thus, at pH = 7, this potential would shift by ∼0.420 V toward more negative potentials, i.e. to be around +0.030 VSHE. In other words, for complete oxidation of ethanol at neutral pH, this simple estimation suggests that an anodic overpotential (i.e. the difference between the equilibrium potential and the applied potential) of about 0.380 V is required (∣−0.350–0.030∣ = 0.380), which is within the range of ethanol SCC threshold potentials.
Despite all the efforts to inquire into carbon steel SCC in ethanolic environment and methods to prevent it, there is a lack of conclusive investigation on the possibility of ethanol oxidation during carbon steel SCC. Cao et al.17 reported no detection of possible ethanol oxidation products such as aldehydes and ketones using 2,4-dinitrophenylhydrazine reagent during the SCC of steel in FGE. However, the detection of the intermediate products of ethanol oxidation, especially with extremely low concentrations, is complicated, and the lack of observing such intermediates cannot conclusively reject the possibility of electrochemical oxidation of ethanol during carbon steel SCC.
We know little about the possible effect of near-surface embrittlement on the propagation of a crack in the SCC of carbon steel in ethanol, and research on such surface effects is still an important part of understanding the mechanism of SCC in such environments.
An alternative way to approach the question of the possibility of alcohol oxidation under the experimental conditions is through ab initio simulation. Even though a direct connection between the calculated energy levels through density functional theory (DFT) and the experimental electrochemical potentials is not straightforward and beyond the scope of this article, energy barriers for alcohol oxidation can be estimated from the calculated energy levels of the oxidation intermediates. DFT simulation of ethanol oxidation has been extensively studied not only for the aim of designing a suitable catalyst for direct-ethanol fuel cells but also as a model system to understand the degradation mechanism of high molecular weight oxygenates.34,35
Investigations into the catalytic activity of noble and non-noble metals revealed that non-noble metals have lower potential barriers in the desired pathways of CO production compared to those pathways that produce acetic acid.34,36 Miao et al.37 showed that the C–C scission reaction on Ni via *CHCO → *CH + *CO has a lower energy barrier than *CH3CO + *OH → *CH3COOH reaction. Therefore, the main product of ethanol electro-oxidation on Ni would be CO. While on Pt, for example, the energy barriers of these two reactions are more comparable, hence ethanol oxidation would be biased more towards acetic acid production.38–40 The fact that ethanol electro-oxidation is more favored towards CO production on a transition metal like Ni, further motivated us to study similar pathways on steel; specifically, ferrite (Fe) and cementite (Fe3C) surfaces.
In related research on the dissociation of CO on iron, chemisorption of CO on the Fe (211) surface was studied by DFT and single-crystal adsorption calorimetry (SCAC).8 The most stable molecular adsorption state corresponds to CO bound in a three-fold site involving one metal atom from the top layer and two metal atoms in the second layer. Dissociation of CO is found by DFT to be particularly facile on Fe (211), with a dissociation barrier noticeably lower than that for Fe (100) or Fe (111).
The role of surface vacancies and defects in the carburization of Fe (110) has been studied using DFT calculations by Chakrabarty and colleagues.26,41 They reported a decrease in the CO dissociation energy barrier on the surface due to vacancies and surface defects and consequently predicted enhanced carburization.
In this study, using DFT, we investigated the possibility of ethanol electro-oxidation and CO formation on a (110) surface of iron (Fe) and cementite (Fe3C). This understanding should shed light on the mechanism of ethanol SCC and the possibility of ethanol electro-oxidation inside the cracks.
Methods
Experimental procedure
A full description of the experimental procedure regarding the potentiostatic slow strain rate testing (SSRT) of carbon steel in ethanolic solutions can be found in a recent study by the authors.28 A summary of the materials and the methods used in the experiments in which closed sharp transgranular cracks (analogous to those reported in CO-CO2-H2O environments) were detected is mentioned here.
SSRT procedures adhered to the NACE TM0111–2011 standard.42 ASTM A106GB test specimens were machined and used for the experiments. The solutions were prepared with pure dehydrated ethanol containing 2.5 mM LiCl. To increase the conductivity of the electrolyte and facilitate the application of electrochemical measurements, 0.02 M tetrabutylammonium tetrafluoroborate (TBA-TFB) was added to the solutions.43 A silver/silver chloride (Ag/AgCl) electrode immersed in pure ethanol containing 1 M lithium chloride (LiCl) placed in a luggin capillary filled with the testing solution, henceforth referred to as Ref., was used as the reference electrode. The reference electrode had a potential of about −0.035 VSCE when measured in pure ethanol. All samples were pre-strained at a strain rate of 10−5 s−1 until 1.5% elongation. The solution was added at 1.5% elongation, immediately followed by aeration with a 20% O2 − 80% N2 gas mixture and reduction of the strain rate to 10−7 s−1. Then an anodic potential of +0.350 VRef was applied and the experiment was stopped at 3% nominal strain. Additionally, the electrochemical behavior of the samples was studied by cyclic potentiodynamic polarization measurements at 3 mV s−1 in an ethanolic solution containing 2.5 mM LiCl.
Cracks were identified and located via scanning electron microscopy (SEM). Focused ion beam (FIB) was used to extract the cracks for further characterization via transmission electron microscopy (TEM).
Theoretical methodology
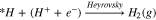
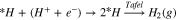
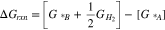
The projected augmented wave (PAW) approach44,45 and the generalized gradient approximation (GGA) of Perdew, Burke and Ernzerhof (PBE)46 employed in the Vienna ab initio Simulation Package (VASP)47 are used to perform all the plane-wave density functional theory (DFT) computations. Iron (Fe) and iron carbide (Fe3C) with the crystalline facet of (110) are considered to study the ethanol oxidation and calculate the adsorption energy of the reaction intermediates. These surfaces are modeled by a slab consisting of three layers (Fig. 1), in which the top layer is allowed to be relaxed due to interaction with the adsorbates, while the bottom two layers are fixed at their optimum crystalline position to resemble the bulk material. Dipole corrections and spin polarization are implemented. DFT-D3 method with Becke-Jonson damping is performed for the van der Waals correction. We set the permittivity constant as 20 (default is 80 for water) to partially capture the solvent effect through the implicit solvent model. Pure ethanol relative permittivity at room temperature is around 24. A vacuum equal or greater than 20 Å with a cut-off energy for the plane wave basis sets of 450 eV and the 2 × 2 × 1 Γ-centered Monkhorst-Pack mesh for the k-points sampling in the first Brillouin zone with a first order Methfessel–Paxton smearing parameter σ of 0.2 eV is considered to ensure that the accuracy in the energy of the system is better than 1 meV. The self-consistent field (SCF) convergence criterion is set to 10−4 eV for electronic iteration and the ionic relaxation continued till the maximum force was less than 0.02 eV Å−1 that was updated by the conjugate gradient approach.
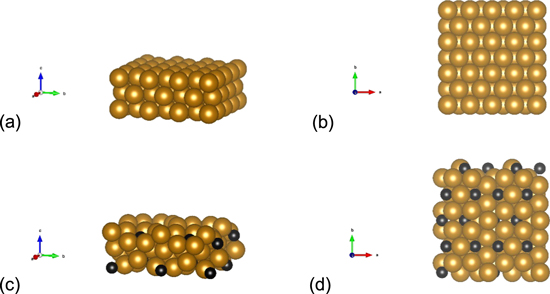
Figure 1. Slabs consisting of three layers. (a) side view Fe, (b) top view Fe, (c) side view Fe3C, and (d) top view Fe3C.
Download figure:
Standard image High-resolution imageTo calculate the adsorption energy of each adsorbate A, we use the following equation:

Where,  is the energy of the system including both catalyst surface and the A adsorbate,
  is the energy of the catalyst surface, and
  is referred to the stable molecular form of the adsorbate A in gas phase. The adsorption energy for each adsorbate (i.e. reaction intermediates) is calculated for a minimum of three different configurations depending on the adsorbate's orientation and available adsorption sites, and the most favourable one with the most negative energy is considered for the calculation of the reaction energy diagram.
Different mechanisms for ethanol oxidation are proposed in the literature,36,48 and the most common pathways are considered in this study. A computational hydrogen electrode (CHE) model49 is used to calculate the energy barrier at each elementary proton-coupled-electron transfer (PCET) oxidation step. In this model, the chemical potential of the proton-electron pair (H+ + e−) is considered to be equivalent to the chemical potential of a hydrogen molecule (H2) at the reference reversible hydrogen electrode (RHE) potential. Calculation of the chemical potential of a sole proton (H+) in a bulk electrolyte with DFT computations is not an easy task and requires considering the waters of hydration and hydration model, which in turn increases the degree of freedom in the computation. Therefore, to simplify the computations and similar to previous studies for calculating the energetics of PCET steps,37,50,51 we determine the energy barrier for an equivalent hydrogenation reaction. Hence, the proton-coupled-electron system was considered to be reduced to a surface adsorbed proton via the following reaction called the Volmer reaction:

which can further undergo either the Heyrovsky reaction (another PCET) or the Tafel reaction (coupling step):
Therefore, the overall reaction is explained as:

The potential under which this reaction (Eq. 5) is in equilibrium (the Gibbs free energy equal to zero) is considered as the equilibrium potential (U0). Thus, the energy barrier can be directly translated to the applied electrochemical bias (i.e. applied potential). However, the effect of parameters such as reaction environment, e.g. cations and anions within the electrolyte, are just partially captured by the implicit solvent model rather than having them explicitly involved in the reaction, and thus it is assumed that these parameters have similar effects on reaction mechanism for both catalysts' surfaces. In addition, it has been shown that chloride can have a significant role on the corrosion process.52 Same rational as for the reaction environment effect is used to assume that the effect of chloride on the reaction mechanism is similar on both catalysts. Therefore, the reported results are valid within these assumptions.
Several reaction mechanisms are proposed to explain the ethanol oxidation, most of which belong to noble catalysts such as platinum which is widely used in direct ethanol fuel cells. The most possible mechanism is that with the minimum reaction energy barrier. Therefore, one needs to find the free energy diagram of each reaction pathway to be able to calculate the reaction free energy ( ). For the following sample PCET reaction,
  is given as:

In these equations, the computational hydrogen electrode (CHE) is used and, thus, the proton-coupled-electron pair is replaced by the hydrogen gas. The Gibbs free energy at room temperature (T = 298.15 K) and ambient pressure ( Pa), by definition, is:

In this equation, H is the enthalpy, U is the internal energy, V is the system volume, E is the DFT electronic structure energy, ZPE is the Zero Point Energy arising from the vibrational energy at 0 K,  is the heat capacity and the relevant integral demonstrates the energy captured by the material from 0 K to room temperature in terms of vibration, rotation and translation, and S is the entropy of the system. To calculate these thermodynamic properties, gas-phase molecules are approximated by an ideal gas, while the adsorbates are treated using the quasi-harmonic approximation. All vibrational calculations are performed using the Atomic Simulation Environment (ASE) code.53 In general, for heterogeneous catalysis, the last three terms in the Gibbs free energy for a solid surface do not change appreciably in the presence and absence of the adsorbates and are cancelled out in the above equations. However, the gas molecules show considerably different vibrational properties and consequently different ZPE, heat capacity and entropy when free or adsorbed. Therefore, these terms are calculated for the adsorbates, and for the solid catalyst the calculated DFT energy is sufficient. Calculated energy barriers for both catalysts are mentioned in the supplementary document Table SI (available online at stacks.iop.org/JES/167/111503/mmedia). For each catalyst and on each reaction pathway, the potential determining step (PDS) which determines the required overpotential to make all the reaction steps downhill is highlighted. Since there are many different pathways proposed for ethanol oxidation and calculation of all vibrational frequencies within a reasonable time is impossible, here in this study, we considered only the DFT energy (E) to obtain the reaction energy diagram. This energy constitutes the major part of the Gibbs energy, and thus, the results are reliable. However, to improve the accuracy of the most favourable reaction pathway attained based on the DFT energy diagram, we included the vibrational frequency to calculate the Gibbs free energy for that reaction pathway. Details of these calculations are given in the supplementary document Table SII.
Results and Discussion
The effect of a wide range of parameters on the SCC of carbon steel in ethanolic environments was investigated in a recent study by the authors.28 More than 80 potentiostatic SSRTs revealed an SCC susceptibility potential window of 0.100 to 0.370 VRef. Relevant reports of SCC in the literature also lie within this potential range.4,10–13 In Fig. 2, this potential window is superimposed on a cyclic polarization scan in a dehydrated ethanol solution (<200 ppm water) containing 2.5 mM LiCl. The increase in the current densities in the reverse scan is attributed to the passivity breakdown, which identifies the SCC potentials above +0.100 VRef as the range of propagation of this localized attack.
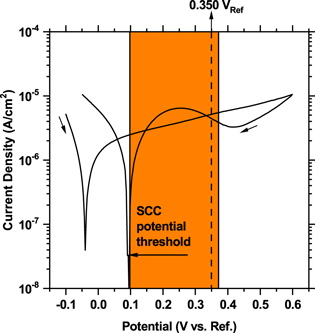
Figure 2. A cyclic polarization scan on carbon steel at 3 mV s−1 in a dehydrated ethanolic solution containing 2.5 mM LiCl. The orange highlight represents the SCC susceptibility potential window. The dashed line at 0.350 VRef marks the potential at which closed sharp transgranular cracks were detected.
Download figure:
Standard image High-resolution imageFigure 3 shows TEM images of a typical closed sharp transgranular crack that has been extracted via FIB technique. The crack is extended for about 4 μm, and the tip of the crack is located in the ferrite phase. Corrosion was not detected at the tip or the walls of the crack. Such cracks bear significant morphological and mechanical resemblance to cleavage type SCC in CO-CO2 aqueous environments. Furthermore, closed sharp transgranular cracks were detected after potentiostatic SSRT at +0.350 VRef (i.e. around +0.556 VSHE, given 0 VRef = −0.035 VSCE, and 0 VSCE = +0.241 VSHE) and 3% nominal elongation in a dehydrated ethanolic solution containing 2.5 mM LiCl. This applied potentials in the vicinity of ethanol electrooxidation to CO on Pt at neutral pH, further giving credit to the hypothesis that ethanol electrooxidation could also occur on the surface of carbon steel and result in CO production, which would cause cleavage type cracking at low elongations upon dissociation on the surface and the local embrittlement of the crack tip by carbon absorption.

Figure 3. Transmission electron microscopy (TEM) images of a typical closed sharp transgranular crack detected after potentiostatic SSRT at +0.350 VRef and 3% nominal plastic strain in a dehydrated ethanolic solution containing 2.5 mM LiCl. The crack was extracted and prepared for TEM via focused ion beam (FIB) technique. Different magnifications are shown to illustrate the corrosion free crack walls.
Download figure:
Standard image High-resolution imageEthanol oxidation has been mainly studied on noble and active non-noble transition metals and their alloys for the direct ethanol fuel cell.36–40,48,54 Despite all variations in the catalytic activity of different transition metals and their alloys, the following outcomes have been observed in these studies: (1) C–C bond scission has a relatively high energy barrier for non-dehydrogenated carbons, as is physically predictable, compared to dehydrogenation of ethanol, and thus, the C–C scission is kinetically unfavorable in the early sequence of the reactions; (2) As the level of dehydrogenation increases and the binding energy of the intermediate adsorbates to the surface increases, the activation energy for the C–C breaking decreases and becomes comparable to the early C–H breaking barriers. Furthermore, the energy barrier for C–O cleavage increases by increasing the level of dehydrogenation. Therefore, in this study, we limit our calculations to those reaction pathways in which C–C bond dissociation occurs in later stages of the oxidation reaction. With that and according to the previously proposed mechanisms for the ethanol oxidation,37,48 we have considered the following two main pathways for the first three steps of the ethanol dehydrogenation (these pathways are schematically shown in Fig. 4):

Figure 4. Reaction pathways with dotted line showing the C–C scission.
Download figure:
Standard image High-resolution imagePathway A (breakage of O–H bond):

|

|

|

|

|

|

|

|

|

|
Pathway B (dehydrogenation of αC):

|

|

|

|

|

|

|

|

|

|
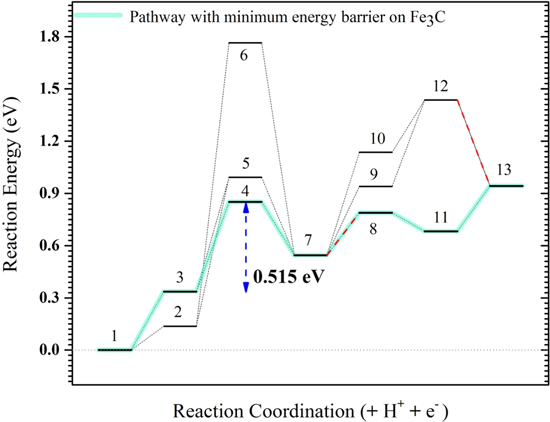
Reactions A3–2 and B3–2 are similar. Up to this stage, there is no C–C bond scission. DFT energies of all the adsorbed intermediates involved in these reactions (and the following steps) are given in Table I, and the reaction energy diagrams (based on the DFT energy, E) are shown in Figs. 4 and 5. We found that the adsorption energy of the species on the surface of Fe3C is significantly lower (i.e. more strongly adsorbed on the surface) than the ones on the surface of Fe. The energy barriers of the reaction pathways remain comparable on both Fe and Fe3C, with the paths on Fe3C exhibiting lower energy barriers by around 51 meV to 160 meV, demonstrating a more catalytic activity of Fe3C for ethanol oxidation compared to Fe.
Table I. DFT energies (in eV) of all adsorbed species. H2 energy used in reaction energy barrier calculations is −6.674 eV.
| Fe (110) | Fe3C (110) | Fe (110) | Fe3C (110) | ||
|---|---|---|---|---|---|
| * | −16.513 | −135.351 | *CH2CHO | −605.318 | −915.913 |
| *CH3CH2OH | −616.469 | −926.604 | *CH2CO | −601.986 | −911.940 |
| *CH3CH2O | −613.728 | −923.085 | *CHCHO | −602.085 | −912.136 |
| *CH3CHOH | −612.487 | −922.886 | *CHCO | −598.421 | −908.257 |
| *CH2CH2O | −610.487 | −918.076 | *CH2 + *CHO | −606.011 | −915.669 |
| *CH3CHO | −609.440 | −918.848 | *CH2 + *CO | −602.675 | −912.394 |
| *CH2CHOH | −609.061 | −918.989 | *CH + *CO | −599.192 | −908.751 |
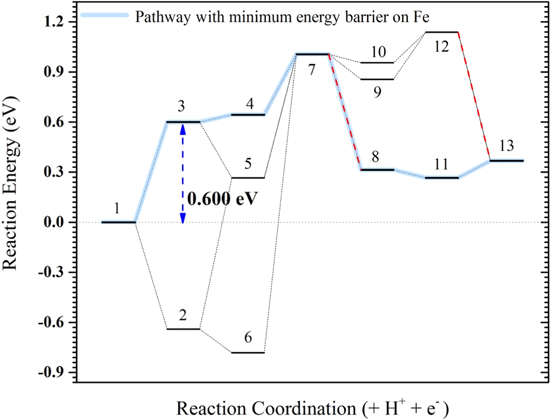
Figure 5. Reaction energy (E) diagram on Fe (110). Blue lines demonstrate the pathway with the minimum energy barrier (i.e. 0.600 eV) and red dash lines demonstrate the non-PCET steps. In this diagram the numbers are: 1: *CH3CH2OH, 2: *CH3CH2O, 3: *CH3CHOH, 4: *CH2CHOH, 5: *CH3CHO, 6: *CH2CH2O, 7: *CH2CHO, 8: *CH2 + *CHO, 9: *CHCHO, 10: *CH2CO, 11: *CH2 + *CO, 12: *CHCO and 13: *CH + *CO.
Download figure:
Standard image High-resolution imageTwo important reaction pathways involving the breakage of O–H bond [pathway A], and dehydrogenation of αC [pathway B] of the adsorbed ethanol are investigated in detail. Even though breaking O–H of adsorbed ethanol interestingly reveals no (negative) or low (small positive) energy barrier (∆E) on both Fe and Fe3C (−0.641 and 0.137 eV respectively), the paths starting with α dehydrogenation are the ones showing the lowest overall energy barrier in both Fe and Fe3C with 0.600 and 0.515 eV, respectively. Modifying these energies for the zero point energy and heat capacity and entropy effects will give the reaction Gibbs energy barrier equal to 0.575 and 0.480 eV for the Fe and Fe3C, respectively (Table SII). In all considered pathways, it is found that the biggest energy barrier is related to one of the first few steps of dehydrogenation, analogous with the results of other researches on other transition metal catalysts.55,56
In pathway B, the first α dehydrogenation of adsorbed ethanol (B1) has a significantly higher energy barrier on Fe (0.600 eV) compared to the one on Fe3C (0.336 eV). Still that reaction, on Fe, leads to the lowest overall barrier of ethanol oxidation if followed by β dehydrogenation (B2-1) with a barrier of 0.600 eV, and the second-lowest if followed by O–H breaking reaction (B2-2) with a barrier of 0.741 eV. On Fe3C, the second dehydrogenation imposes the highest energy barriers, which is either β dehydrogenation barrier of 0.515 eV through the reaction B2-1 or O–H breaking the barrier of 0.656 eV via the reaction B2-2.
In both pathways A and B, the final intermediate in these early stages is CH2CHO adsorbed on the surface. Starting from this intermediate, we have the following three pathways, in which the last pathway (4–3) contains a C–C bond dissociation without any PCET:

|

|

|

|

|

|
For the first two pathways, C–C dissociation occurs later in step 6:

|

|

|

|

|

|

|

|

|

|
Overall, considering the reaction energetics (Figs. 5 and 6) for all of these possible pathways, we observe that the reaction pathways through O–H breaking (pathway A) have significantly higher energy barriers (0.855 and 1.628 eV on Fe3C, and 0.906 and 1.787 eV on Fe) compared to the reaction pathways through αC dehydrogenation (pathway B) (0.515 eV and 0.656 eV on Fe3C, and 0.600 and 0.741 eV on Fe). In all these pathways, the energy barrier on Fe3C is smaller than that on Fe, demonstrating its higher activity toward ethanol oxidation.
Figure 6. Reaction energy (E) diagram on Fe3C (110). Blue lines demonstrate the pathway with the minimum energy barrier (i.e. 0.515 eV) and red dash lines demonstrate the non-PCET steps. In this diagram the numbers are: 1: *CH3CH2OH, 2: *CH3CH2O, 3: *CH3CHOH, 4: *CH2CHOH, 5: *CH3CHO, 6: *CH2CH2O, 7: *CH2CHO, 8: *CH2 + *CHO, 9: *CHCHO, 10: *CH2CO, 11: *CH2 + *CO, 12: *CHCO and 13: *CH + *CO.
Download figure:
Standard image High-resolution image
On the other hand, investigating energy diagrams can give insights to the relative abundance of the intermediates as the intermediates placed in an energy valley are more likely to be observed in the experiment even if they are not in the pathway (before the main barrier). For example, on the surface of iron, CH3CH2O and CH2CH2O would have a higher concentration to be thermodynamically balanced, while they are not involved in the electro-oxidation reaction significantly. Especially, aldehyde, CH3CHO, is not found to be among the most abundant intermediates on either Fe or Fe3C. This can explain why aldehyde was not detected in the experiment by Cao et al.19
Conclusions
Closed sharp transgranular cracks found in potentiostatic SSRT of carbon steel in dehydrated ethanol containing 2.5 mM LiCl at anodic potentials of about +0.550 VSHE, bear significant mechanical and morphological resemblance to cleavage type SCC of carbon steel in CO-CO2 aqueous environments, where it is postulated that carbon absorption into the steel structure results in embrittlement and consequent cleavage cracking. Noticing the overlap of ethanol-SCC threshold potential and the potentials at which complete ethanol electrooxidation occurs on Pt further encouraged us to perform a first-principles calculation of the possibility of ethanol electrochemical oxidation into CO on carbon steel. DFT calculations on (110) surfaces of ferrite (Fe) and cementite (Fe3C) phases resulted in the following conclusions:
- The analyzed ethanol electrooxidation pathways reveal that the production of CO on the Fe and Fe3C(110) surfaces is thermodynamically achievable at the anodic potentials applied in potentiostatic SSRTs.
- Our studies indicate that ethanol can go through a series of reactions mainly by α dehydrogenation followed by a C–C scission of CH2CHO on both surfaces and production of CO in the final stage.
- The energy barrier of ethanol electrooxidation to form CO is found to be lower on the Fe3C(110) surface (0.480 eV) than on Fe(110) surface (0.575 eV), both of which are in the vicinity of the potential applied during the SSRT (0.556 VSHE) at which closed sharp transgranular cracks were detected. It should be noted that the comparison of the applied potential with the calculated barriers is not straightforward. The exclusion of surface defects as well as the effect of straining on the lattice parameters from DFT calculations, along with the simplification in the DFT computations such as ignoring cations and anions, all of which are among the reasons that complicates their comparison with empirical values.
Future work should mainly focus on the use of isotopically labeled carbon (C-13) ethanol in the SCC study of carbon steel and the characterization of closed sharp transgranular cracks with special attention given to the detection of C-13 in the structure at the crack tips. Moreover, the detection of ethanol electrooxidation intermediates using differential electrochemical mass spectroscopy (DEMS) could also assist in the establishment of the proposed mechanism in this study.
Acknowledgments
The authors would like to acknowledge the Natural Sciences and Engineering Research Council of Canada (NSERC) for funding this research. Electron microscopy and focused ion beam work presented here were carried out at the Canadian Centre for Electron Microscopy (CCEM), a national facility supported by McMaster University and NSERC. All computational works are performed on ComputeCanada clusters.