

Abstract
In this paper, the dependency on the metal deformation of the anode and electrochemical performance in an Al-air battery is investigated. We notably find a strong dependency in which the electrochemical performance is significantly governed by the dislocation density of the metal. Three specimens of different dislocation densities are prepared through a cold-rolling press: (і) 3.0 × 10¹⁵ m−2, (ⅱ) 6.5 × 10¹⁵ m−2, and (ⅲ) 19 × 1015 m−2. The peak power densities of the three Al-air batteries show 252, 219 and 174 mWcm−2, respectively. We conclude that the high mechanical properties (i.e., high dislocation density and hardness) are related to the electrochemical performances in Al-air battery.
Export citation and abstract BibTeX RIS
The unprecedented growth in the renewable energy sector and its derivatives has led to continuously increasing needs for energy storage materials and improvements in those materials.1–5 Solar cell and wind power, which produce electricity with relatively high volatility indexes, will always demand greater energy storage devices.6–8 As integral parts of electric vehicles (EVs), a novel improvement is further required to improve the capacity, life-cycle, and cost-effectiveness of energy storage systems.9,10 Electrochemical energy storage, with lithium-ion batteries (LIBs) being a key example as a major player in the industry, has been commercialized in the past decades as one of the most substantial parts of any electric device, ranging from small devices such as smartphones to large scale applications for automobile.11 Unfortunately, due to conventional intercalation chemistry, the energy density of current LIBs could only be increased by a maximum of 30%, reaching a top peak energy density of 400 Wh kg−1.12 In other words, achieving a long-range travel distance (> 1000 km) upon a single charge using EVs is likely to be near-impossible with the current LIBs capability.13,14 Thus, the novel development of a new type of electrochemical energy storage is essential task for the future development of environment sustainability and technological advancement.15
Metal-air batteries have recently attracted increased attention from researchers in pursuit of a new electrochemical energy storage system.16–21 These batteries typically use a pure metal at the anode, a Pt/C-based catalyst at the cathode, and an electrolyte (aqueous and non-aqueous) in order to achieve a complete redox reaction for storing and generating electricity.22 It has been shown that the theoretical specific capacity and energy density of a metal-air battery is at least 3 to 4 times higher than those of lithium-ion technology.23 The electrochemical properties of metal-air batteries, such as precise discharge voltage and low balance potential, were found to be highly suitable for mass-industrial implementations.24 The fact that it uses oxygen as the reactant of the cathode further makes it not only environmentally safe, but also extremely cost-efficient.25 It has been shown that the theoretical energy densities of Li-air battery and Al-air battery can reach as high as 11.4 and 8.1 kWh kg−1, respectively, which stand at almost the same level as that of conventional petrol fuel.26,27 In the discussion of Al-air batteries, this type of metal-air battery is becoming increasingly prominent compared to other metal-air batteries due to its superior energy density, size-to-weight ratio, recyclability, and cost-effectiveness in production.14,28–32


where reactions 1 and 2 occur at the anode and the cathode, respectively, and the total reaction can be expressed by reaction 3. The most common obstacles are the parasitic corrosion and hydrogen evolution that naturally occur in aluminum metals, which have both been shown to conclusively promote self-discharge and decrease the efficiency of the battery.33 Another shortcoming of the Al-air battery is the naturally irreversible discharge reaction on the anode.17 Several studies have aimed to enhance the performance of the anode in efforts to increase the electrochemical performances of Al-air batteries.30,33–36 Investigations into the effect of chemical composition on the anode component have also been conducted in order to observe the application feasibility of anode with ultra-high purity or minor alloying elements.30,33,37 Other studies have attempted to explore the relations between the microstructures of the anodes with the corresponding electrochemical properties. It has been observed that, in aluminum anodes, the crystal orientation and grain size substantially affect the performance of the battery.28,29 It has also been shown that a finer grain size of Al substantially increases the specific capacity and energy density in Al-metal battery by 41.5% and 55.5%, respectively.29 Nonetheless, we highly believe that our understanding of the fundamental relationship between the electrochemical performance and physical properties of metals remain insufficient and far from making a breakthrough.
In this study, we analyzed the strong dependency between the metal deformation parameter and the electrochemical performance of an Al-air battery. We found that the dislocation density within the metal strongly influences the charge transfer reaction at the anode, resulting in higher performance in the case of low dislocation density of the metal at the anode.
Experimental
A schematic describing the process flow to obtain Al specimens with different amounts of dislocations is shown in Fig. 1. The pure Al specimen was fabricated through a conventional melting technique with a tube furnace using Al shot (Part#:00632. Alfa Aesar, USA) with 99.9% purity. As shown in Fig. 1a, the melting process was conducted at 800 °C under an inert 97% Ar + 3% H2 atmosphere with a flow rate of 400 sccm. The Al shot was melted in a bowl-shape alumina crucible. In order to remove slag during melting, manual stirring using a Fe wire was performed every 15 min before it was poured into a cylindrical copper mold with a diameter of 15 mm. As shown in Fig. 1b, the ingot was initially cold-rolled with thickness reduction of 50% into a specimen with a final thickness of 7.5 mm, followed by heat treatment at 400 °C for 1 h to promote a fully recrystallized Al microstructure (see Fig. 1c). The recrystallized Al specimen was later given another deformation using the cold rolling method to obtain deformed-Al specimens with different thickness reductions of 20% and 50%; specimens with different amount of dislocations were obtained by varying the thickness reduction during cold-rolling. Figures. 1c–1e show the elongation of the grain as more deformation was applied on the specimen. Recrystallized Al, thickness reduction of 20%, and thickness reduction of 50% are referred to as Al-A (Fig. 1c), Al-20 (Fig. 1d), and Al-50 (Fig. 1e), respectively.
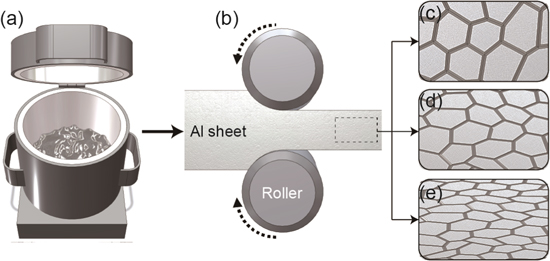
Figure 1. Process flow of deformed Al specimens: Al-A, Al-20 and Al-50.
Download figure:
Standard image High-resolution imageA scanning electron microscope (SEM, SU-70 Hitachi, Japan) equipped with electron backscatter diffraction (EBSD) was used to examine the microstructures of all specimens. In EBSD analysis, step sizes of 1, 0.7, and 0.2 μm were used for Al-A, Al-20, and Al-50, respectively. The EBSD data were then analyzed, and kernel average misorientation (KAM) calculation was used to determine the amount of deformation by measuring the dislocation density, then construct the subsequent dislocation map for each specimen.
Figures 2a and 2b show the deformed Al anode and set-up used for these experiments, respectively. The Al anode was immersed in the electrolyte, 4 M NaOH (Samchun, 98% NaOH, Korea) with 0.05 M Na2SnO3 (Aldrich, 95% Na2SnO3, USA) as a corrosion inhibitor. The catalyst at the cathode was coated on Teflon-coated carbon paper using an electrospray method. First, the Pt/C + IrO2 (50 wt%) was disprsed in ethanol and isopropyl alcohol with 5 wt% Nafion solution (Aldrich 274704, USA). Second, the catalyst solution was placed in a syringe with a positively charged capillary tip. Next, a voltage of 8 kV was applied between the syringe needle tip and the carbon paper using a high-voltage power supply (Korea Switching, Korea). The composite droplets were then electro-sprayed from the needle at 3.0 ml h−1 and collected on the aluminum foil. Finally, the solvent (ethanol and isopropyl alcohol) was dried at room temperature prior to the cell test, and the catalyst loading density was 1 mg cm−2. Polarization curves were obtained by linear sweep voltage at a scan rate of 10mV s−1 from open circuit voltage (OCV) to 0 V.
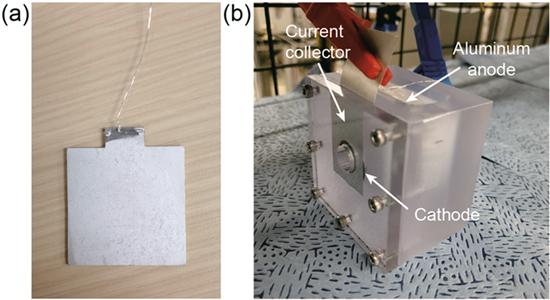
Figure 2. Tested Al specimens and experimental set-up.
Download figure:
Standard image High-resolution imageResults and Discussion
A comprehensive analysis of the microstructure was conducted using EBSD in order to understand the characteristic behaviors of the deformation and heat treatment on all specimens. As shown in in Fig. 3a, the image quality (IQ) and inverse pole figure (IPF) maps of the Al specimens show coarse grains as well as fully recrystallized microstructures following the initial annealing at 400 °C for 1 h. Figure 3b shows that the elongated grains, which are under the thickness reduction of 20%, are formed by post-processed cold-rolling. Consequently, Fig. 3c shows that not only the elongated grains but also the microstructures are observed under severe plastics deformation, which is under the specimen thickness reduction of 50%. Although the IQ and IPF maps clearly distinguish between the pristine (i.e. recrystallized condition, see Fig. 3a and deformed specimens (see Figs. 3b and 3c), these quantitative analyses show the dependency between the metal deformation and the grain elongation. In particular, KAM distribution is strongly related to dislocation density inside a grain of the deformed or pristine microstructures.38,39 This distribution is obtained through EBSD analysis and used to quantify the dislocation density. Kubin et al. reported that the KAM value ( ), step size (
 ), and burger vector (
 ) of the matrix element could be used to calculate geometrically necessary dislocation (GND) density (
 ) using the following equation40:

The dislocation density is calculated on each point of the KAM map with a misorientation angle below 2°. Subsequently, the dislocation maps of all of the specimens are constructed using MATLAB (The MathWorks, Inc., USA), as shown in Figs. 3d–3f. The dislocation maps clearly show that the dislocation density increases significantly when additional deformation is applied on the specimens. In several regimes shown in red in Figs. 3e and 3f, cell structure with high density of dislocation after certain deformation can be observed. Figure 4a shows the detailed distributions of the dislocation density on each specimen. It is believed that the majority of the dislocation density value increases with a rise in deformation, as indicated by the peak shift of dislocation density shown in Fig. 4a. The Al-A specimen has a dislocation density value of 3.0 × 10¹⁵ m−2, which gradually increases to 6.5 × 10¹⁵ m−2 at the specimen thickness reduction of 20% (Al-20). The dislocation density finally reaches approximately 19 × 1015 m−2 in the specimen thickness reduction of 50% (Al-50). The fact that overall dislocation density, which is a crucial strengthening mechanism in metallic materials,41 was increased with thickness reduction indicates that the mean value of hardness linearly esc alates with increasing dislocation density, as shown in Fig. 4b.
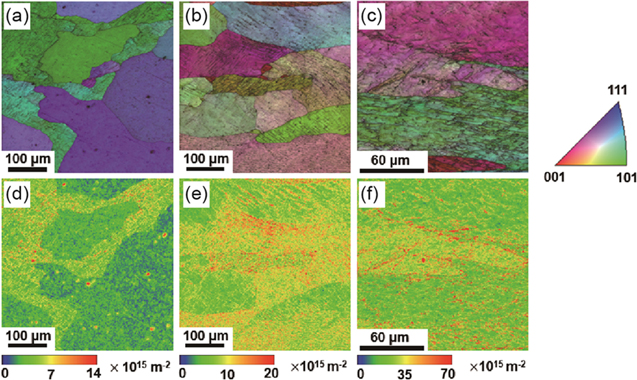
Figure 3. Image quality (IQ) and inverse pole figure (IPF) maps of (a) Al-A, (b) Al-20, and (c) Al-50; Dislocation maps of (d) Al-A, (e) Al-20, and (f) Al-50.
Download figure:
Standard image High-resolution image
Figure 4. (a) Distribution of dislocation density value, (b) mean value of dislocation density and Vickers microhardness of each specimen.
Download figure:
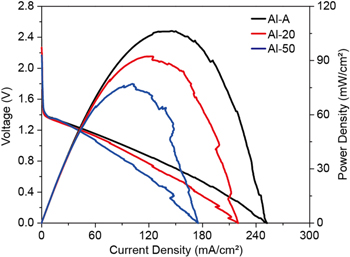
Standard image High-resolution imageFigure 5 shows the I-V-P results, which indicate that the peak power densities of the Al-A, Al-20, and Al-50 specimens are 252, 219, and 174 mWcm−2, respectively. The OCVs of these specimens are over 2.5, 2.25, and 2.2 V, respectively. The initial voltage drops from 2.4 V to 1.4 V occur in the three cases. It is believed that these common behaviors can be attributed to the partial hydrogen evolution reaction (HER) at the cathode. Previous studies have reported the initial voltage drop as a polarization loss in a typical Al-air system.33
Figure 5. I-V-P curves of three specimens: Al-A, Al-20 and Al-50.
Download figure:
Standard image High-resolution image
We also suspect that the additional overpotenti.al at the localized cathode area is due to the low oxygen vapor pressure or sluggish oxygen transport, resulting in a hydrogen evolution reaction. However, for our study, these common behaviors at the cathode can be negligible. As discussed above, the Al specimens have different deformation ratios (i.e., dislocation densities). These controlled parameters strongly influence the electrochemical characteristics of the Al anode side and the cathodes are exactly the same. Based on the results of these experiments, two possibilities should be considered: grain size and dislocation density.42 Zhu et al. reported that the grain size is strongly correlated with the cycling capability and the grain size.43 Aung and Zhou reported that the grain boundary acts as a physical corrosion barrier.44 Small grain size creates more grain boundaries, as a consequence, the rate of corrosion in small-grained microstructure slowed down. Especially, their group exhibited the corrosion rate was found to be increased by 30% with increase in the average grain size from 65 μm to 250 μm. Also, Afshari et al. reported that the corrosion resistance of Fe in alkaline solution considerably increased as the grain size decreased from microcrystalline to nanocrystalline.45 In this test, the pre-processing used to control the microstructures is the same, in which the grains are roughly the same. The other factor is the controlled dislocation density of the Al specimen. As shown in Fig. 5, Al-air battery with superior mechanical property (i.e. microhardness) exhibited relatively lower power density. Hamu et al. reported the correlation between the corrosion characteristic and the dislocation density of Al based alloy.42 The dislocation density was increased after the severe plastic deformation process (see Fig. 1), and the acceleration in the corrosion rate was correlated with the massive plastic strain imposed. It is therefore believed that the corrosion characteristics of the anode metal strongly correlate with anodic overpotential of metal-air system. As shown in Fig. 5, the dislocation within Al metal at the anode would lead to a sluggish reaction of metal oxidation.
Conclusions
We investigated variations in electrochemical performance with respect to the dislocation density of Al at the anode of the Al-air battery. The pristine Al specimen with minimized deformation has a superior electrochemical performance compared to that of the deformed Al specimen, which we controlled by thickness reduction of 20% and 50%. In addition, we found that a high mechanical property of the processed metal would suppress the electrochemical behaviors of metal oxidation in metal-air battery. Since the metal behaviors at the anode for metal-air system still uncover, we will optimize the metal microstructure to enhance the electrochemical performances of the metal-air battery as a future work.
Acknowledgments
This work was supported by the Mid-Career Researcher Program (NRF-2018R1A2A1A05077532) through the National Research Foundation of Korea (NRF), funded by the Ministry of Science ICT and Future Planning. This work was also supported by NRF Grant (2017R1C1B501818 and NRF-2018-Global PhD Fellowship Program).