
Abstract
Metal dissolution and redeposition are considered to be the most important degradation mechanism for Pt-based fuel cell electrocatalysts. Understanding key factors mitigating the dissolution and migration under realistic proton-exchange-membrane (PEM) fuel cells is crucial for improving their performance and durability. Using ordered and disordered PtCo electrocatalysts, we address how structural ordering and particle size can affect the dissolution of Co/Pt and their redeposition into the membrane upon catalyst accelerated durability test in PEM fuel cells by statistical scanning transmission electron microscopy (STEM) and spectroscopic analysis. Consistent with the improved performance and durability, we observe that both Co and Pt dissolution were mitigated in the ordered PtCo catalyst compared to the disordered one. The suppressed Pt dissolution was evidenced from the relieved particle coarsening and significantly suppressed Pt redeposition/migration in the membrane after the durability test. Moreover, we reveal an optimum particle size range between 2–5 nm for ordered PtCo catalysts, which favors the highest structural ordering degree and hence the highest retention of Co. These results provide a rationale for implementing ordered Pt intermetallic electrocatalysts in PEM fuel cells and further particle size optimization for improved durability.
Export citation and abstract BibTeX RIS

This is an open access article distributed under the terms of the Creative Commons Attribution 4.0 License (CC BY, http://creativecommons.org/licenses/by/4.0/), which permits unrestricted reuse of the work in any medium, provided the original work is properly cited.
Developing high performance and durable platinum (Pt) based electrocatalyst for oxygen reduction reaction (ORR) is important for the commercialization of proton exchange membrane (PEM) fuel cells.1,2 Platinum alloys with transition metals (TM) such as Co, Ni or Fe have been extensively studied demonstrated substantially enhanced activities originated from an optimized strain/ligand effect.1–5 In particular, Pt-Co catalysts have been commercially used in the Toyota Mirai fuel cell vehicles.6 However, the durability of Pt alloy catalysts in membrane-electrode-assembly (MEA), the heart of PEM fuel cells, still remains a great challenge.
Recent studies have shown a substantial leaching of the less noble metals (such as Co, Ni) during long-term ORR electrocatalysis, which becomes one of the most important mechanisms for the performance decay of Pt alloys catalysts.7,8 To mitigate the leaching of the less-noble transition metals, extensive efforts have been made by optimizing the particle size,9,10 or by utilizing pre-leaching protocols and post-acid-leaching annealing.11,12 Besides these conventional effects, it is of particular interest to develop structurally-ordered Pt intermetallic catalysts, which are inherent of increased Pt-TM bonds, enhanced Pt-TM interaction, and hence improved ORR activity and stability compared to disordered Pt alloys.13–20 This has been confirmed by a number of durability studies mainly in half-cell tests using rotating disk electrode configuration,13–15,18–20 yet few works were conducted by single cell measurements of MEAs.16,17 It should be noted that catalyst stability in half-cell tests could be far different from those under the operation conditions of PEM fuel cells.21 Although instability mechanisms of Pt and disordered Pt alloy catalysts in MEAs have been studied,7,8,22–26 the morphological and structural changes of Pt intermetallic catalysts under PEM fuel cell operation conditions and their particle size dependence are still largely unexplored, which hinders further improvement of their performance and stability.
Besides the dissolution of the less noble metals, Pt dissolution and re-deposition can be also triggered during long-term operation particularly under extensive potential cycling.27 Dissolved platinum from smaller particles can redeposit onto larger ones, leading to the well-known Ostwald-ripening process.25,28 The Ostwald-ripening, combined with particle coalescence, resulted in an overall particle coarsening that constitutes another important reason for the activity drop of Pt-based catalysts in MEAs.25,28 In addition, dissolved platinum can be also reduced by crossover hydrogen gas, thus redepositing in the membrane and forming a "Pt band."8,29 A direct consequence of the formation of Pt band is the direct loss of Pt for active ORR electrocatalysis since the Pt band is isolated from the cathode. This Pt band will also mechanically stiffen and chemically decompose the membrane, and it may also slower the proton conduction during PEM fuel cell operation.30–32 The Pt dissolution and redeposition has been reported as a general degradation mechanism not only for pure Pt but also for Pt alloy catalysts.8 Ways to suppress the Pt dissolution and the associated formation of Pt bands are still very limited; a similar Pt mass loss to the membrane regardless of catalyst and carbon support types was reported.8 Although Pt-based intermetallics have been shown improved retention of the less-noble metals, impact of structural ordering on the extent of Pt-dissolution and the associate formation of Pt-band in realistic PEM fuel cells still remain unknown.
This paper reports the first comparative study on the structural degradation of chemically ordered and disordered PtCo catalysts under PEM fuel cell operation conditions to elucidate the impact of structural ordering on the metal (Pt/Co) dissolution and re-deposition in MEAs. We performed statistical microscopic analysis of the particle composition and the core–shell compositional fine structure of the ordered and disordered PtCo catalyst before and/or after the durability test as a function of the particle size, thus revealing the impact of structural ordering on the metal (Co) dissolution and its size dependence. This helps disclose potential pathways to further improve the durability of ordered Pt-based catalysts by optimizing the particle size. In addition, the extents of Pt dissolution and redeposition in the membrane (the formation of Pt band) in the MEA using ordered and disordered PtCo catalysts were also compared and benchmarked with commercial Pt catalysts, shedding light on the impact of structural ordering on the extent of Pt dissolution/redeposition in MEA. These results provide important clues to mitigating metal dissolution and redeposition of Pt alloy catalysts in realistic PEM fuel cells toward improved durability.
Experimental
Preparation of disordered and ordered PtCo catalysts
The synthesis of PtCo nanoparticles (NPs) was carried out by a previously-reported organic phase reduction method.19 In a typical synthesis, 0.3 mmol Co acetylacetonate (Co(acac)2), 25 mg tetradecanediol (TDD), 0.2 ml oleylamine and 0.2 mL oleic acid were added to 15 mL benzyl ether in a three-necked flask and then heated at 100 °C for 1 h. The solution was then heated to 200 °C followed by injecting 0.1 mmol platinum acetylacetonate (Pt(acac)2) in 0.75 ml dichlorobenzene. The whole solution was reacted at200 °C for 1 h in Ar. Afterwards, 20 ml of absolute ethanol was added and the NPs were isolated by centrifuged at 8000 rpm for 10 min. The collected NPs were then re-dispersed in 15 mL hexane and mixed with 90 mg Vulcan XC carbon black under sonication (10 min) to meet a nominal Pt content of 15 wt%. The prepared carbon-supported PtCo catalyst was firstly heated under air at 180 °C for 1 h to remove residual organic surfactants and then annealed under 4% H2 in Ar at 400 °C for 4 h to obtain the disordered PtCo catalyst (denoted as PtCo/C-400). Ordered PtCo catalyst (denoted as PtCo/C-600) was prepared by further annealing at 600 °C under 4% H2 in Ar for 4 h and naturally cooled down to room temperature.
Catalyst ink and MEA preparation
Prior to be used in MEAs, both ordered and disordered PtCo/C catalysts were pre-leached in 0.1 M H2SO4 at 70 °C for 24 h. The alloy composition and metal contents in the leached catalysts were measured by inductively coupled plasma atomic emission spectroscopy (ICP-AES). Catalyst inks were prepared by ultrasonically mixing the catalyst powder, the ionomer solution (5 wt% Nafion, DuPont, D-520) and isopropanol (IPA) for 30 min, with the ionomer to carbon weight ratio of 0.65 (corresponding to an ionomer content of 35 wt% in the PtCo catalyst layers). A 190 μm thick carbon paper (Toray, TGP-H-060, 2 × 2 cm2) with an 80 μm thick microporous layer (MPL) coated on top was used as the gas diffusion layer. Catalyst layers were then painted on the MPL at a Pt loading of ∼0.1 mg cm−2 at the cathode. A commercial 20 wt% Pt/Vulcan catalyst (Johnson Matthey, JM 3000) was used as the anode catalyst and loaded on the MPL at a Pt loading of ∼0.06 mg cm−2. The precise Pt loading was determined by weight increment of the electrode before ink painting and after drying (Table SI). Nafion 211 membrane (DuPont) was used as the proton-exchange membrane, which was pre-cleaned by boiling in 3% hydrogen peroxide solution for 1 h, then rinsed with boiling ultrapure water (Millipore, 18 MΩ), boiled in 0.5 M sulfuric acid for 1 h, and rinsed with boiling ultrapure water for another 1 h. MEAs with an active geometric area of 2 × 2 cm2 were then assembled by hot-pressing at 125 °C for 3 min under the pressure of 5 MPa. MEAs prepared using the leached PtCo/C-400, the leached PtCo/C-600 and the commercial Pt catalysts are denoted as MEA-PtCo/C-400, MEA-PtCo/C-600 and MEA-Pt, respectively.
MEA test
Current-voltage (I-V) polarization tests were performed at 80 °C and 100% relative humidity (RH) with the H2/O2 gas (99.999% purity) purged through the anode and cathode, respectively, at a flow rate of 200 sccm and a back pressure of 1.5 MPa. Prior to the initial current-voltage polarization tests, all MEAs were conditioned at a constant current density of 4 A cm−2 for 3–4 h. The I-V polarization curves were obtained by measuring voltages at different constant current densities for 40 s, starting from 4.0 A cm−2 to open circuit. The electrochemical surface area (ECSA) of Pt in the MEA cathode was measured by cyclic voltammetry (CV) between 0.1 and 1.0 V at 100 mV s−1 at 40 °C, with H2/N2 gas purged through the anode and cathode, respectively. Catalyst accelerated stress tests (AST) were conducted by voltage cycling between 0.6 V and 1.0 V at 50 mV s−1 for 10 000 cycles, at 80 °C and 100% RH.
X-ray diffraction (XRD)
XRD patterns were collected on Bruker D8 Advance with Cu Kα radiation. The scanning range was 20–90° at a scanning speed of 5°/min.
Transmission electron microscopy (TEM)
For the as-prepared catalyst powders, TEM samples were prepared by directly dipping the catalyst onto a 200-mesh Cu grid with holey carbon film. For the aged catalysts in MEA, cross-sectional specimens were prepared. In brief, a small strip was cut from the MEA and embedded in Epon 812 epoxy resin, which was then cured at 80 °C for 24 h. Then, the epoxy block was trimmed at room temperature using Leica EM TXP system. Finally, thin sections with a thickness of ∼100 nm were cut using a diamond knife on a Leica EM UC7 ultramicrotome and then transferred to a 50 mesh Cu grid.
High-angle annular dark field (HAADF) scanning transmission electron microscopy (STEM) and statistical energy-dispersive X-ray spectroscopy (EDX) composition analysis were performed on a FEI Tecnai G2 F30 300 kV field-emission transmission electron microscope equipped with an 80 mm2 SDD EDX detector (Oxford Instrument). The EDX composition analysis of individual NPs with varying sizes was performed by elemental mapping of the selected NPs under STEM mode with the spot size of 6, where the NP composition was determined by the integrated spectra. Electron energy loss spectroscopic (EELS) elemental mapping of Pt-Co NPs was conducted under STEM mode with the spot size of 6, the smallest condenser aperture and the cameral length of 80 mm on a Gatan Quantum GIF 965 dual EELS spectrometer. The entrance aperture diameter of the GIF was 5 mm. The M-edge of Pt and the L-edge of Co were simultaneously acquired at a dwelling time of 100 ms/pixel with the auto-drift correction.
Result and Discussion
Platinum alloys nanoparticles produced by wet-chemical methods are usually disordered face centered cubic structures. To recover the structurally ordered phase revealed by thermodynamic phase diagrams, a high temperature annealing (typically above 500 °C but below the phase-transition phase temperature) is usually necessary to enable a kinetically fast atomic diffusion.33 X-ray diffraction (XRD) analysis (Fig. 1a) confirms that the PtCo/C-400 catalyst and the PtCo/C-600 catalyst exhibit disordered face-centered cubic structure and ordered intermetallic structure, respectively. The latter shows a weak superlattice diffraction peak assigned to the {110} planes, which is characteristic of the ordered phase. The intensity of the 110 diffraction from the PtCo/C-600 catalyst is relatively weaker compared to previously-reported ordered Pt-Co catalysts,18,34 indicating a lower extent of structural alloying. This is reasonable since a higher temperature (650 °C–800 °C) was generally adopted during the annealing step in the Refs. 18, 34 Besides the formation of an ordered phase, annealing at a higher temperature also favors a higher surface composition of Pt due to the lower surface energy of Pt compared to the less noble metals, as shown by our previous X-ray photon spectroscopy analysis.35 However, high temperature annealing would also result in a severe particle sintering, constituting a great challenging in the synthesis of highly ordered Pt-based catalysts. To avoid significant particle sintering, we limit the annealing temperature at 600 °C in the present study.

Figure 1. XRD and STEM characterizations of the disordered PtCo/C-400 and ordered PtCo/C-600 catalysts. (a) XRD patterns. (b) STEM image of the PtCo/C-600 catalyst. (c) particle size distributions. (d) Size-dependence of the extent of structural ordering. (e) High resolution STEM images of the PtCo/C-600 NPs at varying particle size, with the colored ordered and disordered region.
Download figure:
Standard image High-resolution imageThe structure and composition of the PtCo/C catalysts were further characterized by statistical STEM and EDX analysis. Large area EDX analysis confirms a similar composition for the PtCo/C-400 (Pt55Co45) and the PtCo/C-600 (Pt52Co48) catalyst. Due to the necessary high temperature annealing step during catalyst synthesis, both the PtCo/C-400 and the PtCo/C-600 catalyst exhibit a particle size distribution of the PtCo nanoparticles between 2 and 12 nm (as shown by the STEM images in Fig. 1b and the particle size distribution analysis in Fig. 1c), with an average particle size of 4.7 nm and 5.7 nm, respectively. The larger average particle size of the latter is expected due to the higher annealing temperature, which induced a further particle growth. The existence of varying particle sizes allows a statistical study of their size-dependent structure/composition and stability, as shown in the following parts.
The extent of structural ordering is an important parameter that controls the ORR activity and stability of the ordered Pt bimetallic catalysts; a higher extent of ordering is expected to result in a higher activity and stability. Previous studies have shown the significant influence of Co concentration on the ordering degree, and higher structural ordering degree was found on PtCo and PtCo3 catalysts compared to Pt3Co catalysts.19,34 Herein, we further address the impact of particle size on the extent of structural ordering of the PtCo catalyst (namely, a size dependent structural ordering), which is valuable for further optimizing the particle size of Pt alloys in the future. For this purpose, high-resolution STEM images of the ordered PtCo/C-600 catalyst at different sizes were acquired (Fig. 1e). The existence of the ordered phase can be identified by the characteristic inter-plane distance of 0.38 nm for the {100} planes and the corresponding 100 superlattice diffraction spots in the faster Fourier transform patterns (as shown in the inset of the 4.2-nm particle in Fig. 1e). Performing inverse Fourier transform on the {100} spots produces a filtered image of the ordered domains (highlighted by the yellow fringes) in the NPs.36 The extent of ordering degree within the individual NPs can be then evaluated by the area ratio of the ordered domain to the whole NP region. Note that polycrystallines or stacking faults may also exist in the NPs, which may deviate the orientations of ordered domains and thus diminish the {100} superlattice fringes. Hence, the evaluated value acts as a lower limit of the ordering degree of the NPs. Figure 1d gives the estimated ordering degrees of PtCo NPs at different particle sizes. It is suggested that smaller particles (<5 nm) generally present a higher ordering degree (60%–80%), and Pt-segregated surfaces can be also identified from the Z-contrast HAADF images. In contrast, larger particles (>6 nm) show a lower extent of ordering (<50%) and the ordered domains generally emerged at part of the surfaces. Moreover, the ordered domains exhibit a dominant diameter between 2–5 nm. These results suggest that the ordered domains nucleated at the surface region of the PtCo NPs and grew up to 2–5 nm under the applied annealing condition.
The nucleation of ordered domains at part of the surfaces was also found in Pt3Co NPs (ca. 6 nm in diameter) during an in situ heating TEM study.37 It was shown that different surfaces exhibited different driving forces for the growth of ordered structure, with the {110} surface being most favorable compared to the {100} surface as well as the bulk. This implies that the nucleation of the ordered domains was confined on selected surfaces, instead of the whole NP surface. As a result, the structural ordering degree of the PtCo NPs is determined by both the growth rate of the ordered domain and the particle size. For smaller NPs, the nucleation and subsequent growth of the ordered domain can easily penetrate into the whole NPs. In contrast, larger particles take a longer time for the growth and spreading of the ordered domains. In addition, impacts of particle size on the driving force for the nucleation of ordered phase at the surface cannot be ruled out. It is known that surface atomic diffusion can be accelerated on smaller NPs due to decreased average coordination numbers,9 thus the surface structural ordering through atomic diffusion may be also promoted at smaller NPs, which needs further studies. It should be noted that, for very small NPs (e.g. <2 nm), structure ordering may be again suppressed due to thermodynamically decreased phase transition temperatures.33,38
Single H2/O2 PEM fuel cell test was then conducted on membrane-electrode-assembly (MEA) using PtCo/C-400 or PtCo/C-600 catalyst in the cathode. To avoid significant Co dissolution in the MEA, both the PtCo/C-400/600 catalysts were pre-leached in 0.1 M H2SO4 under air at 70 °C for 24 h to form a core–shell structure, which was known as chemical dealloying to form a Pt-Co core and Pt–rich shell structure, as widely adopted in the literatures.39 The atomic ratio of Pt: Co were changed to 71:29 and 77:23 for the PtCo/C-600 and PtCo/C-400, respectively, measured by inductively coupled plasma atomic emission spectroscopy (ICP-AES). This is expected and provides a preliminary evidence for the improved retention of Co in the ordered PtCo/C-600 catalyst. Despite the reduced Co content, the disordered and ordered structure still retained in the leached PtCo/C-400 and PtCo/C-600 catalyst as shown in the XRD patterns (Fig. 1a). Interestingly, the 110 peak as well as the 210 peak of the ordered intermetallic phase become much more evident in the acid-leached PtCo/C-600 catalyst, suggesting increased ordering degree likely due to enhanced atomic diffusion during the leaching process.
Figure 2a shows the H2/O2 MEA polarization curves of the leached PtCo/C-400 and PtCo/C-600 catalyst and a commercial 3 nm Pt catalyst supported on Vulcan carbon (denoted as Pt/C, containing 20 wt%, purchased from Johnson Matthey) for benchmark, with a similar Pt loading of ∼0.1 mg cm−2 at the cathode. Both the PtCo/C-400 and the PtCo/C-600 catalyst display higher performance than the Pt/C catalyst at the low and intermediate current densities (<2 A cm−2). The PtCo/C-600 catalyst demonstrates the highest MEA performance, showing the highest voltage of 0.650 V at 1.5 A cm−2, which is 25 and 40 mV higher than that of PtCo/C-400 (0.625 V) and Pt/C (0.610 V), respectively. The mass activities at 0.9 V evaluated from the Tafel plots (Fig. 2b) or chronopotentimetry measurement at 0.9 V (Fig. S1) also consistently show a similar activity trend in the order of PtCo/C-600 (0.30 A/mgPt), PtCo/C-400 (0.22 A/mgPt) and Pt/C (0.15 A/mgPt). Nevertheless, the performance gains of the Pt-Co/C catalysts over the Pt/C catalyst gradually reduced at the high current density region (above 2.5 A cm−2) where mass transportation polarization dominates, likely due to their larger particle sizes, smaller electrochemical surface area (ECSA) and hence increased oxygen transportation resistance.2,40–42
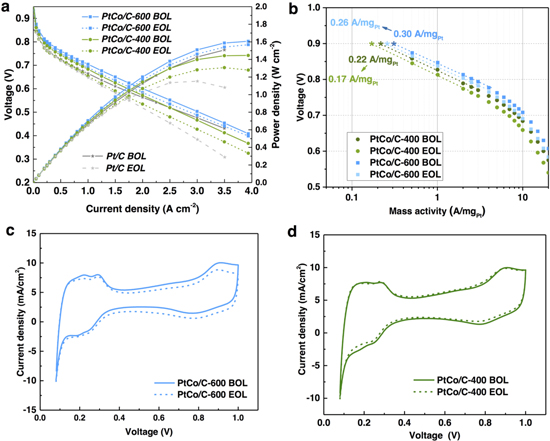
Figure 2. (a) H2/O2 fuel cell polarization curves and power density plots of PtCo/C-400, PtCo/C-600 and a commercial Pt catalyst at the cathode (Nafion 211 membrane, 80 °C, 100% RH, and 1.5 bar back pressure) before and after accelerated stress test (AST). The AST consists of 10000 voltage cycles between 0.6 and 1.0 V at 50 mV s−1 and 80 °C under H2/N2 atmosphere. (b) Tafel plots of the mass activity at different voltages. (c)–(d) Cyclic voltammograms of the PtCo/C-600 (c) and the PtCo/C-400 (d) catalysts in the MEA before (BOL) and after (EOL) AST.
Download figure:
Standard image High-resolution imageThe ECSA of Pt in the cathode (Figs. 2c and 2d) was then evaluated by under potential deposition of hydrogen (Hupd) during cyclic voltammetry of the cathode under the H2(anode)/N2(cathode) gas atmosphere. As expected, the ECSA is smaller for the disordered PtCo/C-400 (31.1 m2/gPt) and ordered PtCo/C-600 (30.2 m2/gPt) catalysts compared to the Pt/C catalyst (42 m2/gPt). This indicates that the enhanced performance of the ordered PtCo/C-600 catalyst originates from the intrinsically higher specific activities of the core–shell structure instead of a larger ECSA. It should be noted that, the difference on the ECSA of the two Pt-Co/C catalysts is very small despite their different average particle sizes, highlighting the complexity of factors controlling the ECSA in MEA. This may be understood by the fact that smaller Pt (alloy) nanoparticles could be more easily trapped in the micropores of the Vulcan carbon support where the Nafion ionomer is not accessible.43 As a result, the smaller average particle size of the PtCo/C-400 catalyst would not necessarily lead to proportionally increased ECSA. This is also supported by the result that the ECSA of the commercial Pt/C catalyst (42 m2/gPt) in MEA only increases by ca. 40% compared to the PtCo/C-600 catalyst, despite the fact that the particle size of the former is nearly half of that of the latter (TEM images and particle size distribution analysis of the Pt/C catalyst can be found in Figs. S2a, S2d).
Durability of different cathode catalysts in the MEAs were further performed by accelerated stress testing (AST) using triangle-wave voltage cycles (10 000 cycles between 0.6–1.0 V at 50 mV s−1; 80 °C, 100% RH; H2/N2 at 200 sccm). All the three catalysts display noticeable performance decay, with the PtCo/C-600 catalyst most durable (Fig. 2a). The two PtCo/C catalysts exhibited the voltage loss at both low and high current densities: the voltage at 1.5 A cm−2 drops by 12 mV for the PtCo/C-600 catalyst and 24 mV for the PtCo/C-400 catalyst, consistent with a less mass activity drop at 0.9 V (Fig. 2b). Meanwhile, the ECSA of the PtCo/C-600 catalyst (Fig. 2c) almost unchanged before (30.2 m2 g−1) and after (29.6 m2 g−1) AST, while the ECSA of the PtCo/C-400 catalyst (Fig. 2d) decreased slightly from 31.1 m2 g−1 to 28.7 m2 g−1. This indicates that the main reason for the performance degradation of the Pt-Co/C catalysts (particularly the PtCo/C-600 catalyst) was not decreased ECSA but a loss of intrinsic surface reactivity, likely associated with Co leaching and varied core–shell compositional structures. In contrast, the commercial Pt/C catalyst showed much higher extent of ECSA loss from 42 m2 g−1 to 32 m2 g−1 (Fig. S3a), suggesting a substantial particle coarsening. Nevertheless, the mass activity at 0.9 V of the Pt/C catalyst decreased little, from 0.15 A g−1 to 0.13 A g−1, as shown in Fig. S3b. This can be ascribed to increased surface reactivity at larger NPs, which counteracts some of the loss in mass activity caused by the decreased ECSA.8 The MEA performance of the Pt/C catalyst mostly occurred at the high current densities, where a large ECSA is critical in reducing O2 transportation resistance.2
To provide insight into the degradation mechanisms of the ordered and disordered PtCo catalyst in MEA, we then characterized the aged PtCo/C-400 and PtCo/C-600 catalysts (Fig. 3) as well as the aged Pt/C catalyst (Figs. S2b, c) by TEM/STEM of ultramicrotome cross-sectional MEA samples. Statistical particle size distribution analysis reveals most significant particle coarsening in the Pt/C catalyst from an average particle size of 3.0 nm to 4.7 nm. Particle coarsening was also observed in the PtCo/C-400 catalyst (Figs. 3a–3b) but in a less extent, where the percentage of larger particles increased and the average particle size slightly increases from 4.7 nm to 5.5 nm. The particle size distribution of the PtCo/C-600 catalyst appears more stable after durability test (Figs. 3d–3e), with similar average particle sizes (5.7 and 6.0 nm). Large area energy dispersive X-ray spectroscopy (EDX) further shows that the ordered PtCo/C-600 catalyst also retains a higher content of Co (decreased from 29 at% to 25 at%) compared to the disordered PtCo/C-400 catalyst (decreased from 23 at% to 17 at%) after the AST test. As a result, the ordered PtCo-H600 catalyst not only shows less particle coarsening but also improved Co retention during the AST test, which accounts for the improved durability on the MEA performance.
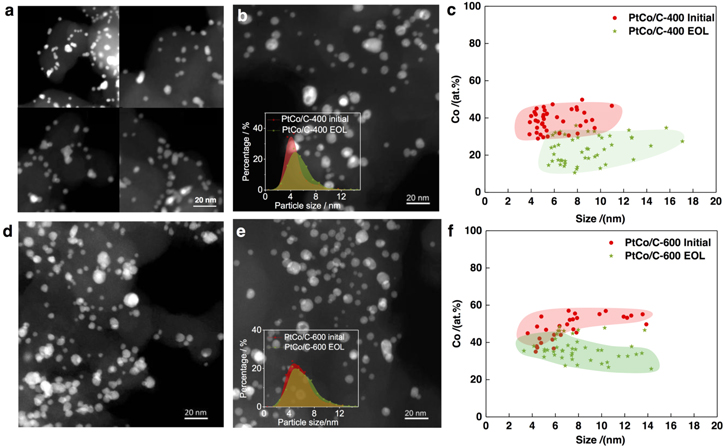
Figure 3. (a), (b) STEM images of the PtCo/C-400 catalyst before and after AST test, respectively, with the particle size distribution shown in the inset of (b). (c) size-dependence of Co concentration in the as-prepared and aged PtCo/C-400 catalyst. (d), (e) STEM images of the PtCo/C-400 catalyst before and after AST test, respectively, with the particle size distribution shown in the inset of (e). (f) size-dependence of Co concentration in the as-prepared and aged PtCo/C-600 catalyst.
Download figure:
Standard image High-resolution imageStatistical EDX analysis of the aged Pt-Co NPs at different particle sizes provide valuable information of the size-dependent Co dissolution. As displayed in Fig. 3c, for the aged PtCo/C-400 catalyst, the Co content decreases for all the particles at different sizes compared to those in the as-prepared catalyst. In contrast, the aged PtCo/C-600 (Fig. 3f) catalyst shows a higher retention of Co at particle size below 5 nm compared to the larger particles. STEM images show that these larger particles are still mainly in a solid core–shell structure, instead of forming nanoporosity as reported in dealloyed PtNi3 catalyst.9,12 Therefore, the higher extent loss of Co at the particles above 6 nm cannot be explained by the formation of nanoporosity as proposed previously.9 Electron-energy loss spectroscopic (EELS) imaging were then applied to investigate the core–shell compositional fine structure of the aged PtCo/C-600 catalyst at different sizes (Fig. 4). The PtCo NPs below 5 nm (Figs. 4a–4b) still exhibit a uniform Pt shell of 0.5–1 nm and homocentric Co-rich core. In contrast, larger particles (Figs. 4c–4e) demonstrate a non-uniform Pt shell and eccentric Co distribution at the core. The location of the Co-rich cores at near surface region is highly consistent with that of the ordered domains observed in the initial PtCo/C-600 catalyst. This suggests that the robust near surface Co-richer cores originated from the near surface ordered domains, whereas the disordered region was less durable and resulted in thicker Pt shells. Therefore, for particles smaller than the critical domain size of ordered phase, fully ordered PtCo NPs would form and a uniformly thin Pt shell surrounding an ordered PtCo core can survive after the AST test. In contrast, larger particles show a lower ordering degree and thus more significant Co dissolution. These results highlight the importance of controlling particle size of ordered Pt bimetallic catalysts for further optimizing their durability.
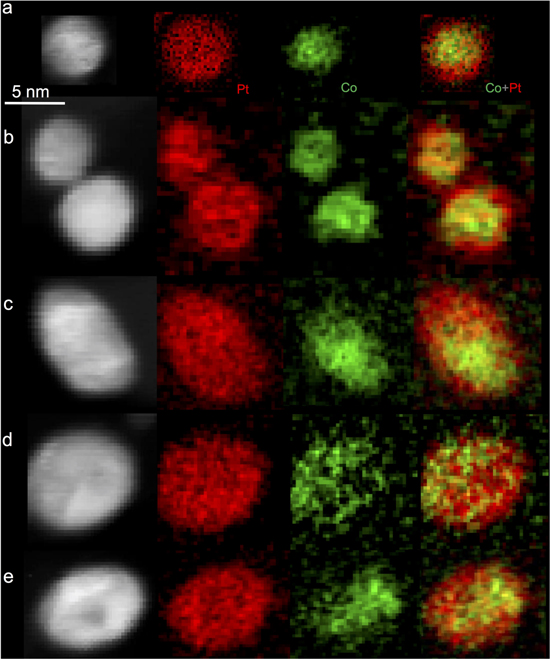
Figure 4. STEM-EELS spectrum imaging of the aged PtCo/C-600 catalyst at different particle sizes. Smaller particles (a)–(b) below 5 nm generally show uniform Pt shell at a thickness of ∼1 nm, while larger particles demonstrate inhomogeneous Pt shell thickness and eccentric Co distribution.
Download figure:
Standard image High-resolution imageBesides the Co-dissolution in the catalyst layer, Pt dissolution could constitute another important reason for the activity degradation of Pt-based catalysts. Platinum dissolution would not only result in the Ostwald-ripening of the catalyst NPs but also redeposition of Pt particles at the membrane due to the reduction of Pt ions by the hydrogen molecules cross over from the anode.22,28 Thus, the extent of Pt redeposition in the membrane can reflect the extent of Pt dissolution in the catalyst layer. As shown in Figs. 5a–5d, redeposition of Pt aggregates into the membrane was found in both MEA-Pt/C (Figs. 5a, 5b) and MEA-PtCo/C-400 (Figs. 5c, 5d). EDX analysis (Fig. 5f) confirms that the composition of the redeposited particles in the membrane is mainly Pt. The Pt aggregates have a maximum size of ∼100 nm at the membrane close to the cathode catalyst; the more far away from the cathode catalyst layer, the smaller the redeposited Pt particles, indicating a concentration gradient of dissolved Pt ions from the catalyst layer. In addition, dissolved Co ions in the membrane can be also found in the aged MEA-PtCo/C-400, consistent with the revealed Co dissolution in the catalyst layer.

Figure 5. TEM or STEM images of the re-deposition of Pt aggregates in the membrane of the MEAs using different cathode catalysts. (a), (b) commercial Pt catalyst. (c), (d) disordered PtCo/C-400 catalyst. (e) ordered PtCo/C-600 catalyst. (f) EDX analysis of different regions in the MEA. For each type regions in the membrane, the EDX results were averaged for at least 3 different locations.
Download figure:
Standard image High-resolution image
Compared to the aged MEA-Pt/C, the amount of the redeposited Pt in the aged MEA-PtCo/C-400 is much lower, suggesting a mitigated Pt dissolution in the PtCo/C-400 catalyst compared to the Pt/C catalyst. This is consistent with the much higher extent of loss in the ECSA in the latter. The mitigated Pt dissolution/redeposition of the PtCo/C-400 catalyst compared to the Pt/C catalyst can be first ascribed to a larger average particle size, since larger particles are more thermodynamically stable with less Pt dissolution.44,45 It has been shown that Pt dissolution generally dominate in the particles of ∼2 nm, whereas it plays almost no role for larger particles (above 4 nm).45 In addition, roles of the compressive strain on the Pt shell exerted by the Pt-Co alloy core cannot be excluded. The compressive strain can not only result in weakened adsorption of oxygenated species for a higher activity but also less formation of Pt oxides, the reduction of which during the triangle-wave potential cycling dominantly contributed to the Pt dissolution.27
Importantly, no Pt redeposition at the cathode /membrane interface was observed in the aged MEA-PtCo/C-600 (Fig. 5e), suggesting that the Pt dissolution can be further suppressed in the ordered PtCo catalyst. This is also consistent with the less extent of Pt coarsening in the ordered PtCo/C-600 catalyst layer (Fig. 3e), indicating minimized Ostwald-ripening process. This is encouraging since it shows for the first time that the implement of ordered Pt intermetallics in the PEMFC cathode can not only enhance the activity and stability of the catalyst layer but also suppress the Pt redeposition in the membrane and associated membrane failure. The concentration of dissolved Co ions in the membrane (Fig. 5f) was also significantly decreased in the aged MEA-PtCo/C-600 (with Co:F atomic ratio of 0.1:99.9) compared to that in the aged MEA-PtCo/C-400 (with Co:F atomic ratio of 0.4:99.6). While the PtCo/C-600 catalyst also shows a larger average particle size compared to the PtCo/C-400 catalyst, we don't think this plays a significant role in the decreased Pt dissolution/redeposition and Co dissolution in the aged MEA-PtCo-H600. From Fig. 1c, there are still a considerable percentage of 2–5 nm particles in the ordered PtCo/C-600 catalyst; it is these small particles that plays a dominate role in the Pt dissolution following previous report.45 Fortunately, these small particles demonstrate a high structural ordering degree in the PtCo/C-600 catalyst, thus leading to more durable compressive strain on the Pt shell which favors decreased formation of Pt oxide and less Pt dissolution. While larger particles can also inhibit Pt dissolution, the lower extent of structural ordering leads to a higher extent of Co dissolution and thereby is unfavorable for maintaining the activity. In addition, larger particles also cause a lower ECSA and increased mass transfer resistance at high current densities. Taking together, our results uncover the importance of controlling particle size of ordered Pt bimetallic in the range of 2–5 nm catalysts towards both improved activity and durability in PEM fuel cells.
Conclusions
We reveal the impact of structural ordering of PtCo catalysts on the metal (Pt/Co) dissolution and re-deposition and the associated durability under realistic PEM fuel cell operation conditions by comparative microscopic study of the ordered and disordered PtCo/C catalysts and the benchmark Pt/C catalyst. The instability of the disordered PtCo/C-400 catalyst in the MEAs originates from both Co dissolution and Pt dissolution (and the associated formation of Pt-band), although the Pt dissolution/re-deposition has been obviously mitigated compared to the Pt/C catalyst. The ordered PtCo/C-600 catalyst demonstrates both improved retention of Co and further suppressed Pt dissolution/re-deposition in the MEA, leading to the highest activity and stability. Furthermore, the ordered PtCo/C-600 catalyst shows a clear size dependence on the structural ordering: particles between 2–5 nm mainly exhibit a fully-ordered structure, while particles larger than 6 nm manifest much lower extents of structural ordering. Such size-dependent ordering leads to the highest retention of Co and uniformly thin Pt shell in ordered 2–5-nm PtCo NPs, whereas larger particles demonstrate non-uniform Pt shells and a higher extent of Co dissolution. These results suggest that the activity and stability of the ordered PtCo catalyst in MEAs can be further improved by controlling the particle size in the range of 2–5 nm.
Acknowledgments
We gratefully appreciate the financial support from the Natural Science Foundation of China (NSFC) (under grant number 51622103 and 21573123); the Basic Research Program of Shenzhen (JCYJ20170817161445322) in China; the Local Innovative and Research Teams Project of Guangdong Pearl River Talents Program (grant no. 2017BT01N111), and Guangdong Natural Science Foundation for Distinguished Young Scholars (2016A030306035). This work made use of the TEM facilities at the Electron Microscopy Laboratory, Materials and Devices Testing Center of Tsinghua Shenzhen International Graduate School (Tsinghua SIGS).