
Abstract
Lithium-ion batteries (LIBs) play an integral role in powering various applications, from consumer electronics to stationary storage, and notably in the accelerating domain of electric vehicles (EVs). Despite their widespread adoption and numerous benefits, safety issues are of major concern, especially with the surge in their utilization and increasing proliferation of second-life cells, particularly in domestic energy storage applications. A critical concern revolves around susceptibility to thermal runaway, leading to highly hazardous and challenging-to-contain fires. Addressing these concerns necessitates effective methods to monitor internal temperature dynamics within lithium-ion cells swiftly and cost-effectively, alongside a need to develop prognostic techniques to pre-empt thermal runaway occurrences. This study presents an innovative approach that uses ultrasound analysis to track intricate internal temperature fluctuations and gradients within cells. Moreover, an efficient multi-stage warning system is proposed that is designed to proactively prevent thermal runaway events. The findings offer promising avenues for enhancing the safety and reliability of lithium-ion battery systems.
Export citation and abstract BibTeX RIS

This is an open access article distributed under the terms of the Creative Commons Attribution 4.0 License (CC BY, http://creativecommons.org/licenses/by/4.0/), which permits unrestricted reuse of the work in any medium, provided the original work is properly cited.
Lithium-ion batteries (LIB) have gained widespread use in various energy storage applications due to their exceptional specific and volumetric energy density, coupled with high power output and enduring cycle life. LIBs were first commercialised in 1991 by Sony and were initially used mainly for consumer electronics such as laptop computers, since then they have become the dominant battery type in these electronics. 1 In addition, Li-ion cells have found widespread and increasing deployment in battery electric vehicles and hybrid electric vehicles (EVs and HEVs) which present the most promising decarbonisation solution for the passenger transportation sector. 2,3 Alongside the decarbonisation of transport, efforts to reduce emissions associated with energy production have increased the deployment of renewable energy production systems. While this form of energy production enables true zero-carbon operation of EVs, a significant challenge to grid stability and operation is provided by the intermittent nature of these power sources. To address this, there has also been a rapid increase in the use of LIB energy storage systems of increasing sizes ranging from kWh scale domestic storage units to MWh scale commercial facilities to deal with this intermittency. As a result of the accelerating demand for each of these technologies, there is currently a significant growth in the demand for LIBs and the quantity in use across the globe is predicted to increase year-on-year for the foreseeable future. 4
Despite the numerous advantages that LIBs offer in the ongoing efforts to decarbonize the transportation and energy sectors, concerns persist regarding their safety, especially within domestic energy storage and transportation applications where the public is particularly exposed to larger battery systems. Although the failure rate of LIBs is relatively low, with estimates in the range of 1 in 10 million to 1 in 40 million, 5 the sheer quantity of LIBs in use means that these events are likely to become more common unless the safety of the devices is further improved. 6 To ensure the safe operation of LIBs, minimise degradation, maximise cycle life and prevent cell failure, cells are required to be operated within a narrow window of voltage, power and temperature. 7 As such, for the safe operation information on the voltage, operating current and temperature of the cells in a pack is of vital importance.
Operating outside of the desired window can result in poorer performance in terms of power and capacity as well as resulting in an increased rate of degradation. Degradation of the cell not only reduces the available capacity but can introduce or enhance defects present within the cell which may lead to premature cell failure. 8 In addition to the operational parameters of the cell, external factors associated with their use can have a significant and negative effect on battery performance. Mechanical damage or vibration caused by use or impact can result in damage significant enough to cause a cell to fail. This process is not always instantaneous with some reports of thermal runaway occurring on cells after a long period after an accident. A rapid, effective and reliable thermal runaway detection method is vital for the safe operation of lithium-ion cells and battery packs. 9
Thermal runaway in a LIB battery is a highly concerning and potentially hazardous event characterised by a self-perpetuating increase in temperature within the battery. This phenomenon often begins with an internal short circuit or external factors causing overheating, triggering a chain reaction leading to a rapid rise in temperature. 10 As the temperature escalates, the cell's components undergo a breakdown, leading to further heat generation and the potential release of flammable electrolytes or gases. If left unchecked, thermal runaway can result in fires, explosions, or the battery releasing hazardous materials, posing significant safety risks to surrounding environments and individuals. The United Nations global technical regulation on electric vehicle safety (GTR EVS) Section I. E. 7 c 112 recognises this and state the requirement of devices to detect thermal runaway in a time sufficient to provide adequate warning to passengers and drivers. 11 As such, preventive measures, such as advanced battery management systems (BMSs) and improved battery designs, are crucial to mitigate the risks associated with these hazards. 12
Several methods have been investigated in an attempt to monitor cell state-of-health (SoH) and predict cell failure and thermal runaway; however, significant issues with these methods still exist. Currently, BMSs depend almost entirely on voltage and some temperature measurements. Obvious and clear voltage changes are regularly only observed after a cell has entered irreversible failure. 10 Issues with voltage measurements such as this can also occur when cells are connected in parallel since the voltage of "good" cells can mask the degradation/failure of faulty cells. Methods are, however being developed to better determine the SoH based on these measurements. 13–16
Monitoring the pressure within an individual cell has been demonstrated to give some indication of when a cell is in the early stages of thermal runaway with gas formation due to electrolyte decomposition an early indication of serious degradation. 17 Issues with the cost of implementation of this technique on each cell, and the wider integration into a pack, currently prevent this technique from being implemented commercially. Initial work with strain sensors on the cell casings has provided some initial promising results with the gas formation giving detectable changes in the stresses and strains on the cell casings. 18
On a module and pack level, some success of thermal runaway detection has been achieved with the use of detectors for smoke and gas. 19 These techniques have been demonstrated to give indications of failures earlier than readings from voltage and some temperature measurements; however, this technique is reliant on the venting of at least one cell before detection can occur. 19 It is still unclear if by this point the thermal runaway is irreversible or preventable.
The main key metric used to currently detect thermal runaway is temperature, with the vast majority of battery packs fitted with thermocouples, normally with one covering several cells rather than each cell being individually instrumented. 20 Even with cells fitted with individual thermocouples there can be a lag in detection simply caused by the fact that the majority of cell failures occur deep within the cell and require time to heat the surface where the temperature sensor is placed. The ability to track the internal and external temperature is highly desirable to increase the speed at which a warning can be raised with poor thermal conductivity through electrodes and separator often leading to discrepancies and a relatively long latency between the surface temperature and external temperature, particularly in the cross-plane direction. 21 Internal temperature measurements achieved using integrated thermocouples are currently attracting increasing attention. 22 However, issues with cost, invasivity and complexities in manufacturing, still need to be overcome.
One technique currently under development, which may be well suited to this task, is ultrasonic monitoring. 23,24 The process has been demonstrated to be highly sensitive to cell degradation and damage with significant changes in acoustic signal observed when the cell undergoes thermal runaway. 25 This work has resulted in a number of follow-up works by other groups, further demonstrating the potential effectiveness of this method. 26 Recently, data reported by this group has shown that the technique can be used to monitor the temperature of a cell during operation. 27 Due to the penetrative nature of the ultrasound signal used for the measurement, heating at any point within the cell should be detectable and achievable within microseconds. Some limitations are still associated with the use of ultrasonic monitoring of LIBs, a deeper understanding of the technique is required with both the degradation and SoC estimations resulting in time of flight shifts. 28
Williams et al. recently published a review assessing the current approaches of utilizing ultrasound for monitoring lithium-ion batteries and the relevance to thermal runaway, their main conclusions were a deeper understanding of the correlation between ultrasonic signal and thermal runway onset was still required with the decoupling of temperature and charge effects required. 28 Herein, we report a study covering these issues, additionally, we demonstrate the ability of ultrasound analysis to not only predict and prevent the thermal runaway of commercial LIBs but also demonstrate the effectiveness of the technique for detecting internal temperature changes within a cell without the lag of methods dependent on measuring surface temperature. The sensitivity, non-invasive and low-cost nature of this technique opens the possibility of a multi-scale warning system being implemented in battery packs used in real-world environments.
Materials and Methods
All studies were conducted using 210 mAh pouch cells (PL-65168–2C, AA Portable Power Corp., U.S.A) consisting of a lithium cobalt oxide (LCO) positive electrode and a graphite negative electrode, with a nominal voltage of 3.7 V. Ultrasonic measurements were conducted using an EPOCH 650 ultrasonic flaw detector (Olympus Corp. Japan) using a 5 MHz, 6 mm diameter, M110-RM transducer (Olympus Corp. Japan). The for the majority of tests the transducers were coupled to the cells under test using H-2 high-temperature ultrasonic couplant (Olympus Corp. Japan), for destructive tests transducers were glued to the surface of the cell with a two-part Epoxy adhesive (Araldite, U.S.A.) to ensure good contact was maintained between the cell and transducer throughout testing. A 3D-printed, custom designed holder with a spring loaded transducer was used to ensure good contact and a consistent pressure which contributed to repeatable readings from experiment to experiment. Variations from transducer to transducer and cell to cell were recorded and found to be small relative to the time-of-flight changes observed both as the cell was cycling and heated and cooled. Data was collected from the ultrasound equipment using custom Python code at intervals of up to 0.5 Hz. Analysis and visualisation of the acoustic data were achieved using Python 3.7 with the amplitude of the acoustic wave reported as a percentage of the highest positive peak (at saturation of receiver). For clarity, all waveforms were + half rectified, eliminating any negative peaks, before plotting of the colourmaps. A typical ultrasound waveform achieved in pulse-echo mode (without rectification) is shown in Fig. 1 ©. The change in the temperature of the cell can be calculated based on the change in the time of flight of the first echo peak, and vice versa, following the methods and calculations outlined in detail in Ref. 27.
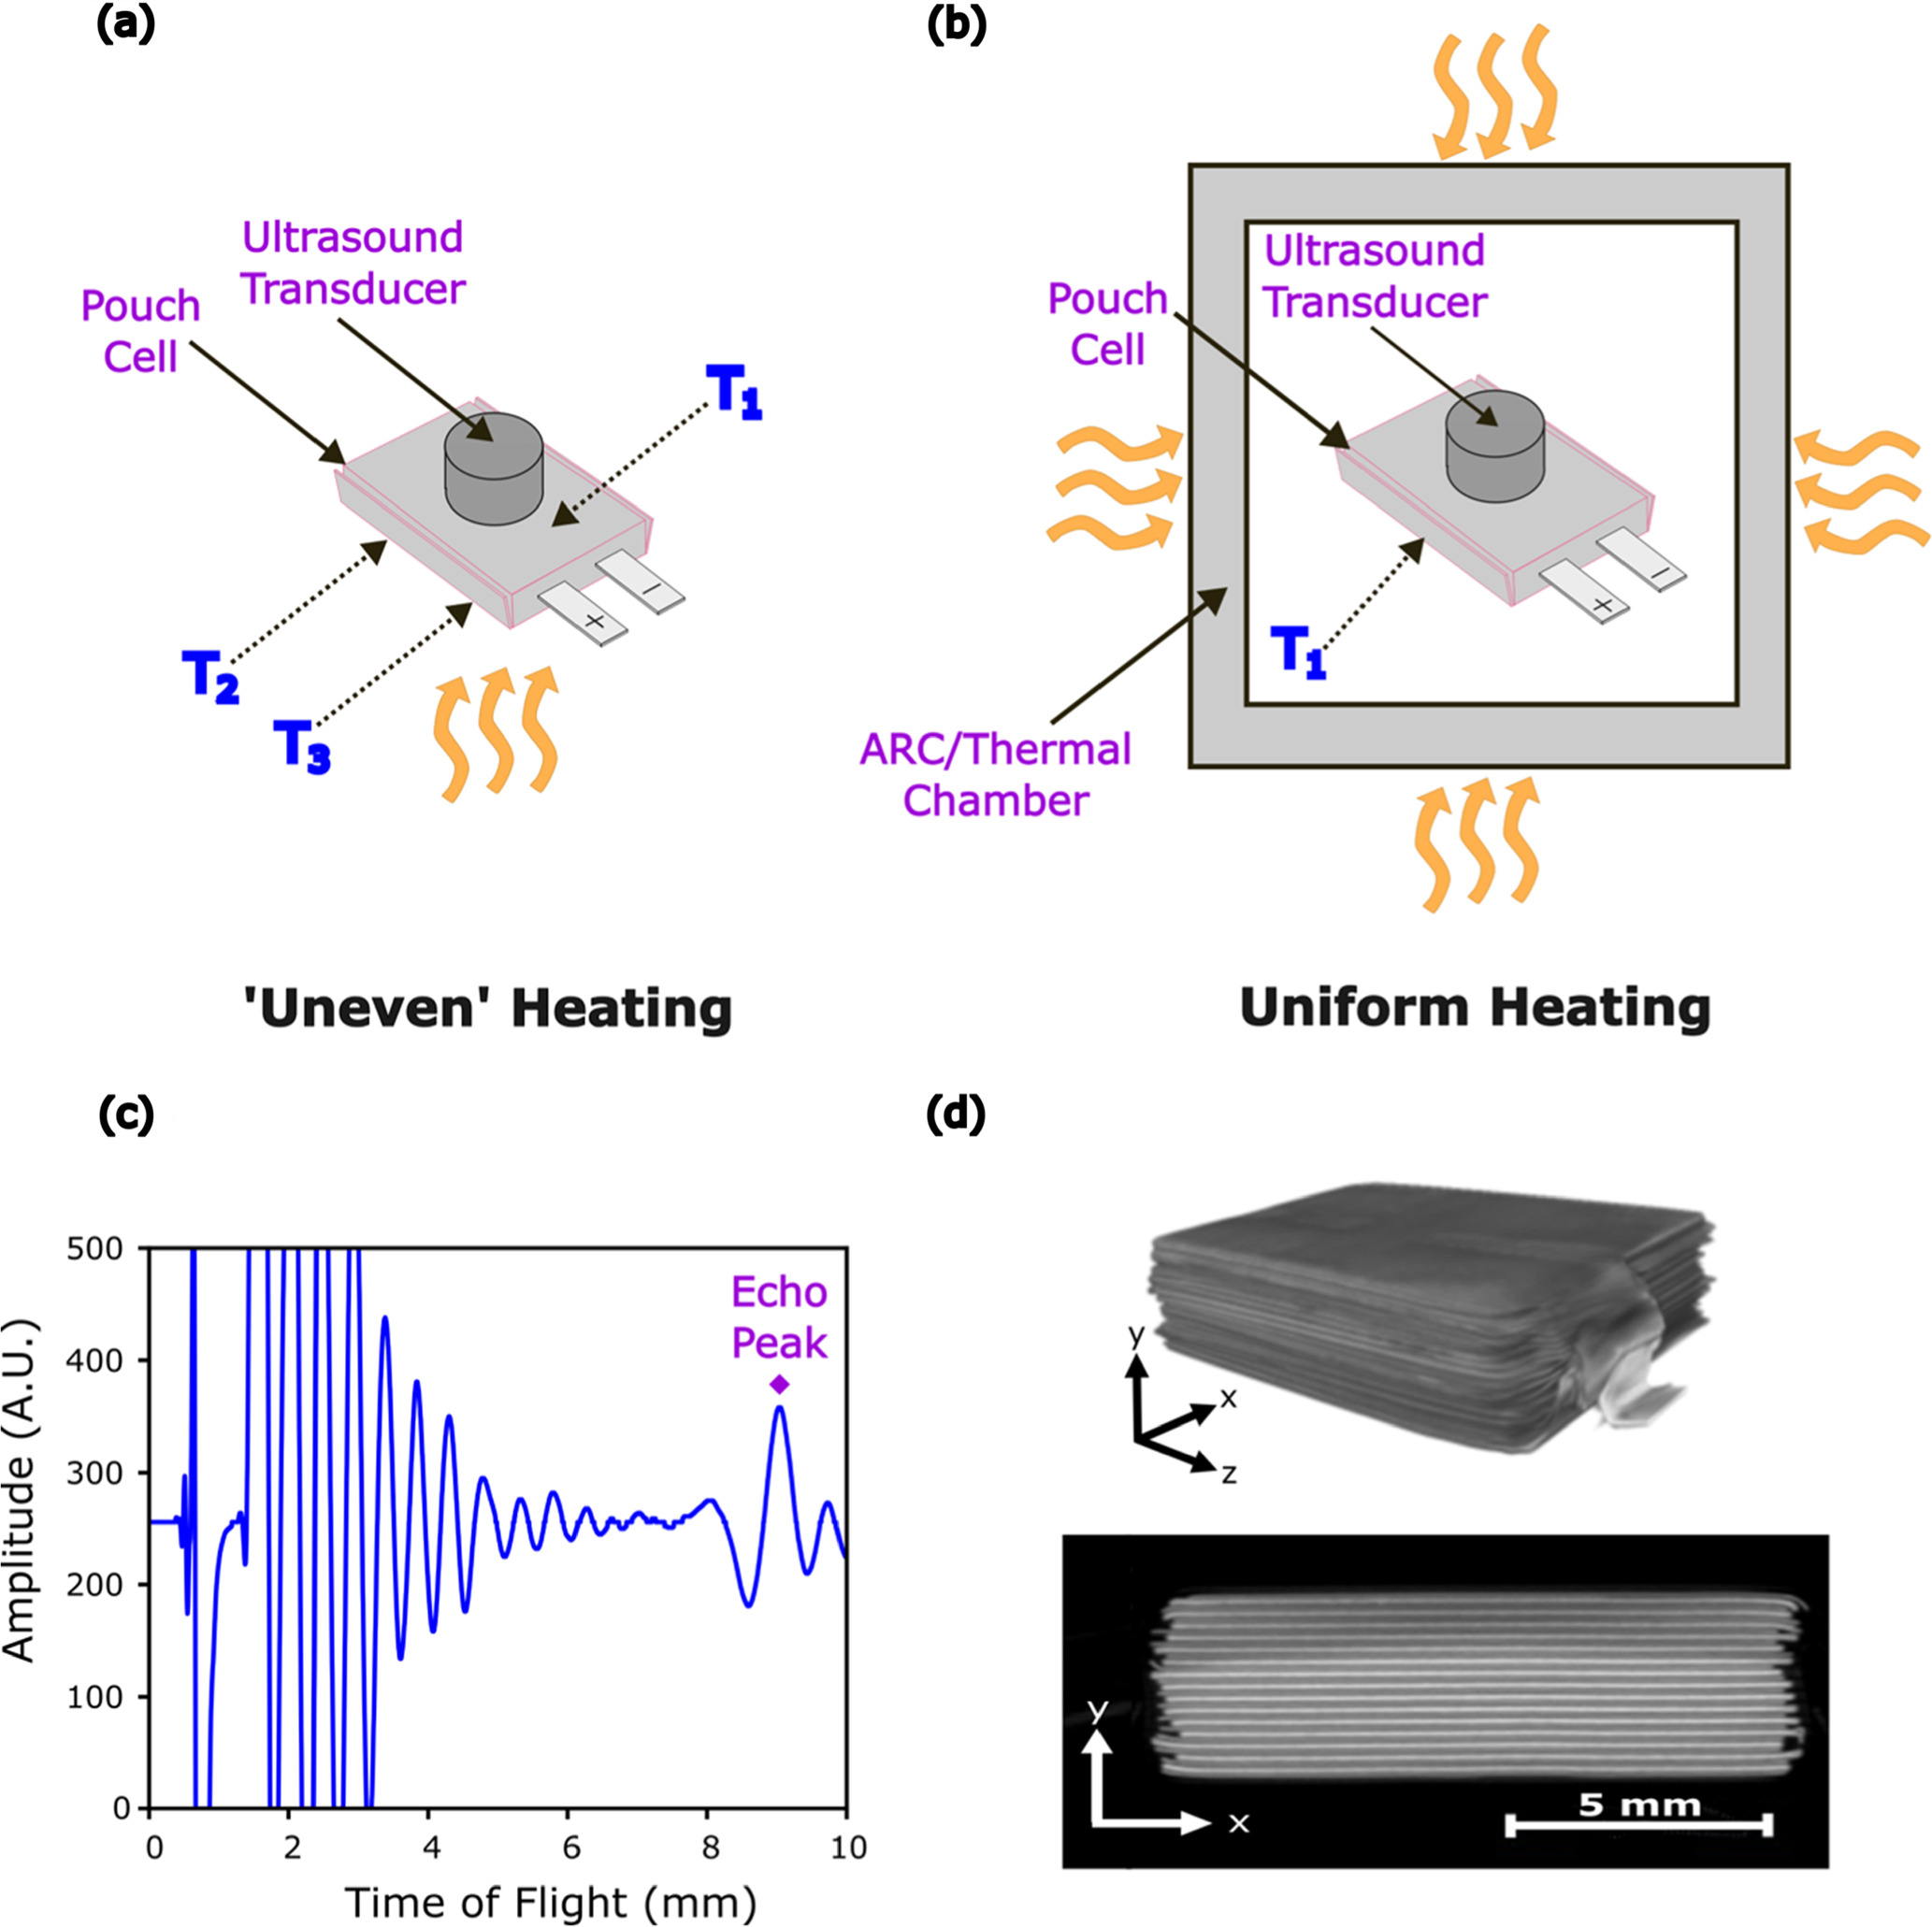
Figure 1. (a) Illustration of how "uneven" heating of the pouch cell is achieved with the positioning of ultrasound transducer and thermocouple placement indicated. (b) Illustration of how uniform cell heating is achieved within the thermal chamber, with the placement of the ultrasound transducer and thermocouple also indicated. (c) An example of the typical ultrasonic signal received in pulse-echo mode, with the first echo peak highlighted. (d) Visualisation of the reconstructed 3D volume (top) and an example orthogonal slice (bottom) of a pristine pouch cell achieved with X-ray computed tomography.
Download figure:
Standard image High-resolution imageCells were cycled and their voltage monitored using a Gamry Interface 1000 potentiostat (Gamry Instruments, U.S.A.). Cells were cycled according to the manufacturer's specifications with a constant current charge at 210 mA to 4.2 V then at a constant voltage until the current dropped to 10.5 mA. Discharge was conducted at a constant current of 210 mA until the voltage dropped to 2.75 V. The rate of discharge as measured relative to the capacity of the cell (210 mAh), commonly referred to as the C-rate, for all cycling tests was 1 C. The cell voltage was monitored at a rate of 1 Hz.
Cell temperature was monitored using K-type thermocouples with data collected once per second using a TC-08 Thermocouple Interface with a temperature resolution of 0.025 °C and an accuracy of ±0.2% (PicoTech, U.K.) and PicoLog software (PicoTech, U.K.). For tests requiring the even heating of the whole cell a Maccor MTC-20 temperature chamber was utilised. The cell was placed in the holder and supported on shelf in the centre of the chamber. Ramp rates were set so that even heating of the cell could be achieved in agreement with the results presented in Ref. 27.
Destructive testing of cells was conducted in either a BTC-350 or a BTC-130 accelerating rate calorimeter (ARC) (HEL Group, U.K.) capable of containing any cell failures, see Fig. 1b. An external extraction system (BOFA International Ltd, U.K.) was used to filter particulate and neutralise any hydrogen fluoride or acidic gases formed before being vented into a fume hood. During destructive testing, thermal runaway was either triggered by heating the whole cell using the wall heaters of the ARC and the provided can heater wound around the cell to give an even heating (Fig. 1b or through the use of a heating cartridge to heat a small area (4 mm diameter) and induce localized heating and damage as shown in Fig. 1a. For localised heating experiments the cartridge heater was held in place in a hole drilled through an insulating block with the cell placed on top with the cartridge in direct contact with the bottom of the cell with two thermocouples on either side of it. The ultrasonic transducer was placed on the top surface of the cell with a third thermocouple placed next to it to monitor the temperature of the top surface of the cell, a representative schematic is shown in Fig. 1b with the thermocouple placements highlighted, a more detailed schematic is included in Fig. SI1.
The internal structure of the cell was characterized before and after failure using X-ray computed tomography (CT). The scans were acquired using a Nikon XT-225 instrument (Nikon Metrology, U.K.) with an accelerating voltage of 130 kV, an incident beam power of 13 W using a tungsten target and a 1 mm copper filter. Radiographic images were reconstructed using the "Nikon CT agent" software (Nikon Metrology, U.K.). Visualisation of the reconstructed datasets was achieved using Aviso Fire 9.4 (Thermo Fisher Scientific, U.S.A.) an example representative 3D volume of the cell and an example orthogonal slice are shown in Fig. 1d.
Results and Discussion
To perform ultrasonic measurements a transducer is placed on the surface of the cell under study. The piezoelectric element of the transducer is stimulated using a high-voltage pulse, generating an ultrasound pulse. This pulse then propagates through the cell and is influenced by the material properties and structure of the cell components. By studying the reflected acoustic waveform information about the structure and certain material properties can be obtained. The speed of sound through a material is dependent on the density and elastic moduli of the material through which it is travelling, as such these properties play an important role in determining the time of flight (ToF), the time between when the pulse is generated, and the reflected signal received. 23
As such, by monitoring the ToF of peaks within the reflected acoustic waveform, information about the changing properties of the material under study can be extracted. Since the pouch cell under study is formed of several layers, as illustrated in Fig. 1d, the reflected signal is vastly different from the originally generated signal since every interface between a material with different acoustic impedances presents an opportunity for some of the signal to be reflected. How much of the signal is transmitted and how much is reflected is dependent on the difference between the acoustic impedances of the two materials that form the interface. If both materials possess similar properties the majority of the signal will be transmitted, if the difference is relatively large the vast majority will be reflected. 27
A typical, reflected, acoustic waveform for the LCO pouch cells used in this study is shown in Fig. 1c. An initial set of peaks at approximately 0.7 μs is part of the actuation signal generated by the ultrasound pulse received and remains unchanged regardless of what material the transducer is placed on. From ca. 1–8 μs a set of peaks related to the internal structure of the cell are observed, their interpretation is complex and beyond the scope of this study, the amplitude of these peaks decreases as the ToF increases. At a ToF of ca. 9 μs a peak of higher intensity is observed, this is often referred to as the "first echo" peak and is attributed to the portion of the acoustic signal that has passed through the whole cell and reached the back wall before being reflected. At this point, the large difference in acoustic impedance between the cell and the air beneath the cell means that the vast majority of the signal is reflected, with very little transmitted, resulting in a peak with a higher intensity than those at a slightly lower ToF. The attribution of this signal to the interface between the cell and the air beneath the cell can be confirmed since, if couplant is placed on the back of the cell, removing the interface, the peak disappears.
During the charge and discharge of a cell, the material properties of the component materials such as the LCO and graphite contained within the cells under study will change. During charge for example, the 300% increase in the Young's modulus of the graphite negative electrode as it is lithiated 29 contributes to an increase in the propagation speed of the ultrasound as it travels through the negative electrode layers within the cell, resulting in a reduction of time-of-flight. This opposite is true when the cell is discharged with the lowering of the negative electrode modulus, decrease in speed of sound resulting in a concurrent increase in ToF. Other factors such as the changing properties of the positive electrode material 30 and changing thicknesses of the electrodes all influence how the reflected acoustic waveform is altered. To demonstrate the influence of these changes on the ultrasonic behaviour of the cell a pouch cell was discharged and charged while being monitored using ultrasound, the results from this test are summarized in Fig. 2 with (a) showing the electrochemical data and (b) showing a colourmap plot of how the acoustic signal varies across the discharge-charge cycle. Each line present in the colourmap represents a reflected peak, with the ToF changes shown as changes in position along the y-axis and the peak amplitude represented by the colour intensity.
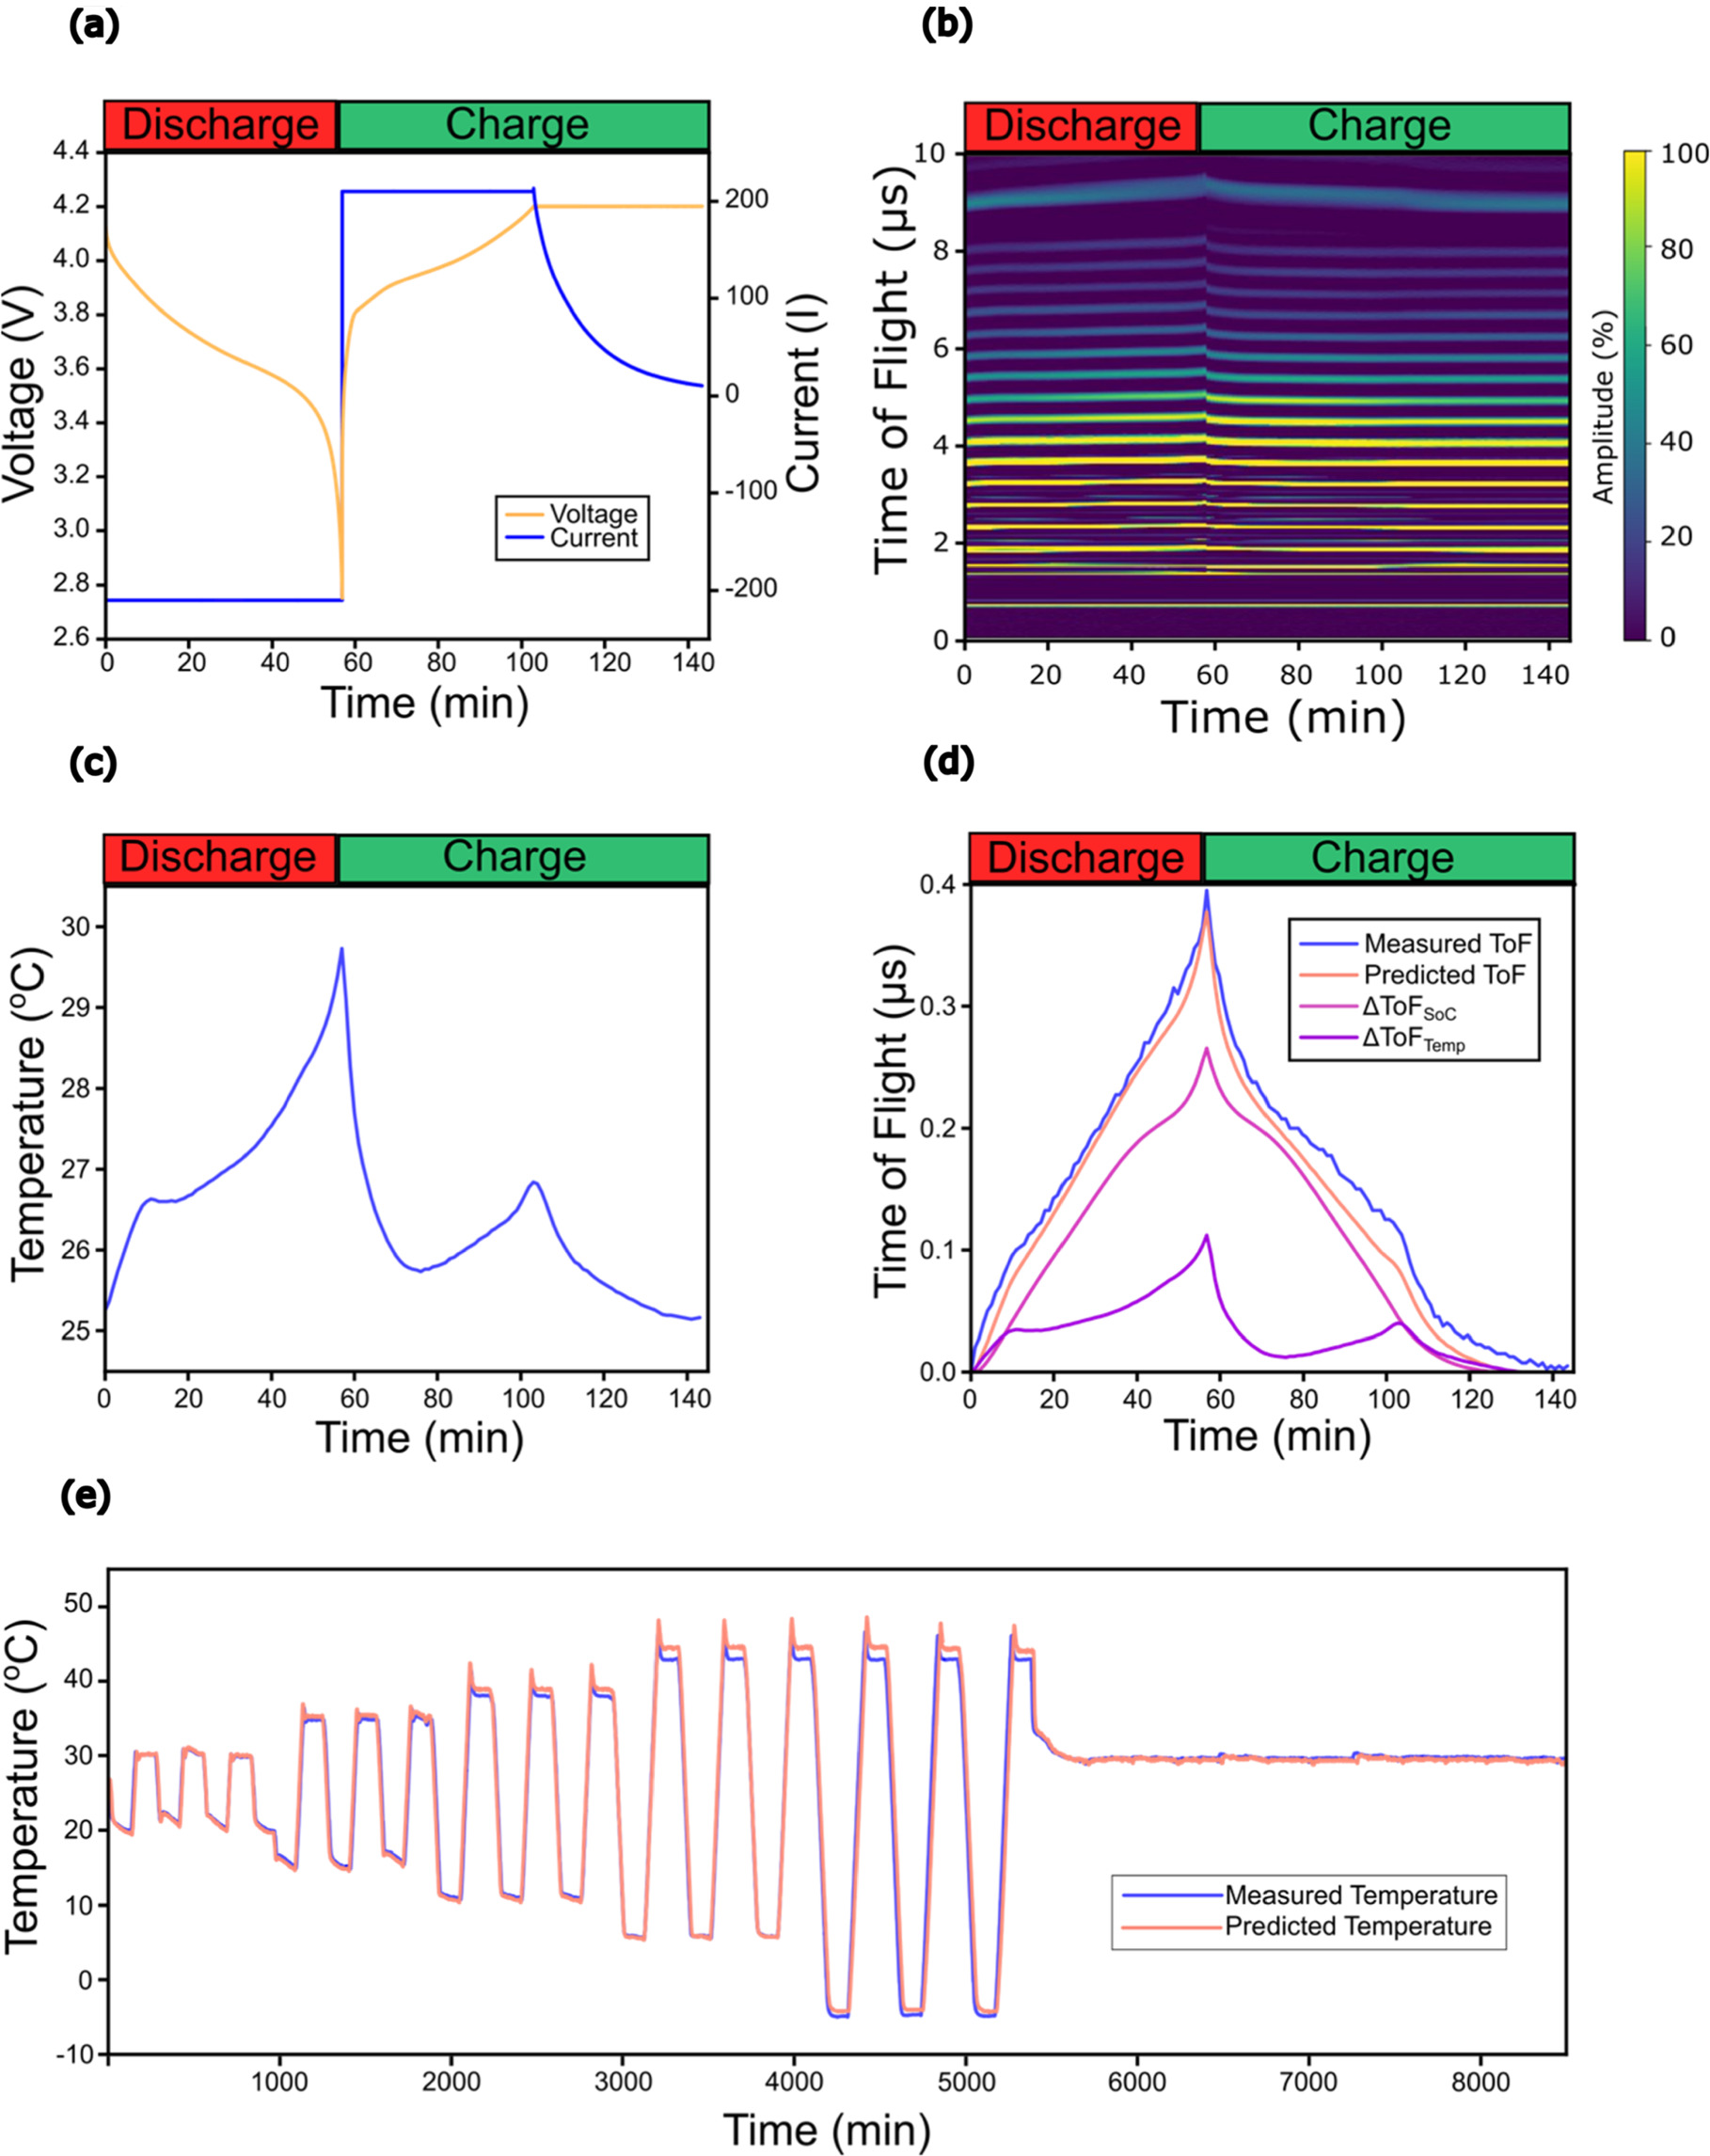
Figure 2. (a) The current and voltage profile obtained from a 1 C charge/discharge cycle of the studied pouch cells. (b) acoustic colourmap showing the change in the acoustic signal across the studied charge/discharge test. (c) The variation in cell temperature as the cell was discharged and charged. (d) the measured time-of-flight of the acoustic first-echo peak along with the change in ToF attributable to temperature, state-of-charge and resulting total predicted change in ToF. (e) A plot showing both the measured temperature change as a cell was heated and cooled uniformly along with the temperature predicted based purely on acoustic measurements.
Download figure:
Standard image High-resolution imageThe colourmap shown in Fig. 2 shows how the acoustic signal changes across the course of the discharge-charge cycle. When discharging, all peaks show an increase in ToF with the extent of this change increasing for peaks at higher ToF values, this is to be expected as signals present at higher ToF values are due to reflections from deeper within the cell meaning they pass through more material and any changes therefore influence them to a greater extent. The changing acoustic waveform contains a great deal of information about the cell; however, for simplicity, this work focuses mainly on the ToF of the first-echo peak since this is representative of all electrode layers within the cell and shows some of the largest changes during cycling. 27
The shift in the ToF of the first-echo peak is in part related to the changes in material properties that occur as a cell is discharged and charged. During discharge the graphite-based negative electrode is delithiated which results in a 300% change in modulus, 29 this change in modulus results a reduction in speed of sound through the material resulting in an increased ToF for the first-echo peak. Changes in the material properties of the other cell components will also play a role in the ToF shift along with thickness changes in the cell, the change in modulus of the negative electrode appears to be the dominant factor. 30 Previous work has shown that the changes in material properties observable using ultrasound measurements are not only due to the state-of-charge of the cell, although this is the main contributing factor, the cell temperature also plays an important role, particularly at higher C-rates where temperature changes are higher. 27
Figure 2c shows how the temperature of the cell surface changes across the discharge and charge cycle. A temperature change of ca. 5 °C is observed with the peak temperature present at the bottom of discharge. Changes in temperature of this magnitude will have a measurable impact on the material properties of all the components of the cell which will influence the ToF of the ultrasonic signal. 27 Providing that the cell temperature or the cell SoC is known, these two factors influencing the ToF can be decoupled. If both the cell temperature and the SoC are known then the change in ToF of the first echo peak can be predicted. 27 Figure 2d shows how the predicted ToF (orange) value compares to the measured value (blue), the plot also shows how the ToF is predicted to change based on the contribution of the cell temperature (purple) and the SoC (pink) individually. As discussed, the contribution of the material property changes due to SoC have a more significant influence on the ToF than the changing cell temperature, the influence of the cell temperature is linked to the change in temperature of the cell and as such its contribution to the overall change in ToF will vary based on the temperature at which the cell is being cycled and the C-rate.
If the SoC of the cell is known or remains constant it is possible to predict the temperature of the cell based solely on the ToF of the first-echo peak. To study the accuracy and repeatability of these predictions a cell was placed inside an environmental chamber and repeatedly, slowly, heated and cooled between the safe operating temperatures of the cell based on manufacturer's recommendations. The results from this study are shown in Fig. 2e, with the solid blue line showing the surface temperature of the cell recorded using a K-type thermocouple and the orange markers showing the predicted temperature based on the ToF of the first-echo peak. A good correlation is observed between the measured and predicted values with good repeatability and accuracy. Some slight deviations are observed at the highest temperature, but these variations are small and at the top of the range of safe working conditions.
The power of this technique for temperature prediction lies in the fact that the ultrasonic signal used to predict the temperature of the cell must pass through the entire cell before the ToF is measured (a measurement that takes microseconds) and as such will give information about temperature changes occurring at any layer within the cell. This opens the possibility of tracking not only the surface temperature as done with regular thermocouple measurements but also the possibility of tracking any internal temperature changes at measurement rates commensurate with BMS operation.
Detecting internal temperature changes within a cell is a significant advantage in monitoring the safe operation of the cell. A large quantity of cell failures arise from issues with the internal cell structure, for example, an internal short circuit. 31,32 In this case a certain defect is present within the cell, either due to manufacturer issues or cell operations outside of normal operation which can eventually lead piercing of the separator causing an internal short circuit. In this case, external temperature measurements may not detect these internal, localized heating, at least with sufficient warning to prevent thermal runaway which has been shown to occur over a timescale of tens to hundreds of microseconds. 33
The combination of a thermocouple to measure surface temperature in combination with ultrasonic temperature monitoring can be used to detect uneven heating, or potentially internal cell damage. The ToF shift due to even heating of the cell can be predicted 27 and as such, any deviations from this predicted value indicate that internal or uneven heating is occurring with another part of the cell changing temperature at a different rate to the surface thermocouple.
Previous work has shown that there is a significant change in the acoustic signal as a cell is heated to failure; 25,26 however, the correlation between the signal change and the cell temperature was not studied. To determine how effectively ultrasound can be utilised for measuring internal temperature changes and thermal gradients in cells, a cell was heated from one side using a heating cartridge with the acoustic transducer placed on the opposite side of the cell (as shown in Fig. 1a). Thermocouples were placed on either side of the cell next to the transducer and the heating cartridge to monitor the cell's surface temperature. The fully charged cell was then heated to failure.
The results from this localised heating experiment are summarised in Fig. 3 with a colourmap plot showing how the reflected acoustic response changes across the course of the test (a), in addition to the temperature of the cartridge heater, and the thermocouples placed on either side of the cell (b), as well as the cell's voltage (c).
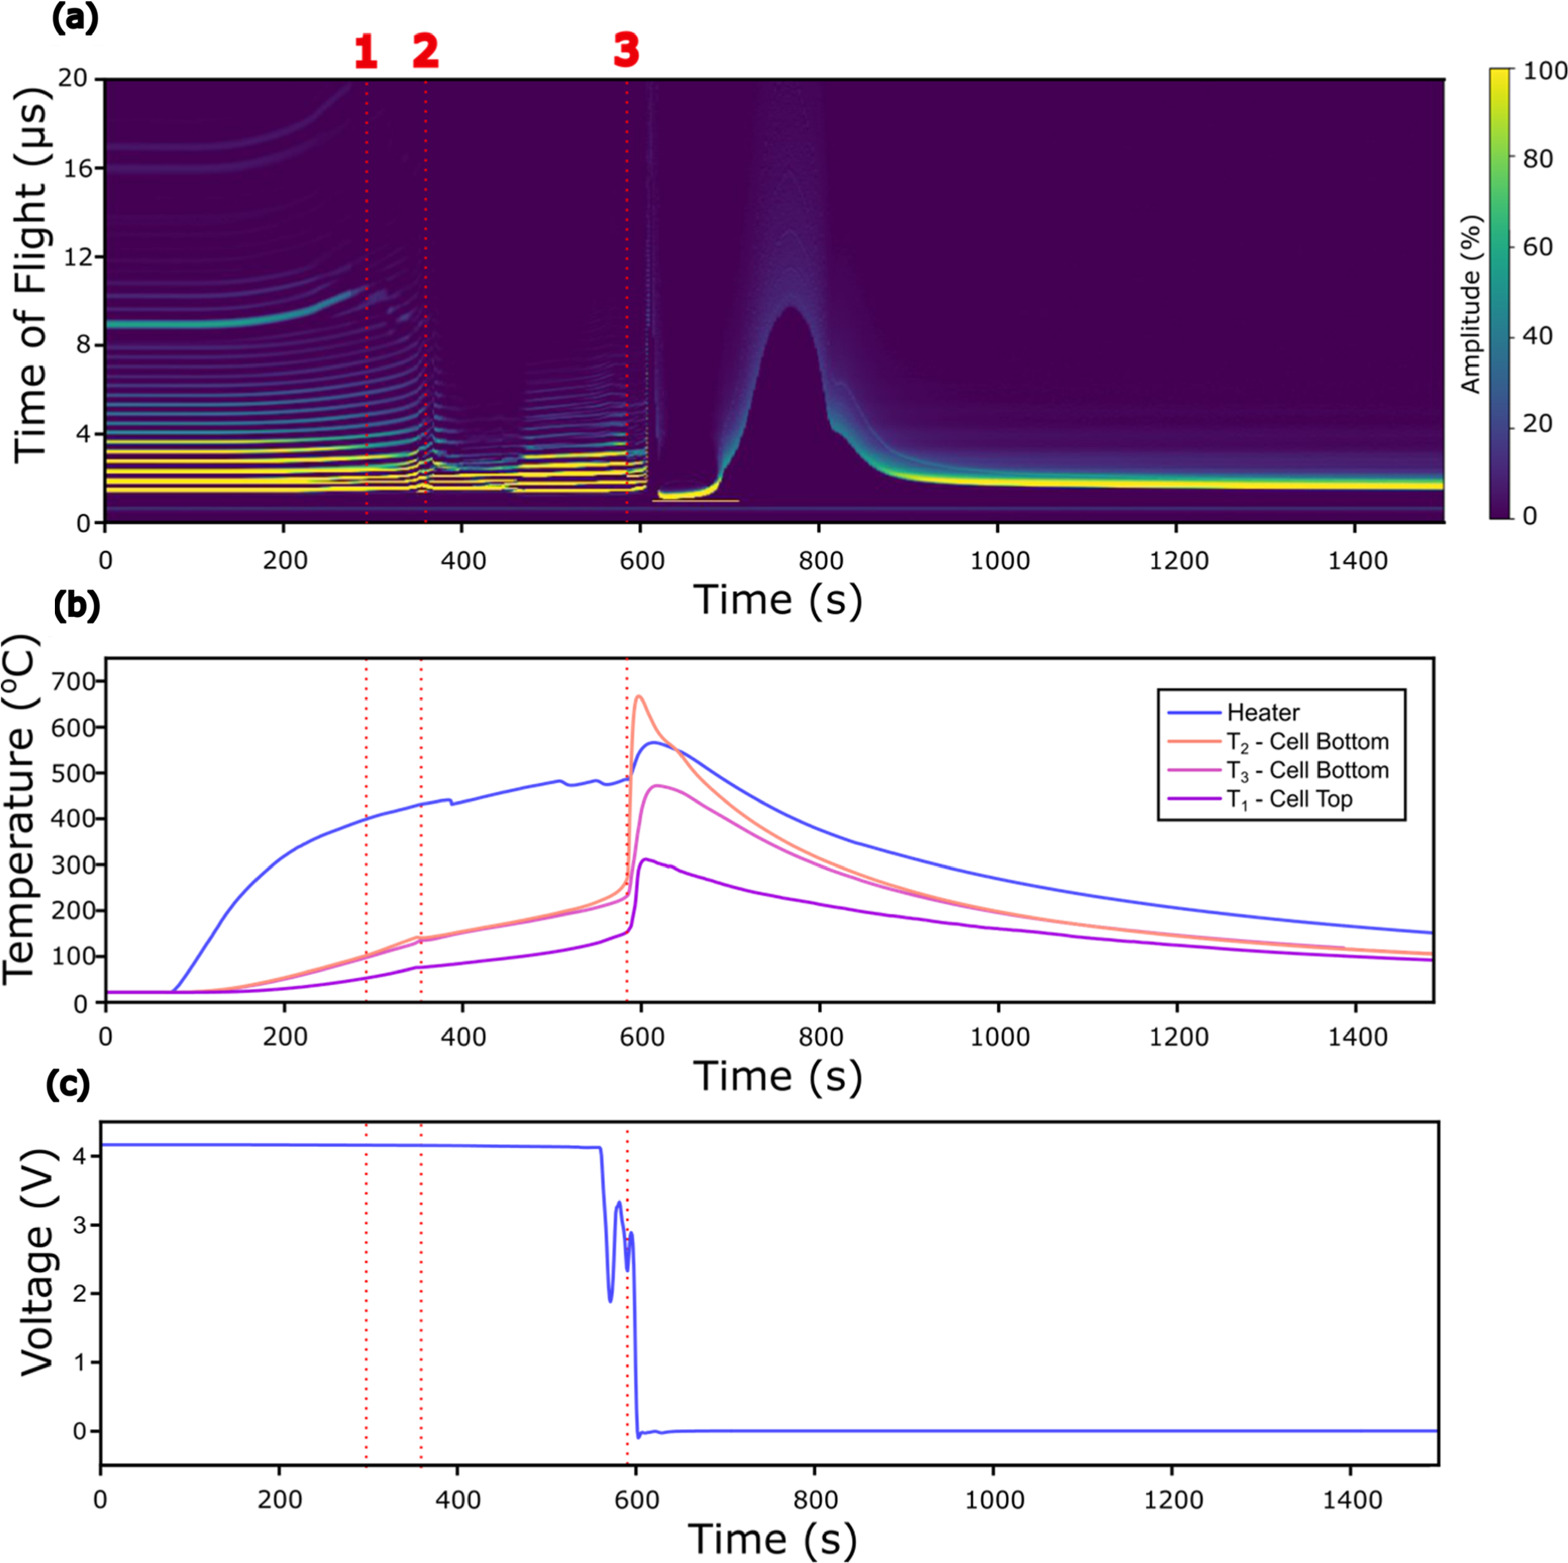
Figure 3. Results from the thermally induced failure of a full charged cell. (a) A colourmap plot showing the change in acoustic signal obtained as a pouch cell is heated to failure. (b) the variation in temperature across the course of the experiment (c) change in cell voltage.
Download figure:
Standard image High-resolution imageInitially, the cell was left to rest with the heater off, over the course of these ca. 75 s there is no change in the temperature, voltage, or acoustic waveform. Once heating is initiated the temperature of the heater rises relatively quickly this is followed by the two thermocouples placed on the bottom of the cell on either side of the cartridge heater also indicating a temperature increase. Both thermocouples on the bottom of the cell show similar temperatures but are significantly cooler than the heater itself, this is likely due to a poor thermal coupling between the heater and the base of the cell (note: improving the thermal coupling between the cell and cartridge was not attempted since this would likely affect the acoustic signal due to alterations to the interface that is generating the monitored first-echo peak). The thermocouple placed on the top of the cell also detects a temperature rise, however, the rate of heating is lower than for the bottom of the cell and the highest temperature reached before the cell enters thermal runaway is ca. 100 °C lower than the bottom of the cell indicating that a significant thermal gradient is present within the cell, as intended. Over the first 400–500 s little change in the cell voltage is observed.
When heating is initiated, a change in the acoustic signal is observed, initially there is an increase in ToF before some peaks begin to be lost after ca. 300 s (dotted red line 1) a distinct change in the waveform is then observed at 350 s when the majority of the peaks are lost (dotted red line 2). This drastic change occurs at the same point as a slight dip is observed in the cell surface temperature by all three thermocouples. This is likely due to the boiling of the electrolyte or gas formation from solid-electrolyte interphase (SEI) decomposition 3 resulting in the rupture of the cell pouch; the escaping gases allows the cell to cool slightly before heating driven by the cartridge heater continues. The formation of gas at a sufficient quantity to cause cell rupture likely results in a separation of electrode layers within the stack, this separation means that there is no longer a suitable path for the ultrasound to travel through the cell, which is likely responsible for the loss of the majority of peaks in the acoustic waveform. Interestingly, these significant changes in acoustic signal occur before the cell enters irreversible thermal runaway and before there is any sign of damage based on the voltage of the cell. This illustrates the power of the technique to detect internal temperature changes and indicate when significant damage is occurring to the cell prior to traditional methods.
The cell voltage begins to drop after ca. 550 s, this is proceeded by the cell entering thermal runaway and the cell voltage dropping to zero approximately 50 s later (dotted red line 3). The thermocouples placed on the bottom of the cell reach approximately 700 °C, with the top reaching over 300 °C these temperatures are sufficient to cause the acoustic transducer to fail, which can be observed just after 600 s when all signals are lost. After the failure of the sensor there appears to be a single peak present which does change ToF; however, this is believed to be noise from the damaged sensor and it no longer provides any useful information on the state of the cell under study, simply indicating that a catastrophic failure of the transducer has occurred.
Figure 4c shows a magnified section of the acoustic colourmap from 200 to 400 s. In this plot it can be clearly seen that the ToF of the first-echo peak increases, as expected, when the cell heats. This shift in ToF continues until ca. 330 s when the first-echo peak is lost. At the point the first-echo peak is lost all other peaks at lower ToFs remain visible, these peaks are then progressively lost in order of decreasing ToF. This pattern of peak loss is likely due to the nature of the heating of the cell, with the bottom of the cell, where these peaks at higher ToF values originate from being at a significantly higher temperature than the top of the cell close to the transducer. The loss of the first echo peak is likely due to the formation of gas 25 and while this would not be expected based on the temperature of the top surface of the cell which is only at 50 °C the bottom of the cell was at 95 °C, in the range where potential electrolyte boiling would be expected or gas formation due to the degradation of the SEI. 3 This demonstrates the advantage of the acoustic technique for monitoring cell SoH over the cell voltage or a single surface thermocouple, which if in the wrong position, as is the case with the top thermocouple in this arrangement, unable to detect significant thermal events and fail to detect cell degradation.
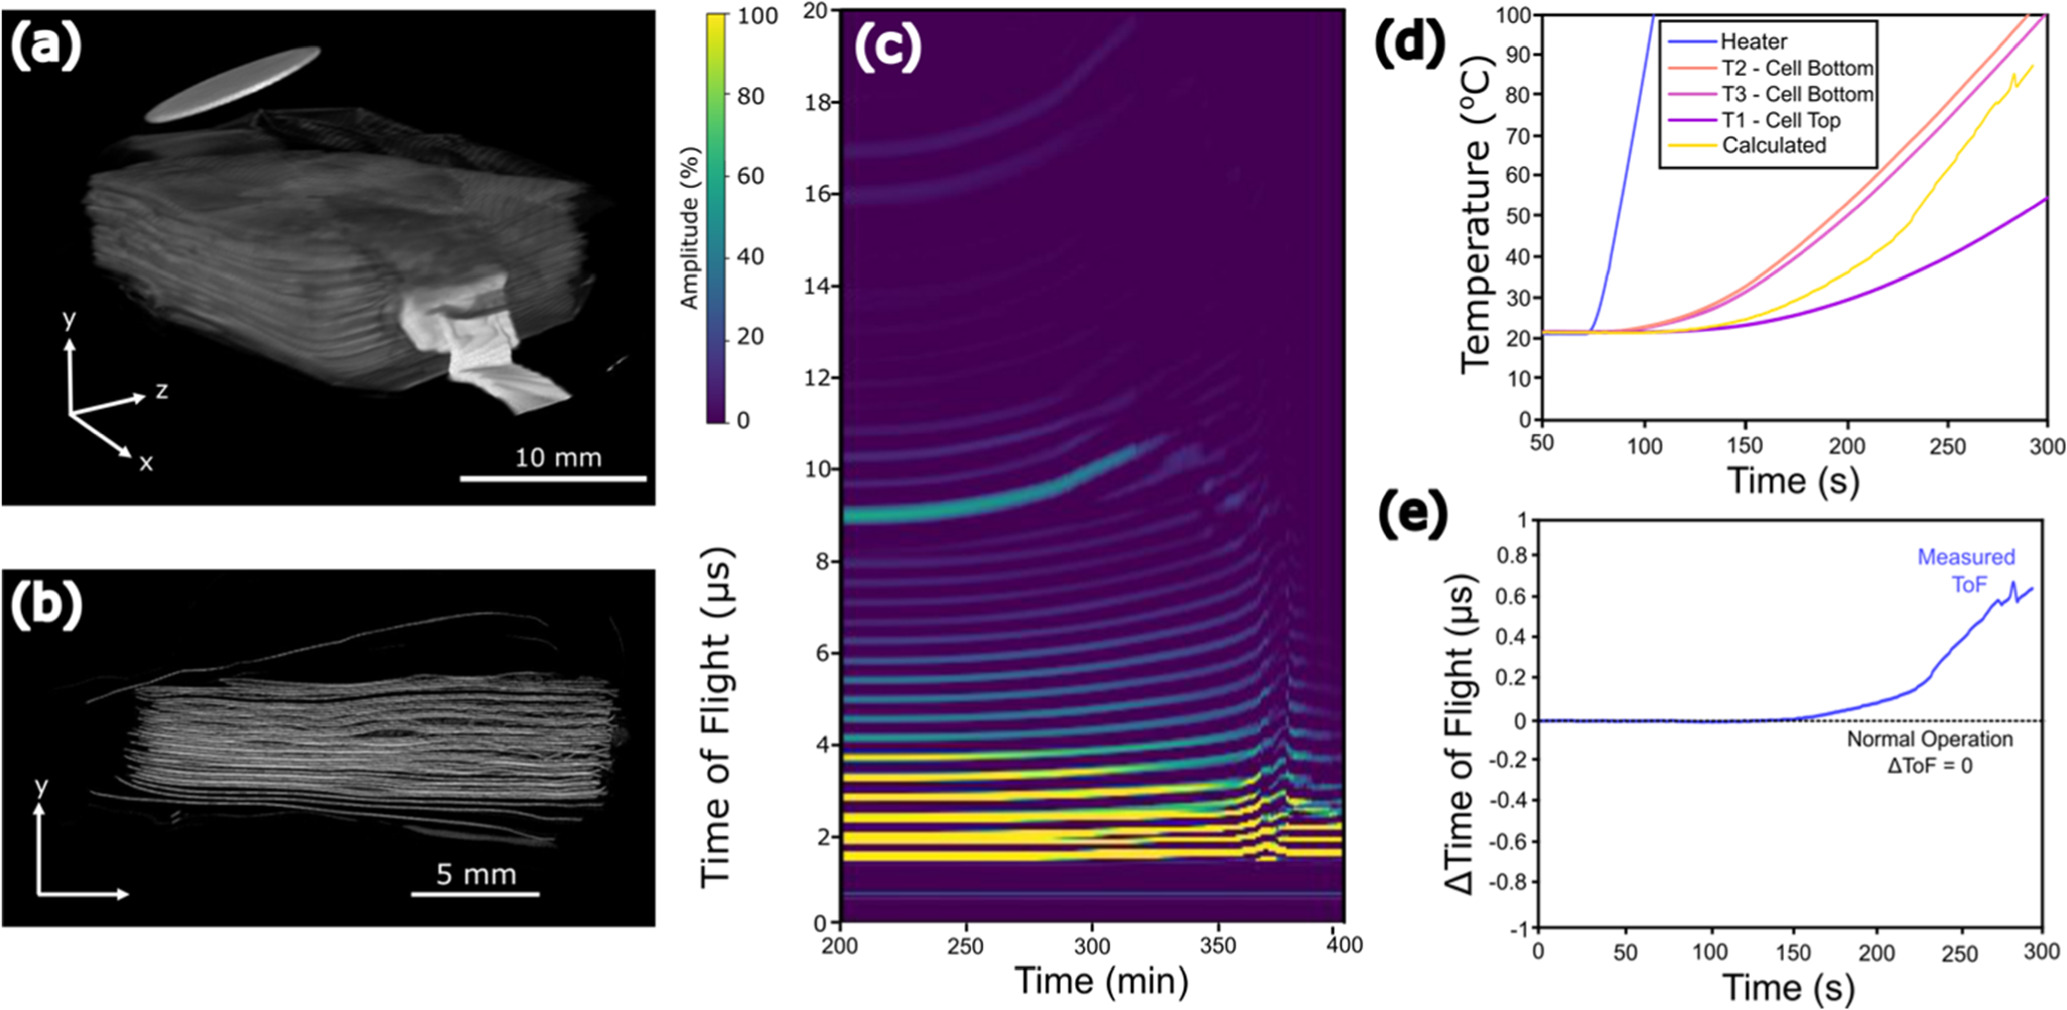
Figure 4. (a) 3D visualization of the pouch has been through thermal runaway (b) an example orthogonal slice of the failed cell, both obtained using X-ray CT. (c) magnified area of the acoustic colourmap during cell failure (d) a plot of the various cell temperatures and the temperature calculated based purely on the acoustic signal. (e) a plot showing the deviation in the experimentally measured ToF of the first-echo peak versus that calculated based on the acoustic signal.
Download figure:
Standard image High-resolution imageAs shown in Fig. 2, based on the work reported previously, 27 the temperature of the cell can be predicted based on the ToF shift providing the change in SoC is known, Fig. 4d shows the measured temperature at various positions on the cell along with the temperature calculated based on the ToF of the first-echo peak (SoC is assumed to be constant since the cell is not charging or discharging). The temperature calculated based on the ultrasound measurements is much larger than that recorded by the thermocouple placed on the top surface of the cell (purple trace) this shows that the ultrasound technique does indeed monitor the temperature of the cell as a whole, not just the surface of the cell that the transducer is in contact with. The longer the experiment continues the more the predicted temperature deviates from the surface temperature of the top of the cell. Across the course of the test, the predicted temperature does not reach the same temperature recorded by the thermocouples placed on the bottom of the cell. Since the ultrasonic pulse must pass through the colder top half of the cell and the hotter bottom half of the cell, the temperature it predicts will be an "averaged" temperature of the entire cell.
These results show that predicting the temperature of a cell based on ultrasound is most accurate when the cell is heated or cooled uniformly (Fig. 2e), this can, however, be used to our advantage and used to predict when a cell is either heating ununiformly or when part of the cell is at a temperature different from that recorded on the surface - giving a rapid indication that there is an issue with the cell operation. This is due to the nature of the method used to estimate the temperature based on the ToF of the first echo peak. As a material heats or cools this will effect the material properties such as the density and elastic moduli of that material. These changes in material properties in turn effect the speed of sound through the material and as such will influence the ToF of the first echo peak. Since the first echo peak is travelling through every layer within the cell (within 5–10 μs) it does not matter which layer this temperature change occurs at it will have some influence on the ToF which can be detected rapidly.
Figure 4e plots the difference between the temperature predicted based on the ultrasound measurements and the temperature recorded by the thermocouple placed on the top surface of the cell. If the cell is heating and cooling uniformly this value should remain zero since the predicted and recorded temperature should be the same. For the first 130 s of the test, this is the case with a value of zero or near zero recorded. However, after this period of time the value increases indicating that the cell temperature predicted based on the ultrasound is higher than that recorded by the surface thermocouple. This is a clear indication that either the temperature within the cell is different to that measure on the surface or potentially some significant degradation of the materials inside the cell, both of which indicate that there is an issue with the cell and operation should be stopped.
Figure 4a shows a 3D reconstruction of the internal electrode stack generated using X-ray CT after the cell has endured thermal runaway, Fig. 4b shows an orthogonal slice of the cell. From these images it is clear that the cell has undergone a thermal runaway reaction that has resulted in significant damage to the cell, electrode layer separation and damage is evident throughout the entire cell. The white disc observed in Fig. 4a is part of the damaged transducer which became attached to the pouch cells outer casing (cell casing is omitted from these reconstructions for clarity).
From the results summarised in Figs. 3 and 4 it is obvious that ultrasound can be used to track significant degradation and total cell failure, the results suggest that the significant changes in acoustic signal occur before full failure of the cell, indicating that, as previously demonstrated, 34 that the ultrasound technique is highly sensitive to even minor defects or damage that may be incurred in the build-up to thermal runaway. To demonstrate that full, catastrophic, cell failure is not required in order to get an acoustic response a discharged cell was subjected to the same localised heating test with the results shown in Fig. 5.
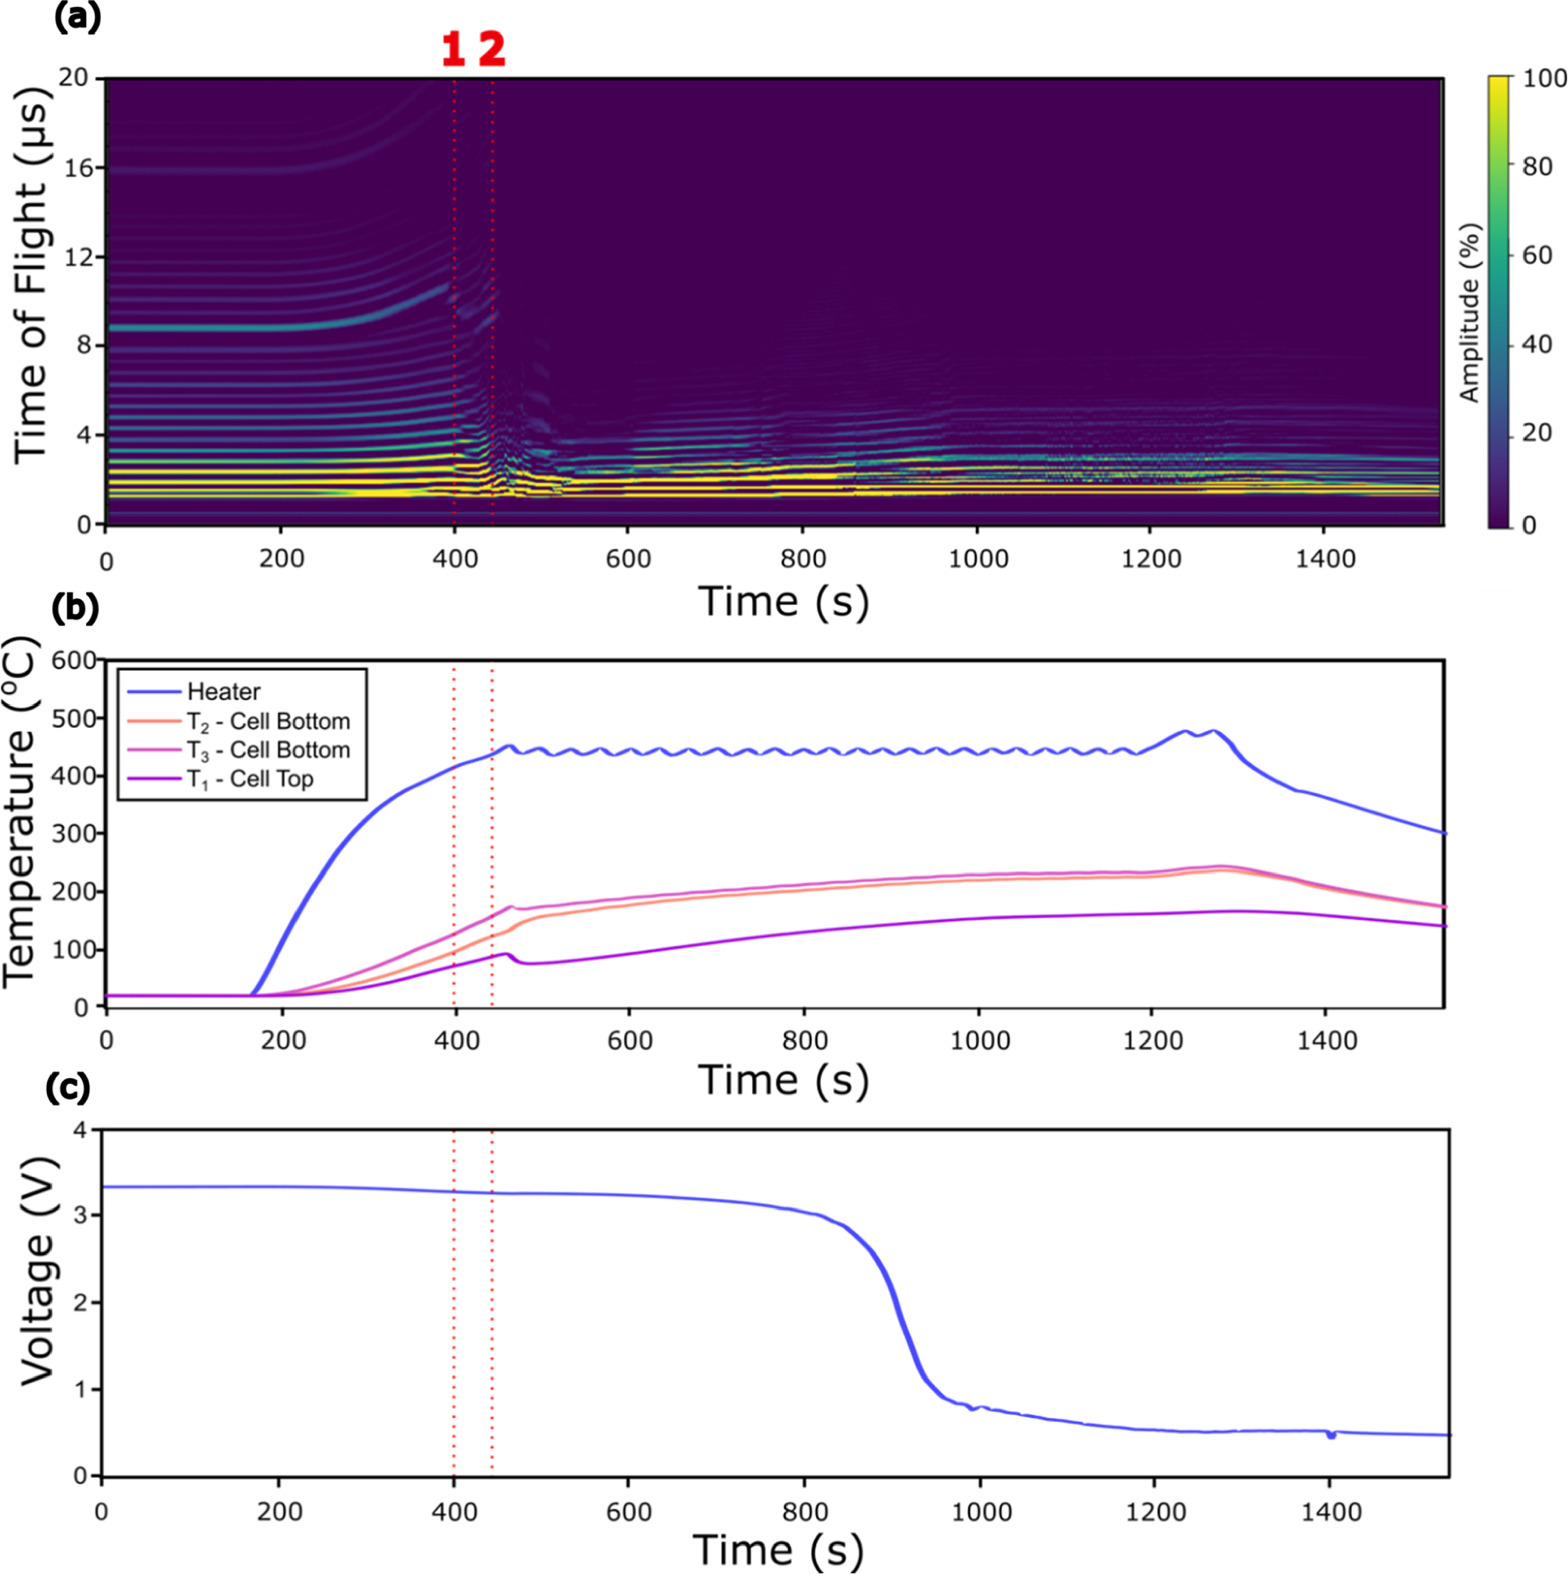
Figure 5. Results from the thermally induced failure of a full discharged cell. (a) A colourmap plot showing the change in acoustic signal obtained as a pouch cell is heated to failure. (b) the variation in temperature across the course of the experiment (c) change in cell voltage.
Download figure:
Standard image High-resolution imageInitially the cell was left to rest with the heating cartridge turned off, over this period there was no change in acoustic signal, voltage, or temperature of the cell. After a period of 150 s the heating cartridge was turned on, an immediate increase in temperature of the heater was observed followed by a slower heating of the cell surface. Both thermocouples on the bottom of the cell, next to the heater, showed higher temperatures than the thermocouple placed on the top surface of the cell next to the transducer confirming a large temperature gradient through the cell. With the cell at 0% SoC there was insufficient energy present within the cell to cause a full thermal runaway event to occur and as such the cell continued to be heated until the voltage dropped to close to zero. The maximum temperature recorded by the thermocouples was ca. 250 °C.
Despite the fact that no thermal runaway event occurred there was still a significant change in the acoustic signal. The trend observed is similar to that seen in Fig. 3 for the fully charged cell. Initially the ToF of the first-echo peak increases as the cell heats before the first-echo peak is lost when the average temperature of the bottom of the cell is ∼100 °C (red dotted line 1), this is likely due to the boiling of the electrolyte or gas formation from SEI decomposition which is expected in this temperature range resulting in the separation of electrode layers, or their delamination. 3 After the loss of the first-echo peak, peaks at lower initial ToFs are subsequently lost (red dotted line 2). Some peaks at low initial ToF values remain throughout the experiment. Without full thermal runaway the temperature of the top surface of the cell does not reach a sufficient temperature to damage the transducer and as such some peaks at lower ToF, presumably due to reflections near the top of the cell where damage is limited, remain throughout the experiment.
An orthogonal slice of a 3D X-ray CT scan reconstruction of the cell after thermal abuse is shown in Figs. 6a and 6b. The topmost electrode layers positioned closest to the transducer and furthest from the heating cartridge show little evidence of deformation or damage; however, the bottom electrode layers of the cell (in contact with the heating cartridge) show some degradation with evidence of de-lamination and electrode damage with this extending approximately halfway through the thickness of the cell. The extent of thermal damage to this cell is significantly less that that observed with the fully charged system (Figs. 4a and 4b), this emphasizes the sensitivity of this technique for detecting internal variations and damage.
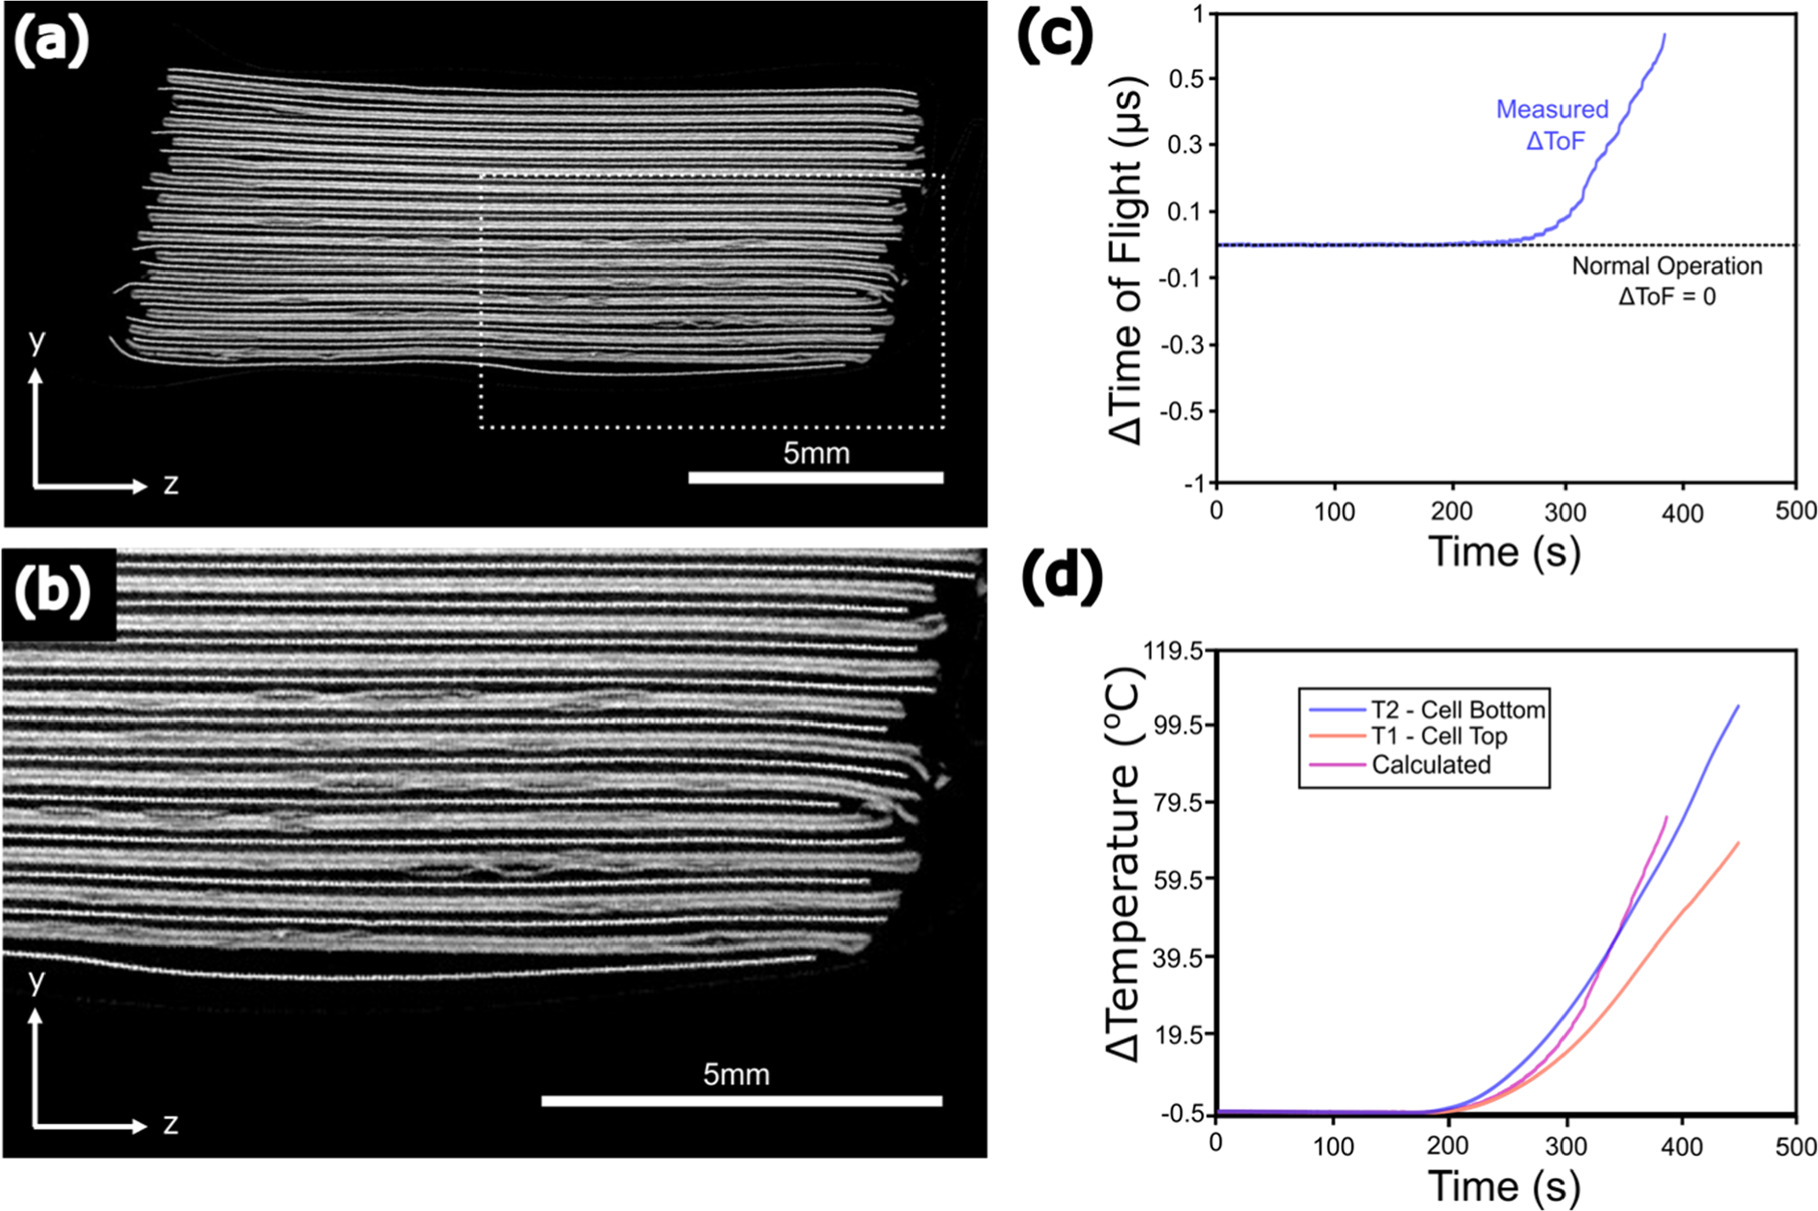
Figure 6. (a) Orthogonal slice of the X-ray CT data obtained from the 0% SoC after undergoing thermal abuse, a magnified version of the bottom layers is shown in (b) to highlight the damage to the side in contact with the cartridge heater. (c) a plot showing the deviation in the experimentally measured ToF of the first echo peak versus that calculated based on the acoustic signal. (d) the measured temperature of the top and bottom of the unevenly heated cell versus the value calculated from acoustics.
Download figure:
Standard image High-resolution imageFigure 6d shows the change in temperature of the cell over the first 450 s of the experiment as measured by the thermocouple placed on the top and bottom of the cell as well as the temperature predicted based on the received ultrasound signal. As expected, based on the previous results shown in Fig. 4 there is a significant temperature gradient across the cell caused by heating the cell only from the bottom side, this results in a difference in temperature recorded by the thermocouples on the top and bottom of the cell. The temperature predicted based on analysis of the ultrasound data indicates that the cell temperature is higher than that being reported by the thermocouple placed on the top of the cell next to the transducer, this further demonstrates the ability of the technique to detect heating occurring within the cell, regardless of the depth and distance at which it is occurring from the transducer, again illustrating the advantage of measuring the temperature in this manner.
Interestingly in this test the ultrasound predicted temperature not only goes above the temperature of the top of the cell but also above the temperature recorded by the thermocouple on the bottom of the cell, this may be due to multiple factors, the first is the fact that the heating cartridge used to heat the cell is heated to a much higher temperature than recorded by the thermocouples placed either side of the heated (Fig. 5b) and as such the temperature value predicted based on ultrasound may be able to more accurately predict the temperature below the transducer (where the heating cartridge is located in contact with the cell), the second possible factor may be cell degradation caused by the heating, influencing the ToF of the first echo peak on which the prediction is based. Regardless of which of these factors is the major contributor to the deviation observed both are indications of issues occurring within the cell. Figure 6c shows a plot of the deviation of the predicted temperature from the surface temperature on the top of the cell. If the cell is operating "normally" and heating is relatively even, then this value should be zero as predicted and the temperature measured on the top of the cell should be the same. Initially the difference between measured and predicted is very low; however, as cell heating is initiated this value rapidly begins to deviate from zero indicating uneven heating and/or cell damage is occurring. These tests prove that the acoustic technique employed in this study can clearly indicate issues with cell operation and measure cell damage even at 0% SoC and detectable changes in measurements are not reliant on the total and catastrophic failure of the cell. As such, this opens the possibility of using the technique as an early warning system to predict when thermal runaway may occur offering the potential to prevent the cell entering irreversible thermal runaway by ceasing operation or making the cell safe.
Based on the results discussed thus far, it is evident that there is a significant change in the reflected acoustic waveform before the cell enters full thermal runaway and catastrophic failure of the cell is not required to instigate these changes. The results also show that the changes are similar and significant regardless of if the cell is fully charged or fully discharged. If this technique is to be used to monitor the cell safety and give early warning of potential cell failure a good understanding of how the changes in acoustic behaviour, brought on by cell degradation before failure are related to and distinct from the changes in the acoustic waveform when a cell is cycled and operating under normal, "safe" conditions, where the heating for a cell of this size would be expected to be more even through the thickness of the electrode stuck, unlike in these "uneven" heating experiments discussed so far.
To investigate the difference in waveform changes related to the cell's state-of-charge and significant degradation that proceeds full thermal runaway, a cell was placed within an accelerating rate calorimeter and discharged and charged repeatedly at 1 C before being uniformly heated to failure. The results from this test are summarised in Fig. 7, which shows the acoustic waveform changes (a), cell temperature (b), and the applied current and resulting voltage changes (c).
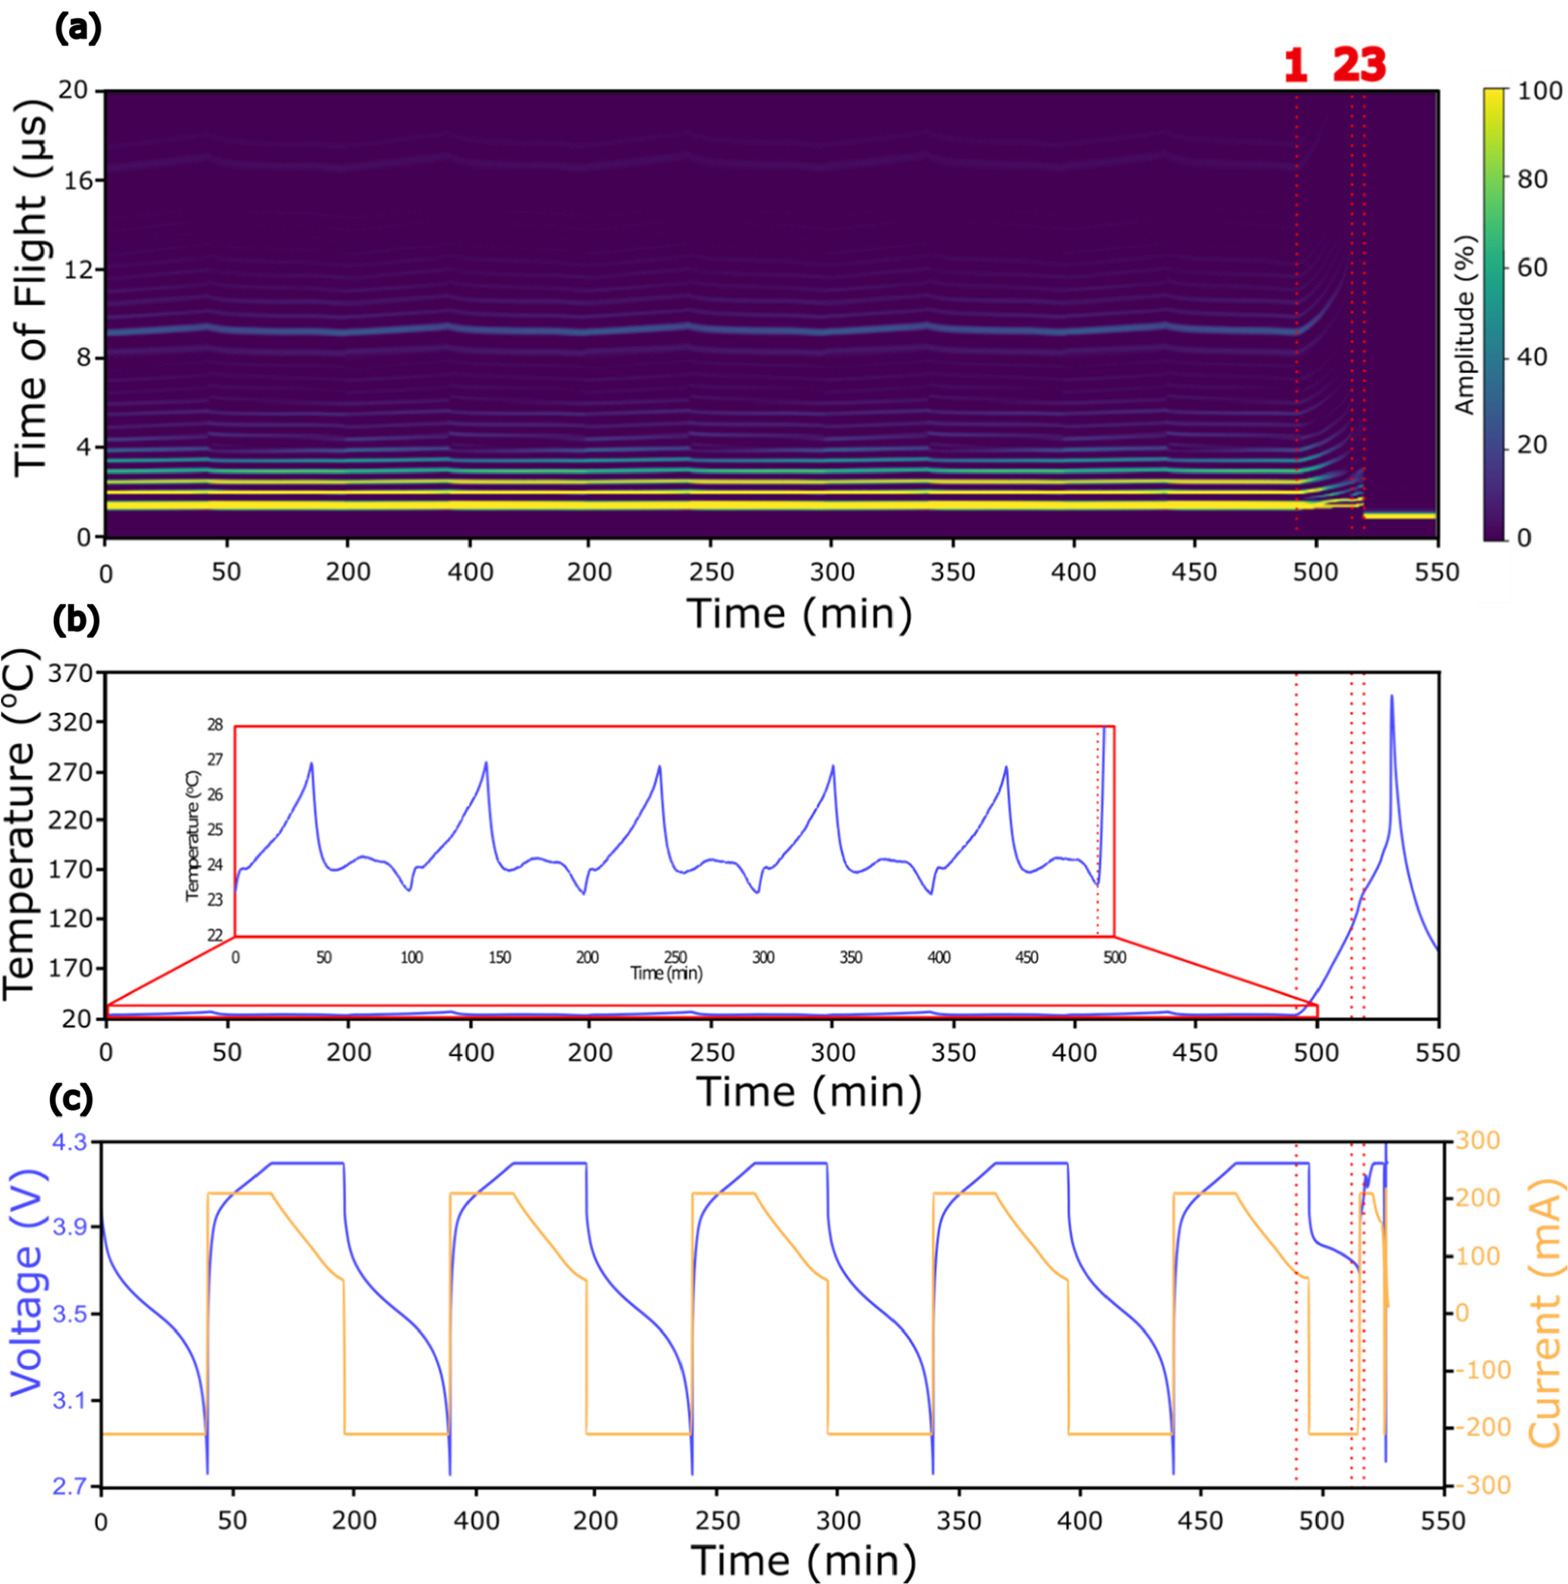
Figure 7. (a) Colourmap showing the acoustic waveform changes that occur during 1 C cycling and when the cell is uniformly heated to failure (b) the cell temperature during cycling and during failure (insert shows a magnification of temperature changes during 1 C cycling. (c) the current applied during testing and the resulting voltage.
Download figure:
Standard image High-resolution imageOver the course of the first 500 min of the test before heating was started, a repeatable change in acoustic waveform is observed with a ΔToF ca. 0.4 μs observed with the first-echo peak. The temperature profile of the cell during this cycling period (insert, Fig. 7b) was also repeatable with a maximum temperature change of ca. 4 °C, on the surface of the cell, recorded. When the cell heating is started the ToF begins to shift higher than seen previously at any point across the 1 C cycling, changes in the waveform, distinctly different from those observed during regular cycling, are apparent including the appearance of additional peaks and the splitting of some single peaks into doublets, likely due to the formation of additional interfaces.
Figure 8 shows a magnified section of the acoustic colourmap shown in Fig. 7 with a focus on the behaviour of the first-echo peak during the final discharge and charge before heating was started (note: this final cycle is representative of the four previous cycles).

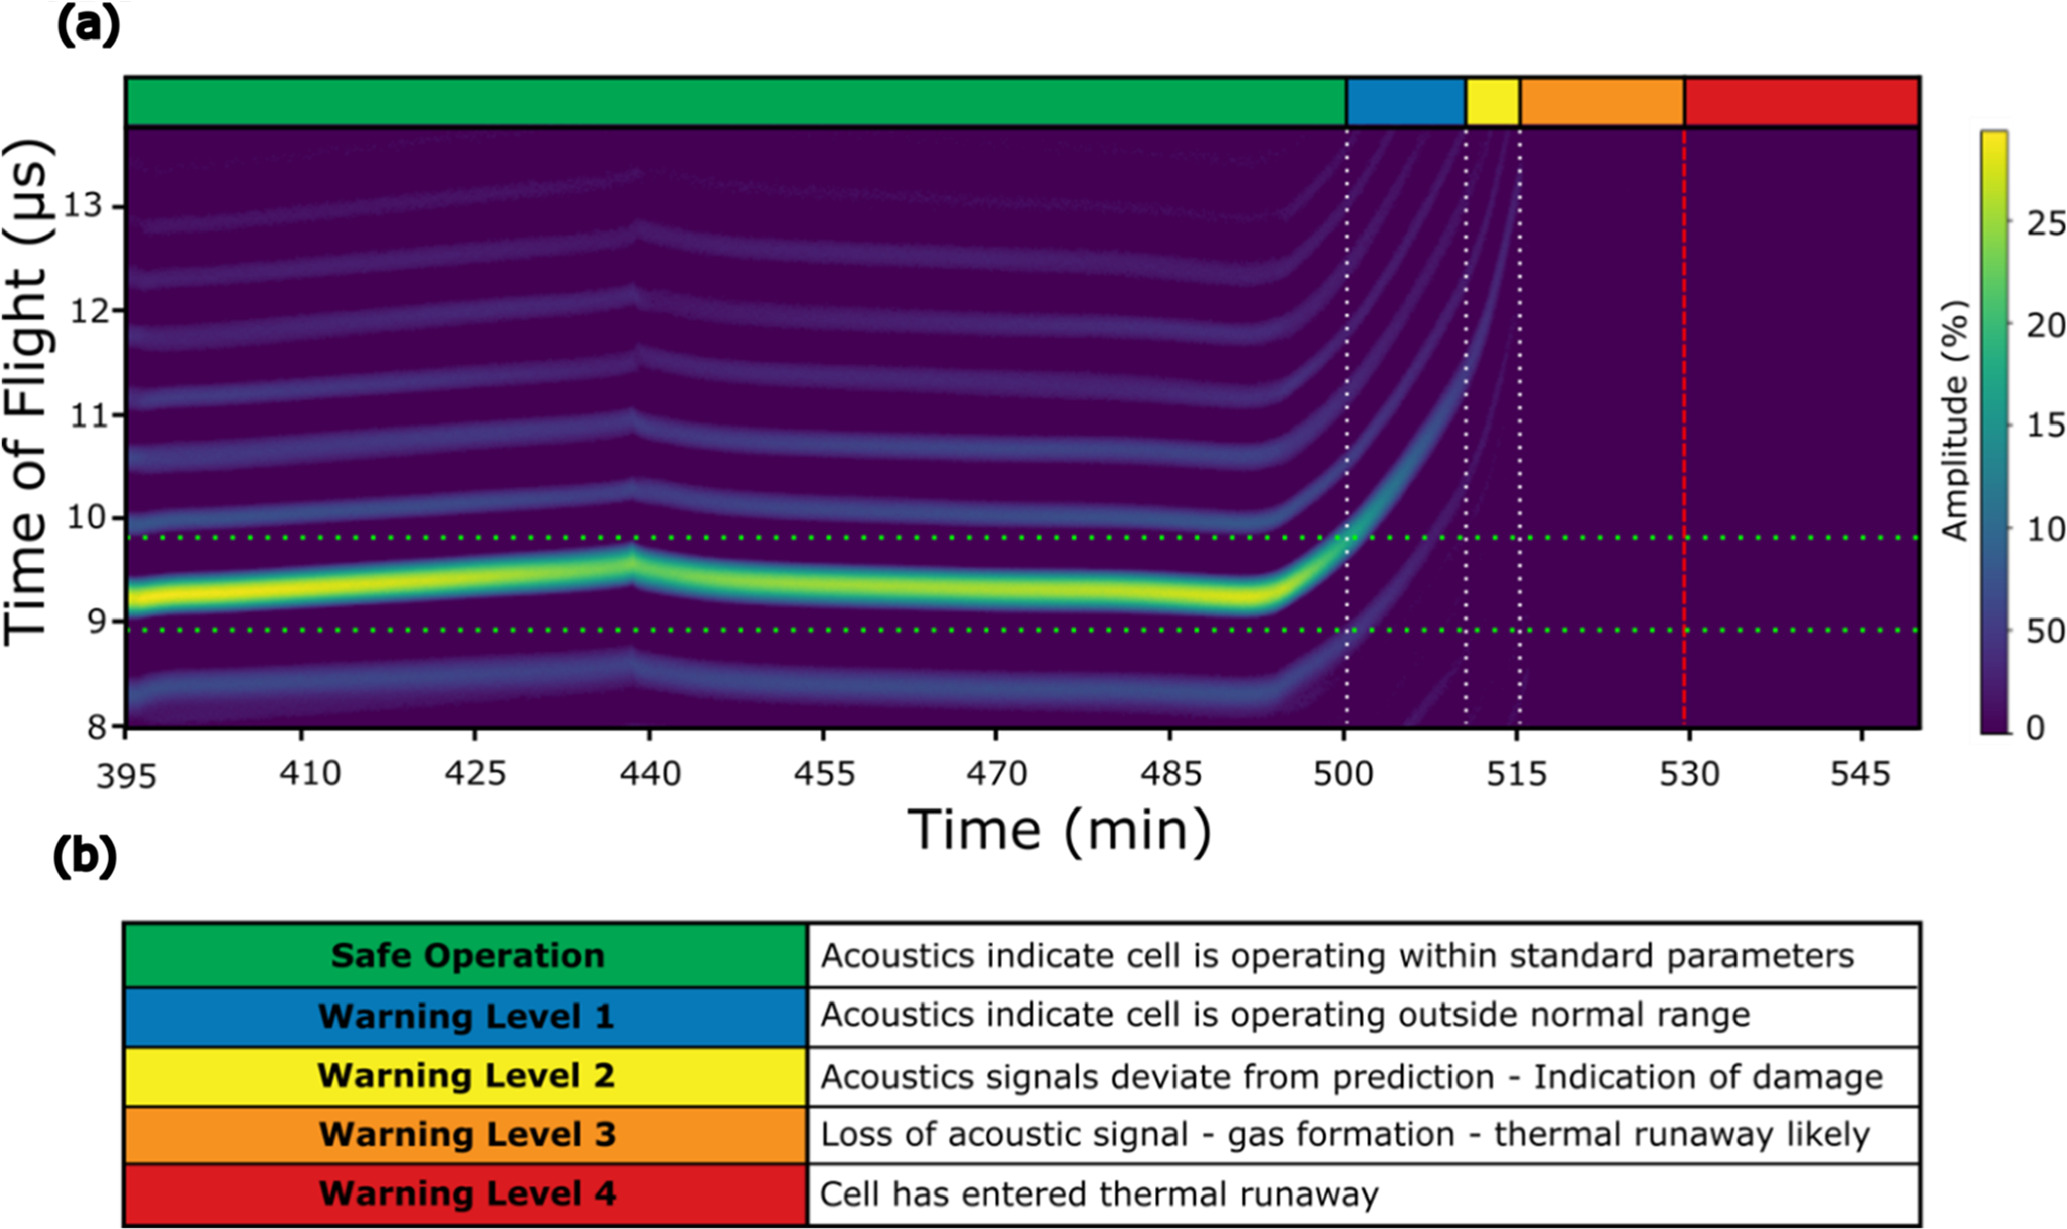
Figure 8. (a) A magnified section of the acoustic colourmap showing the behaviour of the first echo peak during the final cycle and during failure. The horizontal dotted green lines represent the highest and lowest positions expected for the ToF of the first echo peak under standard operating conditions. The white vertical dotted lines represent the points at which the various warning levels are achieved as outlined in the table (b). The dotted red vertical line indicates the point that the cell enters thermal runaway as determined by the rapid increase in heating rate.
Download figure:
Standard image High-resolution imageBased on the data obtained from this test and focusing on the first-echo peak, which gives information on the whole thickness of the cell, several warning signs in the behaviour of the acoustics can be obtained, each increasing in seriousness. This can be used to develop a multi-stage warning system. As discussed, one of the earliest signs that the cell is experiencing unexpected stresses is when the ToF of the first echo peak moves outside of the expected operating range. For a given temperature and a given C-rate the ΔToF is expected to stay within a given range related to the changes in material properties due to SoC and temperature changes. This typical working range with a buffer of +/−3% is represented in Fig. 8 by two horizontal dashed green lines. If the ToF moves outside of this range, this does not necessarily indicate cell failure is immanent but merely indicates that the cell is not performing as typically expected. For example, an increase the temperature of the environment that the cell is being cycled. The range can also be set to mirror the manufacturer's maximum operating temperature. In this example an indication that the cell is no longer functioning within the typical parameters expected for 1 C cycling at room temperature is represented by the first dotted vertical line in Fig. 8. The ToF passing outside of this regular range of ToF can be considered a first level warning (Fig. 8b). This is one of the simplest warnings that can be generated since it does not require an input other than the acoustic signal.
A second level warning (Fig. 8b) is based on the fact that the ToF change for a cell can be predicted if the SoC and temperature of the cell is known. As discussed within this study, a deviation from this predicted value is a key indicator of internal or uneven cell heating or damage occurring within the cell, a strong indicator that there is an issue with cell performance. In the data shown in Fig. 8, the cell is heated evenly in a calorimeter at a rate sufficient to not cause the significant temperature gradients observed in Figs. 3 and 5 and as such a "level 1 warning" is triggered first. It is possible that should significant uneven heating occur (e.g. an internal short) then a level 2 warning may be observed before a "level 1 warning," due to the more serious nature of the causes of a level 2 warning, level 1 can be considered to be skipped. The warning produced by this deviation from predicted values offers a significant advantage over the warnings based on cell voltage or temperature since the technique is sensitive to the entire thickness of the cell under the ultrasonic transducer.
The third level of warning obtainable from studying the first-echo peak of the ultrasonic signal is reached when the amplitude of the peak drops below a certain value and can no longer be detected. The loss of this peak is a key indicator that the ultrasonic signal can no longer penetrate through the whole cell and likely indicates the formation of gas at a certain point or multiple points within the cell's layered structure. The formation of gas under these conditions has been reported as a key precursor to the cell entering thermal runaway. While some of the previous warning levels may be caused by other, less serious, issues (see level 1 warning) the loss of the first-echo peak strongly indicates that there is a severe issue with the operation of the cell and its operation should be ceased immediately.
The changes in acoustic signal reported thus far have been significant, giving a clear indication that there is a serious issue with the cell operation before the cell begins to self-heat and enter irreversible thermal runaway. However, for the data thus far, the warning signs have been discussed but not acted upon, and the cell has been allowed to enter thermal runaway. In order to demonstrate that these significant changes in acoustic waveform and three levels of warning sign are observed sufficiently early to stop cell operation and prevent thermal runaway, a cell was evenly heated in an accelerating rate calorimeter until the first echo was lost and a "level 3 warning" triggered. Once this warning level was reached the cell heating was stopped and the cell allowed to cool. The results from this study are shown in Fig. 9.
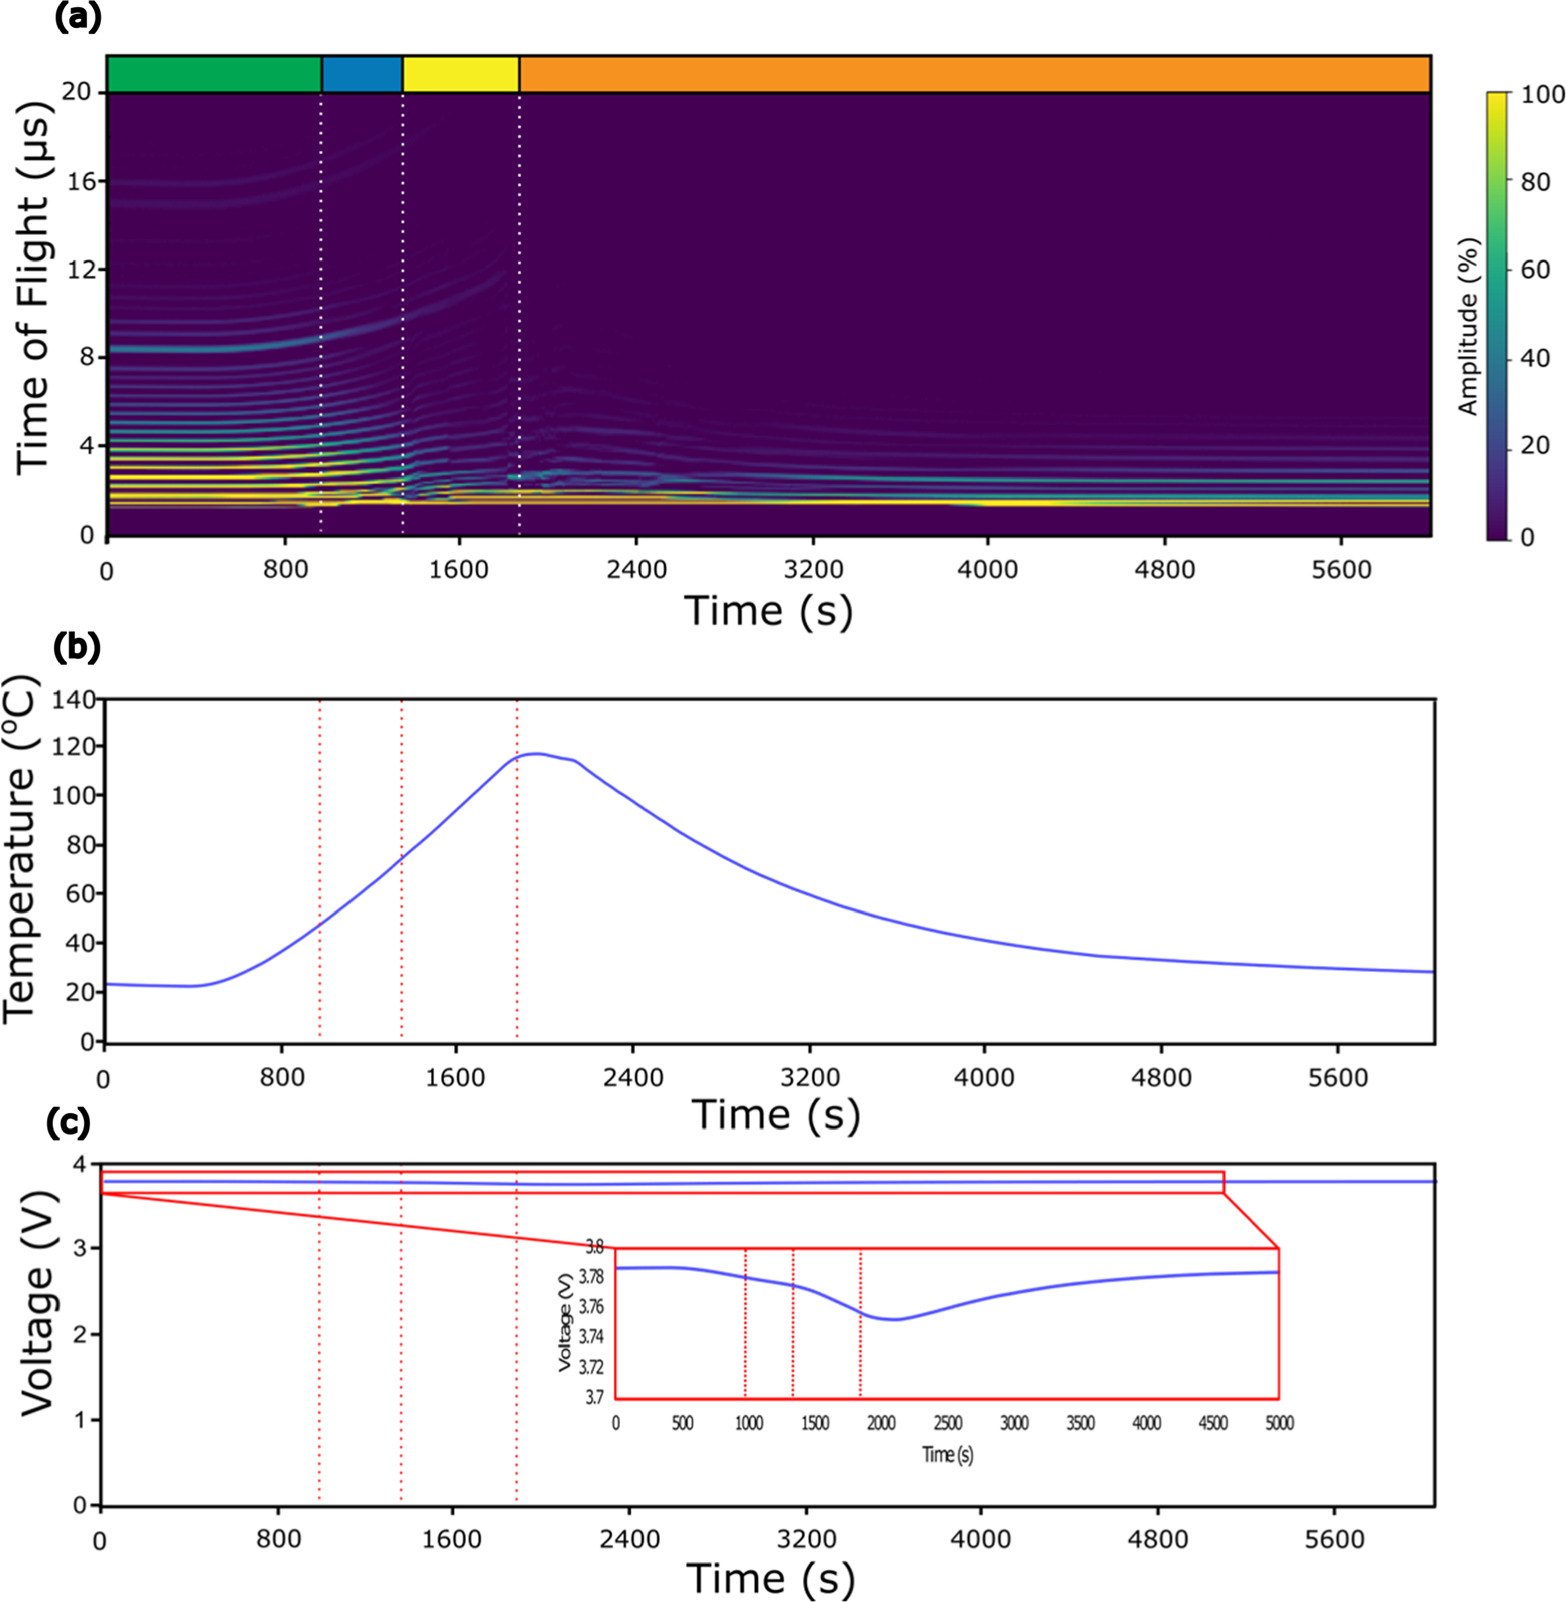
Figure 9. (a) A colourmap showing the change in acoustic signal as the cell is heated to a level 3 warning (See Fig. 8a) before being cooled. The associated temperature (b) and voltage (c) profiles are shown. The colour bar at the top represents the warning level with green indicating safe operation, blue—warning level 1, yellow—warning level 2 and orange—warning level 3.
Download figure:
Standard image High-resolution imageAs shown in Fig. 9, the cell was initially held at room temperature (ca. 25 °C) and over this period of time when the temperature was stable there was no change in the acoustic waveform or in the voltage of the cell. As uniform cell heating was initiated at approximately 425 s there is an immediate response from the acoustic data with the increase in ToF of the first-echo peak evident in Fig. 9a. after approximately 850 s the ToF of the first echo peaks moves outside of the normal range of operation triggering a level one warning (blue). Due to the uniform heating of the cell in these tests the predicted ToF change initially matches the surface temperature of the cell recorded using a thermocouple; however, after ca. 1220 s the ToF of the first-echo peak begins to drift from the predicted value, triggering a level 2 warning (yellow). After a further 600 s the surface temperature of the cell peaks at ca. 120 °C, at this point the first-echo peak is lost, triggering a level three warning (orange). At this point the cell heating was stopped, and the cell was allowed to cool. Over the course of the experiment the acoustic waveform experiences significant changes whereas the voltage shows a minimal change. After the heating is stopped the cell cools back to room temperature, the voltage returns to normal after a small deviation, and the cell does not continue to heat, indicating that the cell has not entered irreversible self-heating which would lead to thermal runaway and instead the acoustics has been able to indicate that internal damage and degradation is occurring. When the cell has cooled to room temperature the acoustic signal does not return to normal indicating that the damage inflicted on the cell is permanent and not reversible. The lack of an acoustic signal on this cell which appears undamaged through voltage measurements and physical appearance provides some evidence that this ultrasonic technique can be used to determine if cell are damaged, abused or contain defects without prior knowledge of the cell's precious uses and life, this is in agreement with work previously reported in this area. 23,34
Figure 10 shows several orthogonal slices obtained from X-ray CT imaging of the cell tested in Fig. 9. At several cross sections through the cell there is evidence of gas formation with the de-lamination of electrode layers evident at several points. The formation of a single gas pocket within the cell should be sufficient to block the transmission of the signal through the cell, hence the drop in amplitude and loss of the first-echo peak as observed in Fig. 9, resulting in the level three warning.
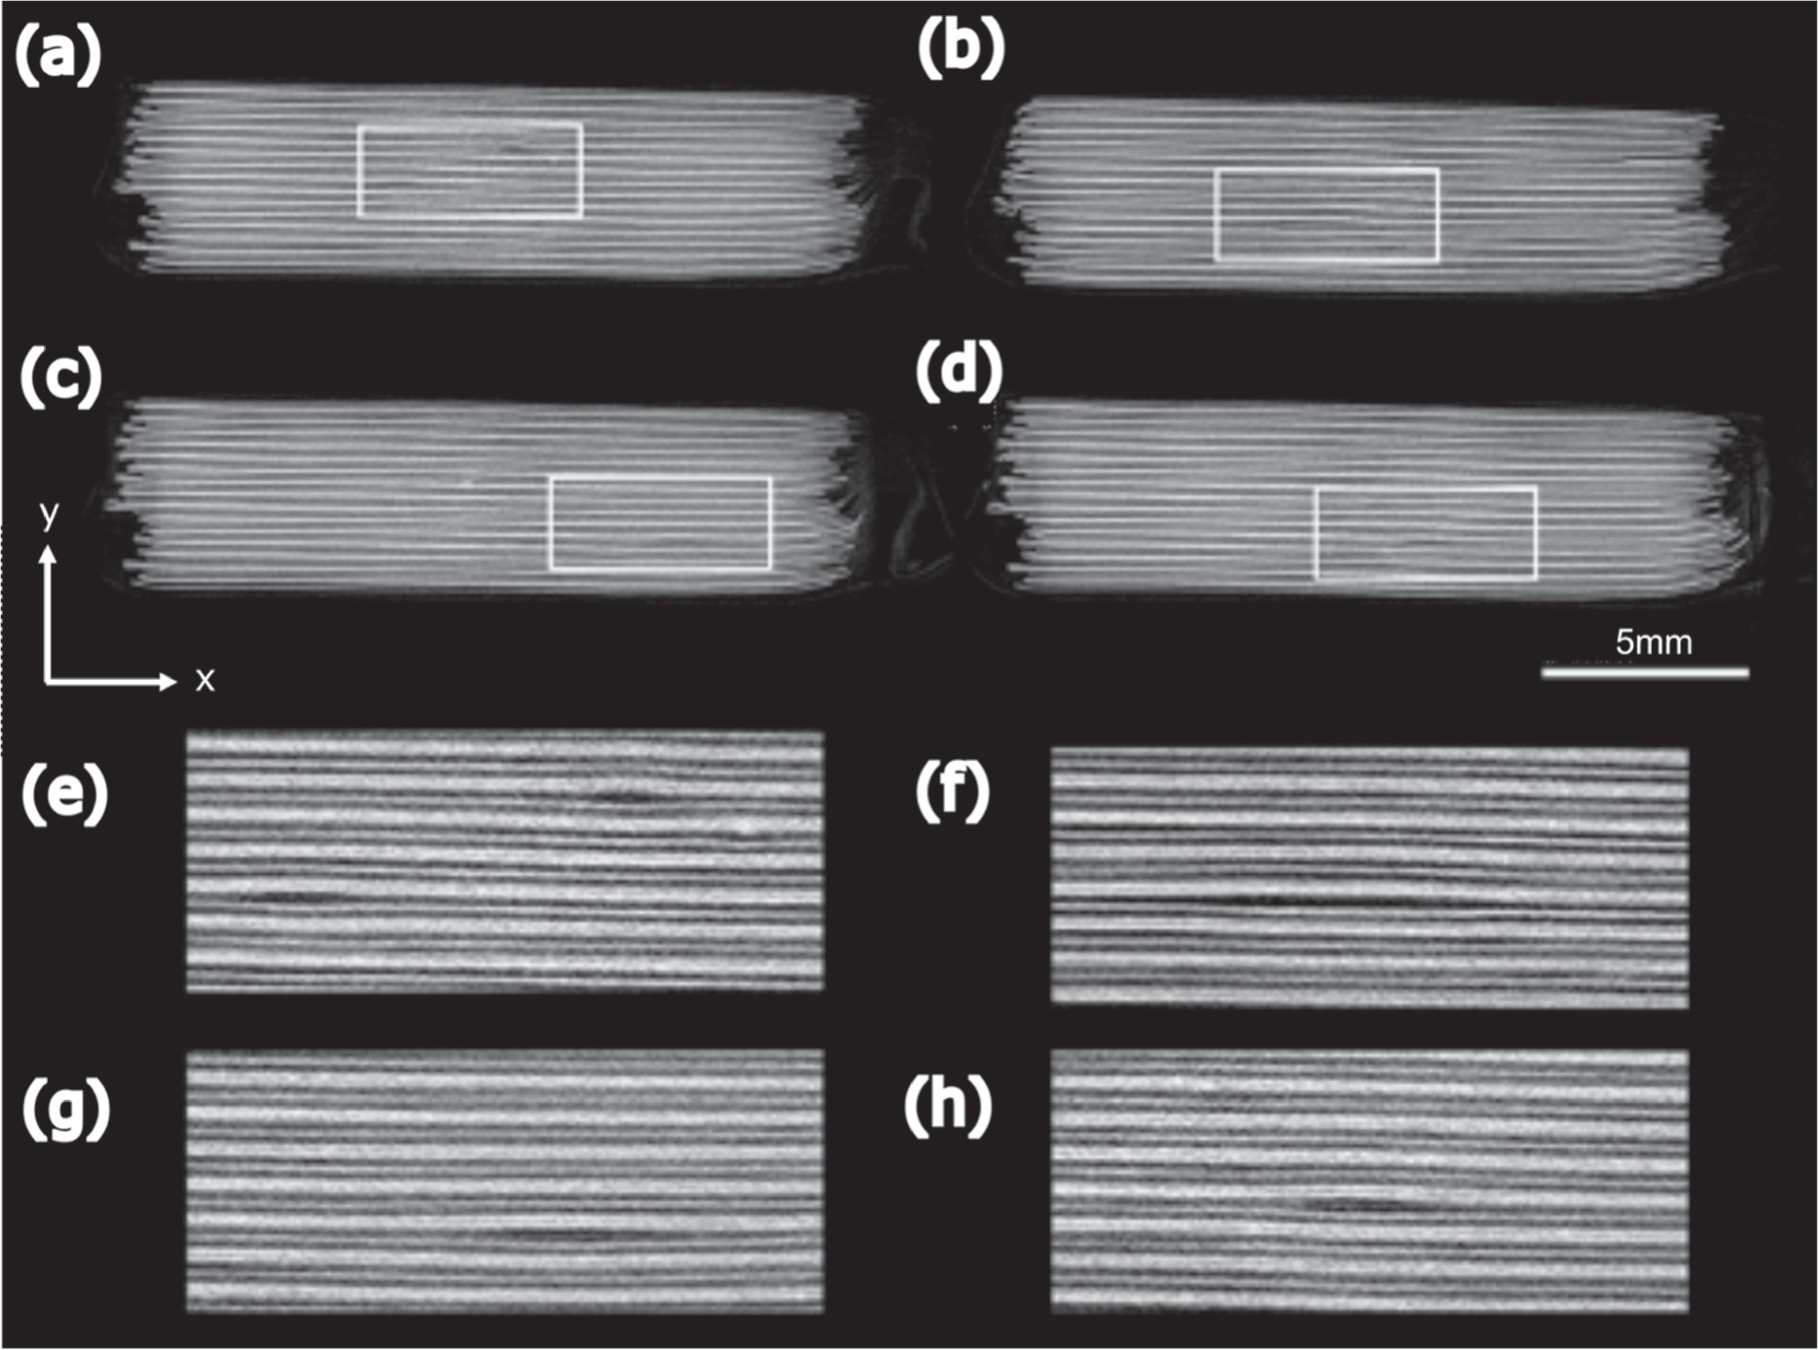
Figure 10. (a)–(c) Orthogonal xy slices through the electrode stack after a cell has been subjected to thermal abuse. Magnification of the areas highlighted in (a)–(d) are shown in (e)–(h) respectively.
Download figure:
Standard image High-resolution image
Due to the size of the transducer relative to the cell, covering a large percentage of the cell's surface small patches of gas formation under any point of the transducer, not just directly below the centre would likely be sufficient to prevent the propagation of the ultrasonic signal through the whole cell. As such, the technique, as employed here, should be sensitive to small areas of gas formation/delamination.
The results from the X-ray CT scans summarised in Fig. 9 show that the acoustic signal is indeed lost at the very onset of gas formation and that significant and catastrophic failure of the cell is not required to trigger the "level three" warning. A cell which is beginning to form gas in the manner observed in these tests is likely to have significant issues and pose a real threat of failure, 24 illustrating the potential sensitivity of this technique for the monitoring of cell safety and potential prevention of thermal runaway since signs can be determined before the cell enters irreversible heating.
The results presented in this paper clearly shows that acoustics is highly sensitive to the internal structure and properties of cells and can provide indications on relatively small but significant damage occupying within the cell. These tests show the results for thermally induced thermal runaway failures; however, based on the damage shown in the X-ray CT measurements and the processes occurring the technique should be effective for the detection of gas formation and electrode damage that would be expected in the vast majority of cell failure events.
Conclusions
The data presented in this paper demonstrates that the ultrasound can be used to determine and monitor internal temperature changes within lithium-ion batteries. The fact that these measurements can be obtained within 10 s of microseconds mean that internal temperature changes associated with failure events such as internal short circuits can be detected significantly more rapidly than techniques that require the measurement of the surface temperature of the cell.
In addition to the detection of internal temperature changes the technique is highly sensitive to a range of material property and structural changes that occur within cells. A distinct difference in acoustic behaviour Is observed between a cell cycling safely under specified conditions and when degradation occurs. Based on the nature of change observed in the acoustic signals the extent and nature of the damage occurring can be determined. Based on this, a multi-level warning system can be developed that can provide early warning of cell failure, this system is built around the detection of deviations in acoustic behaviour from the expected during "normal" and as such should also indicate if there are any issues with the acoustic equipment aiding in the prevention of false negatives. The experiments demonstrate that the loss of acoustic signal is related to gas formation and separation of layers which occurs with sufficient warning to stop cell operation and prevent thermal runaway. Further work is required to prove the robustness of this technique and its applicability under a number of alternative failure mechanisms as well as understanding how this technique can be applied on a larger scale to packs and modules utilised in a number of real-world applications.
Acknowledgments
The authors would like to acknowledge the Faraday Institution (Faraday.ac.uk; EP/S003053/1) for funding the energy storage work at the Electrochemical Innovation Lab (FIRG028, FIRG014, FIRG024, FIRG025, FIRG005). The authors also acknowledge European Automobile Manufacturers' Association (ACEA) for supporting research at EIL and the Royal Academy of Engineering for funding the Research Chairs of Brett (RCSRF2021/13/53 - including the National Physical Laboratory and HORIBA MIRA) and Shearing (CiET1718\59). Shearing and Robinson would like to thank Innovate UK and the Aerospace Technology Institute for funding through the CEBD programme (10050803).
Supplementary data (0.1 MB DOCX)