
Abstract
The effect of Ni as a minor alloying element on the anodic dissolution behavior of solute rich Al-Cu-Mg-based amorphous alloys ((Al75Cu17Mg8)97Ni3 and Al70Cu18Mg12) was studied. A small addition of Ni enhances both the pitting potential in 0.6 M NaCl, and resistance to dealloying 1 M HCl, and 5 M HCl + 5 M LiCl solutions. A crystalline, Cu-rich nanoporous structure forms in pits as a result of selective dissolution of Al and Mg in both alloys, with the finest structure present in the Ni containing alloy. The increase in potential drop during pit stabilization due to the greater Ohmic resistance through the finer porous layer is one of the reasons that the pitting potential is ennobled. Ni in solid solution also hinders anodic dissolution in artificial pits which is speculatively linked to an increase the energy barrier for the dissolution of Al around Ni by forming stronger bonds. The Ni alloying also reduces the probability of finding Al-Al bonds. These result in a reduction in the dissolution kinetics which in turn ennobles the pit stabilization potential. Technological implications for corrosion resistant conventional Al-Cu-Mg alloy design and alternatively a new route to the creation of nanoporous Cu are discussed.
Export citation and abstract BibTeX RIS
Amorphous alloys are known to possess superior corrosion resistance because of their chemical homogeneity, lack of defects, and relatively greater concentration of beneficial solutes in the solid solution.1, 2 The effect of chemical homogeneity has been elucidated by comparing the corrosion resistance of as-quenched homogeneous alloys and heat treated multi-phase poly-crystalline alloys.3 Also, the structural variation has been studied by comparing as-quenched amorphous alloys and single phase polycrystalline solid solutions of the same composition.4 However, the role of minor secondary alloying elements is not well understood.
A large body of research regarding the roles of major solutes in Al-based crystalline alloys has been conducted. The addition of more noble elements into a supersaturated solid solution, often by novel fabrication processes, generally enhances the corrosion resistance of Al-based binary alloys.5–9 An alloying element may take on a beneficial role, such as passivity promoter or dissolution moderator depending on the oxidizing and bonding characteristics of the alloying element.10 Ti and Cr are passivity promoters that can improve the passive oxide layer.10 Dissolution moderators, such as Mo, W, Nb, and Ta, presumably introduce a higher activation energy barrier for the disruption of metal-metal bonds at depassivated surfaces, which suppresses dissolution of the base metal.10 The enrichment of more noble elements, such as Cu, W, or Mo, at the metal-oxide interface during passive dissolution in an Al based binary alloy also enhanced the overall local corrosion resistance.11–14 In contrast, the addition of Pb, a less noble and lower melting temperature element, decreases the pitting resistance.15, 16
In addition to primary alloying elements, small amounts of secondary alloying elements affect the corrosion behavior of many solid solution alloys. It has been reported that the addition of a small amount (5 atom %) of phosphorous enhanced the pitting resistance of a Cu-Ti alloy.4 Other studies have shown that arsenic enhances the critical potential for dealloying of brass.17, 18 The porous structure, as a result of dealloying, can also be altered by secondary alloying elements in the precursor alloy or at the surface of the ligaments in the porous structure.19–21 Despite the evidence that secondary alloying elements play an important role in both pitting corrosion and dealloying behavior, the exact mechanisms are still debated.
Although pitting corrosion is often a primary focus of studies on the localized corrosion of Al-based alloys, dealloying is also an important corrosion process in solute-rich solid solutions. Raney Ni and Cu22 are examples of dealloying of Al from Al-based alloys. It has also been reported that dealloying takes place during the dissolution of solute-rich intermetallic phases, such as Al2CuMg phase23–25 which contains 25 atom % Cu behaving as a more noble element. Both selective dissolution of less noble elements and surface diffusion of more noble elements contribute to the formation and growth kinetics of the resulting morphology.26–28 The presence of more noble elements with a lower surface diffusivity often results in a finer porous structure.29
Amorphous alloys are single phase and defect free solid solutions that can often hold a greater amount of solute elements than their crystalline counterparts. Due to these characteristics, they are suited as model materials for the study of the effects of alloying elements on corrosion because the variation in crystal structure and chemical homogeneity can be isolated. Previous studies showed the addition of a small amount of Ni enhances the glass forming ability of Al-Cu-Mg-based alloys with near eutectic compositions.30 In addition, an Al-Cu-Mg-based alloy with a similar composition, but still near the eutectic, was found to form an amorphous structure by melt spinning.31 These amorphous alloys, (Al75Cu17Mg8)97Ni3 and Al70Cu18Mg12, provide an opportunity to study the effect of Ni as a minor alloying element in a solid solution alloy on corrosion. In addition, the study of this Al-Cu-Mg-based alloy system is technologically interesting because of the insight it provides on the corrosion behavior of commercial Al-Cu-Mg-based alloys containing solute rich Al-Cu-Mg phases.
Previous reports by the authors regarding the corrosion behavior of these amorphous alloys disclosed the enhanced corrosion resistance due to the addition of Ni as a minor solute element.32, 33 The synthesis of nanoporous Cu via dealloying of the same alloy systems has also been reported.34 However, the roles of such minor alloying element in corrosion have not yet been elucidated. This paper is the first to provide an insight into the roles of a minor alloying element by the combined investigation of the atomic structure, pit growth kinetics, and the role of the dealloyed layer in pitting corrosion with emphasis on behavior during anodic polarization.
Experimental
Sample preparation and determination of the atomic structure
Two types of amorphous Al-Cu-Mg-based alloys [(Al75Cu17Mg8)97Ni3 and Al70Cu18Mg12 (atom %)] were prepared by melt spinning into ribbons with a cross sectional dimension of approximately 25 μm × 2 mm from cast ingots made with pure (>99.99%) metals. X-ray diffraction (XRD) (Scintag XDS2000) with a Cu-Kα source (λ = 1.541 Å) and extended X-ray absorption fine structure (EXAFS) with respect to K-edges of Cu (8,979 eV) and Ni (8,333 eV) were employed to determine the atomic structures of the alloys. The raw X-ray absorption spectroscopy (XAS) data for EXAFS analysis was obtained at the X10C beamline at the National Synchrotron Light Source (NSLS) located in Brookhaven National Laboratory (BNL). The spectra were analyzed using Ifeffit, to perform background subtraction, Fourier transformation, and curve fitting.35
Overall assessment of corrosion behavior
A cross section of the amorphous ribbon was exposed to the solution by embedding in Epo-thin® (Buehler) low curing temperature epoxy resin. The samples were initially ground with successively finer papers to 1200 grit then polished down to 1 μm diamond suspension. The localized corrosion behavior was assessed by means of cyclic E-i scans to determine the pitting and repassivation potentials in deaerated 0.6 M NaCl and 1 M HCl solutions using a conventional three electrode cell. Potential and current were controlled by a potentiostat (PAR model 273A, Gamry FAS2 or Gamry PCI4) with a scan rate of 1 mV/s after 10 min of open circuit potential (OCP) hold in the solution. In addition, the alloys were examined by cyclic voltammetry in deaerated 5 M HCl + 5 M LiCl solution with a scan rate of 25 mV/s after 10 s of OCP hold to obtain the corrosion behavior in an aggressive pit solution.
Characterization of post corrosion specimens
The surface morphology, compositional distribution, and crystal structure of corroded specimens were characterized by scanning electron microscopy (SEM, JEOL JSM-6700F) equipped with EDS, and XRD. The samples were prepared by immersing the ribbons, with a length of approximately 2 cm, into a solution of 0.6 M NaCl or 1 M HCl. The ribbons were potentiostatically held at −400 mVSCE for various exposure times. The corroded samples were then rinsed with deionized water, and dried in a desiccator prior to characterization.
Growth kinetics of pits
Growth of one dimensional pits was examined by a potentiostatic hold in an artificial pit configuration. An artificial pit was initiated and grown by a potentiostatic hold in 1 M HCl solution. Two different potentials were examined, −400 and −500 mVSCE, representing potentials above and below the pitting potential of the (Al75Cu17Mg8)97Ni3 alloy observed during upward scans. In contrast, both of these potentials are above the pitting potential of the Al70Cu18Mg12 alloy. The pit grew uniformly along a direction perpendicular to the exposed surface. Current measurement and optical microscopy were employed to analyze mass loss, volume loss, and the depth of the pit. The measured current was integrated to determine the net charge. This charge was then converted to the pit depth using Faraday's law. Since the selective dissolution of Al and Mg took place within the pit, the equivalent weight (E.W.) of Al and Mg were used for the mass loss calculation. The E.W.s for the (Al75Cu17Mg8)97Ni3 and Al70Cu18Mg12 alloys were determined to be 9.30 and 9.46 (g/equiv.), respectively. The mass of residual Cu and Ni was then determined from the mass loss using the mass ratio of the elements in the alloys. These masses were divided by the density, which was estimated by a weighted average of the alloy, to determine the volume loss and volume of the residual Cu. The total volume of the pit was then converted to pit depth. The physical depth of the artificial pit was also measured optically by imaging the planar surface of the mounted ribbon, perpendicular to the exposed surface, using an optical microscope through transparent epoxy. The pit depths determined by the two techniques were compared to determine the current efficiency of the pit growth and correct calculations using Faraday's law.
The polarization behavior in the artificially formed pits was determined by a potentiodynamic downward scan at 25 mV/s, starting at the potential used to initiate and grow the artificial pit. Due to the short time to complete a full scan, the pit solution was preserved before the dissolved ionic species was transported to the pit mouth region by ionic diffusion.
Results
Local atomic structure of the amorphous alloys
Figure 1 shows the XRD spectra obtained from the (Al75Cu17Mg8)97Ni3 and Al70Cu18Mg12 melt spun alloys. The spectra were normalized by the height of the peak at around 38° of each XRD spectrum determined by a Gaussian peak function fitting as summarized in Table I with fitting lines superimposed on the spectra. The results confirm the alloys were amorphous with two diffuse peaks at around 2θ ≈ 38° (lower 2θ peak) and 45 to 46° (higher 2θ peak). The relative intensity of the higher 2θ peaks are determined to be 1.63 and 1.01 for the (Al75Cu17Mg8)97Ni3 and Al70Cu18Mg12 alloys, respectively.
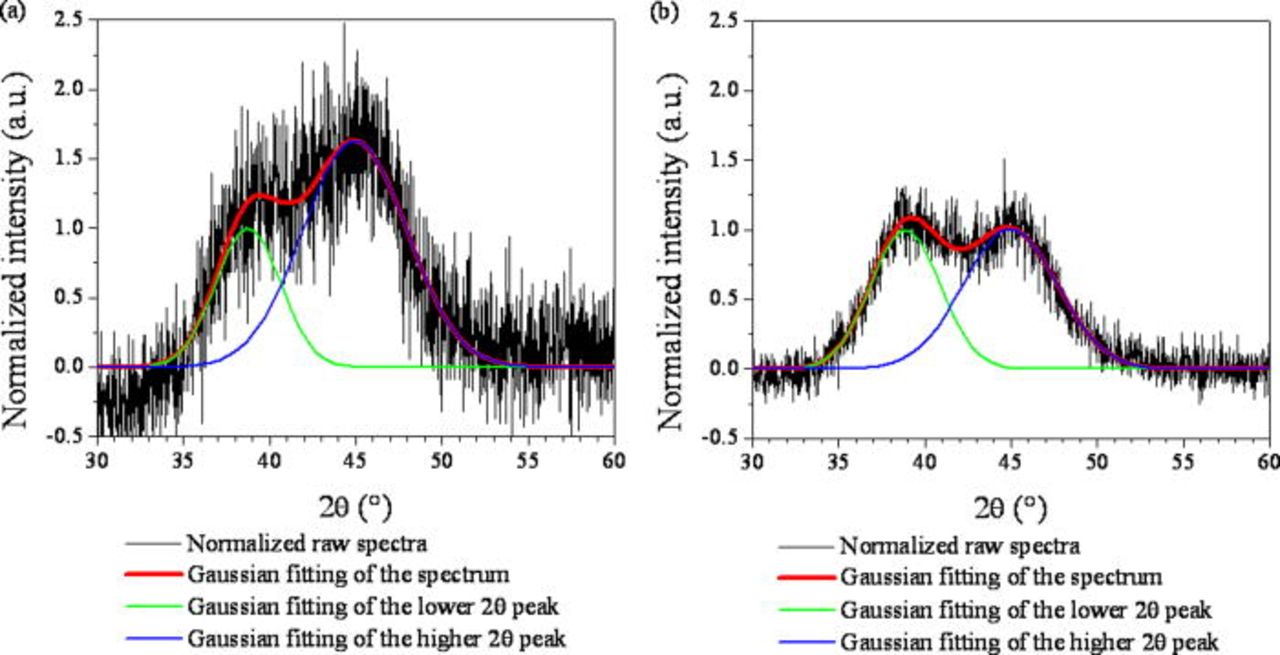
Figure 1. (Color online) Normalized XRD spectra obtained from the (a) (Al75Cu17Mg8)97Ni3 and (b) Al70Cu18Mg12 alloys and fitting lines of the diffuse lower and higher 2θ peaks. The intensity was normalized by the maximum intensity of the Gaussian fitting of the lower 2θ peak.
Table I. Characteristics of the fitted peaks of the normalized XRD spectra obtained from (Al75Cu17Mg8)97Ni3 and Al70Cu18Mg12 alloys.
| Alloy | Mean 2θ (°) | Normalized intensity at mean 2θ | FWHM (°) |
|---|---|---|---|
| The lower 2θ peak | |||
| (Al75Cu17Mg8)97Ni3 | 38.74 | 1.00 | 4.43 |
| Al70Cu18Mg12 | 38.86 | 1.00 | 4.73 |
| The higher 2θ peak | |||
| (Al75Cu17Mg8)97Ni3 | 44.93 | 1.63 | 7.08 |
| Al70Cu18Mg12 | 44.92 | 1.01 | 6.40 |
The local atomic structures around Ni and Cu in the (Al75Cu17Mg8)97Ni3 and Al70Cu18Mg12 alloys was determined by EXAFS. Figure 2 shows the Fourier transformed EXAFS spectra of K-edges of Cu and Ni. The spectra show one prominent peak, corresponding to the first coordination sphere around the edge element. Therefore, the alloys possess only a short range atomic ordering around Cu and Ni atoms. For the (Al75Cu17Mg8)97Ni3 alloy, the radius and coordination number of the coordination sphere around Ni were found to be 2.46 (Å) and 8.9, while those of the coordination sphere around Cu were 2.53 (Å) and 8.0. For the Al70Cu18Mg12 alloy, the radius and coordination number of the coordination sphere around Cu were 5.21 (Å) and 6.9. These results are summarized in Table II.
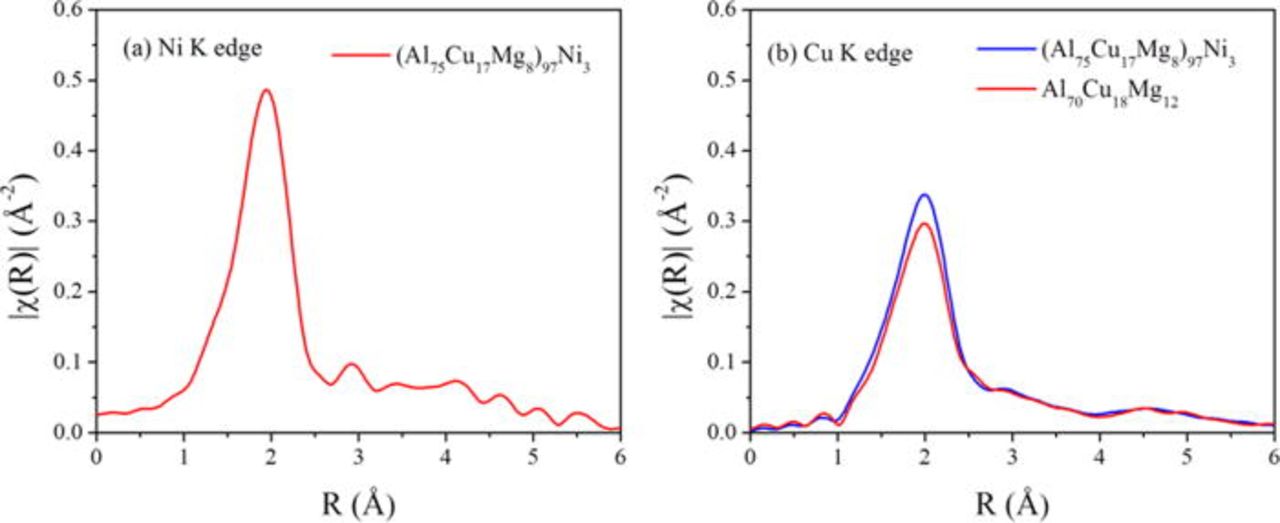
Figure 2. (Color online) Fourier transformed EXAFS spectra of (a) Ni K-edge (8,333 eV) and (b) Cu K-edge (8,979 eV) obtained from the (Al75Cu17Mg8)97Ni3 and Al70Cu18Mg12 as-quenched alloys. The raw X-ray absorption spectroscopy (XAS) data was obtained at the X10C beamline in the National Synchrotron Light Source (NSLS) located at Brookhaven National Laboratory (BNL).
Table II. Characteristics of short range ordering around Ni and Cu in the Al70Cu18Mg12 and (Al75Cu17Mg8)97Ni3 amorphous alloys.
| Material | Edge | Radius of the first sphere R (Å) | Coordination number CN | Mean square displacement σ2 (Å2) |
|---|---|---|---|---|
| (Al75Cu17Mg8)97Ni3 | Ni-K | 2.455 ± 0.031 | 8.905 ± 3.366 | 0.011 ± 0.005 |
| (Al75Cu17Mg8)97Ni3 | Cu-K | 2.526 ± 0.015 | 8.043 ± 1.328 | 0.014 ± 0.003 |
| Al70Cu18Mg12 | Cu-K | 2.512 ± 0.004 | 6.851 ± 1.673 | 0.014 ± 0.004 |
The atomic structure around Cu was analyzed by combining the results from both XRD and EXAFS characterizations. The atomic pairs corresponding to the two diffuse amorphous peaks in the XRD spectra were identified by correlating the peak position and the radius of coordination spheres around Cu determined by EXAFS characterization. The relationship between the 2θ in a XRD spectrum and interatomic distance of corresponding atomic pair (xm ) in an amorphous alloy is expressed by

where K is a constant (∼1.22), λ is the wavelength of the incident X-ray (λ = 1.541 Å for Cu-Kα source), and θ is the Bragg angle.36 Although this estimation is not exact,36 the comparison of peak positions observed in the XRD spectra and the interatomic distance obtained from the EXAFS characterization enables the estimation of a general correlation between the xm and θ. The radius of the coordination sphere determined by EXAFS is essentially an interatomic distance between the central atom and the coordinating atoms (atomic pairs). This interatomic distance was compared to the 2θ positions at the center of the diffuse amorphous peaks in the XRD spectra determined by the Gaussian fittings. Since θ increases as xm decreases, it is speculated that the lower 2θ diffuse peak in the XRD spectra corresponds to Al-Al pairs, and the higher 2θ diffuse peak corresponds to Al-Cu pairs for both alloys. The value of K was determined by comparing the interatomic distance of the Al-Cu pairs from EXAFS characterization and position of the mean 2θ of the higher 2θ peak in the XRD spectrum. The K value determined was approximately 1.25 for both alloys, which is close to the value suggested in literature,36 Using this value of K and the mean 2θ of the lower 2θ peak, the interatomic distance of the Al-Al pairs in both alloys was determined to be 2.9 Å. This value is quite comparable to the first nearest neighbor distance of the Al-Al pairs in crystalline FCC pure Al (2.86 Å). These results confirmed that the lower 2θ peak corresponds to Al-Al pairs, while the higher 2θ peak corresponds to Al-Cu pairs. Table III summarizes the characteristic of the atomic pairs in the alloys determined from the XRD and EXAFS results. The relative intensity of the peak corresponding Al-Cu pairs in the XRD spectra obtained from the (Al75Cu17Mg8)97Ni3 alloy is larger, suggesting that more Al atoms in the alloys preferentially bonded to Cu atoms and the probability of finding Al-Al pairs is reduced by the Ni alloying.
Table III. Summary of the 2θ and relative intensity corresponding to atomic pairs in the (Al75Cu17Mg8)97Ni3 and Al70Cu18Mg12 alloys.
| XRD | |||||
|---|---|---|---|---|---|
| Alloy | Atomic pair | EXAFSR (Å) | Interatomic distance (Å) | 2θ (°) | Relative intensity |
| (Al75Cu17Mg8)97Ni3 | Al-Al | N/A | 2.90 | 38.74 | 1.00 |
| Al-Cu | 2.53 | 2.52 | 44.93 | 1.63 | |
| Al-Ni | 2.46 | N/A | N/A | N/A | |
| Al70Cu18Mg12 | Al-Al | N/A | 2.89 | 38.86 | 1.00 |
| Al-Cu | 2.51 | 2.52 | 44.92 | 1.01 | |
The peak corresponding to Al-Ni pairs, which is expected to be at 2θ = 46.3°, assuming K = 1.25 and xm = 2.45 Å, was not observed in the XRD spectrum obtained from the (Al75Cu17Mg8)97Ni3 alloy. It has been reported that incrementally adding minor additions of Ni into the (Al75Cu17Mg8) melt spun ribbons shifts the shoulder of the higher 2θ peak towards larger 2θ, increasing the intensity at around 2θ = 46°.30 This extra peak matched with the expected peak position for the Al-Ni bonds. Thus, the peak shift is attributed to the formation of Al-Ni pairs. However, the higher 2θ diffuse peak at around 2θ = 45 to 46° in the XRD spectrum obtained from the (Al75Cu17Mg8)97Ni3 alloy in this study could not be deconvolved. This is likely due to the low concentration of Ni in the alloy (3 atom %) and the similarity of the radius of the coordination spheres around Cu and Ni, which differ by only 0.07 Å. This would correspond to a 1° difference assuming K = 1.25. These two factors make the deconvolution of the diffuse peak difficult.
Overall assessment of corrosion behavior of the Al-Cu-Mg-based amorphous alloys
The localized corrosion behavior of the Al-Cu-Mg-based amorphous alloys was assessed in a 0.6 M NaCl solution after both open circuit exposures and anodic polarization. Passive dissolution was observed at open circuit with almost no discoloration and the complete absence of pitting in both alloys. Figure 3 and 4 show representative polarization curves and mean pitting and repassivation potentials, respectively. Both Al-Cu-Mg-based amorphous alloys exhibited a polarization behavior usually observed during pitting corrosion, where the current density increased abruptly at a critical potential. Therefore, the primary localized corrosion process of the alloys is pitting corrosion, and the critical potentials correspond to pitting potentials, where the pits can stably grow. The mean pitting potentials of the (Al75Cu17Mg8)97Ni3 and Al70Cu18Mg12 amorphous alloys are more noble than pure Al by 560 mV and 190 mV, respectively. Hence, the enhancement is slight in the Al70Cu18Mg12 alloy. In contrast, the Ni containing amorphous alloy showed a pitting potential about 400 mV greater, even though both alloys are amorphous and the Ni addition is just 3 atom %. The repassivation potential was also higher for the Al-Cu-Mg-Ni alloy as summarized in Fig. 4b.
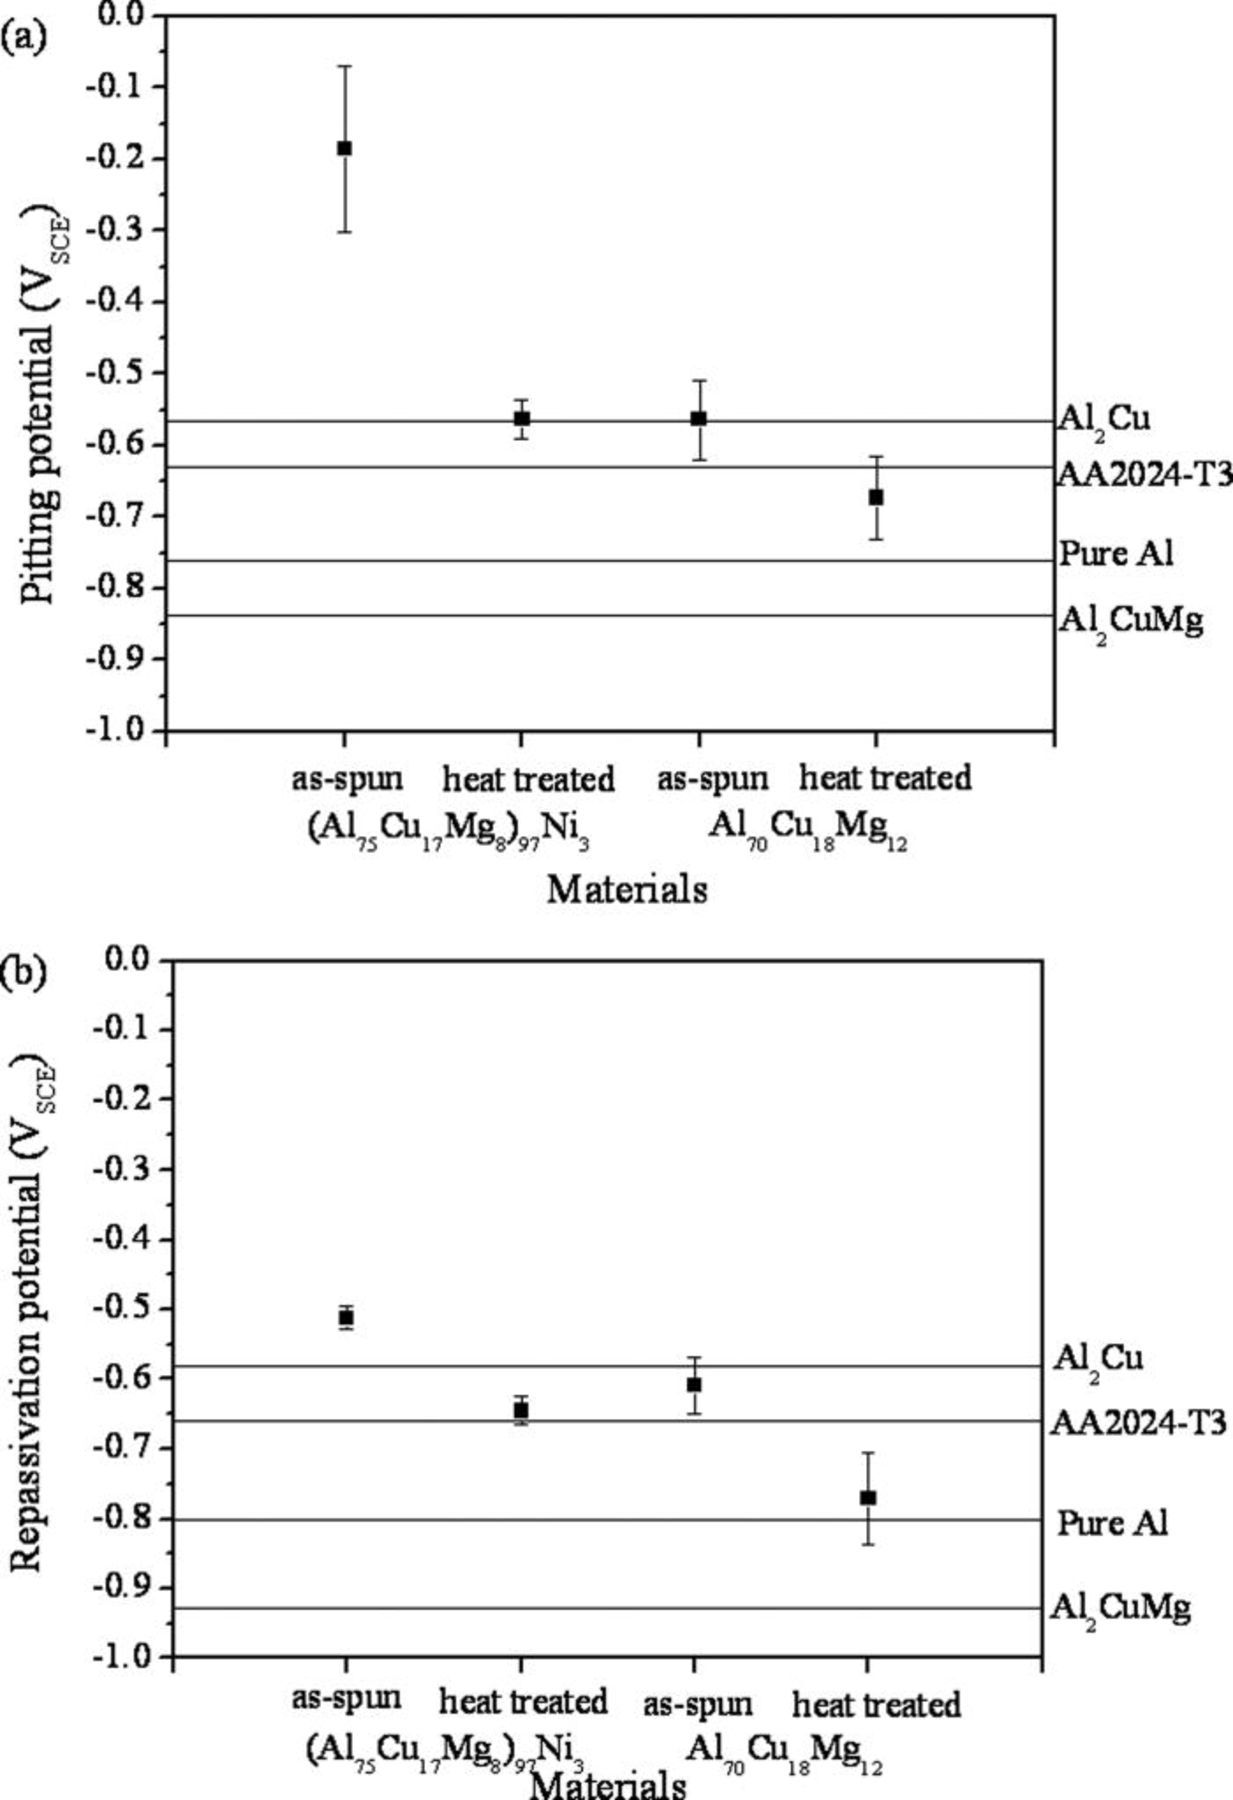
Figure 4. Mean (a) pitting and (b) repassivation potentials of the (Al75Cu17Mg8)97Ni3 and Al70Cu18Mg12 alloys in a 0.6 M NaCl solution at room temperature. The potentials of high purity Al, Al2Cu, and Al2CuMg phases, and AA2024-T3 are shown as a reference.
The corrosion behavior of the alloys was also examined in reducing acid solutions to study active dissolution in a simulated pit environment. Figure 5 shows the polarization behavior of the Al-Cu-Mg-based amorphous alloys in 1 M HCl solution in comparison to high purity Al, Cu, and Ni. A clear enhancement of the pitting potential was observed in the Ni containing alloy. A similar tendency was observed in a more aggressive solution (5 M HCl + 5 M LiCl) as shown in Fig. 6. The active dissolution of the alloys occurs at a potential more negative than the OCP of pure Cu and Ni in the environment. Cyclic voltammograms, Fig. 7, show that current decreases as the number of cycle increases. This occurs likely because the surface becomes enriched in Cu and Ni during each cycle. Although the pitting potentials are more positive than the reversible potentials of Cu/CuCl2− 3 or Cu/CuCl2 and Ni/NiCl2 equilibria estimated in this environment, a minimal amount of Cu and Ni dissolves due to low Cu and Ni dissolution overpotentials increased by Ohmic potential drop near the pitting potentials. Tafel extrapolation of the anodic portion of the polarization curves of Cu and Ni showed the anodic current density of Cu and Ni was approximately 10−7 A/cm2 at the pitting potential of the (Al75Cu17Mg8)97Ni3 alloy (∼−450 mVSCE). This is orders of magnitude smaller than the anodic current density of the Al-Cu-Mg-based alloys averaged over the entire surface at this potential. This implies the growth of pits occur substantially due to Al and Mg oxidation with negligible dissolution of Cu and Ni under these conditions.
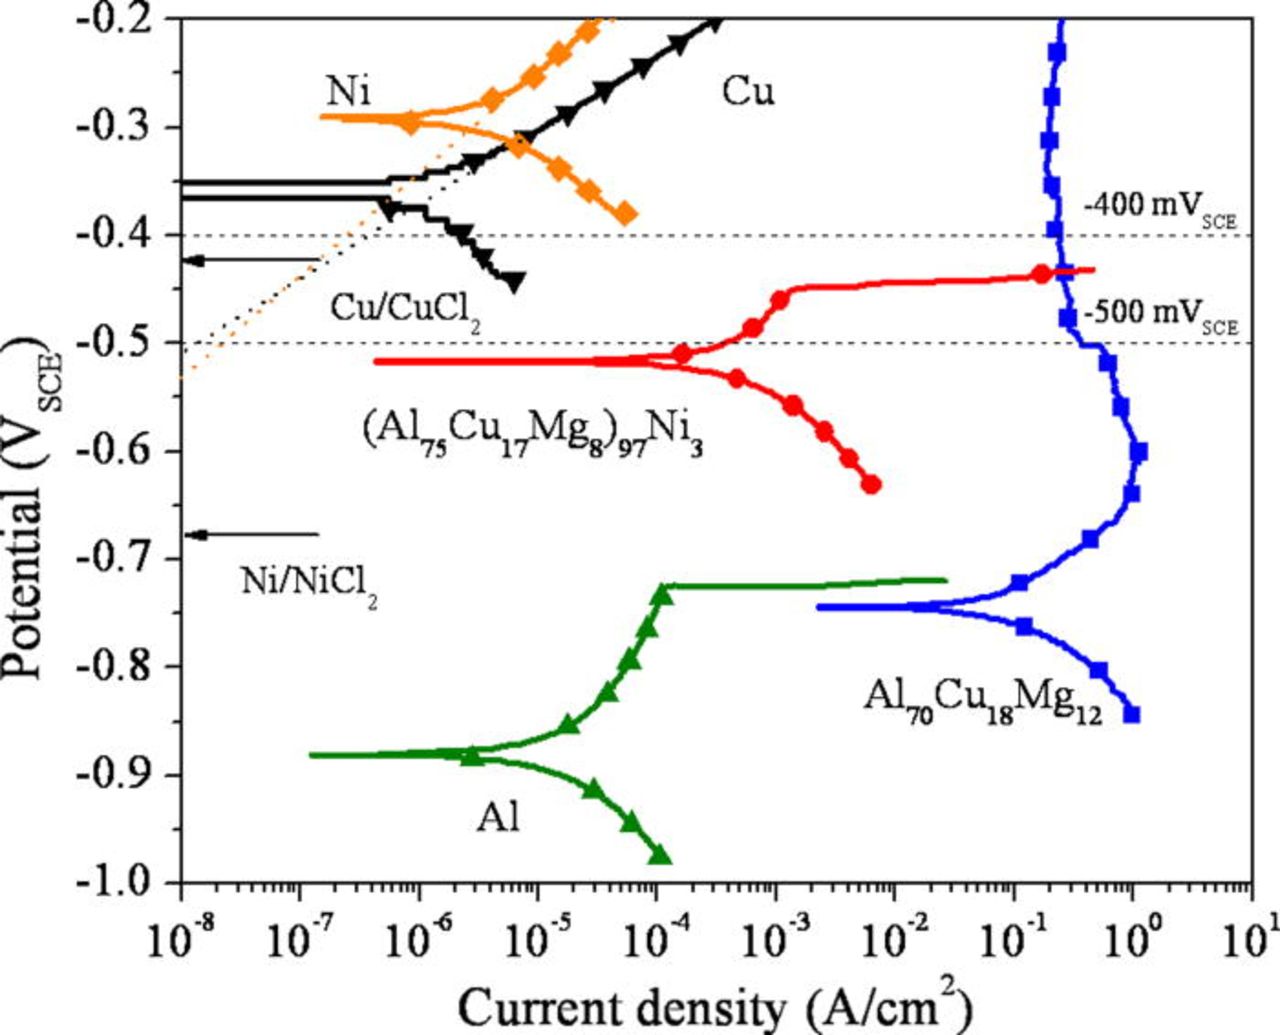
Figure 5. (Color online) Polarization behavior (upward scans) of the alloys in a deaerated 1 M HCl solution at room temperature. The cross section of the ribbons was exposed to the solution. The dotted lines indicate the Tafel extrapolation of the anodic curves for Cu and Ni. The reversible potentials of the respective reactions are indicated with arrows. The reversible potentials were calculated by the Medusa software assuming 1 M Cl− concentration.49
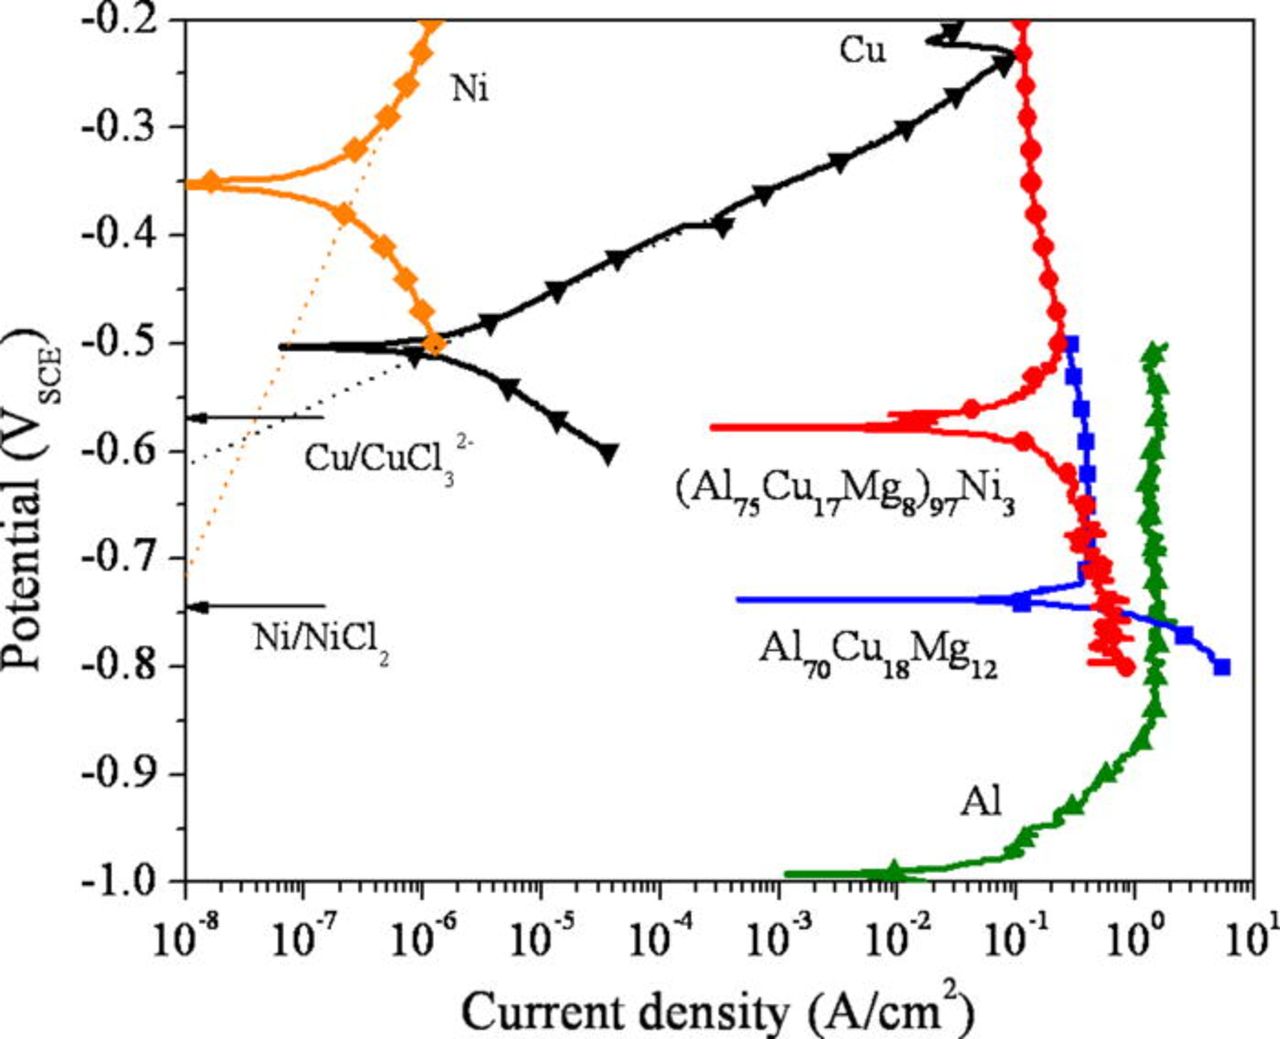
Figure 6. (Color online) Polarization behavior (upward scans) of the alloys obtained from the first cycle of cyclic voltammetry in a deaerated 5 M HCl + 5 M LiCl solution at room temperature. The dotted lines indicate the Tafel extrapolation of anodic portion of Cu and Ni. The reversible potentials of the respective reactions are indicated with arrows. The reversible potentials were calculated by the Medusa software assuming 10 M Cl− concentration.49
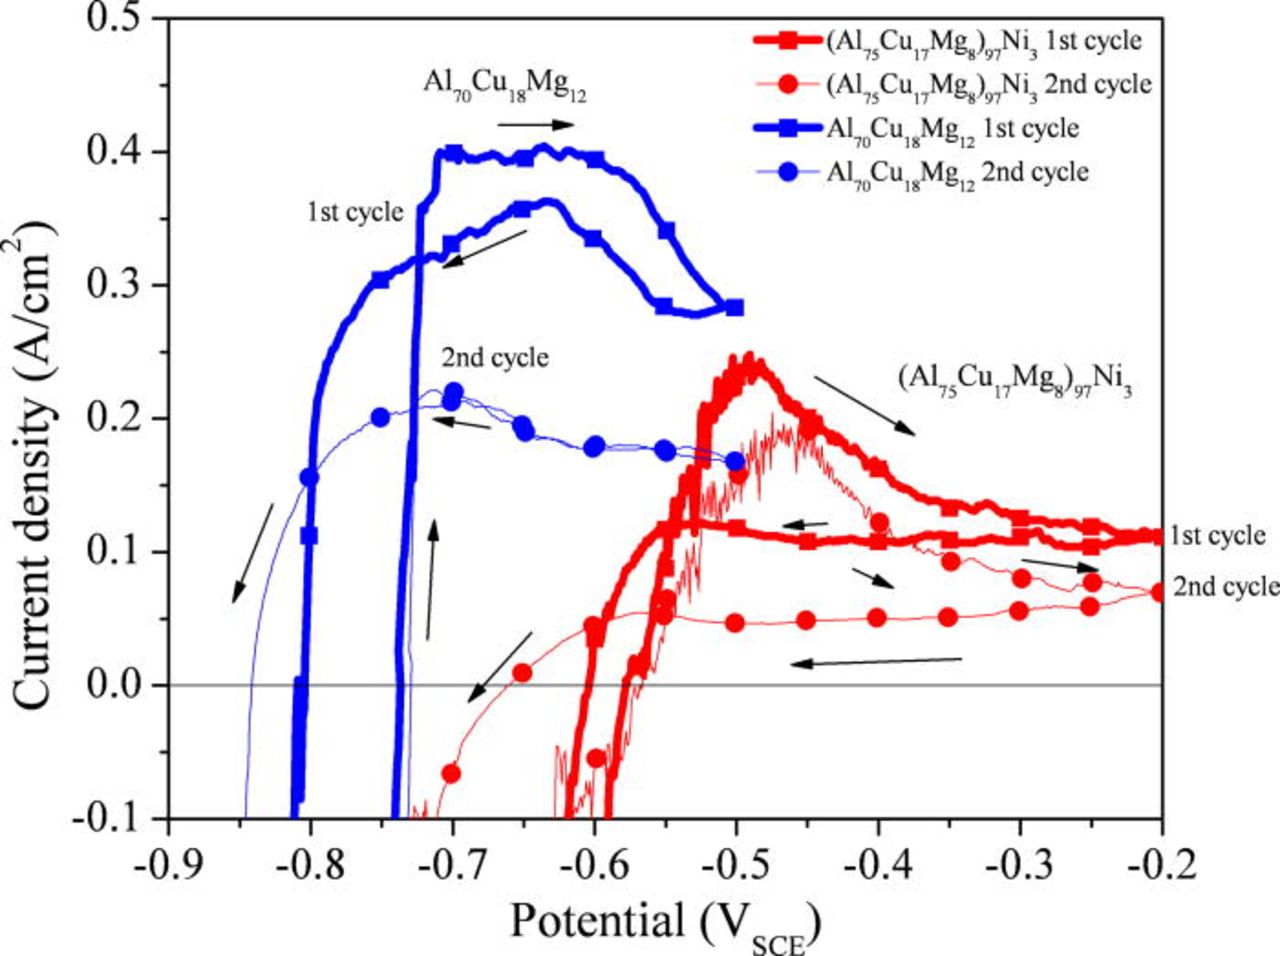
Figure 7. (Color online) The cyclic voltammograms for the (Al75Cu17Mg8)97Ni3 and Al70Cu18Mg12 amorphous alloys in a deaerated 5 M HCl + 5 M LiCl solution at room temperature.
Morphological and compositional analyses of pits
The current behavior during the potentiostatic hold of the Al-Cu-Mg-based amorphous alloys immersed in 1 M HCl solution and held at −400 VSCE is shown in Fig. 8. The Al70Cu18Mg12 alloy showed a clear transition in current. Initially the current was high, followed by a gradual decrease. Figure 9 showed the formation of hemispherical pits on both alloys. Relatively small pits cover entire surface of the Al70Cu18Mg12 alloy. In contrast, the pits observed in the (Al75Cu17Mg8)97Ni3 alloy were slightly larger, but rare and more dispersed. The compositional analysis, shown in Fig. 10, confirmed the presence of a Cu-rich layer within pits on both alloys, suggesting selective dissolution of Al and Mg. The Cu-rich layer possesses a nanoporous structure (Fig. 11). The diameter of the ligaments in the nanoporous structures is summarized in Table IV. These two pieces of results indicate that dealloying occurred in pits. On the other hand, the passively dissolved matrix preserves a composition and morphology similar to that of the starting amorphous alloys. These results suggest that the current decay in Fig. 8 is due to the selective depletion of Al and Mg. The current stabilized at a low level as the exposed area was covered by the Al and Mg depleted layer. The active dissolution rate of Al and Mg in the (Al75Cu17Mg8)97Ni3 alloy was lower than that of the Al70Cu18Mg12 alloy, suggesting that additional time is required for complete depletion of Al and Mg from the alloy.
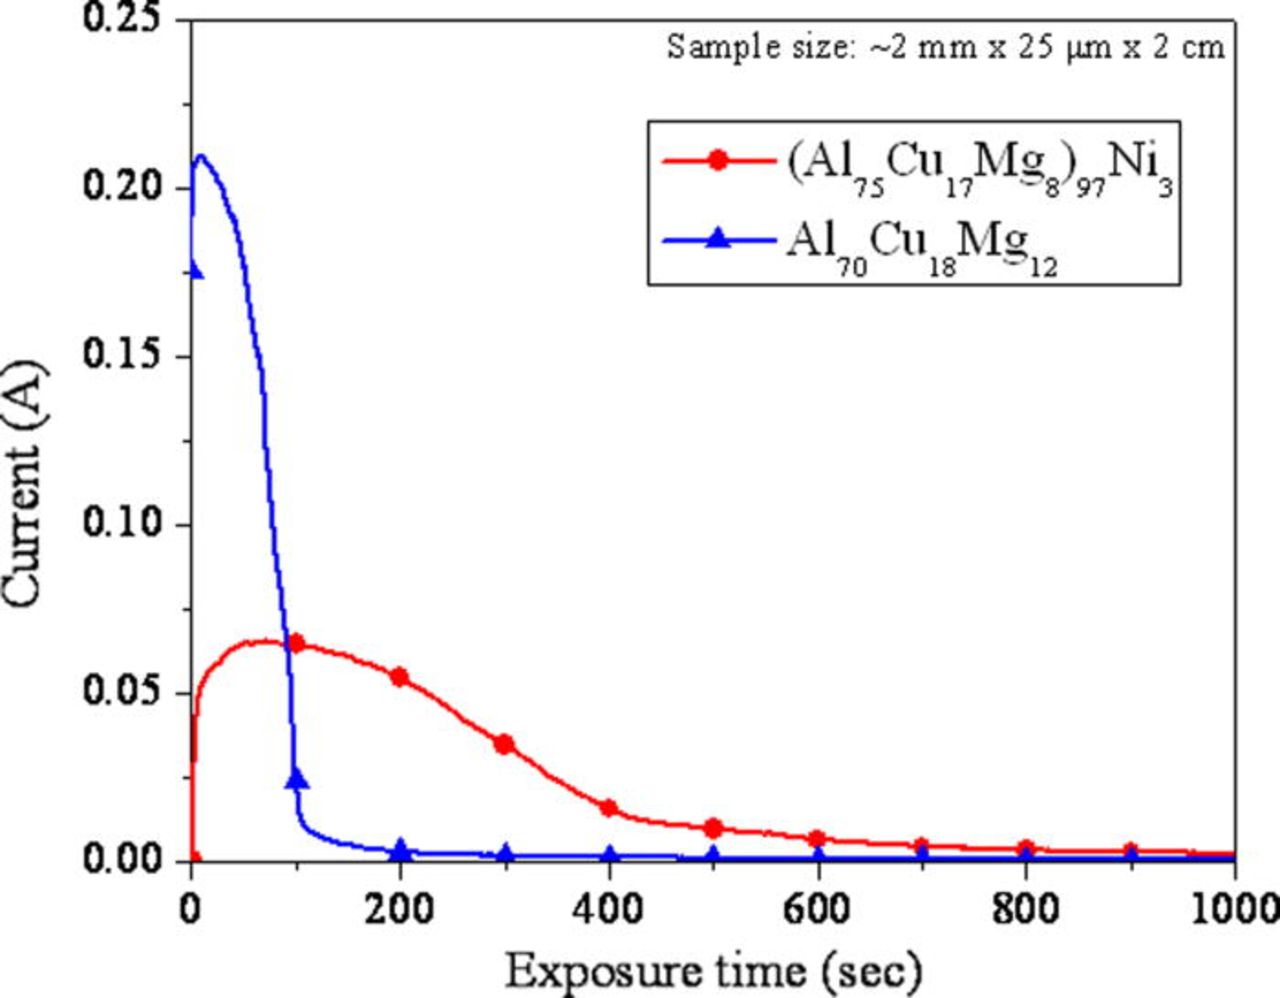
Figure 8. (Color online) Current behavior during the potentiostatic hold at −400 mVSCE in 1 M HCl at room temperature.
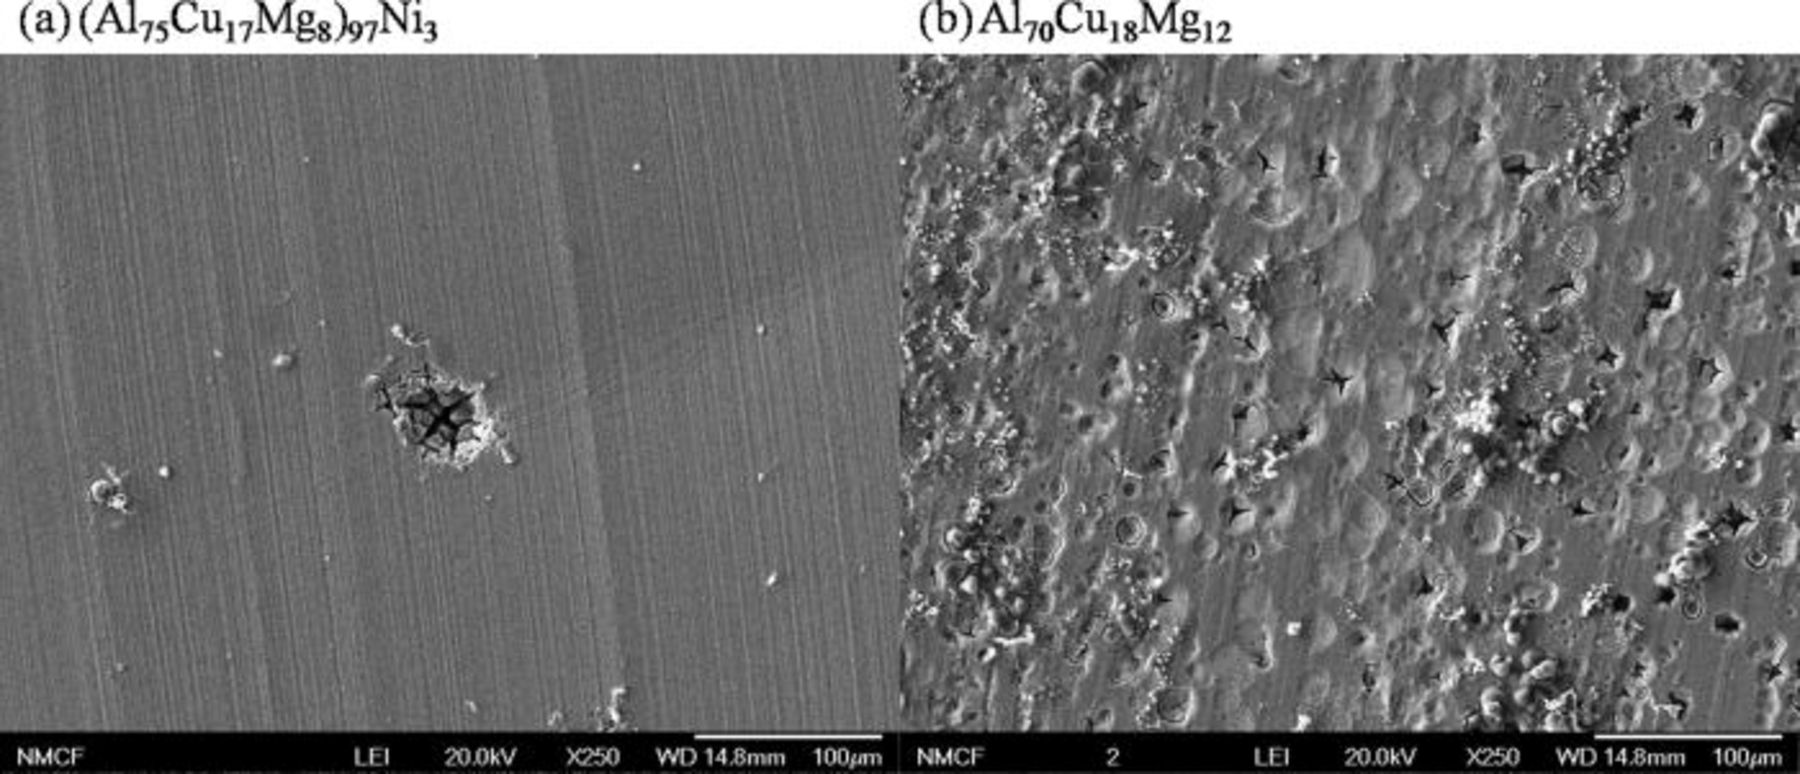
Figure 9. Pits formed on the planar surface of the (a) (Al75Cu17Mg8)97Ni3 and (b) Al70Cu18Mg12 alloys. The ribbon samples were immersed in an aerated 1 M HCl solution and potentiostatically held at −400 mVSCE for 30 s at room temperature.
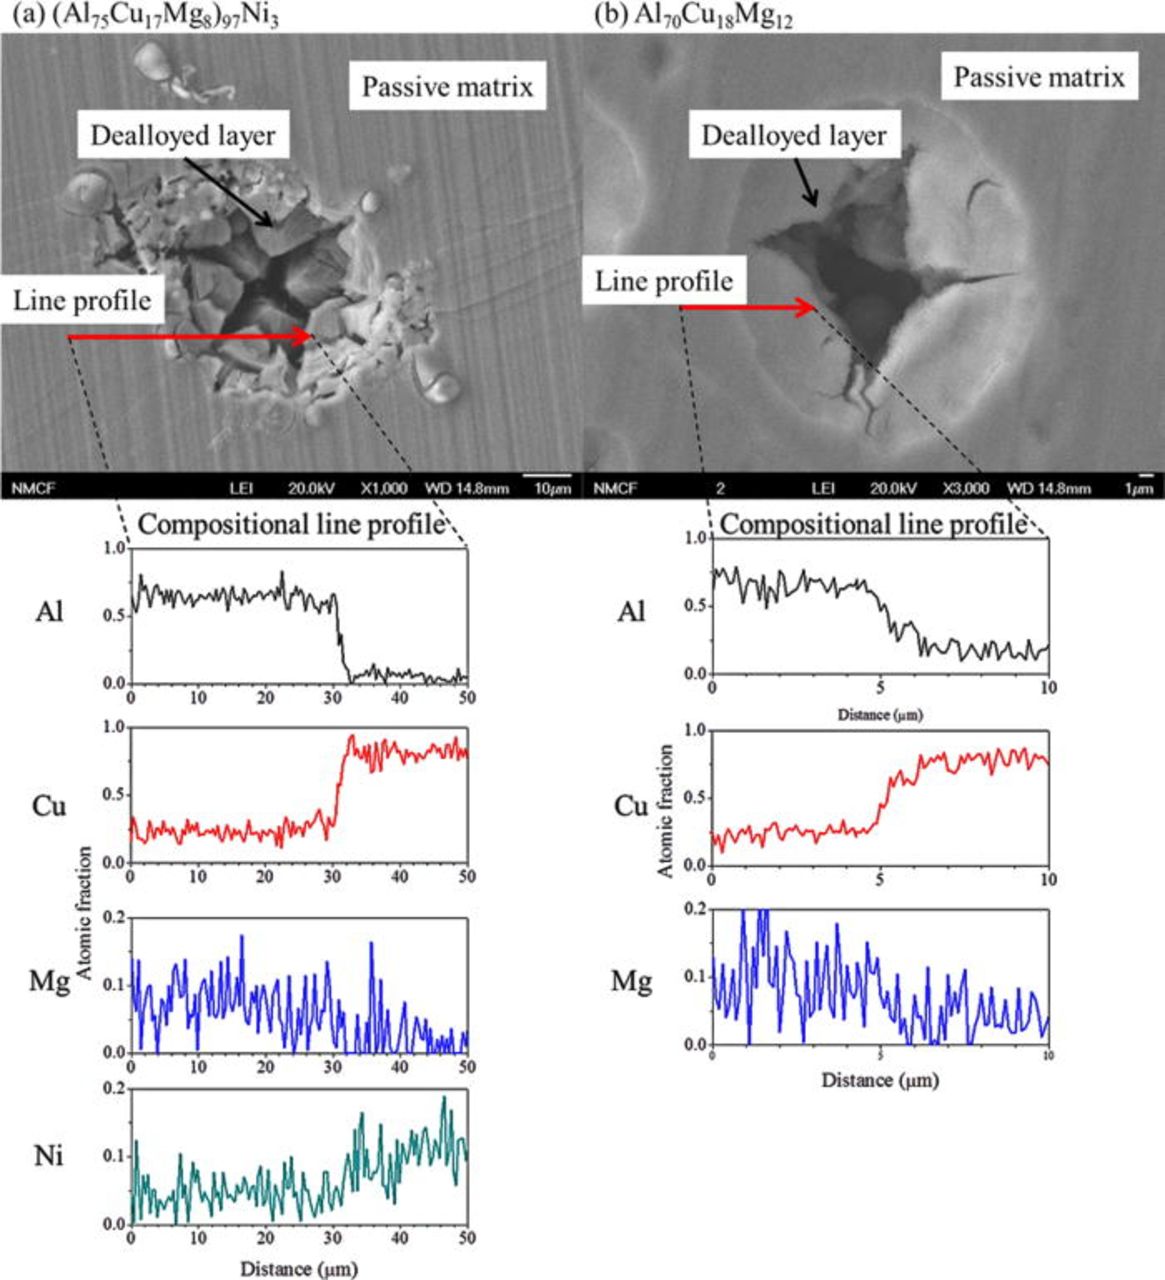
Figure 10. (Color online) Compositional analysis of the pit and surrounding area formed on the planar surface of the (a) (Al75Cu17Mg8)97Ni3 and (b) Al70Cu18Mg12 alloys. The ribbon samples were immersed in 1 M HCl solution and potentiostatically held at −400 mVSCE for 30 s at room temperature. The X-ray analysis was performed in the SEM at an acceleration voltage of 20 kV. The compositional line profile was established using Kα line intensities of the respective elements.34
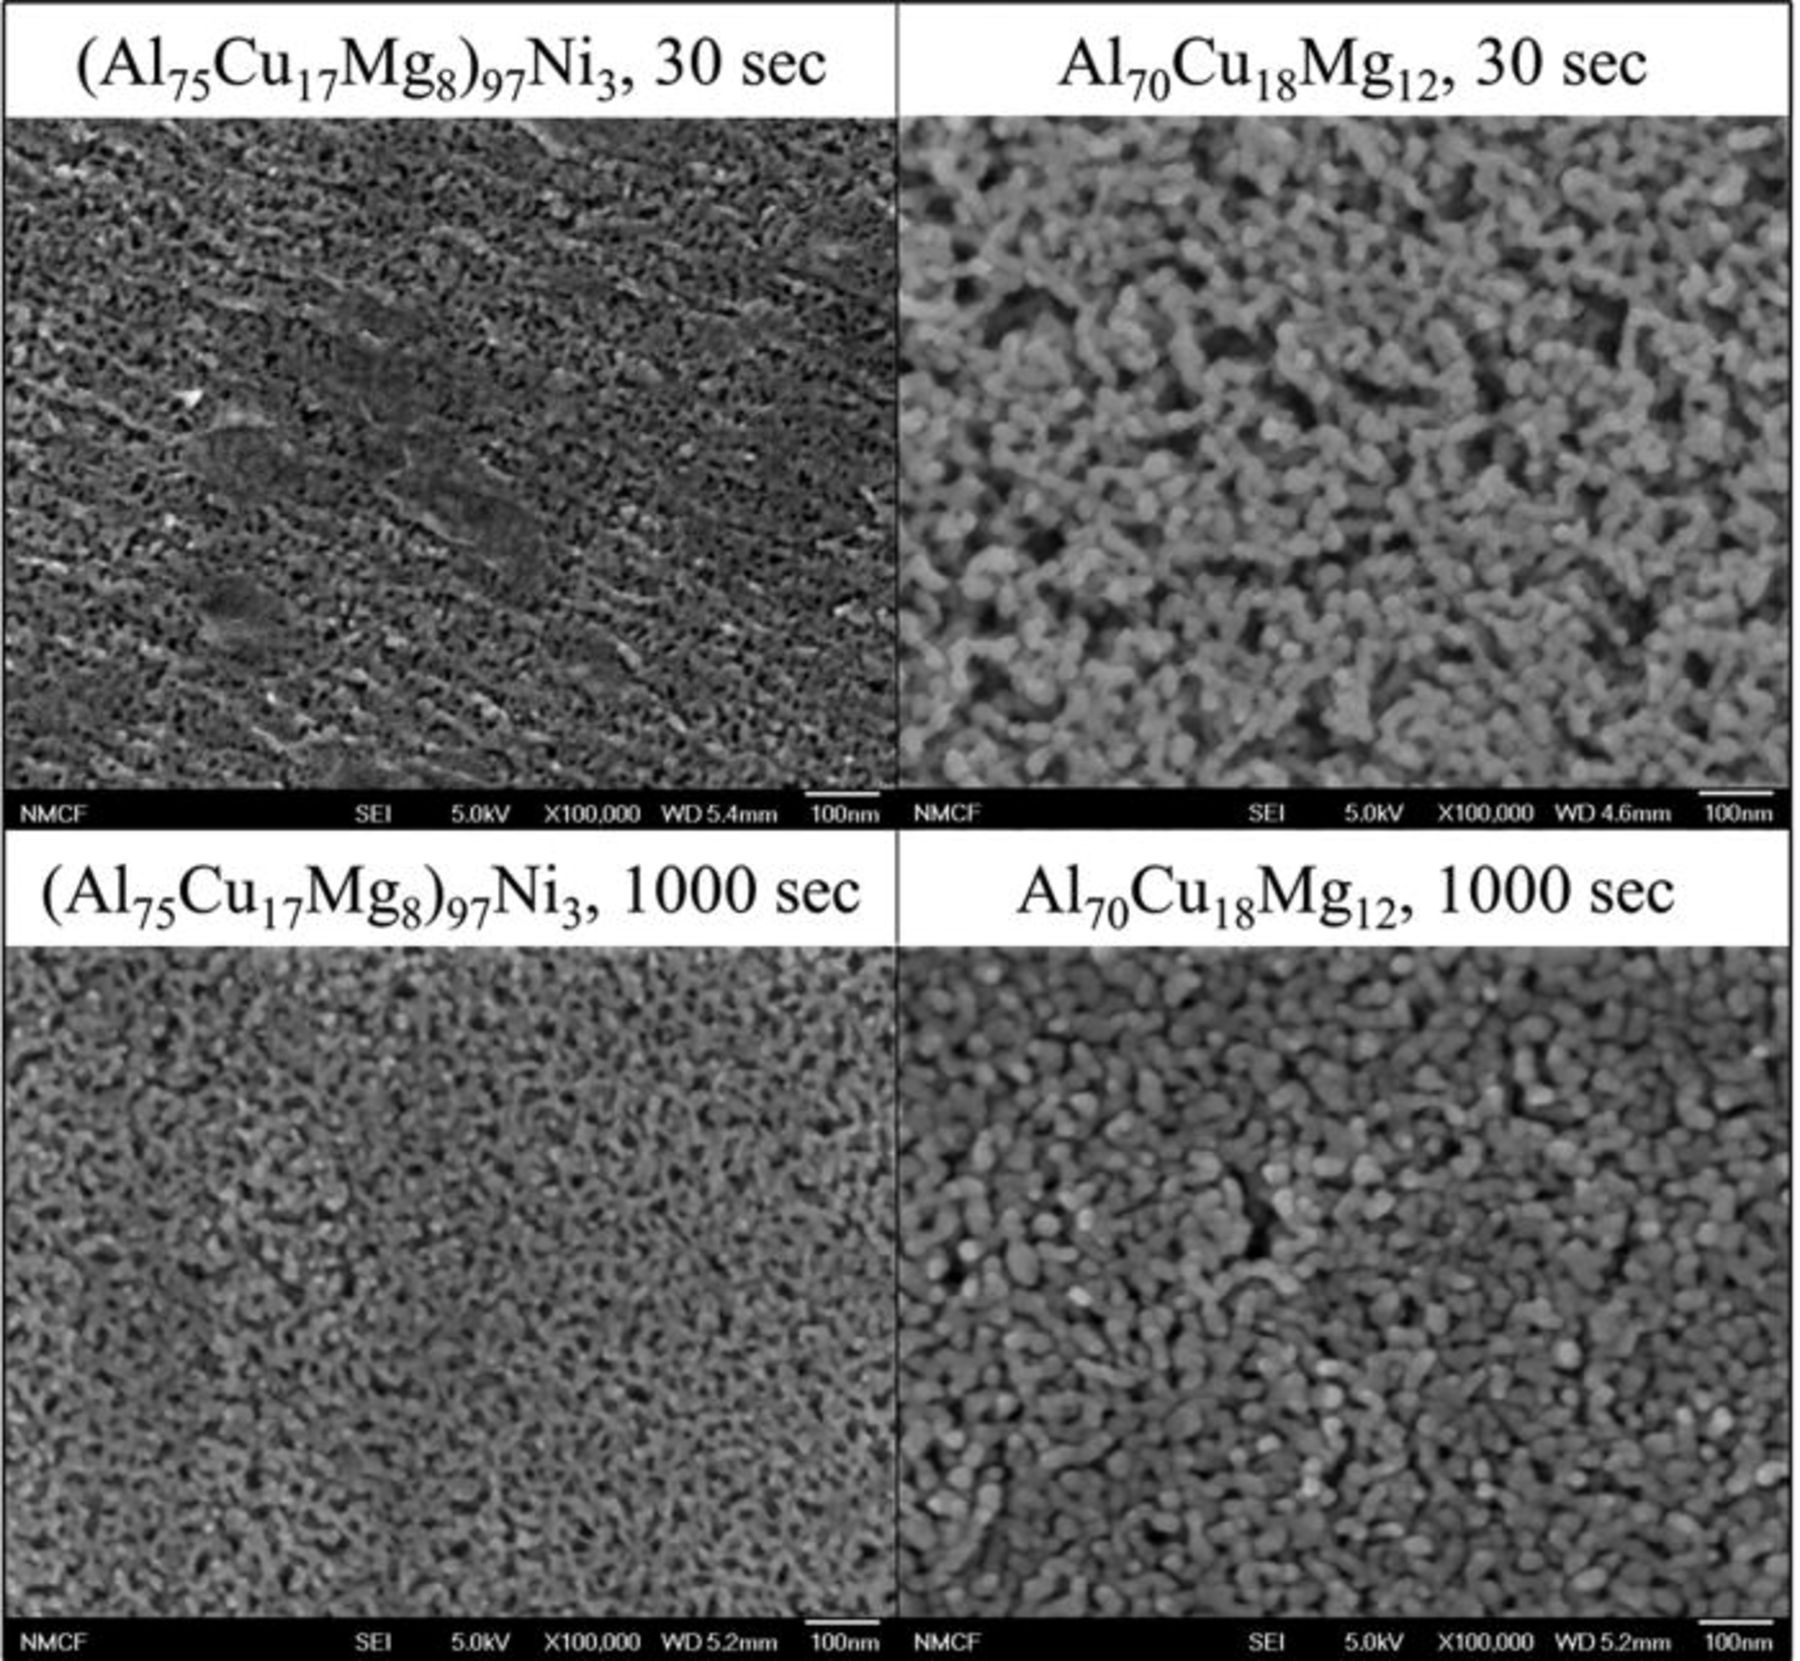
Figure 11. Nanoporous structures within a pit formed on a planar surface of the (Al75Cu17Mg8)97Ni3 and Al70Cu18Mg12 alloys. The ribbon samples were immersed in a aerated 1 M HCl solution and potentiostatically held at −400 mVSCE at room temperature. To improve the image quality, the specimens were coated with 25 Å of AuPd.34
Table IV. Diameter of ligaments in the nanoporous structure formed on the (Al75Cu17Mg8)97Ni3 and Al70Cu18Mg12 alloys. The specimens were potentiostatically held at −400 mVSCE in 1 M HCl solution.
| Exposure time | |||
|---|---|---|---|
| Alloy | 30 s | 200 s | 1000 s |
| (Al75Cu17Mg8)97Ni3 | 15.7 ± 2.7 nm | 17.4 ± 4.7 nm | 20.0 ± 4.7 nm |
| Al70Cu18Mg12 | 24.1 ± 5.6 nm | 25.3 ± 2.6 nm | 28.0 ± 2.2 nm |
Crystal structure of the dealloyed layer
The crystal structure of the post-corrosion specimens was examined by XRD. The results are shown in Fig. 12. The alloy exposed for 30 s was partially dealloyed, isolated in pits, while the alloys exposed for 1000 s were fully dealloyed over the 20 mm × 2 mm × 25 μm dimensions. After 200 s of exposure, the Al70Cu18Mg12 alloy was fully dealloyed, while the (Al75Cu17Mg8)97Ni3 alloy was partially dealloyed. As exposure time increased, the peaks corresponding to crystalline FCC Cu appeared at approximately 43 and 50° (30 s for Al70Cu18Mg12 and 200 s for (Al75Cu17Mg8)97Ni3) with the diffuse amorphous peaks still persisting. The XRD characterization of the (Al75Cu17Mg8)97Ni3 alloy exposed for 30 s showed a fully amorphous structure. However, the SEM characterization showed the presence of a Cu-rich dealloyed layer in the pits, suggesting the Cu peaks are masked by the presence of the broad diffuse amorphous peaks in the background. The fully dealloyed specimens (200 and 1000 s for Al70Cu18Mg12, and 1000 s for (Al75Cu17Mg8)97Ni3) showed only sharp peaks corresponding to pure Cu and Cu2O, which is presumably formed in the air after the dealloying. The change in crystallinity can clearly only be attributed to the reorganization of Cu left behind after dealloying by a surface diffusion process. However, the undissolved matrix away from the pit maintains the initial amorphous structure. As active dissolution continues, the entire specimen was transformed to crystalline Cu with a nanoporous structure. Ni remains in the Cu solid solution due to the complete solid solubility of Ni in Cu.
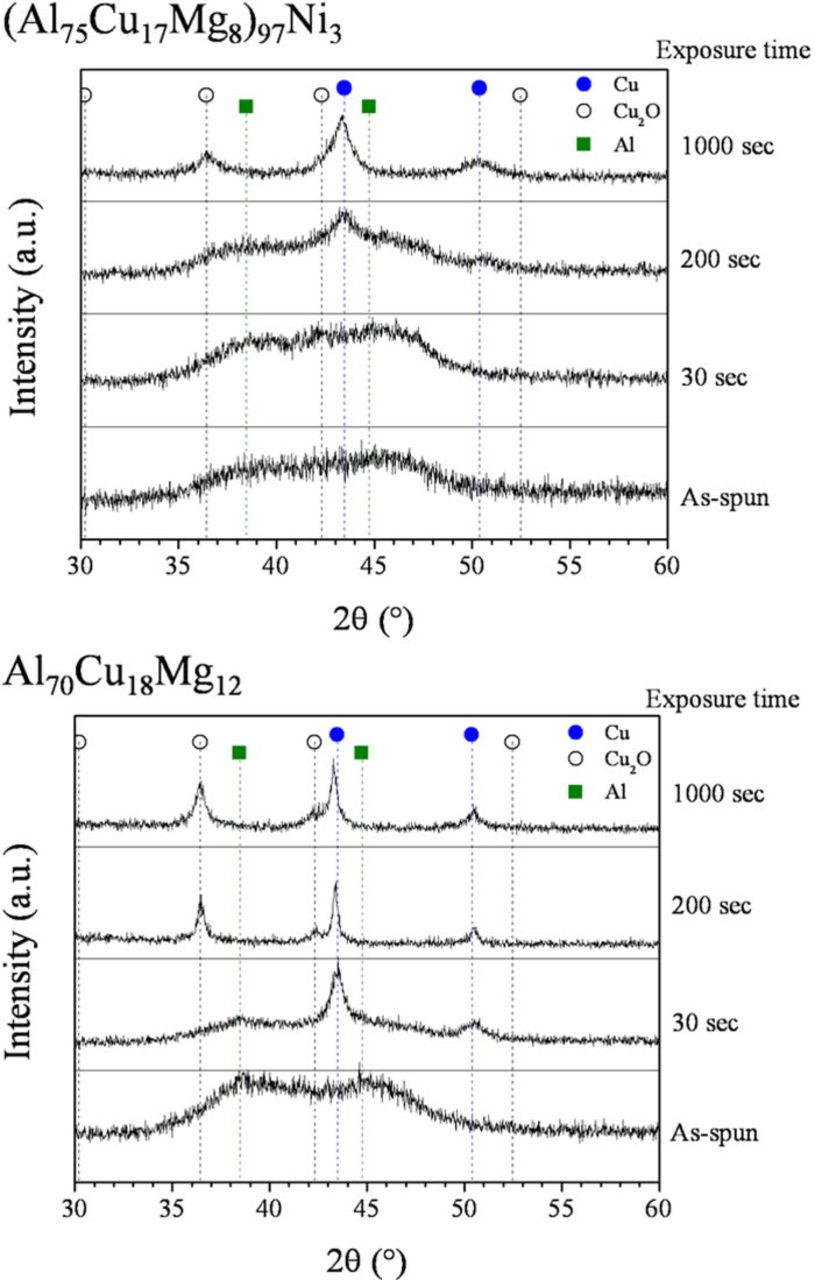
Figure 12. (Color online) XRD spectra obtained from the post-corrosion (Al75Cu17Mg8)97Ni3 and Al70Cu18Mg12 alloys. The ribbon samples were immersed in an aerated 1 M HCl solution and potentiostatically held at −400 mVSCE at room temperature.34
Growth of artificial pits
An artificial pit was initiated and grown by a potentiostatic hold at −500 and −400 mVSCE in 1 M HCl solution. The current density as a function of time during the potentiostatic hold is shown in Fig. 13. The addition of Ni lowered the current density at both applied potentials. The current density was lowered significantly by the addition of Ni at −500 mVSCE, while the current behavior was similar at −400 mVSCE, which is likely because both alloys pit under mass transport control. The pit depth estimated using the net charge density and Faraday's law is plotted in Fig. 14. The depth of an artificial pit formed in the (Al75Cu17Mg8)97Ni3 was far shallower than that formed in the Al70Cu18Mg12 alloy. The nominal depth of the pit determined by optical microscopy is shown in Fig. 15. Minimal growth of the pit can be seen in the (Al75Cu17Mg8)97Ni3 alloy, while the pit in the Al70Cu18Mg12 alloy grew at −500 mVSCE. No significant difference between the alloys was observed in the growth at −400 mVSCE. The pit current appeared is similar at −400 mVSCE regardless of the Ni content, which differed from the results shown in Fig. 14. The two pit depths estimated using Faraday's law and optical microscope were compared. Figure 16 exhibits the relationship between the pit depths estimated by Faraday's law (dFaraday) and optical microscope (dOM), initiated and grown by a potentiostatic hold at −400 mVSCE. A linear relationship was observed for both alloys. From the slope of the relationship, the current efficiency of the pit growth in the (Al75Cu17Mg8)97Ni3 and Al70Cu18Mg12 alloys was determined to be 41 and 82%, respectively. Thus, the difference in pit depth estimated by Faraday's law between the alloys is due to the difference in current efficiency. The net current measured is a the difference between the anodic and cathodic currents. Since the true anodic current is similar in both alloys at −400 mVSCE, as inferred from the optical observation, the difference in the net current is attributed to the cathodic current, primarily the hydrogen evolution reaction at the Cu-rich dealloyed nanoporous structure. Since the nanoporous structure formed in the Ni containing alloy is finer and possesses larger surface area, the local cathodic reaction rate in the pit is greater in the Ni containing alloy. This is another reason why nickel is beneficial because the greater the rate of the local proton consuming cathodic reaction in the pit, the more difficult it would be to form an acidic pit solution via hydrolysis37–39 as is discussed further below. It should be noted that the local formation of acidity in a pit depends on the rate of hydrolysis exceeding the rate of proton consumption which differs from uniform corrosion with an infinite supply of acidic solution. Moreover the cathodic reaction on the passive Ni-containing alloy in 0.6 M NaCl is nearly the same as that for the Al-Cu-Mg alloy. Therefore, there is no disadvantage to raising the rate of proton consumption and hydrogen evolution in pits in the Al-Cu-Mg-Ni alloy.
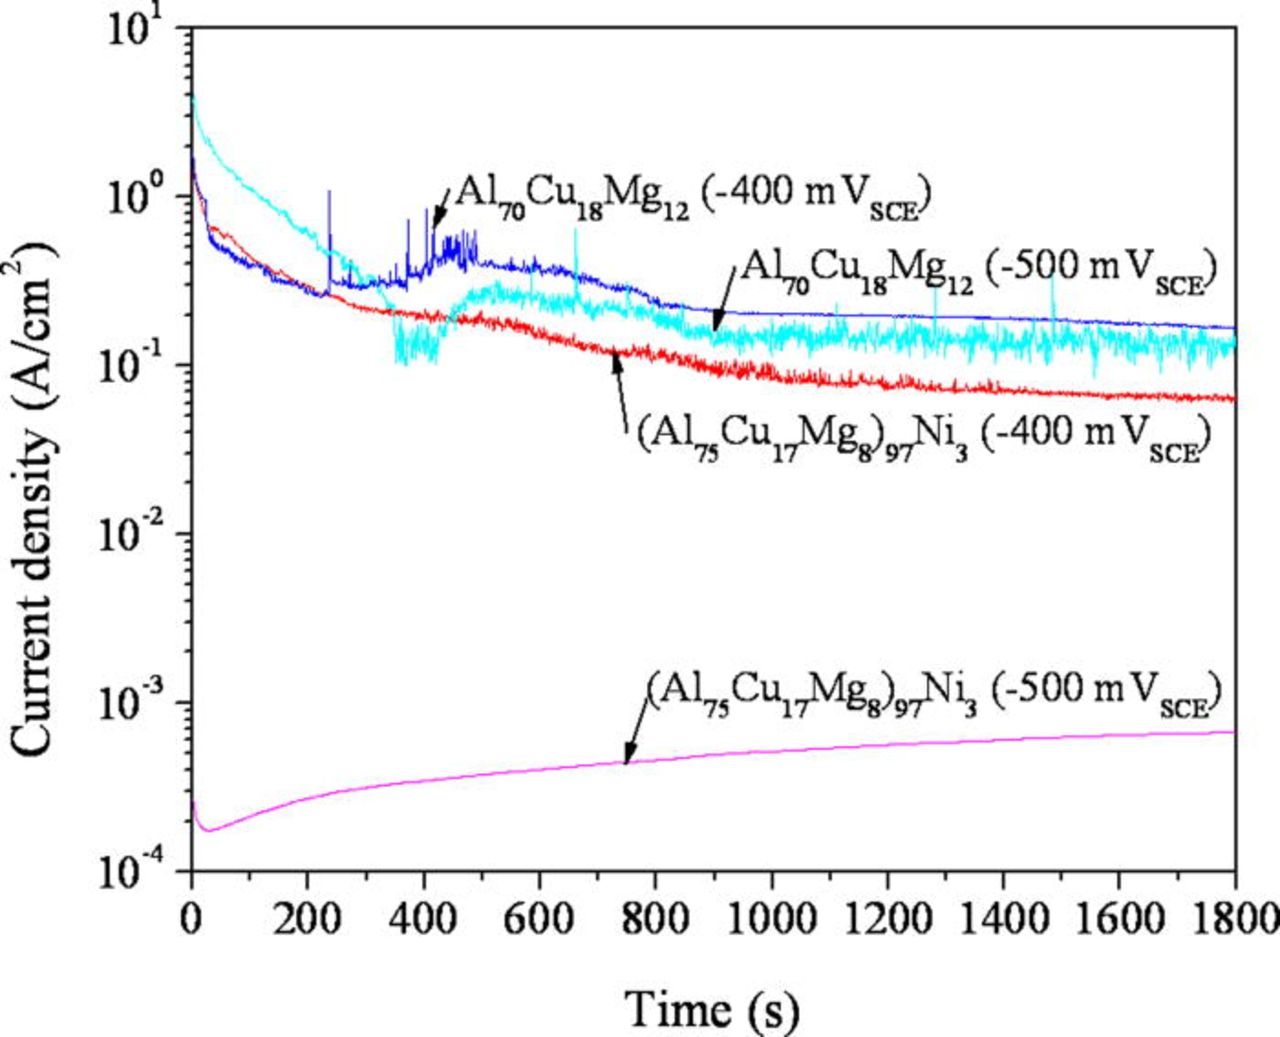
Figure 13. (Color online) Current-time behavior during the potentiostatic hold of the the (Al75Cu17Mg8)97Ni3 and Al70Cu18Mg12 alloys at −400 and −500 mVSCE in a deaerated 1 M HCl solution at room temperature. The cross section of the ribbons was exposed to the solution. The measured current was normalized by the initial surface area.
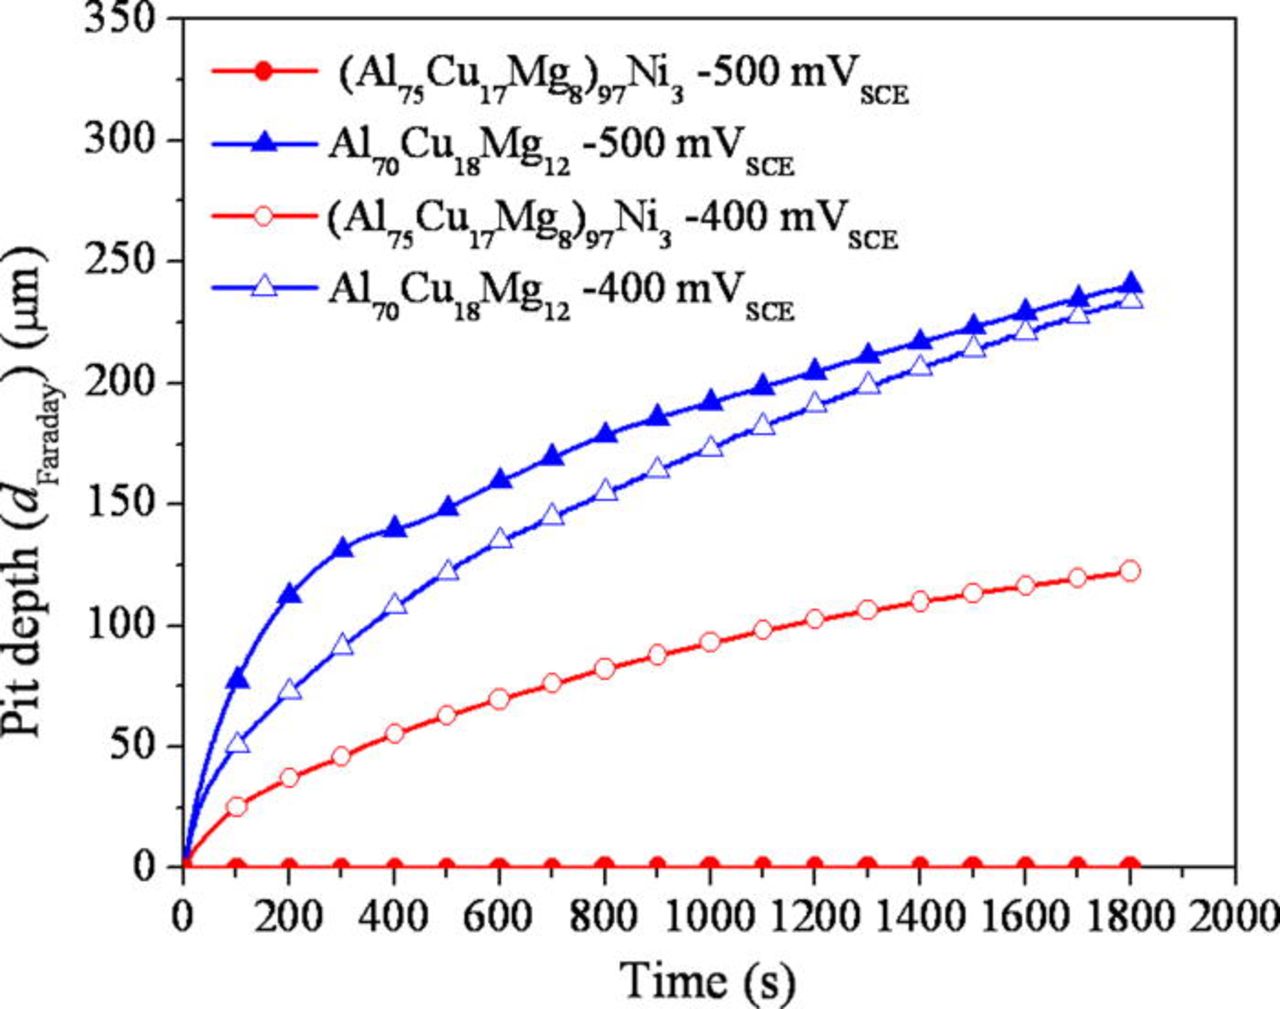
Figure 14. (Color online) Pit depth during the potentiostatic hold of the (Al75Cu17Mg8)97Ni3 and Al70Cu18Mg12 alloys at −400 and −500 mVSCE in deaerated 1 M HCl solution at room temperature. The pit depth was estimated using the net charge density and Faraday's law.
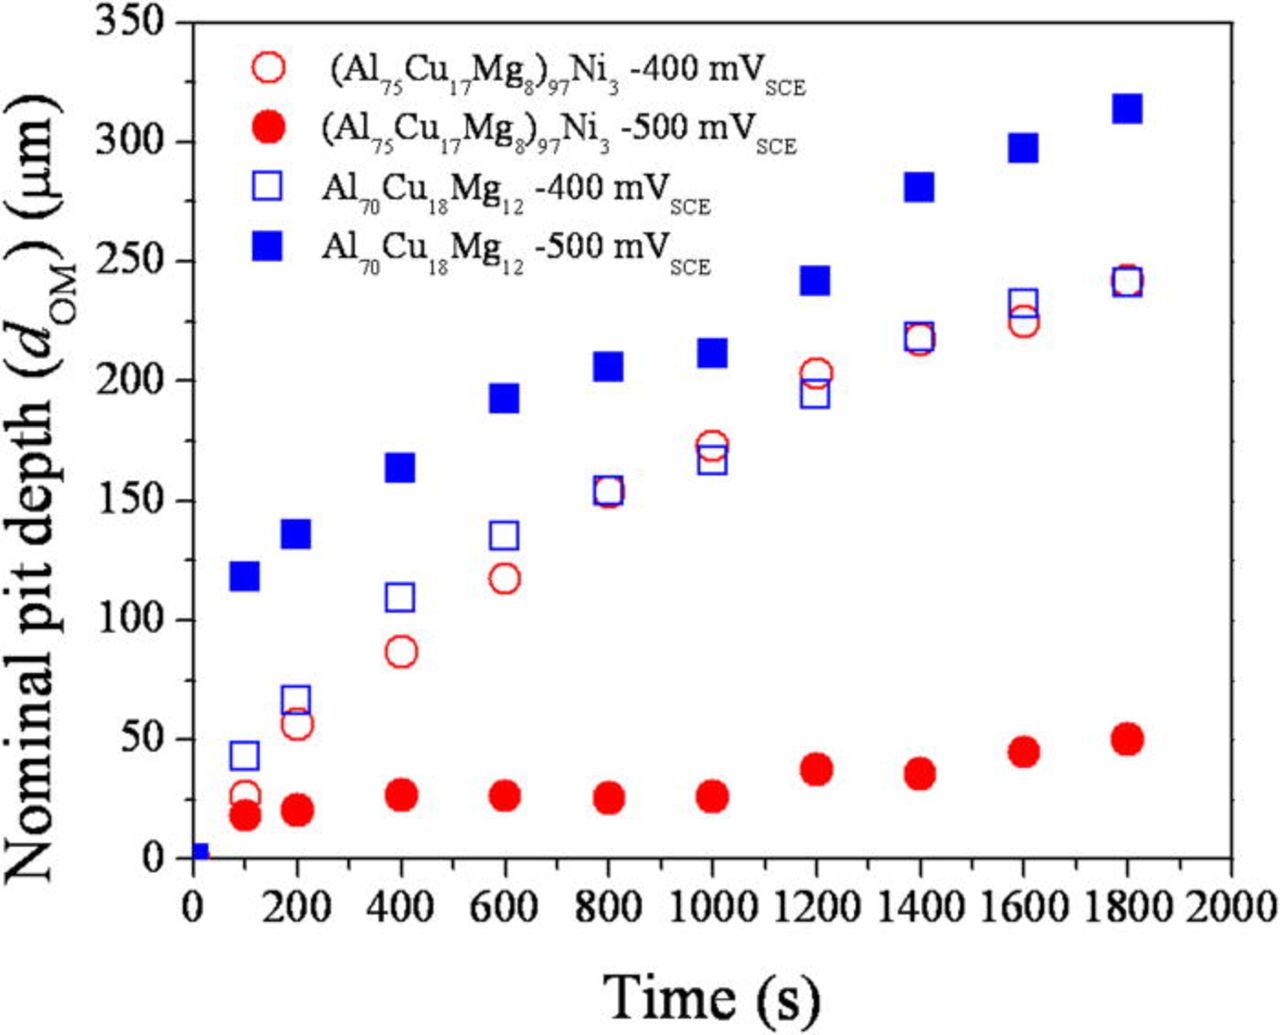
Figure 15. (Color online) Growth of one dimensional pits measured optically during the potentiostatic hold of the (Al75Cu17Mg8)97Ni3 and Al70Cu18Mg12 alloys at −400 and −500 mVSCE in deaerated 1 M HCl solution at room temperature.
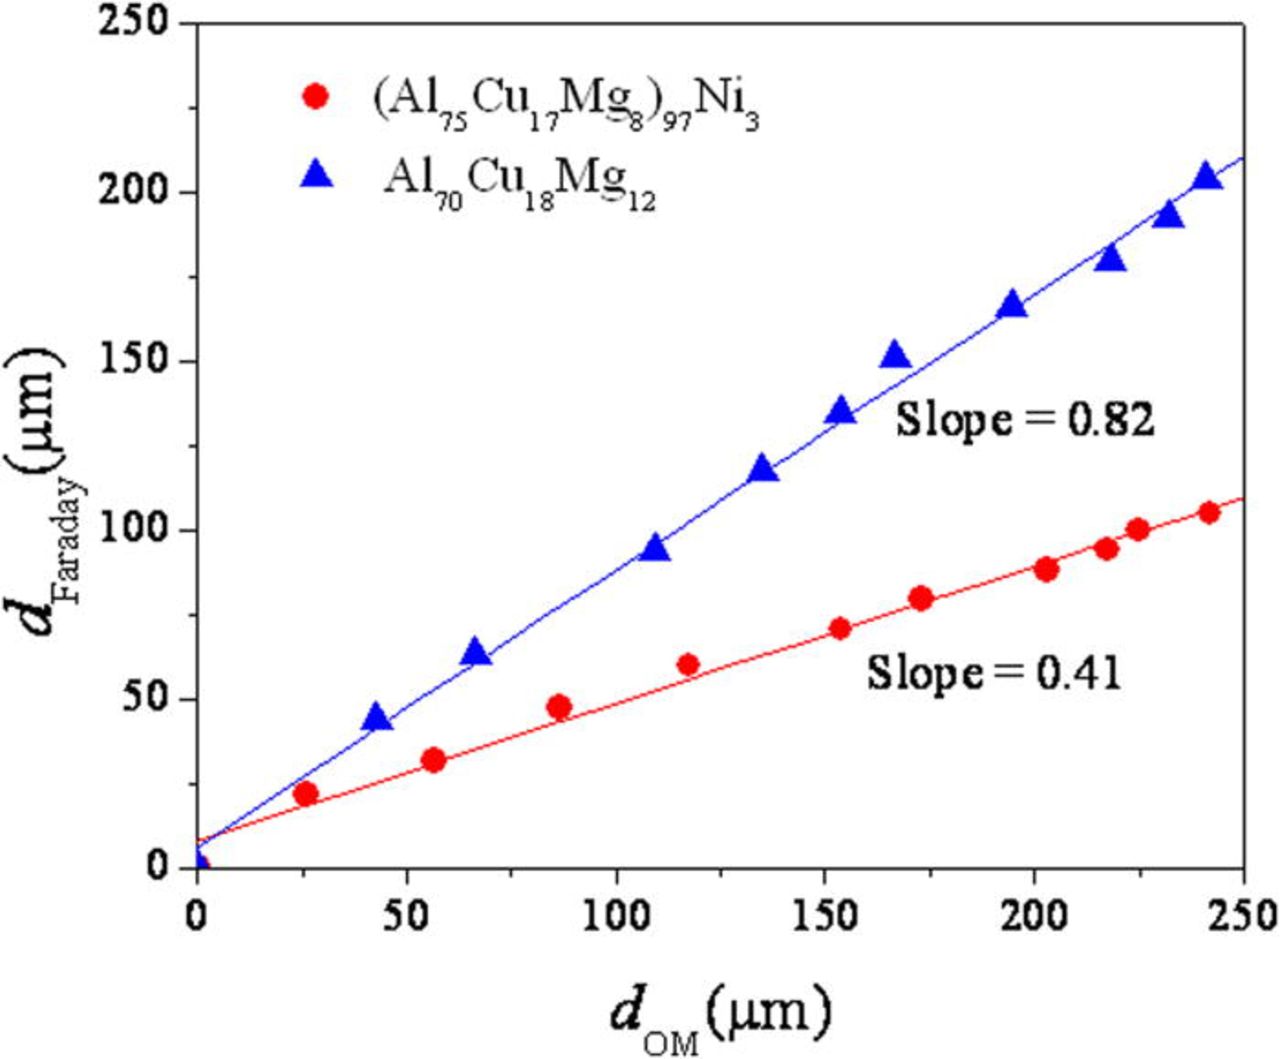
Figure 16. (Color online) The relationship between the depth of an artificial pit formed on the (Al75Cu17Mg8)97Ni3 and Al70Cu18Mg12 alloys estimated using Faraday's law (dFaraday) and optical microscopy (dOM). The artificial pit was formed by a potentiostatic hold of at −400 mVSCE in deaerated 1 M HCl solution at room temperature.
After the formation of the artificial pits, the dissolution behavior at the dissolution front was determined by a potentiodynamic downward scan. The as-acquired polarization curves are shown in Fig. 17. The anodic current and corrosion rate at the OCP are clearly lower in the (Al75Cu17Mg8)97Ni3 alloy over the potential range examined. In addition, the open circuit potential of the (Al75Cu17Mg8)97Ni3 alloy in the pit solution is greater than that of the alloy without Ni. These results suggest that the Ni alloying can also improve the pitting resistance of the alloy by altering the active anodic dissolution kinetics in pits.
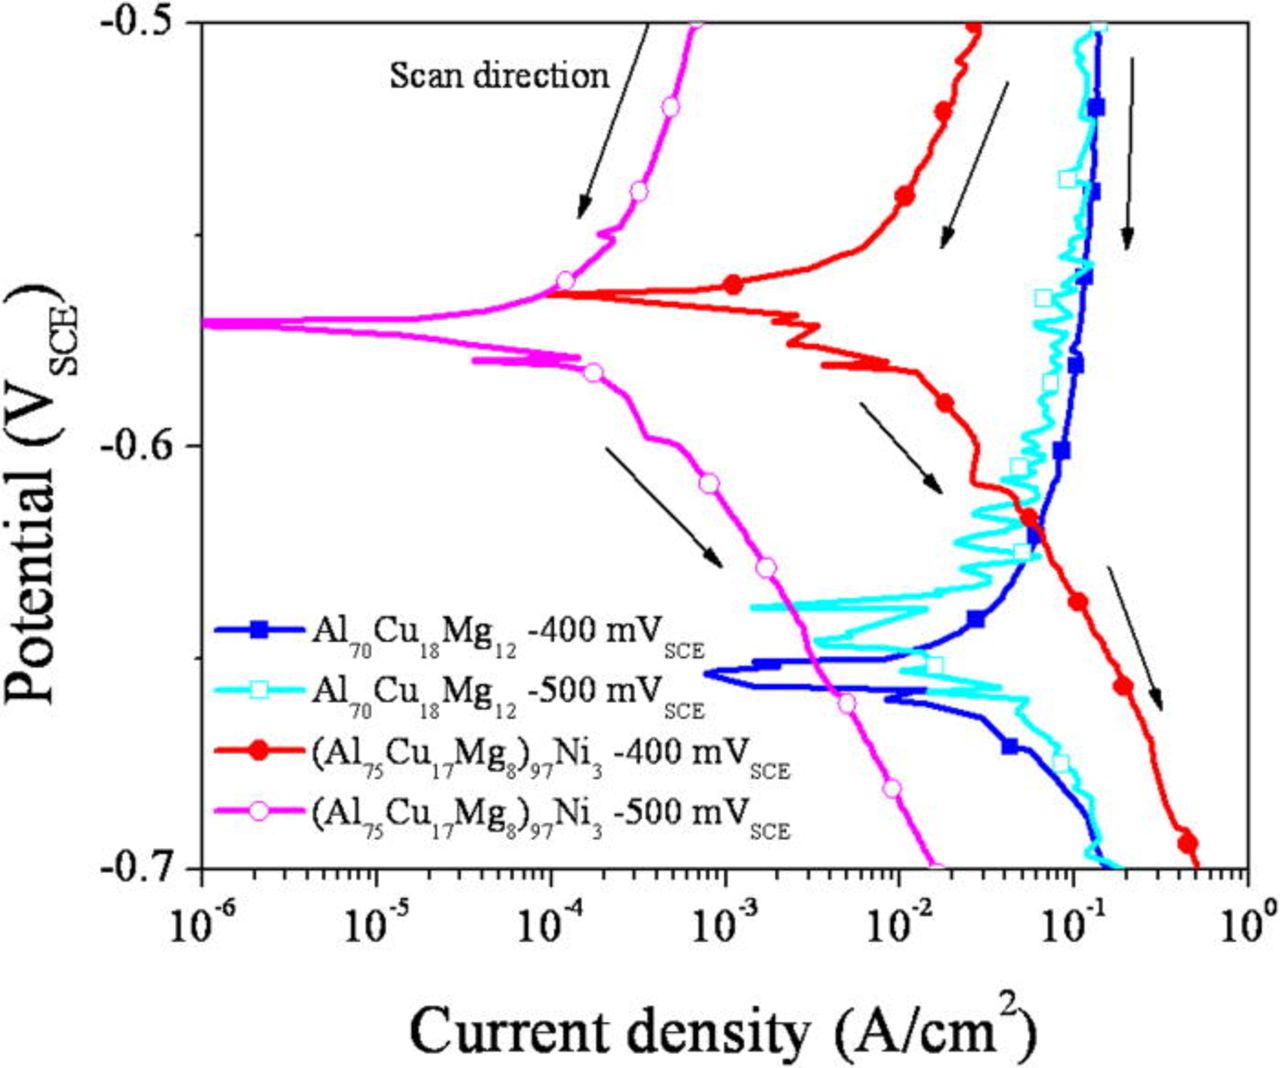
Figure 17. (Color online) Polarization behavior (downward scans) of pit artificially formed by a potentiostatic hold at specified potential for 30 min in deaerated 1 M HCl solution at room temperature. The polarization curves were obtained by a potentiodynamic downward scan with a scan rate of 25 mV/s. These curves are uncorrected for Ohmic potential drop but clearly show elevated OCP in the (Al75Cu17Mg8)97Ni3 alloys.
The polarization curves were analyzed to determine the overall apparent resistance as evaluated by the linear E-I relationship, including the resistance inside and outside of the pit. Since the depth of the pits are similar each other, the solution phase resistance of the pits formed in both alloys by a potentiostatic hold at −400 mVSCE were compared. The contribution of the limiting current density was subtracted from the polarization curve acquired from the Al70Cu18Mg12 to extract the linear relationship between net current and potential. Assuming the limiting current density is 0.2 A/cm2, the processed data is plotted in Fig. 18. The relationship between net current and applied potential is clearly linear and enables a calculation of the apparent pit resistance

Using Eq. 2, the apparent resistance was determined by the slope of the linear E-i region (high current density) of the corrected E-i curve. The Ohmic resistance of the artificial pits formed on the (Al75Cu17Mg8)97Ni3 and Al70Cu18Mg12 alloys were determined to be 2.9 and 0.19 (Ω cm2), respectively.
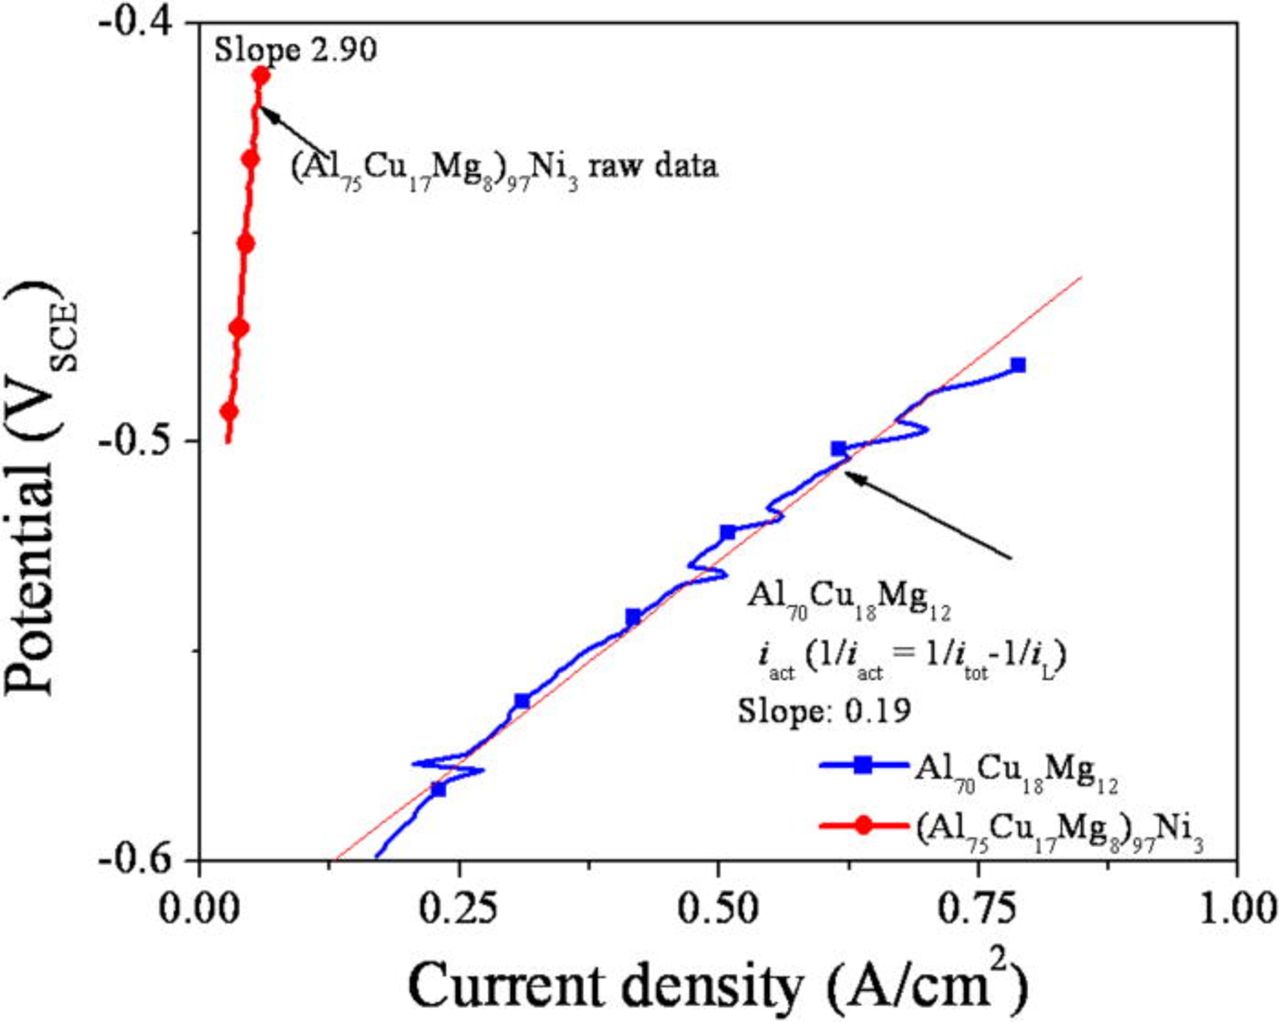
Figure 18. (Color online) Potential (E)-Active current density (iACT) curve of polarization curves (downward scans) of pits artificially formed by a potentiostatic hold at specified potential for 30 min in deaerated 1 M HCl solution at room temperature. The polarization curves were obtained by a potentiodynamic downward scan with a scan rate of 25 mV/s. iL was assumed to be 2 A/cm2.
Dissolution kinetics in an artificial pit with a continuous bulk structure were also investigated by a potentiodynamic downward scan. The artificial pit was formed by a potentiostatic hold at far above the reversible potential of Cu and Ni (1 VSCE) followed by a potentiodynamic downward scan (Fig. 19). The as-acquired polarization curves have a large proportion of Ohmic resistance contributing to the measured behavior. To resolve the polarization behavior in the absence of the apparent Ohmic voltage, iR correction was made by current interruption. The Ohmic resistance (RΩ) determined by this method was 2.17 and 0.82 (Ω cm2) for the pits in the (Al75Cu17Mg8)97Ni3 and the Al70Cu18Mg12 alloys, respectively. The iR corrected potential (Etrue) curves were calculated by Etrue = Eapplied - iRΩ (Fig. 19).
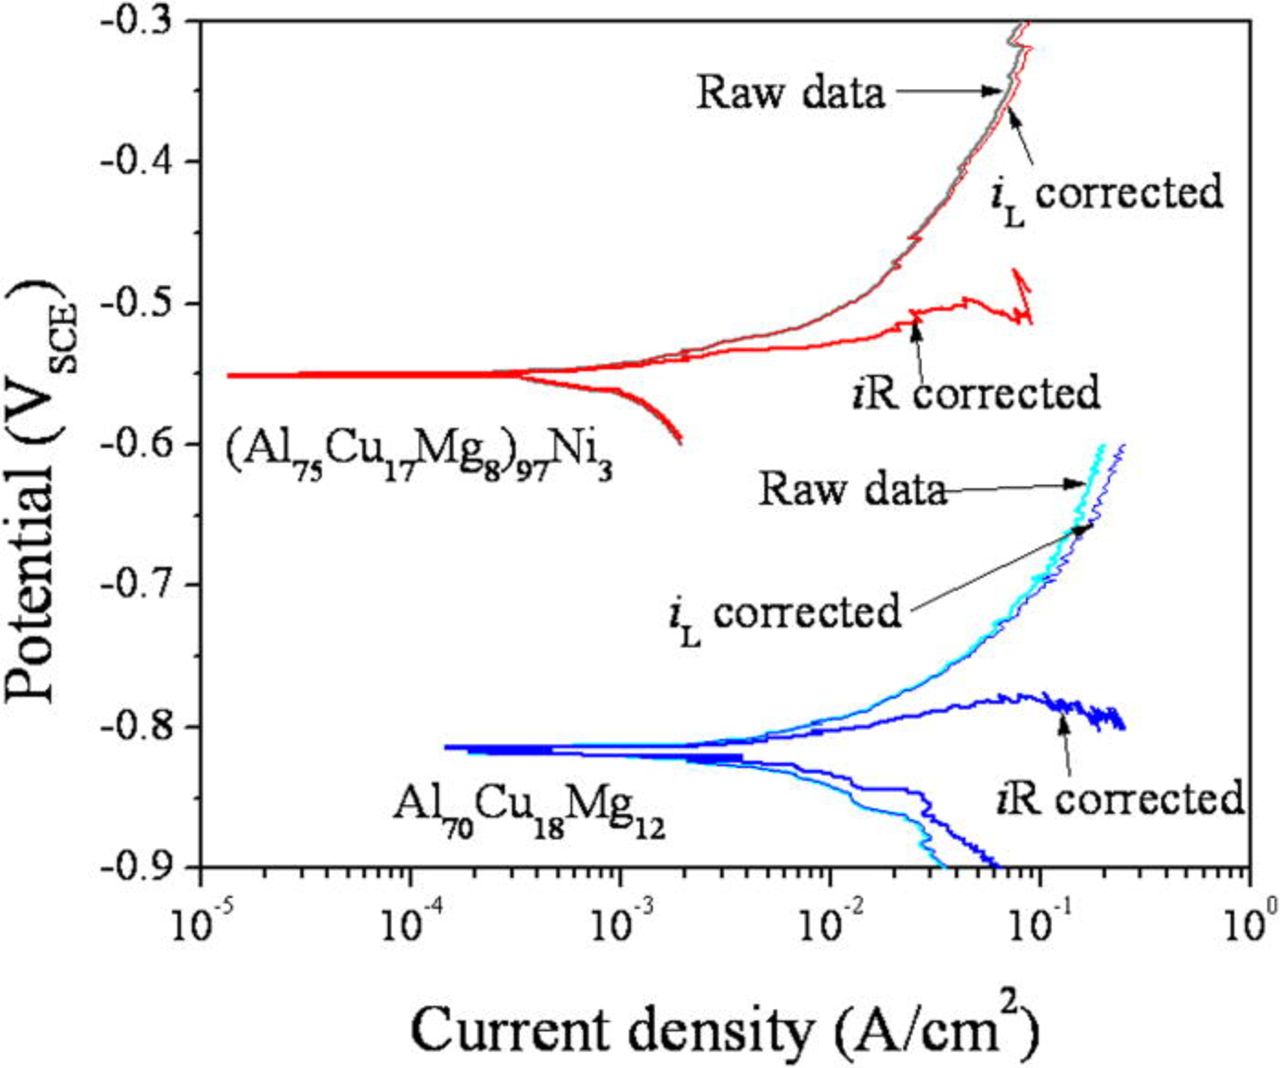
Figure 19. (Color online) Polarization curves obtained from the potentiodynamic downward scan of an artificial pit formed in the (Al75Cu17Mg8)97Ni3 and Al70Cu18Mg12 alloys. The artificial pits were prepared by a potentiostatic hold at 1 VSCE for 1000 s in 0.6 M NaCl solution at room temperature. The iR correction was applied using the Ohmic resistance measured by the current interruption technique. iL was assumed to be 1 A/cm2 .
The anodic current in the pit formed on the (Al75Cu17Mg8)97Ni3 alloy is less than that in the Al70Cu18Mg12 alloy over the potential range examined. The open circuit potential of the artificial pit in the (Al75Cu17Mg8)97Ni3 alloy is more noble than the pit formed in the Al70Cu18Mg12 alloy. These tendencies are observed in both as-acquired and iR corrected polarization curves suggesting that the addition of Ni in the alloy suppresses active dissolution of the alloy.
Discussion
Effect of Ni on localized corrosion of Al-Cu-Mg based amorphous alloys
The addition of Ni enhances the pitting and repassivation potentials of Al-Cu-Mg-based glassy alloys (Fig. 3), even in comparison to Al2Cu (θ phase) a solid solution containing 33 atom % Cu and no Mg.32 Given the amorphous structure of the Al-Cu-Mg-based alloys, it is possible to isolate the effect of the minor solute addition from the effect of chemical and structural heterogeneity on corrosion behavior. Therefore, the results indicate that the resistance to anodic dissolution is greatly enhanced solely by the addition of Ni as a minor solute. Since the solution in pits are more acidic as compared to the bulk solution, the results suggest the small alloying addition of Ni plays an important role in the growth kinetics of pits and/or the dealloying process. Artificial pit studies indicate that the potential required for pit growth is ennobled, as shown in Fig. 17.
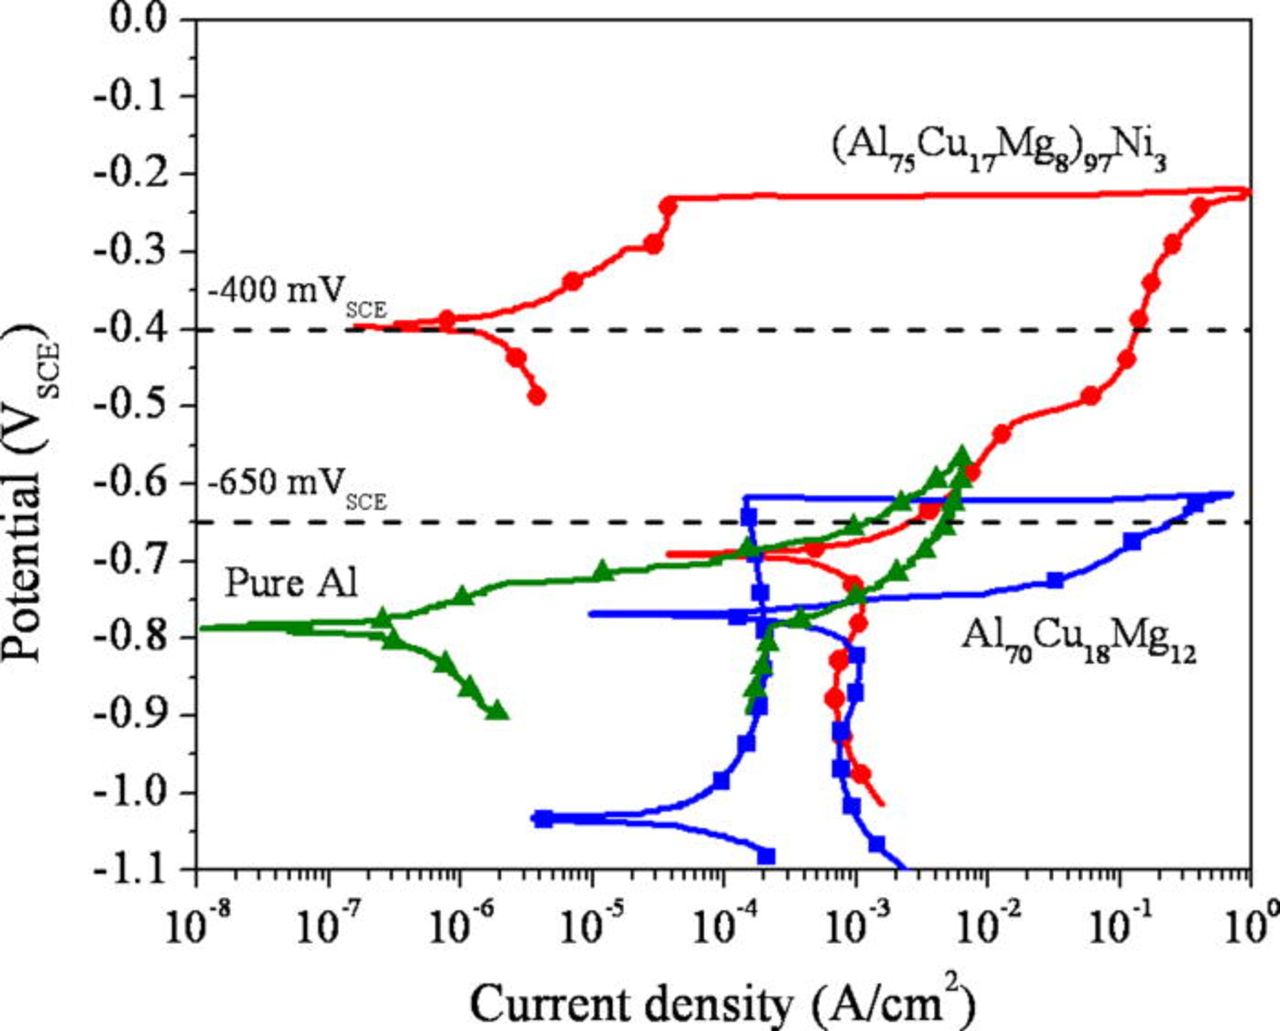
Figure 3. (Color online) Representative cyclic polarization (upward then downward scans) curves of the Al-Cu-Mg-based amorphous alloys and poly-crystalline pure Al (99.99%) in deaerated 0.6 M NaCl solution at room temperature. The cross section of the ribbons was exposed to the solution.
In contrast, the growth rate is similar at a potential well above the critical potentials (Figs. 13 and 15) regardless of Ni content. At this potential, the growth kinetics are likely controlled by ionic diffusion of the dissolving species, Al and Mg. A mass transport limiting current density, which is independent of applied potential, was observed at a potential above the critical potential in the aggressive solution, strongly suggesting it is mass transport controlled (Fig. 6). Therefore, it is improbable that Ni alloying alters the ionic diffusion of the dissolving species above the critical potential. Ni has the potential detrimental effect of raising the open circuit potential but the oxygen reduction kinetics in near neutral 0.6 M NaCl are similar to the Al-Cu-Mg alloy.
Role of Ni as a dissolution moderator
The largest effect of Ni as a minor solute element is clearly the ennoblement of the potentials required to get significant dissolution of the (Al75Cu17Mg8)97Ni3 alloy compared to the Al70Cu18Mg12 alloy (Fig. 19). This result suggests that the effect can be discussed through an understanding of atomic bonding. It has been suggested that one role of beneficial solute is a dissolution moderator, by the modification of atomic bonding attributes.10 Since Al is the primary dissolving species, and the contribution of Mg towards the improvement of dissolution resistance would be negligible or even detrimental as compared to the dissolution of Al, the Al-Al, Al-Cu and Al-Ni bonds are considered. The cohesive energies of the bonds are available in literature,40 and summarized in Table V. The cohesive energy of Al-Cu and Al-Ni bonds are greater than that of Al-Al bonds. However, the cohesive energy of Al-Ni bonds is far greater than the other two bonds, indicating a strong interaction between Ni and Al atoms. Therefore, the removal (bond cleavage) of Al atom from the coordination sphere that contains Ni atoms requires greater energy than that surrounded by Al atoms.
Table V. Interatomic distance and cohesive energy of selected atomic bonds.
| Al-Al | Cu-Cu | Ni-Ni | Al-Cu | Al-Ni | |
|---|---|---|---|---|---|
| r0 (Å) | 2.86 | 2.55 | 2.49 | 2.71 | 2.68 |
| Cohesive energy (kJ/mol) (Ref. 40) | −53.5 | −56.51 | −71.89 | −57.64 | −70.52 |
Dissolution of an atom from the surface requires at least two different processes, including a breaking of atomic bond and ionization/dissolution. The total energy required for the entire dissolution process is the sum of the cohesive and ionization energies.41 Therefore, the electrochemical potential required for the dissolution of the atom can be altered by the presence of surrounding atoms that produce stronger bonds. The results from the EXAFS characterization (Fig. 2) revealed that the coordination spheres around Ni and Cu due to one prominent peak in each spectrum, suggesting the dissolution of the Al coordination atoms may be affected by the Ni or Cu atom in the center of the coordination sphere, due to the stronger bonding in Al-Ni and/or Al-Cu bonds.
There is evidence that the Ni addition decreases the probability of the Al-Al interaction by forming Ni-Al and Cu-Al coordination spheres and the increased intensity of the diffuse peak corresponding to Al-Cu pairs in XRD (Table III). Since an Al atom surrounded by Al atoms is easier to dissolve as compared to an Al atom surrounded by both Al and Ni or Cu atoms, the modification of local atomic structure by the addition of Ni induces a lower probability for dissolution of Al-Al bonds than otherwise seen. This suppression of dissolution by the addition of small amount of Ni may play an important role in the elevation of the pit stabilization potential as well as the critical potential for active dissolution. If this effect was operative, it would reduce the dissolution current density idiss of the pit in the presence of Ni which, in turn, reduces the rate of hydrolysis of Al3 + cations. Figures 15 and 19 clearly show that Ni alloying performs this function.
A smaller additional effect of Ni is to raise the cathodic reaction rates, iHER, in pits which also make them more difficult to acidify them. It should be noted that many previous studies involving Group VIII elements added to Ti have shown this benefit.38 Moreover, a graphite gasket has demonstrated this effect during stainless steel crevice corrosion.39 It is worth illustrating how detrimental this combine effect would be. Consider the following situation under anodic polarization where the net anodic dissolution rate is the difference between the true anodic dissolution rate in pits and the local cathodic reaction rate. The reactions that produce hydrolysis and create protons and those that consume protons are indicated

The true and net anodic current density responsible for hydrolysis is reduced in the case of the Al-Cu-Mg-Ni alloy while iHER is raised. These are clearly indicated by Figs. 15, 16 and 19. Hence, the potential required to achieve acidity would have be raised in the Al-Cu-Mg-Ni alloy according to the dissolution hydrolysis acidification model of pit stabilization,42 in order to raise itrue and offset proton loss due to the elevated iHER.
Localized dealloying in pits
The presence of the Cu-rich nanoporous structure within hemispherical pits (Figs. 9, 10 and 11) suggests that preferential dealloying of Al and Mg takes place during active dissolution. The Al-Cu-Mg-based alloys satisfy all three conditions for dealloying, which include: (1) the starting material contains at least two different elements, a less noble element and more noble element, in the solid solution, (2) a significant difference in electrochemical nobility exists between the less noble element(s) and more noble element(s), (3) the concentration of less noble element(s) has to be greater than the parting limit. Since the Al-Cu-Mg-based alloys are amorphous materials, they are single phase ternary and quarternary solid solutions. Regarding the second requirement, Al and Mg are considered to be less noble elements, and Cu and Ni are more noble elements. The difference in the reversible potentials of less noble element and more noble element in an acidic environment is approximately 2 V (between Al and Cu). The parting limit of Al in Al-Cu alloys is reported to be between 11 to 16 atom %,43 which is far below the concentration of Al in the Al-Cu-Mg-based alloys (∼70 atom %). Therefore, dealloying would be expected in these amorphous alloys under depassivating conditions.
r0 of pure metal was assumed to be the atomic spacing in the [111] direction = 0.707 a for crystalline pure metals.
The matrix preserves the initial composition under the protective oxide. The oxide breakdown due to the Cl− attack induces exposure of the bare substrate, and this depassivation results in the initiation of localized corrosion. In the case of the alloys studied, the bare substrate is a solute-rich solid solution with less and more noble elements, therefore, the corrosion process turns into dealloying, where selective dissolution of Al and Mg takes place. The residual Cu and Ni form a nanoporous structure via surface diffusion, a typical path way usually discussed in the dealloying process.26, 27, 44 Since the dealloying occurs under acidic conditions, the porous layer is not likely covered with a Ni or Cu oxide, suggesting that the surface diffusion of elemental Cu and Ni are the origin of the morphological evolution.
Effect of Ni on the dealloyed nanoporous structure and connection to the resistance to anodic dissolution
The resulting nanoporous structure in the dealloyed layer is finer in the alloy with Ni in pits (Fig. 11). This variation can be explained by the surface diffusion model of dealloying,26, 27, 44 where surface diffusion of a more noble element enables the growth of ligaments in a porous structure to relax the roughened surface created by selective dissolution of the less noble element. Since the dealloyed layer is rich in Cu, the surface diffusion of Cu primarily contributes to the ligament growth. However, the presence of relatively immobile Ni suppresses the surface diffusion of Cu and the coarsening of the ligaments in the nanoporous structure, resulting in the formation of finer porous structure after a given time.34
This fine porous structure formed in the alloy containing Ni may also play a critical role, albeit secondary, in the stabilization of pits. The finer porous structure may reduce the area of the dissolving sites at the dissolution front and decrease the penetration of electrolyte. In addition, an increase in the Ohmic pore resistance through the dealloyed layer was observed in the grown pit (Table VI). It is worth considering whether this pore resistance would change the overall resistance between a reference electrode and the pit bottom. The overall Ohmic resistance (ROhmic) measured is the sum of three different series type resistances: between the pit mouth and the reference electrode (Rsol), the solution resistance within the pit (Rpit), and the pore resistance within the nanoporous structure formed in pits (Rpore). The total Ohmic resistance is expressed by

Rsol and Rpit can be estimated from geometric conditions and intrinsic conductivity. The conductivity of the solution is given by

where ci is the concentration (mol/cm3), zi is the ionic charge (equiv./mol) and λi is the equivalent conductivity (S-cm2/equiv.) of the ith ionic species in the solution. The estimated conductivity of the bulk solutions (Ksol) is 42.6 × 10⁻² (S/cm) for 1 M HCl. For the sake of this demonstration of the relative resistance, concentration gradients are ignored but of couse should be considered in the actual case. Fortunately the concentration gradient is likely similar for both alloys as ilim is the same and the bulk solution is the same. The solution resistance for a microelectrode with rectangular shape can be estimated by an expression that combines geometry with conductivity45

where a is a half of the width (cm) and b is the a half of length (cm) of the exposed surface of the electrode. Since the cross sectional dimensions of the electrode used in this research were approximately 25 μm × 2 mm, the bulk solution resistance of the system is 16.37 (Ω).
Table VI. Summary of the Ohmic resistance of the artificially grown pits determined from the potentiodynamic downward scan.
| Alloy | Measured ROhmic (Ω) | Estimated Rsol (Ω) | Estimated Rpit (Ω) | Calculated Rpore (Ω) |
|---|---|---|---|---|
| (Al75Cu17Mg8)97Ni3 | 5800 | 16.37 | 1.06 | 5782.6 |
| Al70Cu18Mg12 | 380 | 16.37 | 1.06 | 362.6 |
The solution resistance within the pit was estimated assuming the concentrations of the ionic species in pits are 10 times larger than that of the bulk solution without consideration of the concentration gradient. To calculate the exact potential drop the gradient and concentration over potential must be taken into account. However, the purpose of this calculation in this discussion is just to substantiate the claim that the porous layer contributes a significant resistive element to the total apparent pit resistance. Using these assumptions, the ionic conductivity of the pit solution was taken to be 10 times larger than that of the bulk solution. The estimated resistivity of the pit solutions (1/Kpit) is 0.23 (Ω cm). Assuming that 90% of the volume of a pit was occupied by the nanoporous structure, the solution resistance within the pit with a depth of 230 μm (Fig. 15) is 1.06 (Ω) for the pit formed on both alloys. The pore resistance was then estimated by subtracting the bulk solution resistance and the pit solution resistance from the total Ohmic resistance. The value determined is 5782.6 and 362.6 (Ω) for the nanoporous structures formed in the (Al75Cu17Mg8)97Ni3 and Al70Cu18Mg12 alloys, respectively. The results are summarized in Table VI. In summary, this analysis shows that the nanoporous structure dealloyed in the (Al75Cu17Mg8)97Ni3 alloy possesses far greater pore resistance than the structure formed in the Al70Cu18Mg12 alloy. This is consistent with the morphology shown in Fig. 11.
As a consequence, the pore resistance would result in a substantial potential drop through the porous layer resulting in a decrease in the true potential at the dissolution front, which also causes a reduction in dissolution rate. These factors also prevent the dissolution rate from reaching the critical rate at intermediate the applied potentials at the initiation stage of pitting.
Proposed localized corrosion process for solute rich Al-Cu-Mg solid solutions at anodic potentials
The corrosion process of the solute rich amorphous alloys involves pitting followed by localized dealloying. Figure 20 represents a schematic drawing of the proposed pitting and dealloying process. First, the passive oxide breaks down locally due to Cl− attack as in other Al alloys, and the unprotected native material is exposed (Fig. 20a). Pits grow by the metal dissolution-hydrolysis acidification mechanism caused by acidification, and Cl− enrichment in the pit solution as normally seen in pitting corrosion.42 However, only Al and Mg dissolve, and residual Cu reorganizes into a crystalline nanoporous structure. Below the critical potential, metastable small scale pits can form, but they repassivate due to the enrichment of the more noble solutes, and further growth is suppressed (Fig. 20b). The Ohmic resistance in the dealloyed layer also likely lowers the dissolution of Al and Mg underlying the dealloyed layer. This dual passivation mechanism, consisting of a protective oxide and subsequent enrichment of the more noble element, may be one of the key factors for the elevation of critical potentials for the stable pit formation. When the size of the pit exceeds the critical size and the dissolution rates of less noble elements exceed the rate that can cause sufficient acidification of the pit solution, the pits stabilize and continue to grow (Fig. 20c). Although the solution in pits becomes more aggressive as the active dissolution continues, the more noble elements still remain undissolved under the electrochemical conditions in the pit, mainly because of the non-polarizable dissolution of the less noble elements. The dissolution of Al and Mg continues at the interface between the dealloyed layer and native alloy. Further acidification and increase in Cl− maintains the conditions for dealloying, resulting in a continuous formation of the dealloyed layer as underlying Al and Mg dissolves (Fig. 20d).
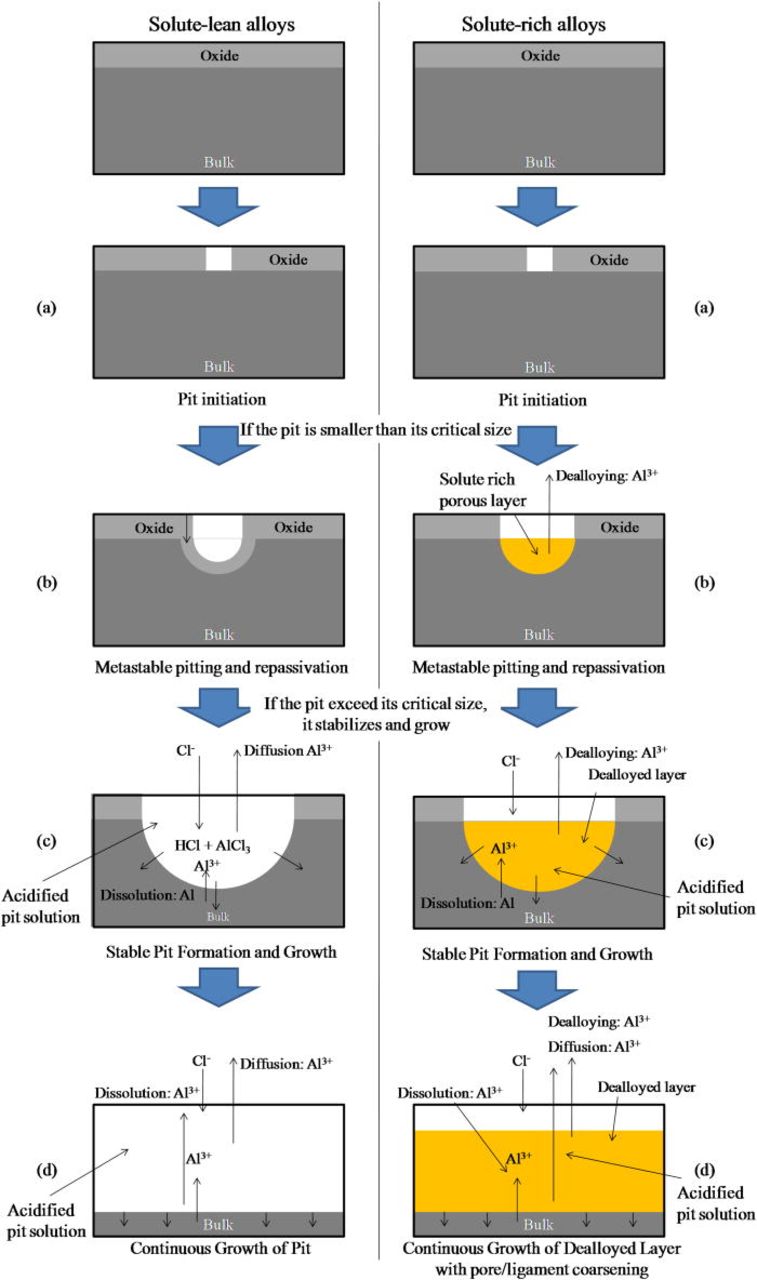
Figure 20. (Color online) Schematic representation of summary of pit formation and growth in the solute lean but below the parting limit, and solute rich Al-based solid solution alloys without secondary phases.
Technological implications
Two technological applications are suggested based on this work. One is a route to the development of nanoporous Cu with large surface area/volume ratio by the dealloying of amorphous alloys.34 Fabrication of nanoporous copper is discussed elsewhere.34
A second application is to improve the resistance to anodic dissolution of high strength, solute lean Al-Cu-Mg alloys, such as AA2024. These alloys contain S-phase particles, which are primarily an Al50Cu25Mg25 intermetallic compound. These constituent particles are a significant factor in corrosion of these alloys.46–48 This phase is a solute rich Al-Cu-Mg ordered solid solution that dealloys in a very similar manner as the solute rich amorphous Al-Cu-Mg alloys studied here.23–25 There is no fundamental reason why Ni incorporation into S-phase could not exert the same roles discussed here. If Ni or some other element that functions in the manner highlighted above then the critical potential would be enobled and dealloying might be suppressed. Raising the critical potential for pitting and dealloying of these commercial alloys could be brought about by improvement in the resistance to anodic dissolution of S-phase by slowing the kinetics of Al and Mg dealloying. This will be addressed in future work.
Conclusions
The minor addition of Ni in the solid solution of Al-Cu-Mg-based amorphous alloys enhances the resistance to anodic dissolution significantly in Cl− containing solutions. The localized corrosion of the solute rich solid solutions occurs by metal ion hydrolysis/acidification type pitting corrosion with subsequent localized dealloying in pits. The localized dealloying resulted in the formation of a Cu-rich nanoporous structure isolated in pits. The morphological growth kinetics of the porous structure is tunable by adding minor amounts of secondary more noble elements in the precursor amorphous alloy.
The three aspects of Ni alloying accounting for the improved resistance to anodic dissolution are stronger atomic bonding to Al, low surface mobility, and other electrochemical effects. The strong interaction between Al and Ni enhances the energy barrier for the dissolution of Al, retarding the dissolution rate of Al. The lower surface mobility of the alloying element hinders the coarsening of pores in the dealloyed layer. The finer porous structure results in a greater Ohmic resistance that lowers the true potential at the dissolution front. The one other electrochemical effect is an increase on the local cathodic reaction in pits which makes it more difficult for pits to acidify. These three phenomena induced by the addition of the minor alloying element contribute to the ennoblement of the stabilization potential of pitting.
Acknowledgments
This work was supported by the National Science Foundation under grant number DMR-0504983 , DMR-0906663 , and DMI-0800786 with Dr. Alen J. Ardell and Dr. Charalabos C. Doumanidis as contract monitors. Prof. G. J. Shiflet, Prof. S. J. Poon and Dr. N Unlu are acknowledged for material fabrication.