
Abstract
Intercalation-induced stress and heat generation inside Li-ion battery cathode  particles under potentiodynamic control are simulated in this paper. We combined analyses of transport and kinetics in determining resulting stresses, which arise from concentration gradients in cathode particles, and heat generation. Two peaks in boundary reaction flux, and resulting stresses, were determined from the modeling of electrochemical kinetics and diffusion, using intrinsic material properties (resulting in two plateaus in the open-circuit potential) and the applied potential. Resistive heating was identified as the most important heat generation source. To probe the impact of the particle shape (equivalent radius and aspect ratio of an ellipsoidal particle) and the potential sweep rate on stress and heat generation, a surrogate-based analysis was also conducted. The systematic study showed that both intercalation-induced stress and time-averaged resistive heat generation rate increase with particle radius and potential sweep rate. Intercalation-induced stress increases first, then decreases as the aspect ratio of an ellipsoidal particle increases, whereas time-averaged resistive heat generation rate decreases as aspect ratio increases. This surrogate-based analysis suggests that ellipsoidal particles with larger aspect ratios are preferred over spherical particles, in improving battery performance when stress and heat generation are the only factors considered.
Export citation and abstract BibTeX RIS
Excessive heat generation in Li batteries, resulting in thermal runaway, results in complete cell failure accompanied by violent venting and rupture, along with ignition of battery active materials.1–4 Stress-induced fracture also putatively degrades performance in these cells, as evidenced by observation of fractured surfaces in postmortem analysis of batteries.5–7 Stress generation results from lithium-ion extraction from the cathode (deintercalation), transport across the electrolyte, and insertion into the anode (intercalation), and the reverse reaction.8 Intercalation-induced stress varies cyclically, and thus, damage aggregates with usage.5 Particle-scale fracture of active materials results in performance degradation of batteries, due to the loss of electrical contact, and subsequent increase in the surface area subjected to side reactions.9 These phenomena, heat and stress generation, undoubtedly amplify one another, and both phenomena are governed by cell kinetics. Inclusion of heat generation, mechanical stresses, and chemical kinetics in models at critical scales (i.e., particle scales), appears necessary, and progress in each is discussed in order.
It is important to distinguish between heat transfer and heat generation analyses in battery materials. We use "heat generation" to refer to the sources of heat in the cell; "heat transfer" by contrast, refers to the resulting distribution of temperature. Though the sources of heat generation may be readily determined, solution for the distribution of temperature requires an even more detailed understanding of both geometry and material properties, as will be discussed later. Heat transfer analyses of lithium-ion batteries have stemmed from work on full cells.10 This classic work10 was later extended to consider the effect of lithium concentration in intercalation compounds.1 Foci of subsequent studies have mainly been on improved modeling of heat transfer rather than refinement of geometric models to the particle scale. A three-dimensional (3D) model was developed, considering anisotropic conductivity, to simulate the temperature distribution inside lithium polymer batteries under galvanostatic discharge, for a dynamic power profile.11 Later, a layerwise 3D model (assuming different conductivities for each homogeneous layer), was derived,12 in which radiation and convection were considered.
Thus, progress to date in heat transfer modeling has been restricted to consideration of continuum layers, though modeling at the particle scale appears necessary at this time, given our ability to select particle geometry within electrodes. Meanwhile, models have appeared in intercalation-induced stress, which do address the particle scale, e.g., a one-dimensional model to estimate stress generation within spherical electrode particles13 and a two-dimensional model to predict electrochemically induced stresses.14 Neither, however, has considered complex particle shapes or the effect of layerwise thickness on critical percolation limits.15 In more recent work,16 a 3D model based on a thermal stress analogy has been used to simulate the intercalation-induced stress inside cathode particles, but without consideration of electrochemical kinetics.
In order to fully and predictively link thermal and stress-induced failures, kinetic effects must also be understood, in tandem with detailed models of electrode architecture, in three dimensions, and for complex particle shape. Though it has been established that microscopic features of structures in batteries, including particle shape and size distributions, are important factors in battery performance,17 models have not been reported that incorporate electrochemical kinetics. Thus, in the present work, we model a  cathode particle under potentiodynamic control, with linearly variable applied potential to the particle.18, 19 The cathode particle was assumed to be homogeneous. We had the following specific objectives:
- (1)To develop and numerically implement particle scale models to simulate intercalation-induced stress and heat generation, and to interrogate the interactions among intercalation, stress, and heat generation, for spherical particles.
- (2)To understand how stress and heat generation depend on the ratio of axial lengths for ellipsoidal cathode particles, operating conditions, and with discharge time, using surrogate-based analysis.
Our general methodology comprised two sequential efforts. First, we developed a model that physically links intercalation-induced stress and thermal stress, following prior work.16 Three distinct sources of heat generation were considered, namely, heat of mixing, entropic heat, and resistive heating.1 Though heat generation at this scale is different, we do not at present have sufficient information on local heat transfer coefficients within anisotropic particles to properly model heat transfer, and thus, determination of localized temperature distribution via heat transfer analysis is not attempted here. Implementation of the model requires physical parameters, including partial molar volume,16 Young's modulus,16 and the derivative of open-circuit potential (OCP) over temperature.20
The second effort, in surrogate modeling, comprised the use of surrogate models to analyze relationships among stress and heat generation, and ellipsoidal particle morphology and operating conditions. We first conducted simulations on selected training points in critical regions using the models developed to obtain the stress and heat generation. The simulation results were then approximated by surrogate models, which were used after validation, for further analysis of stress and heat generation for different particle geometries and cycling rates.
Electrochemical, Mechanics, and Thermal Modeling
In lithium-ion batteries, actual cathode particle morphology varies with synthesis methods.21–24 Primary particles, made of crystalline grains, are agglomerated using polymeric binders [e.g., poly (vinylidene fluoride) (PVdF)]2, 25 and incorporating conductive additives, such as carbon black,25, 26 nonaqueous ultrafine carbon suspensions,27 and graphite,28, 29 to form secondary particles. Typical cathode compositions and particle sizes are shown in Table I.22, 25, 26, 28, 30, 31 Sizes range from 0.3 to  for primary particles and 11–
 for secondary particles.
Table I. Representative cathode compositions and particle sizes.
| Active material | Binder | Additives | Ref. |
|---|---|---|---|
| PVdF 
| Carbon black  graphite graphite 
| 28 |
 
| PVdF 
| Carbon black 
| 25 |
 
| Ethylene propylene diene terpolymer 
| Carbon black 
| 26 |
| Active material | Synthesis method | Sizes | Ref. |

| Calcination from  and and 
| Crystalline grain: ca. nanometers Primary particle: ca. 
| 22 |
| Carbonate Coprecipitation method at 
| Primary particle: ca.  Secondary particle: ca. Secondary particle: ca. 
| 30 |

| Microwave processing | Primary particle: ca.  Secondary particle: ca. Secondary particle: ca. 
| 31 |
Modeling of these aggregates at the scale of single crystals requires molecular or atomistic simulations. Thus, we restrict our considerations in the present paper to a pure active material  without inclusions. Our model cathode particles are homogeneous, isotropic single-phase ellipsoidal particles (prolate spheroids) or spherical particles. The stress localization due to interaction between the crystalline grains is not considered in stress generation simulations, and the temperature inside a particle is assumed to be uniform in heat generation simulations.
Determination of intercalation-induced stress and heat generation first requires mapping of concentration distribution and current density. Concentrations are obtained by solving the diffusion equation with appropriate boundary conditions for each case (see next section). To model the intercalation-induced stress, a constitutive equation is used to relate intercalation-induced strain. A heat generation model developed for a whole cell1 is used here because our simulations rely on the assumption that the cathode particle behaves as one electrode of a whole cell, incorporating experimental parameters from microelectrode studies,18 wherein a single cathode electrode and the counter electrode (lithium foil) comprise the electrochemical cell.
Model of intercalation
An intercalation process can ideally be modeled as a diffusion process with boundary flux determined by electrochemical reaction rate. The model of the intercalation process presented in this section includes a Li-ion transport equation and a boundary condition determined by the electrochemical kinetics on the particle surface under potentiodynamic control.
Li-ion transport equation
Li-ion diffusion is driven by chemical potential gradient. For a given concentration and stress gradients, the diffusion flux is given by16
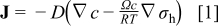
where  is the concentration of Li-ion,
  is the hydrostatic stress, defined as
  (where
  is the element in stress tensor),
  is diffusion coefficient,
  is general gas constant, and
  is temperature. With substitution of Eq. 1 into the mass conservation equation, we obtain the species transport equation as follows16

The boundary condition for this equation is that the flux on the particle surface is related to the discharge/charge current density  as
as
where  is Faraday's constant.
Electrochemical kinetics under potentiodynamic control
The current density on the particle surface depends on the electrochemical reaction rate. The reactions at the positive electrode are

During charge, the positive electrode is oxidized and lithium ions are extracted from the positive electrode particle. During discharge, the positive electrode is reduced and lithium ions are inserted into the positive electrode particle. Chemical kinetics (reaction rate) are described by the Butler–Volmer equation,32, 33 as

where  is exchange current density, η is surface overpotential, and β is symmetry factor, which represents the fraction of the applied potential that promotes the cathodic reaction.33
The exchange current density  is given by
where  is the concentration of lithium ion in the electrolyte,
  is the concentration of lithium ion on the surface of the solid electrode,
  is the concentration of available vacant sites on the surface ready for lithium intercalation (which is the difference between stoichiometric maximum concentration and current concentration on the surface of the electrode
  ), and
  is a reaction rate constant.32
In Eq. 4, the surface overpotential is the difference between the potential of the solid phase (compared to the electrolyte phase)  and OCP
  32
32
A fit of the experimental results34 of OCP for  is illustrated in Fig. 1a. OCP depends on the state of charge
  (i.e., the atomic ratio of lithium in the electrode
  ); this is a measure of the lithium concentration in the electrode. As shown in Fig. 1a, there are two plateaus in the potential distribution, resulting from the ordering of the lithium ions on one-half of the tetrahedral 8a sites of
  .35 Following the numerical study,19 the potential of the solid phase is assumed, because of the small size of particles, to be uniform within each particle, having the value of the applied potential
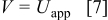
when under microvoltammetric study (for example, Ref. 18). This assumption of a uniform potential distribution will be evaluated in a later section. Under potentiodynamic control, the applied potential changes linearly with time,18, 19 for the fixed potential sweep rate  . Once the applied potential reaches the upper bound, the potential sweep rate changes sign to sweep backward. Figure 1b shows an example of the potential sweep, with
  . Increasing applied potential, in the first half cycle, drives the charging process, while the decreasing applied potential, in the second half cycle, drives the discharging process. As the potential cycles between 3.5102 and
  ,19 the electrode particle is thus charged and discharged.
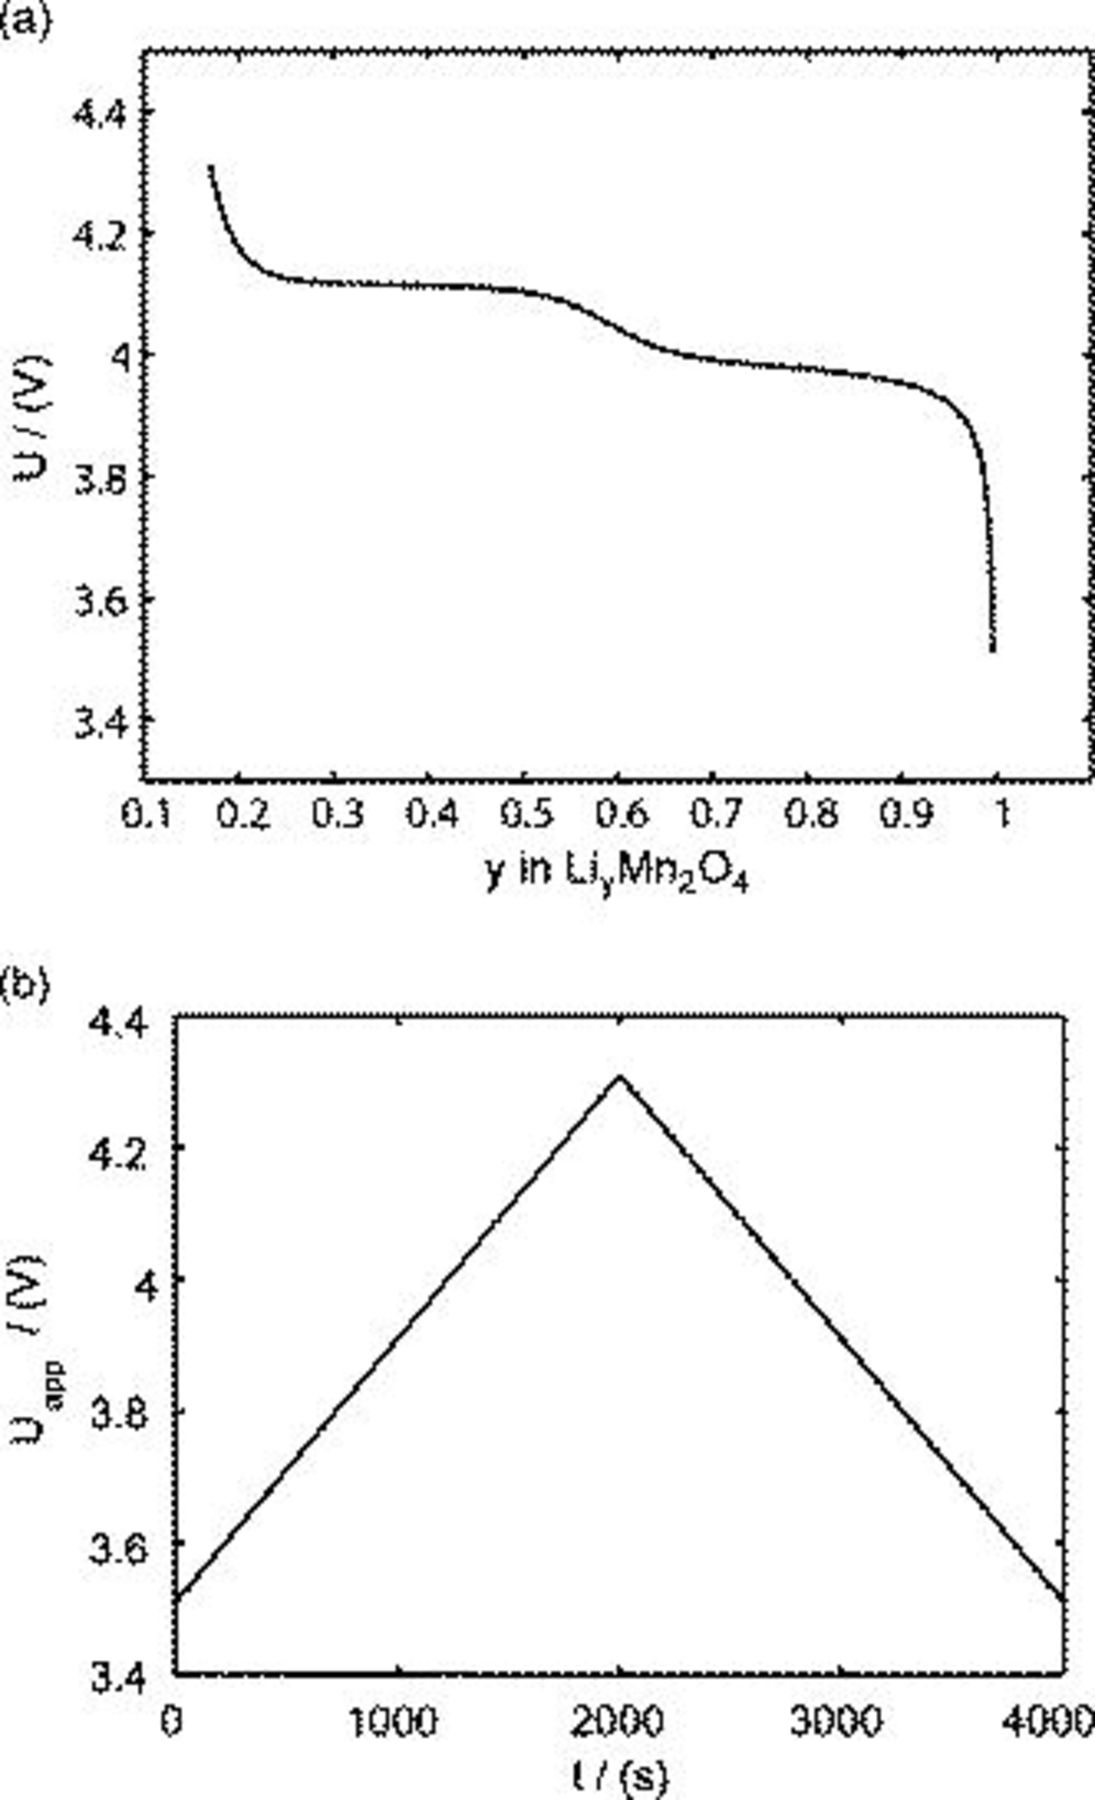
Figure 1. Potentials: (a) OCP of  and (b) applied potential sweeping profile during one cycle.
For this applied potential stimulus, the initial condition for the species transport equation (Eq. 2) is  .
.
Parameters and material properties
A reasonable way to obtain the lithium-ion concentration in the electrolyte  would be to solve the species transport equation in the electrolyte. However, it is assumed to be a constant value in this study following Ref. 19. The values of parameters and material properties used in this study (unless otherwise stated) are listed in Table II.
Table II. Parameters and material properties for the intercalation model (where  is the radius of a spherical particle).
| Symbol | Value |
|---|---|
| β | 0.5 |

|
|

|
|

|
|

|
|

|

|

|

|
aRef. 19
Intercalation-induced stress model
The constitutive equation between stress and strain, including the effect of intercalation-induced stress by the analogy to thermal stress, is

where  are strain components,
  are stress components,
  is Young's modulus, ν is Poisson's ratio,
  is the concentration change of the diffusion species (lithium ion) from the original (stress-free) value, and Ω is the partial molar volume of lithium.16 Stress components are subjected to the force equilibrium equation
A Young's modulus  and a partial molar volume
  16 are assumed here. Equations 2, 8 are coupled through concentration
  and stress
  .
.
Heat generation model
There are four sources of heat generation inside lithium-ion batteries during operation1

The first term,  , is the irreversible resistive heating, where
  is the current of the cell,
  is the cell potential, and
  is the volume averaged OCP. Resistive heating is caused by the deviation of the cell potential from its equilibrium potential by resistance to the passage of current. The second term,
  , is the reversible entropic heat, where
  is temperature. The third term,
  , is the heat change of chemical side reactions, where
  is the enthalpy of reaction for chemical reaction
  , and
, and  is the rate of reaction
  . The fourth term,
  , is the heat of mixing due to the generation and relaxation of concentration gradients, where
  is the concentration of species
  in phase
  ,
,  is the differential volume element, and
  and
and  are partial molar enthalpy of species
  in phase
  and the averaged partial molar enthalpy, respectively.
The charge/discharge current  is obtained by the integration of current density
  (determined by electrochemical kinetics as shown in Eq. 4) over the particle surface. The potential of solid electrode
  equals the applied potential, as in Eq. 7. The volume averaged OCP
  is determined by using the volume-averaged state of charge and the experimental results of OCP, as shown in Fig. 1a.
  is measured concentration and is thus dependent on the state of charge. Experimental results of
  for
for  in Ref. 20 are used here. The experimental results of
  from Ref. 20 are fitted by a smoothing spline method (Matlab), used commonly to characterize data with a high degree of noise.36 Fit statistics for these data are
  and
and  , and with the fitted curve shown in Fig. 2a.
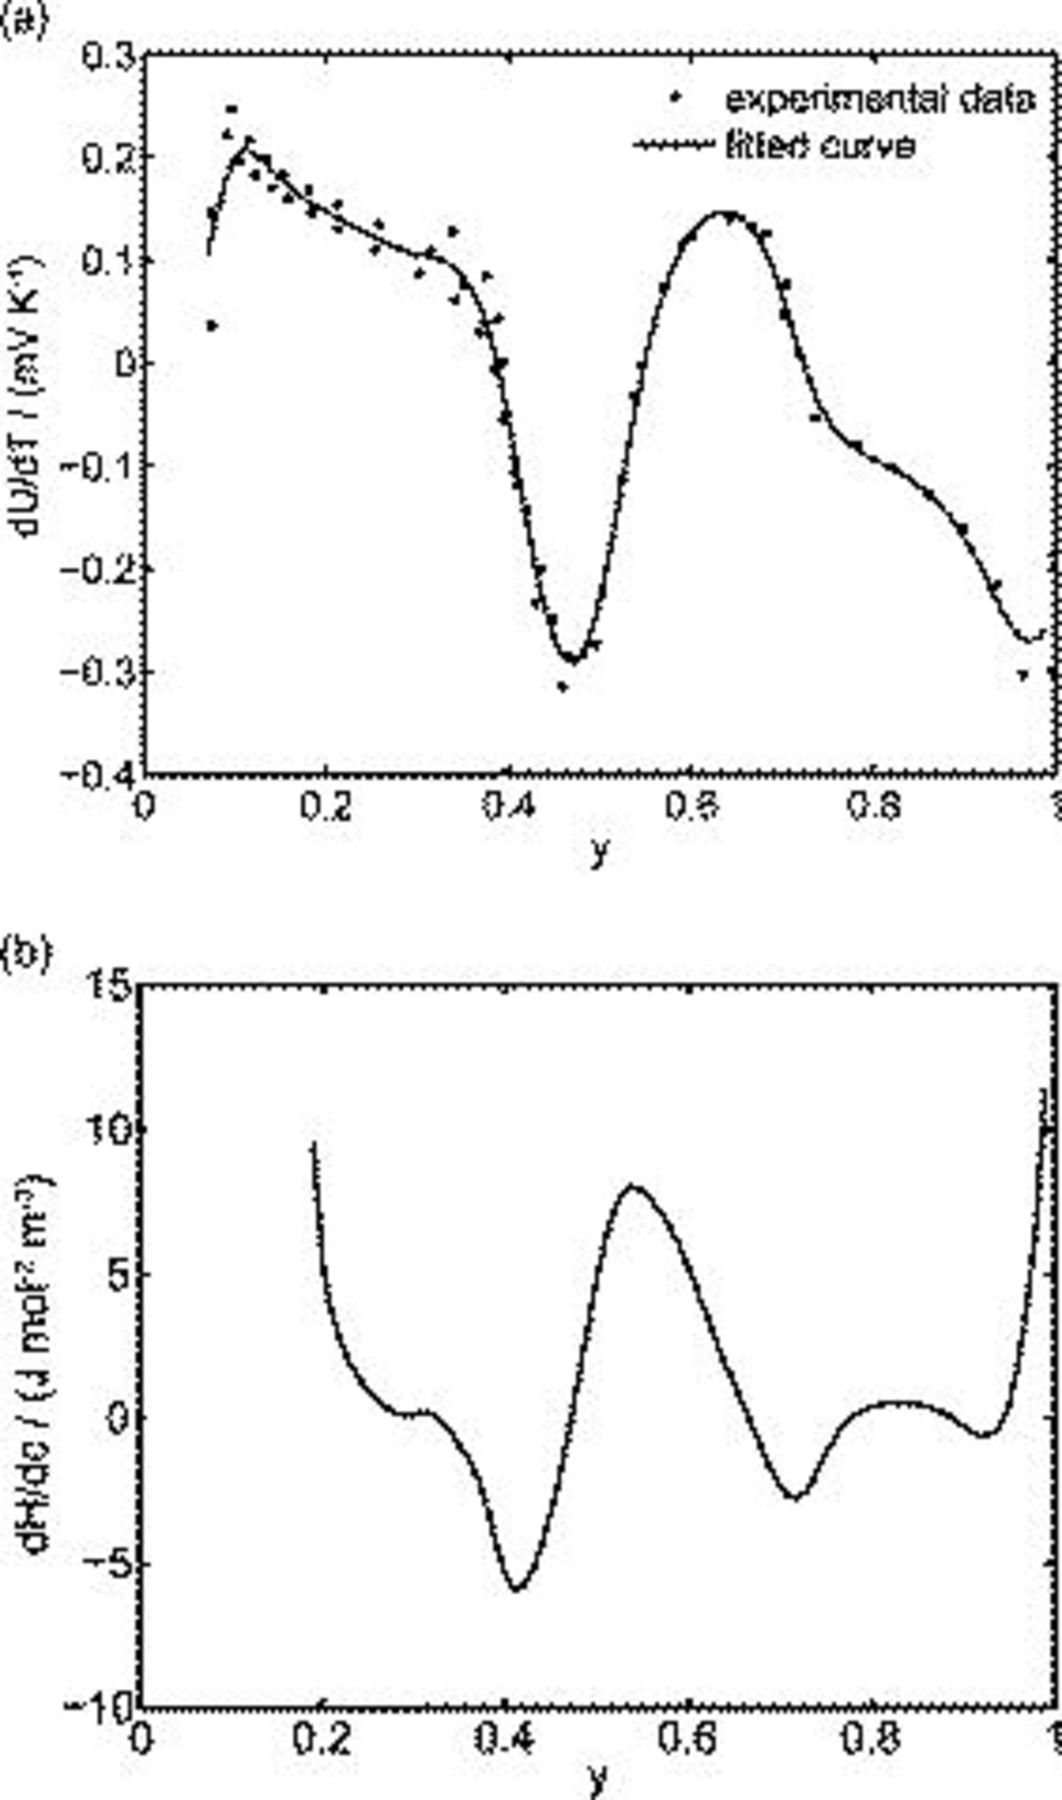
Figure 2. Material properties: (a) The derivative of OCP over temperature  : curve fitting of the measured data from Ref. 20 and (b) the derivative of partial molar enthalpy over concentration obtained by
  based on the curve fit in (a).
The term  in Eq. 10 is neglected because of the assumption of no side reactions. The heat of mixing term is simplified as1

by assuming that  the volume change effect can be neglected such that the temporal derivative can be taken outside the integral and
  the particle is in contact with a thermal reservoir such that temperature is constant.1 Equation 11 suggests that heat of mixing vanishes when the concentration gradient relaxes. In Eq. 11,
 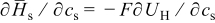 where
where  is enthalpy potential. The term
  is obtained by numerical differentiation of enthalpy potential
  over concentration. First,
  is calculated according to
  by taking
  and the curve fitting results in Fig. 2a. Then,
  is numerically differentiated over concentration and multiplied by
  to obtain
  , plotted in Fig. 2b.
Spherical particle simulation results
The intercalation, stress, and heat generation models described above were implemented on spherical particles with radius  using the simulation tool COMSOL Multiphysics. A potential sweep rate of
  was selected, giving a discharge/charge rate of
  , falling in the range of typical rates for high-power applications of lithium-ion batteries.
Intercalation-induced stress inside spherical particles
The simulation results of reaction flux and stresses are shown in Fig. 3. Figure 3a shows the diffusion flux, determined by electrochemical kinetics, on the particle surface during one cycle of voltammetry. It is positive in the first half cycle (as lithium ions are extracted from the cathode during charge) and negative in the second half cycle (as lithium ions are inserted into the cathode during discharge). This is a similar trend to those from simulations19 and experiments.18 The first principal stress (radial stress) is largest at the center of the particle, and the von Mises stress is largest on the particle surface. Figure 3b shows that radial stress at the center of the particle is negative (compressive) in the first half cycle and positive (tensile) in the second half cycle. In the first half cycle, lithium ions are extracted so that the lattice contracts in the outer region of the particle. Therefore, the radial stress is compressive at the center of the particle. In the second half, lithium ions are inserted so that the lattice expands in the outer region of the particle. Therefore, the radial stress is tensile at the center of the particle in this half cycle. Figure 3c shows the time history of von Mises stress on the particle surface. The flux and stress of charge and discharge half cycles are symmetric. This is because the symmetric applied potential dominates over simulation parameters for these conditions. The distribution of flux and stress may be asymmetric when other parameters, such as potential sweep rate and symmetry factor, are dominant.
Figure 3. Simulation results of a spherical particle with  ,
,  : (a) Diffusion flux on the particle surface, (b) radial stress at the center of the particle, and (c) von Mises stress on the particle surface.
Figures 3a, 3b and 3c show that two peaks in species flux and stress time history arise in each half cycle. To determine the origin of these peaks, a detailed study of the first half cycle was conducted. The time history of diffusion flux and von Mises stress on the surface in the charge half cycle are replotted in Fig. 4a and 4b. As shown in Fig. 4a, two peaks of surface flux occur at  and
and  , respectively. By the Butler–Volmer equation for electrochemical kinetics on particle surface (Eq. 4), surface flux depends on surface overpotential η and exchange current density
  . Surface overpotential η is the difference between the applied potential and the OCP as shown in Eq. 6, 7. The applied potential increases linearly with time in the charge half cycle of the potentiodynamic process, as illustrated in Fig. 1b. The OCP changes with the lithium content in the electrode, as shown in Fig. 1a. During the charging process, OCP increases as lithium concentration decreases. The difference between the two increasing potentials surface overpotential is shown in Fig. 4c. It is shown in Fig. 4c that there are two peaks in the surface overpotential plot mainly due to the two plateaus in the OCP in Fig. 1a. Because surface overpotential appears in the exponential terms in Eq. 4, it is the dominant factor for the resulting flux. Therefore, there are two peaks in the flux plot as shown in Fig. 4a. However, a closer look at the time instants for the peaks in Fig. 4a and 4c shows that the corresponding peaks appear at different times. This is attributable to the temporal distribution of exchange current density (as plotted in Fig. 4d) because the flux is actually the product of exchange current density and the exponential terms, including surface overpotential, as shown in Eq. 4. To summarize, the peaks in the flux distribution originate essentially from the two plateaus in the OCP distribution, which is an intrinsic property of the cathode material
  , and the temporal variation of the applied potential.
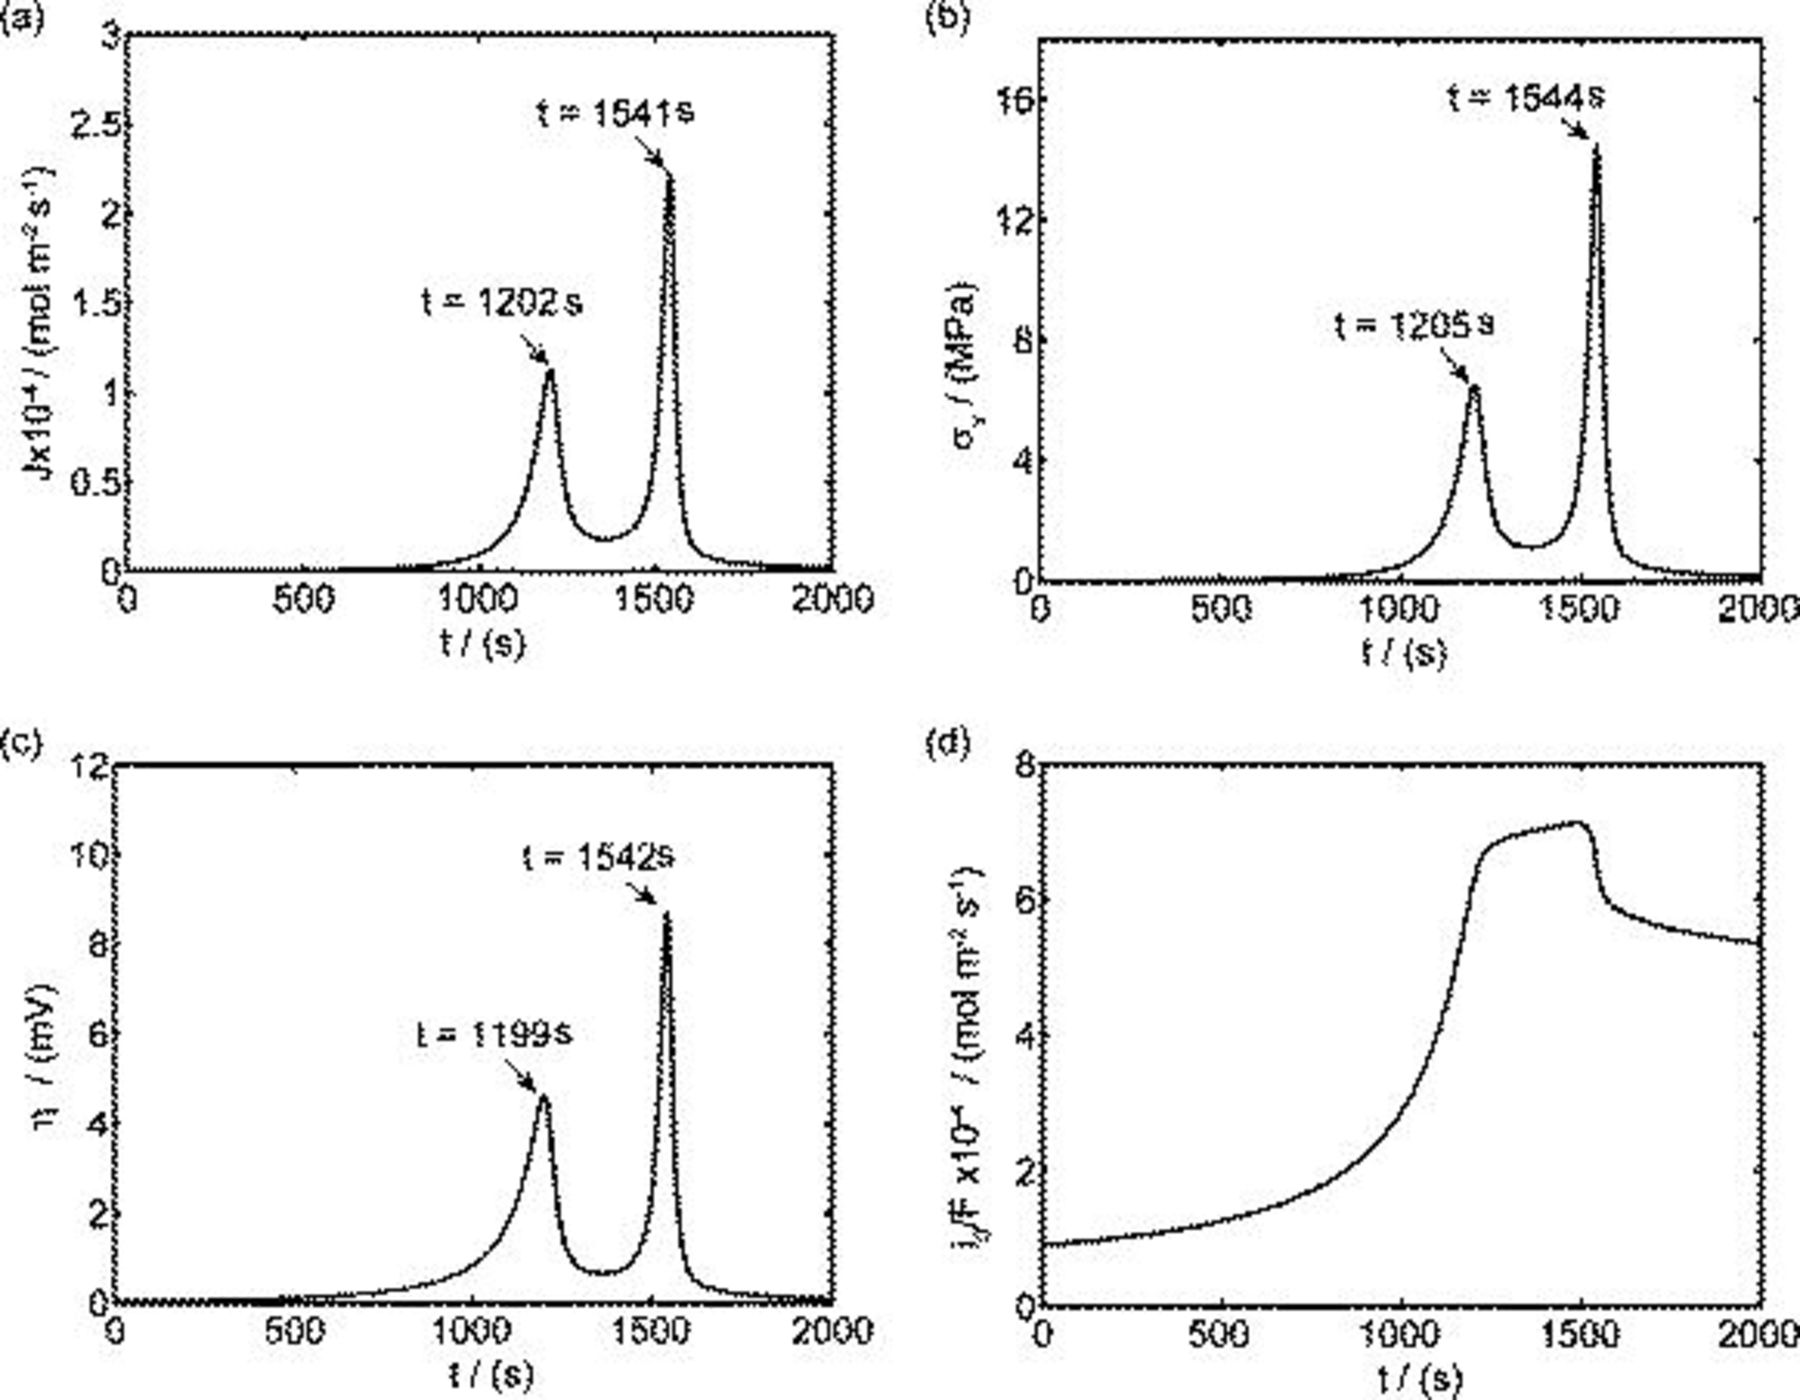
Figure 4. Simulation results of a spherical particle in the charge half cycle ( ,
,  ): (a) Reaction flux on the particle surface, (b) von Mises stress on the particle surface, (c) surface overpotential, and (d) exchange current density (divided by Faraday's constant).
To explain the peaks in the stress plot in Fig. 4b, we recall the expression of the von Mises stress on a spherical particle surface (von Mises stress has its maximum value on the particle surface  )16
)16

As shown in Eq. 12, the von Mises stress on the particle surface depends on the difference between the global average concentration  and the local concentration of lithium ions. Figure 5 shows the distribution of concentrations at different times during charge. It may be seen that the concentration is quite uniformly distributed, most of the time. At
  and
and  , significant gradients are present in the concentration distribution (due to the two peak fluxes shown in Fig. 4a); therefore, we expect a predominantly large stress at these times by Eq. 12, explaining the two peaks shown in Fig. 4b. By comparing Fig. 4a and 4b, we also see that the peaks in the stress plot are a few seconds later than the corresponding peaks in the flux plot. This is because it takes time for the concentration distribution to respond to the change of the boundary flux in the diffusion process. The peaks in the radial stress plot in Fig. 3b can be explained similarly, by considering the fact that radial stress depends on the difference between the global and local average of concentrations,16 the nonuniformity of the concentration distribution.
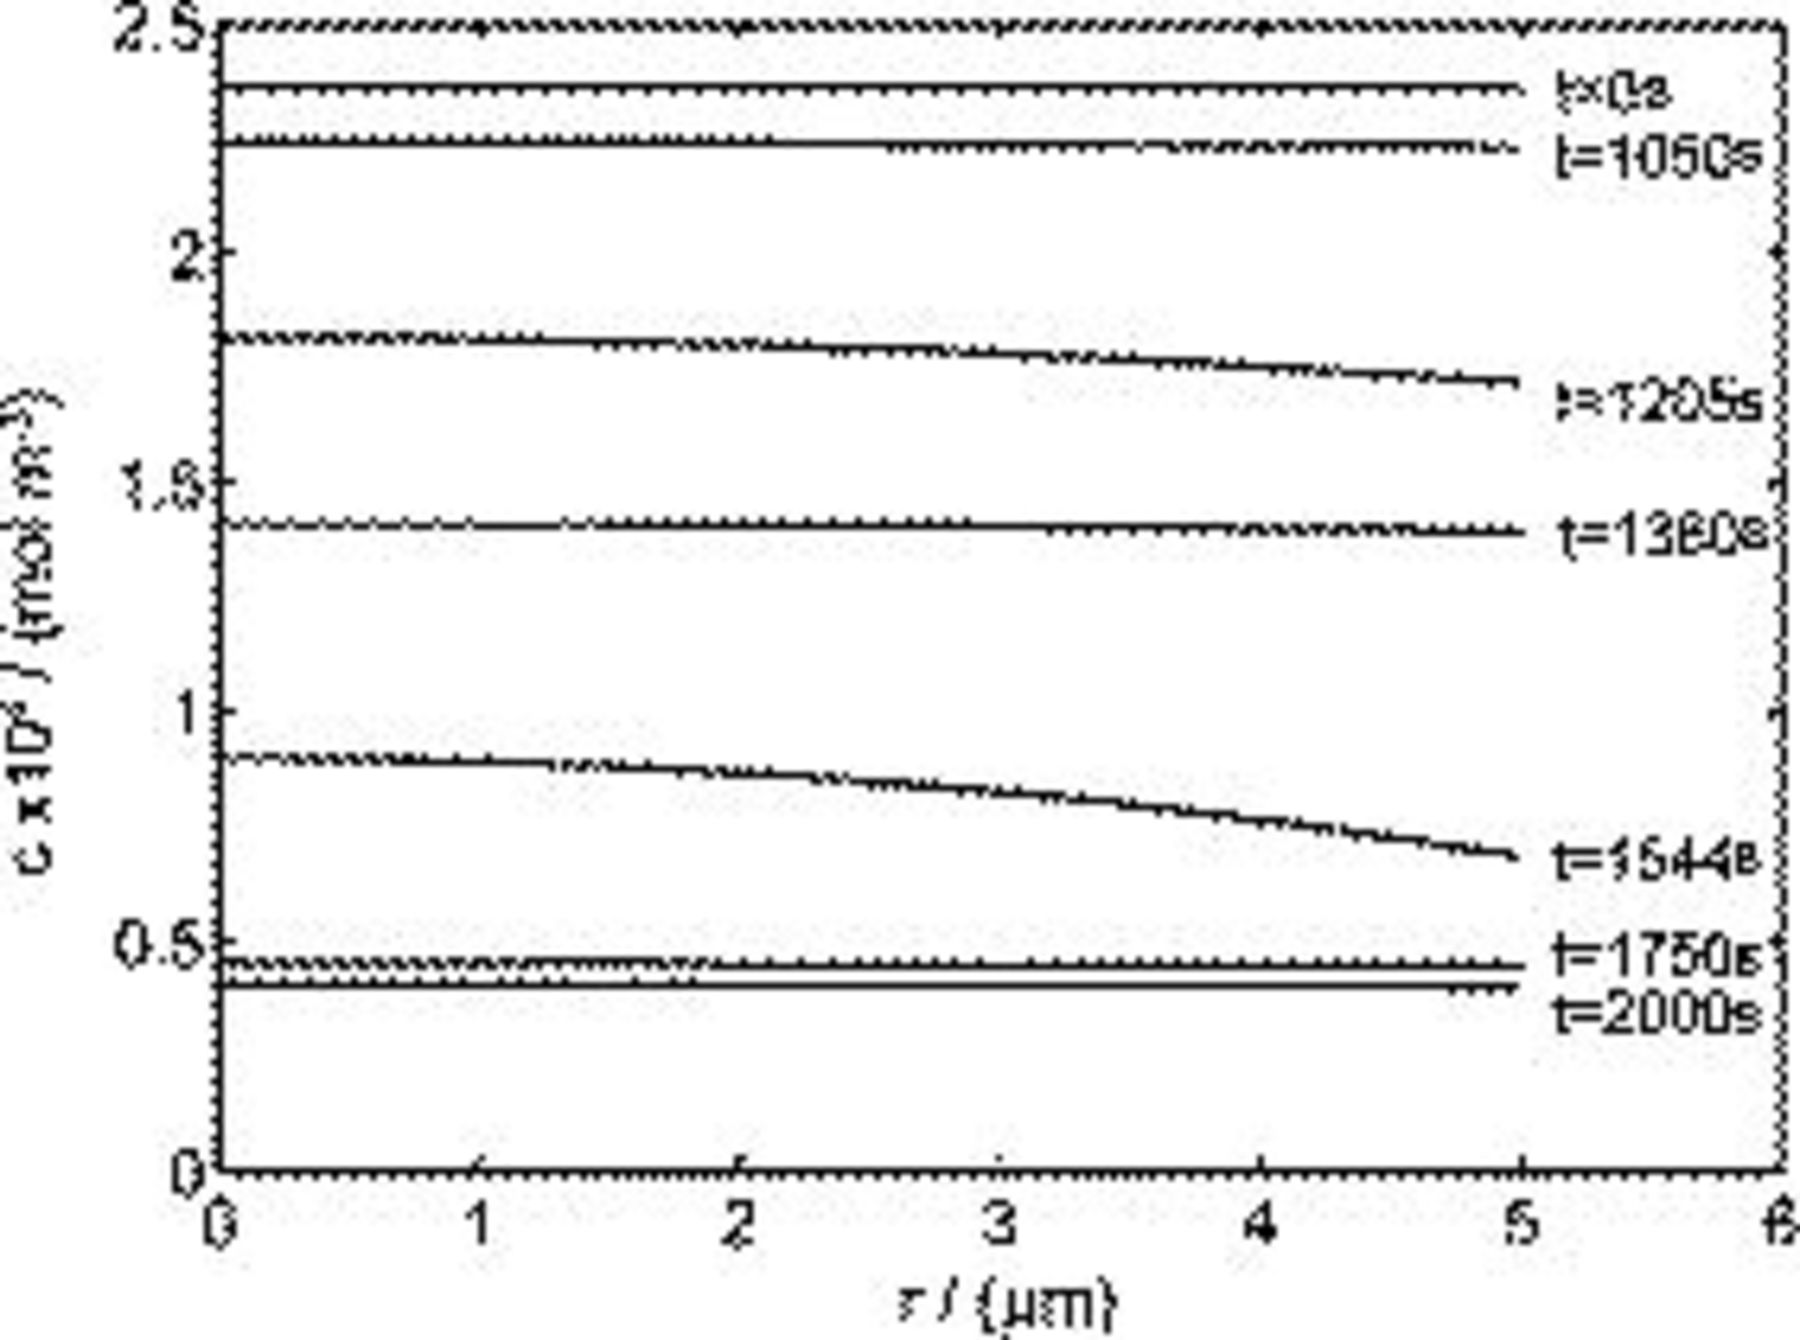
Figure 5. Distribution of lithium-ion concentration inside a spherical particle at different time instants during the charge half cycle.
The above analysis shows that surface flux, concentration, and stress are highly interrelated. Surface flux by electrochemical reaction and diffusion determine the concentration distribution, which, in turn, affects the OCP, the chemical kinetics, and thus, surface flux. Concentration distribution determines stress, the gradient of which in turn enhances the diffusion16 because of the effect of stress gradient on diffusion as shown in Eq. 1. The two peaks observed in the resulting flux and stress generation is attributable to the material property of  (two plateaus in the OCP) and the applied potential.
Intercalation-induced stress inside spherical particles under a higher rate of charge 

A single simulation was also conducted for a spherical particle under a very high charge rate,  . The spherical particle radius was
  , and the potential sweep rate was increased to
  . The time history of simulated surface reaction flux and von Mises stress on the particle surface is shown in Fig. 6.
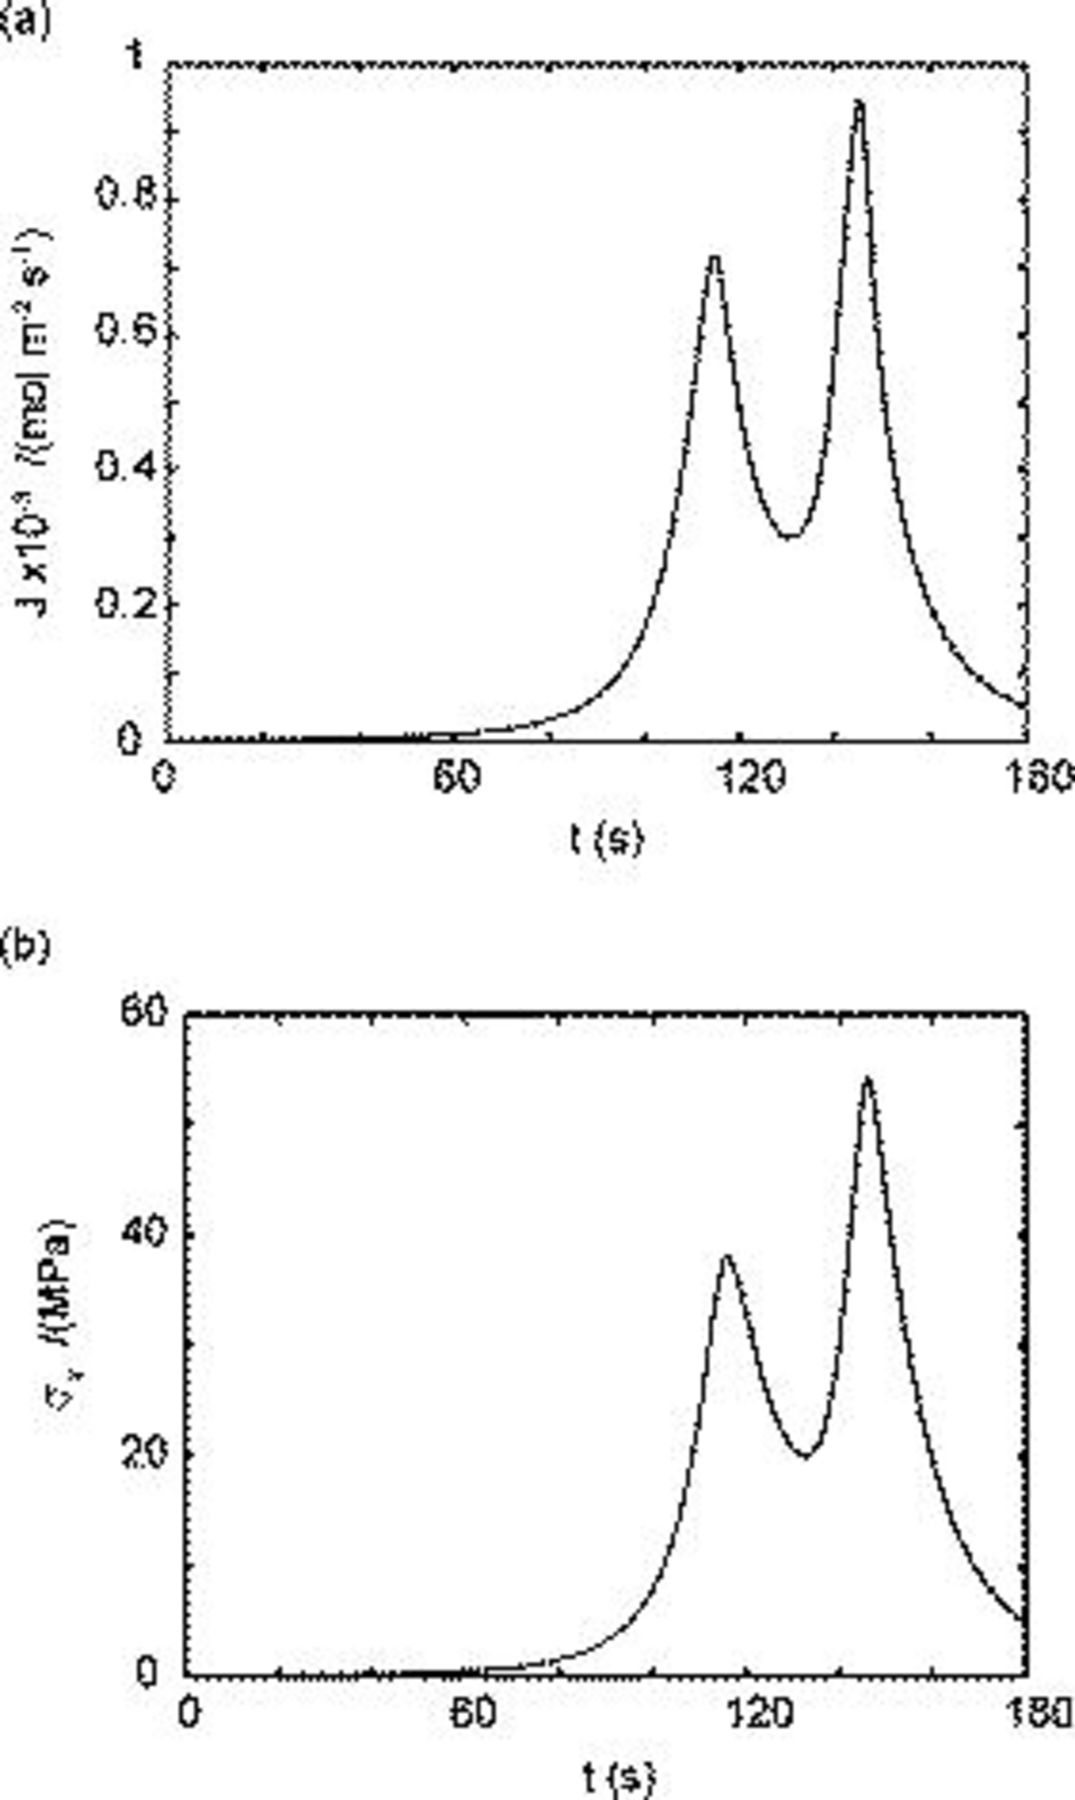
Figure 6. Simulation results of a spherical particle under  charge: (a) Reaction flux on the particle surface, and (b) von Mises stress on the particle surface.
For this faster charge rate, the patterns of flux and stress time history in Fig. 6 are different from those for  , as shown in Fig. 4, because the kinetics differ at the higher rate. Also, the peak value of surface reaction flux is
  , which is about five times larger than the peak flux of
  for
for  charge. Figure 6 also shows that the resulting stress (peak value) increases from 14.5 to
  when the charge rate increases from 1.8 to
  .
.
Heat generation inside spherical particles
The time history of each heat generation term in charge half cycle is shown in Fig. 7. The entropic heat and heat of mixing change signs during the charge half cycle, which is mainly attributable to the variation of material properties  and
and  from experiment measurements.
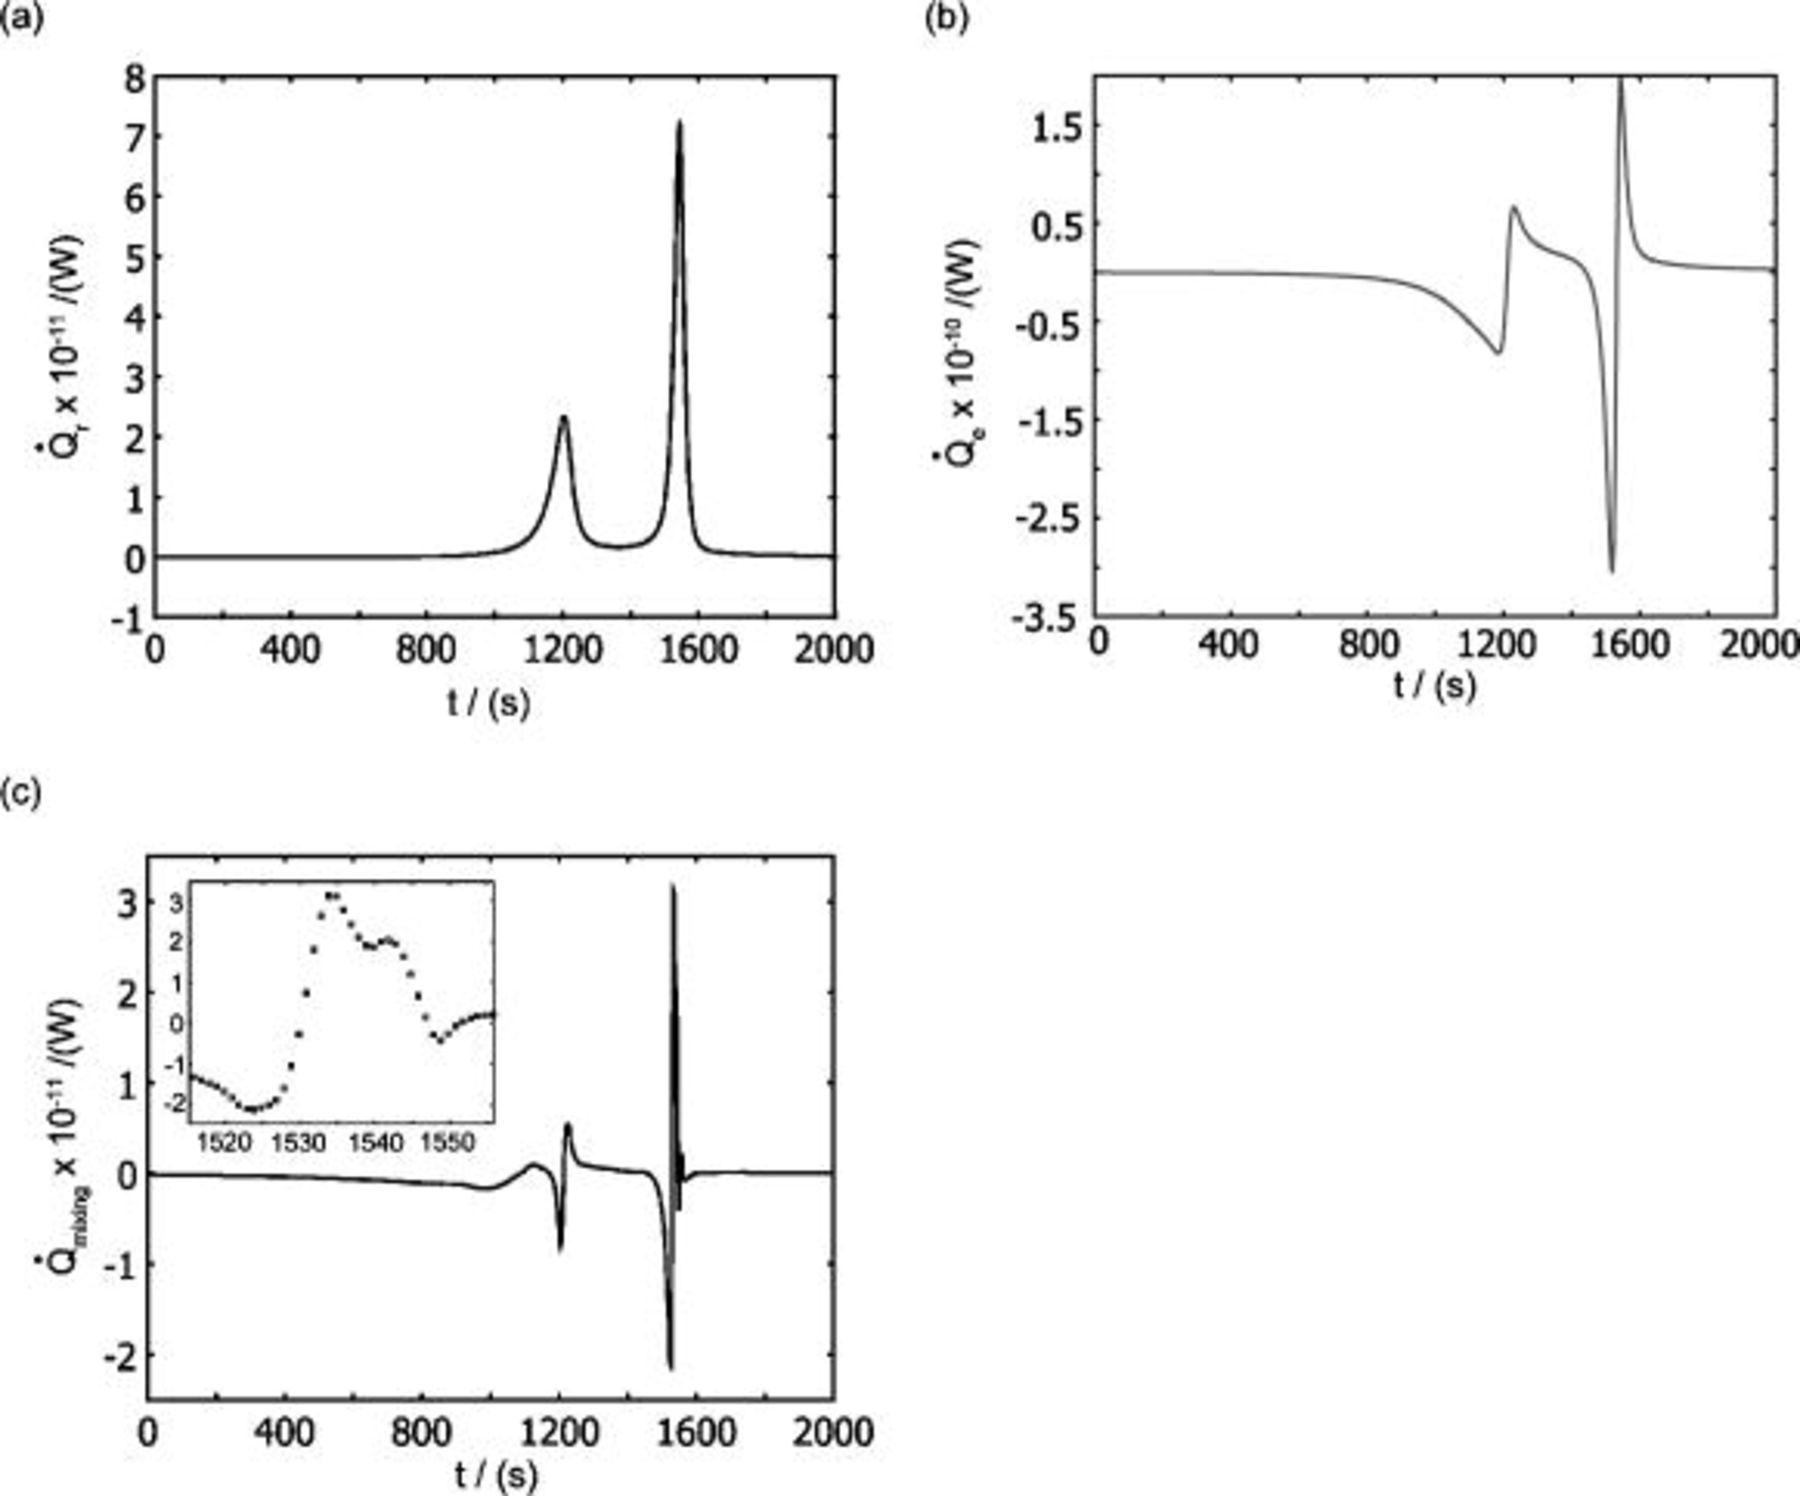
Figure 7. Simulation results of various heat generation sources during the charge half cycle: (a) Resistive heating, (b) entropic heating, and (c) heat of mixing.
Table III gives the time-averaged rate of each heat generation term during the charging process for two different potential sweep rates. The heat of mixing is negligible compared to resistive heat and entropic heat. Entropic heat is reversible; thus, the heat generation due to this term is expected to cancel out during the charge and discharge half cycles. Therefore, the only term of interest is the resistive heat. Furthermore, resistive heat increases when the charge half cycle gets faster, which is expected because the polarization is larger for higher charge rates.
Table III. Averaged heat generation rates during charge process.
| Case I | Case II | |
|---|---|---|
Potential sweep rate 
|

|

|
| Charge time |

|

|
| Heat of mixing |
|
|
| Resistive heating |
|
|
| Entropic heat |
|
|
Surrogate-Based Analysis of Ellipsoidal Particles under Different Cycling Rates
To understand how stress and heat generation behave with the particle geometric configuration and the operating condition, a surrogate-based analysis approach is used. Surrogate models, which are constructed using the available data generated from preselected designs, offer an effective way of evaluating geometrical and physical variables. The key steps of surrogate modeling include design of experiments, running numerical simulations (computer experiments), construction of surrogate models, validation, and further refinement, if necessary, of the models.37–39
The design of experiments is the sampling plan in the design variable space. There are several approaches available in the literature. The combination of face-centered composite design (FCCD)40 and Latin hypercube sampling (LHS)41 was used here. After obtaining the sampling points in the design variable space, numerical simulations (computer experiments) were run at selected training points to obtain the value of objective variables. With simulation results for the training points, surrogate models were constructed to approximate the objective functions. Surrogate models available include polynomial regression model, krigging modeling, and radial basis functions, among others.37 A second-order polynomial regression model was used in this study; the least-squares method was used to find the coefficients of the approximation. After constructing the response surface approximation, error estimations were necessary to validate the performance of the approximation. Common error measures used are root-mean-square (rms) error, prediction error sum of squares (PRESS), and (adjusted) coefficients of multiple determination  .42 The validated surrogate models were used for further analysis of the dependency between the objective functions and design variables to understand the underlying physics mechanisms.
Selection of variables and design of experiments
Three design variables were selected in this study. Considering the geometric illustration of an ellipsoidal particle (prolate spheroid) shown in Fig. 8, we set three semiaxis lengths as  . There were two independent variables required to define the geometry, equivalent particle radius
  and aspect ratio
  , which were selected as design variables. The third design variable was potential sweep rate
  . The range of the three design variables is shown in Table IV. A spherical particle of radius
  was used in the experimental work of Uchida et al. ,18 thus, the range of equivalent particle radii was selected as a 20% perturbation around
  . The aspect ratio range was selected based on the experimental observation of particle morphology by scanning electron microscope (SEM). The selected potential sweep rate gave a charge/discharge rate of
  , which falls into the range of high-power applications.
Figure 8. Geometric illustration of an ellipsoidal particle.
Table IV. Design variables and design space.
| Name | Expression | Range |
|---|---|---|
| Equivalent radius |

|
|
| Aspect ratio |

|

|
| Potential sweep rate |

|

|
The two objective functions chosen in this study were the peak value of the cyclically varying maximum von Mises stress  (in megapascal) and the time-averaged resistive heat generation rate
  (in picowatts). In fatigue analysis, the mean value of the cyclically varying stress affects the number of cycles allowed before failure as well as the peak value.43 In this study, numerical simulation results showed that mean stress and the peak value of the stress are highly correlated (the correlation coefficient is 0.992). Therefore, only the peak value of stress is considered as an objective function. Time-averaged resistive heat generation rate is the total resistive heat generation normalized by the overall charge half cycle time.
For the design of experiments, 20 points in total were selected in the design space defined in Table IV. Among these points, 15 of them are from FCCD and the remaining 5 points are from LHS. Numerical simulations were conducted on these 20 training points using the models described in the previous sections to obtain intercalation-induced stress and resistive heat.
Model construction and validation
To construct the surrogate model using the obtained simulation results on the 20 training points, a second-order polynomial response surface was selected here. The coefficients in the approximation were determined by minimizing the error of approximation at the training points in the least-squares senses. The approximations obtained for the two objective functions were


The statistics of the response surface approximation are listed in Table V. RMS error is the difference between the prediction and simulation values on the training points. Adjusted coefficients of multiple determination  are a measure of how well the approximation explains the variation of the objective functions caused by design variables. For a good fit, this coefficient should be close to one. PRESS is a cross-validation error. It is the summation of squares of all PRESS residues, each of which is calculated as the difference between the simulation by computer experiments and the prediction by the surrogate models constructed from the remaining sampling points excluding the point of interest itself.42 As shown in Table V, the normalized rms error and PRESS are small, and the adjusted coefficients of multiple determination
  is very close to 1. Therefore, the surrogate models constructed approximate the objective functions quite well.
Table V. Evaluation of the response surface approximations.
| Statistic name | Stress | Resistive heat |
|---|---|---|
| No. of training points | 20 | 20 |
| Minimum of data | 11.7 | 1.96 |
| Mean of data | 19.9 | 8.86 |
| Maximum of data | 27.5 | 23.6 |
| RMS error (normalized | 0.0368 | 0.0168 |

| 0.984 | 0.996 |
| PRESS (normalized | 0.0498 | 0.0356 |
bNote: RMS error and PRESS are both normalized by the range of the objective functions, that is, the difference between the maximum and the minimum of data.
To further validate the accuracy of constructed surrogate models, they were tested by comparing the predicted and simulated values from computer experiments, on four testing points different from the training points. The results of the comparison show that the differences between the prediction and simulation results are within 6%.
To summarize, the surrogate models constructed, Eq. 13, 14, not only explain the variation of objective functions resulting from design variables well, but also give a good prediction of the objective functions. Therefore, the obtained response surface approximations can be used with confidence to analyze dependencies among objective functions and design variables.
Analysis based on obtained surrogate models
These dependencies are shown in Fig. 9. We note that  intercalation-induced stress
  increases with both increasing equivalent radius
  and increasing potential sweep rate
  . However, intercalation-induced stress
  increases first and then decreases as aspect ratio α increases; and
  time-averaged resistive heat generation rate
  increases with both increasing equivalent radius
  and increasing potential sweep rate
  ; however, time-averaged resistive heat generation rate
  decreases as aspect ratio α increases. This surrogate-based analysis suggests that ellipsoidal particles with larger aspect ratios are superior to spherical particles in terms of improvement of the battery performance when stress and heat generation are the only limiting factors considered.
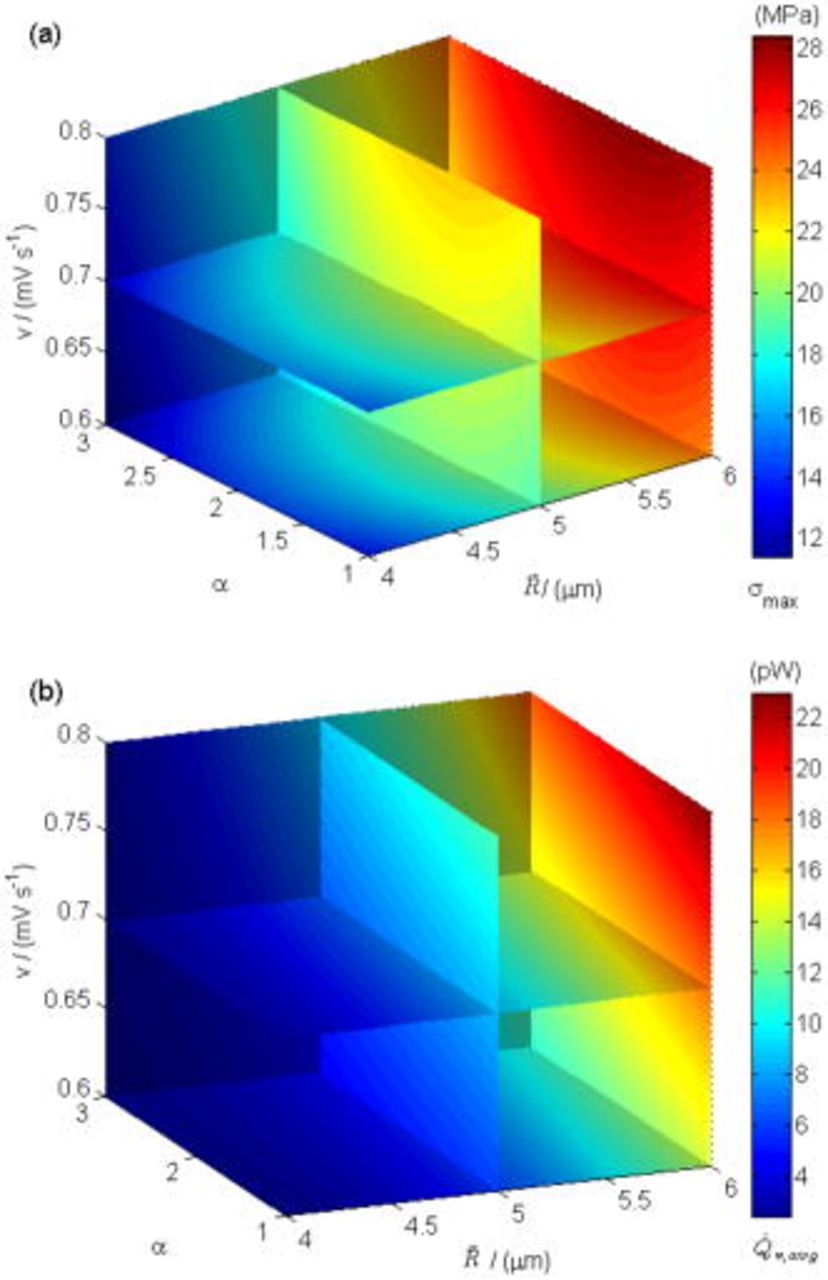
Figure 9. Dependency between objective functions and design variables: (a) Maximum von Mises stress  (in megapascal), and (b) time-averaged resistive heat rate
  (in picowatts).
As pointed out earlier, intercalation-induced stress depends on the concentration distribution. When equivalent radius  increases, the range of concentration distributions within the particle becomes wider because of the longer diffusion path. Therefore, the intercalation-induced stress increases as equivalent radius
  increases. When potential sweep rate
  increases, the electrochemical reaction rate driven by the surface overpotential becomes faster, which results in large flux on the particle surface boundary. Therefore, one expects a larger concentration gradient inside the particle and larger intercalation-induced stress for larger potential sweep rate
  . When aspect ratio α increases, there are two competing effects: the shorter semiaxis length
  and
and  decrease and the longer semiaxis length
  increases. The increase of the longer semiaxis leads to stress increase, and the decrease of the shorter semiaxis leads to stress decrease. Therefore, intercalation-induced stress increases first and then decreases as aspect ratio increases.
As shown in Eq. 10, resistive heat rate is the product of current and overpotential (or polarization), and the time-averaged heat generation rate over the charge half cycle is
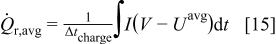
As the equivalent radius increases, the surface area subjected to reaction is larger, which results in larger total current. Therefore, the averaged resistive heat generation rate increases. When the potential sweep rate increases, the electrochemical reaction on the surface is driven faster, which results in larger polarization, or overpotential. Therefore, the averaged resistive heat generation rate increases even though the time duration for the charge half cycle decreases. When aspect ratio increases, the shorter semiaxis length decreases, which results in the decrease of average polarization or overpotential due to the shorter average diffusion path. Therefore, averaged resistive heat generation rate decreases.
Global sensitivity analysis, which is often used to study the importance of design variables, was conducted to quantify the variation of the objective functions caused by three design variables. The importance of design variables is presented by a set of indices, main factor and total effect.37 Main factor is the fraction of the total variance of the objective function contributed by a particular variable in isolation, while the total effect includes contribution of all partial variances in which the variable of interest involved (basically by considering those interaction terms in the response surface approximation as shown in Eq. 13, 14). The results of calculated total effect are listed in Table VI. It can be seen that equivalent particle radius contributes the most, for the design space range selected in Table IV, to the variation of the two objective functions, intercalation-induced stress and resistive heat (85 and 87% of total variation respectively).
Table VI. Global sensitivity indices (total effect) for stress and resistive heat.
| Variable | For stress | For resistive heat |
|---|---|---|
Equivalent radius 
| 0.851 | 0.873 |
| Aspect ratio α | 0.082 | 0.023 |
Potential sweep rate 
| 0.069 | 0.128 |
Assumption of a Uniform Electric Potential
In the current model, electric potential inside the particle is assumed to be uniform, though potential varies in a battery electrode particle due to electric current flow within the particle. From a modeling standpoint, the most important value to accurately estimate is the electric potential on the particle surface because this value determines the electrochemical reaction rate via the Butler–Volmer equation. The simulation presented in this paper follows an earlier microelectrode experimental work, where an electric potential is applied through a filament in contact with a cathode particle.18
The potential distribution inside the particle could have been obtained numerically in our model by solving Poisson's equation. Experimentally,18 potential was measured at a single point, but it is impractical to set up a similar boundary condition for the electric potential numerically because the applied potential is applied, ideally, at a single point. To evaluate the significance of potential variation on the particle surface to the intercalation process, we use a prescribed potential variation in the numerical simulation to investigate the significance of this variation.
The resistivity of  is about
  .44 The peak value measured current drawn from a
  (radius) particle under
  discharge is on the order of
  .18 The electric potential variation inside a
  (radius) particle under
  discharge is on the order of
  , which is comparable to the surface overpotential obtained (Fig. 4). To evaluate the importance of this potential variation, we apply a prescribed electric potential to a
  (radius) particle. Figure 10a shows the distribution of the potential at time instant
  . The prescribed spatial potential variation follows the equation
  , where
  (in microns) is the radius of the particle. Potentiodynamic control in this case has applied potential varying linearly with time.
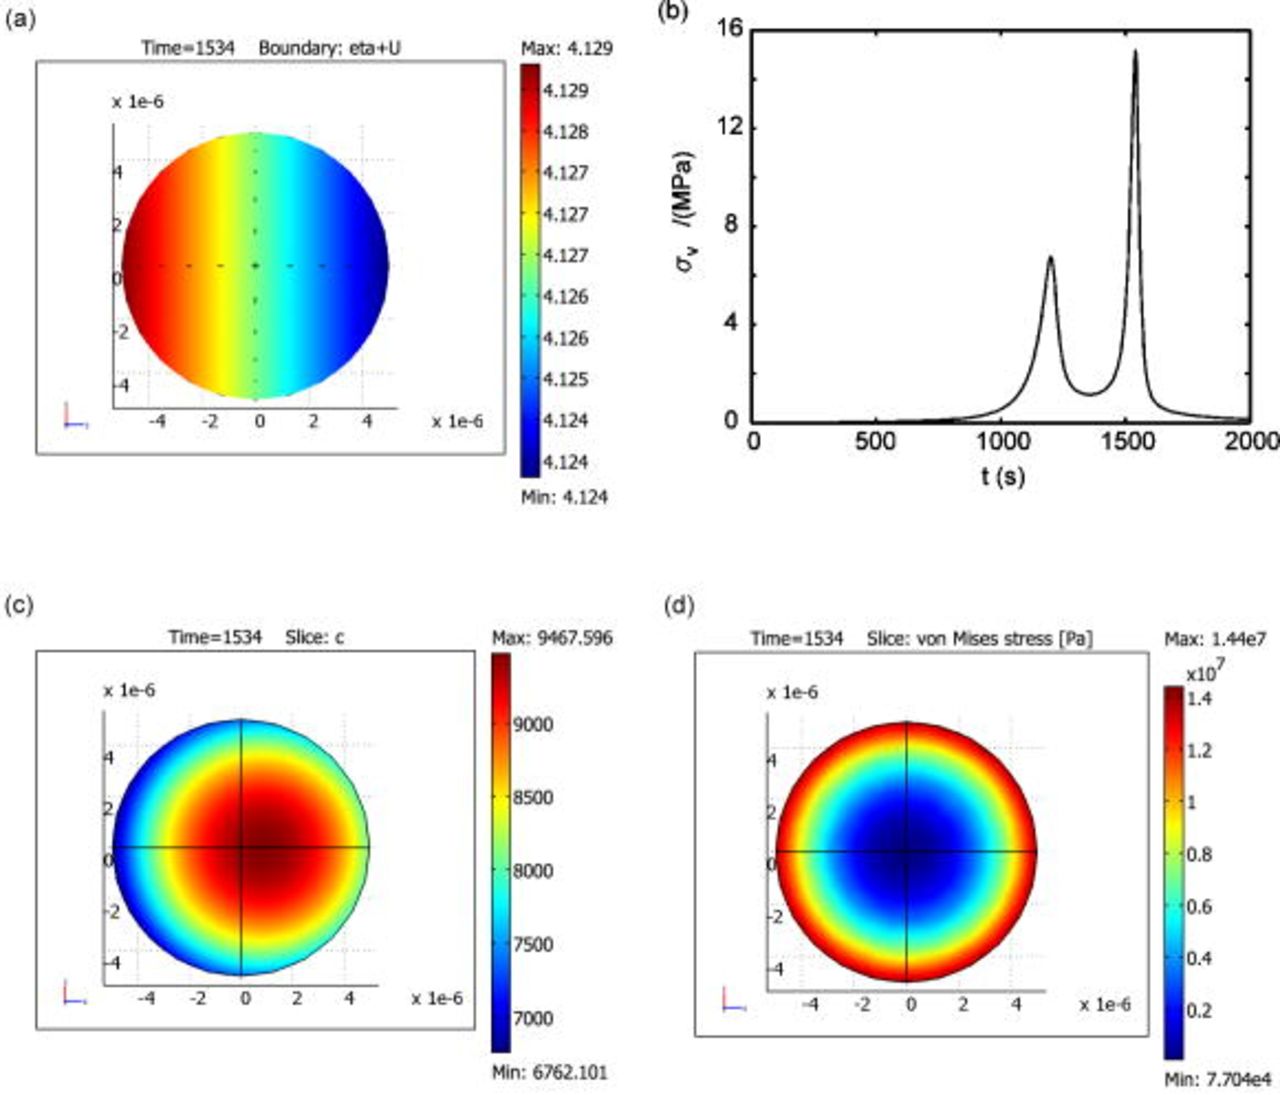
Figure 10. Simulation with a predescribed potential variation: (a) Potential variation on particle surface at  , (b) time history of von Mises stress on particle surface, (c) concentration distribution inside the particle at
  , and (d) von Mises stress distribution inside the particle at
  .
.
Figures 10b, 10c and 10d show the simulation results of this case. The time history of von Mises (Fig. 10b) follows the same trend, when the potential is assumed to be uniform. The variation of electric potential results in a nonuniform distribution of surface overpotential and surface reaction flux, which, in turn, results in a shift in the concentration distribution as shown in Fig. 10c. However, the distribution pattern of von Mises stress is not altered; it remains axisymmetric as shown in Fig. 10d. The time instant of  is selected to present the results because this is the instant when von Mises stress reaches the temporal maximum value.
To sum up, although the variation of electric potential shifts the concentration distribution, it does not change von Mises stress distribution pattern. For simplicity and due to lack of more detailed empirical guideline, we assume that the electric potential is uniform inside the particle. Our finding does offer scientific insight into the interplay between stress and heat generation, particle geometry (aspect ratio and equivalent size), and potential sweep rate.
Conclusions
Intercalation-induced stress and heat generation inside Li-ion battery cathode  particles under potentiodynamic control were simulated. It was found that Li-ion concentration, surface flux, and intercalation-induced stress are highly correlated through the diffusion process, electrochemical kinetics, and the intercalation-induced lattice expansion. The two peaks observed in the flux and stress generation plots were attributable to intrinsic material properties (two plateaus in the OCP) and the applied potential. Three major heat generation sources, resistive heating, heat of mixing, and entropic heat, were analyzed. The heat of mixing was found to be negligible (two orders of magnitude smaller than the other two sources), and resistive heat was identified as the heating source of greatest importance.
The surrogate-based analysis approach was used to study the relationship among the two objective functions (intercalation-induced stress and resistive heat) and the selected design variables (particle morphology and the operating condition). It was shown that both intercalation-induced stress and time-averaged resistive heat generation rate increase with increasing equivalent particle radius and potential sweep rate; intercalation-induced stress increases first, then decreases, as the aspect ratio of an ellipsoidal particle increases, while averaged resistive heat generation rate decreases as aspect ratio increases. A sensitivity analysis was conducted to rank the importance of each design variable on the stress and heat generation. It was shown that particle equivalent radius contributes the most to both stress and heat generation for the design space range considered in this study (85 and 87% of the total variation, respectively). The observed variation trend from this systematic numerical study may also be explained from fundamental principles: intercalation-induced stress depends on the Li-ion concentration distribution and the resistive heat depends on a combination of total charge current and polarization (overpotential). The surrogate-based analysis conducted suggests that ellipsoidal particles with larger aspect ratios are preferred over spherical particles, in improving battery performance when stress and heat generation are the only factors considered.
The proposed models in this paper are only valid for purely active material  without inclusions. The obtained results are fundamental, but for homogeneous particles. The general methodology of surrogate-based analysis presented in this paper is extendable to consider more variables and geometries, such as more complicated geometric representation (aggregates) and applied potential profiles controlled by more parameters, or larger scales. For future work, we will extend the models developed here at the particle scale to the whole cell scale with a volume-averaging technique,45–47 in which a multiscale modeling methodology48 will be applied to pass the information obtained on the microscopic scale to the macroscale.
Acknowledgments
The surrogate modeling approach presented in this paper is supported by NASA under the Constellation University Institute Program (CUIP) (Claudia Meyer, program monitor). The electrochemical modeling in this work is supported by the U.S. Department of Energy through the BATT program (Dr. Tien Duong, program manager) and by the Ford Motor Company (Ted Miller and Kent Snyder, program managers). We also acknowledge our collaborators G. Liu, X.-Y. Song, and V. S. Battaglia, from Lawrence Berkeley National Laboratory, for providing SEM images of cathode particles, which were used to estimate aspect ratios.
University of Michigan assisted in meeting the publication costs of this article.
List of Symbols

| lengths of the three semi-axes of ellipsoid, 
|

| concentration of lithium ions, 
|

| concentration change from initial value, 
|

| lithium diffusion coefficient, 
|

| Young's modulus, GPa |

| Faraday's constant, 
|

| enthalpy of reaction. 
|

| partial molar enthalpy, 
|

| current of cell, A |

| current density vector (scalar), 
|

| exchange current density, 
|

| species flux vector (scalar), 
|

| reaction constant, 
|

| heat generation rate, W |

| gas constant, 
|

| equivalent radius of ellipsoidal particles, 
|

| adjusted coefficient of multiple determination |

| particle radius, 
|

| rate of reaction  , , 
|

| temperature, K |

| time, s |

| open circuit potential, V |

| enthalpy potential, V |

| potential of solid phase, V |

| potential sweep rate, 
|

| spatial coordinate, 
|

| state of charge |
Greek symbols
| α | aspect ratio |
| β | symmetry factor |

| strain |
| η | surface overpotential, V |
| ν | Poisson's ration |

| stress, Pa |
| Ω | partial molar volume, 
|
Subscripts
| 0 | exchange current density  , particle radius , particle radius  , initial concentration , initial concentration 
|
| avg | time-averaged (heat generation rate) |
| e | entropic heat |
| g | heat generation |
| h | hydrostatic (stress) |
| i,j | index for tensor elements or index of species |
| k | index for a chemical reaction |
| l | concentration of Li-ion in the electrolyte |
| max | maximum |
| mixing | heat of mixing |
| r | resistive heating |
| rad | radial direction |
| s | concentration of Li-ion in the solid phase |
| tang | tangential direction |
| v | von Mises stress |
| θ | concentration of available vacant sites |
Superscripts
| avg | average over volume |