
Abstract
Solid-solution behavior in the  system was investigated using X-ray powder diffraction. A substantial dependence upon crystal size and morphology was observed. Partially delithiated samples of
  hydrothermally synthesized olivine-type
  crystals containing only the two end-member phases were heated to form single-phase solid solutions. In samples with
  , a line phase with composition
 appeared as an intermediate during the transformation of the two-phase mixtures to single-phase
  . This phase then precipitated during cooling along with
  and persisted at ambient temperature. Transmission electron microscopy indicated that upon cooling, phase separation occurred within the crystals along the
  direction (space group Pnma), with
  forming at the (010) surfaces. More complex behavior was found for samples with
  and for crystals of smaller dimensions.
Export citation and abstract BibTeX RIS
Lithium iron phosphate,  , with a phospho-olivine structure, has become an important cathode material for rechargeable lithium batteries. Because it is made from abundant and inexpensive elements, is environmentally friendly, and has excellent thermal stability, it is expected that it will be used in large-scale battery applications. The theoretical capacity of
  can be utilized with a nearly flat cell voltage of about
  vs
vs  . The reaction proceeds via a first-order phase transition in which
  is converted to
  .1 As both
  and
and  have poor electronic and ionic conductivities,2, 3 the existence of room-temperature solid-solution phases with small Li nonstoichiometry during the phase transition has been proposed to explain the surprisingly facile reaction.4, 5 Yamada et al.6 recently reported the detection of mixed-valent intermediate phases,
 and
and 
 , outside the room-temperature miscibility gap and proposed that improvements in rate capability could be achieved by increasing α and/or
  . Isolation and characterization of the pure-ambient-temperature solid solutions has not yet been achieved.
The transformation of two-phase mixtures of  and
and  to single-phase
  solid solutions at elevated temperatures was recently reported by Delacourt et al.7, 8 and by Dodd et al.9, 10 Although the phase diagrams from these two studies differ in some details, they establish the existence of solid-solution phases at all values of
  , with
  being stable at the lowest temperature (150–200°C) and appearing as an intermediate during cooling. Refinement of room-temperature diffraction patterns of quenched samples containing this phase shows that it is disordered, with shorter average
  bonds and longer average
  lengths (M1 refers to Li when present and to the center of the Li site when it is vacant).8
We recently studied the  phase-transition mechanism in hydrothermally synthesized crystals with a characteristic shape and uniform size distribution.11 The use of such high-quality crystals allows us to study the behavior of the material at the crystallite level. When chemical agents are used to extract or insert lithium, the composition is relatively uniform among particles as compared to that of agglomerated materials with a wide crystallite size distribution. We report here an investigation of solid-solution formation upon heating and phase separation upon cooling of partially delithiated crystals.
Experimental
Hydrothermal synthesis
Discrete  crystals with a uniform size distribution were synthesized using the hydrothermal method described by Yang et al.12
  (99%, Aldrich) and
  (85%, J. T. Baker) were mixed in deoxygenated and deionized water, and
  (Spectrum) solution was added slowly to the mixture to give an overall
  ratio of 1:1:3. After stirring under nitrogen for about
  , the reaction mixture was transferred to a Parr reactor, which was purged by nitrogen and heated at 220°C for
  . On cooling to room temperature, the off-white precipitate was filtered, thoroughly washed with deionized water, and dried at 60°C under vacuum for
  . Delithiated crystals were obtained by stirring the
  in a solution of bromine in acetonitrile for
  , with the molar ratio adjusted to achieve the desired stoichiometry.
X-ray diffraction
X-ray diffraction (XRD) patterns were acquired in reflection mode using a Panalytical Xpert Pro diffractometer equipped with monochromatized  radiation. The scan rate was 0.0025°/s from 10 to 70°
  in 0.01° steps. The phase ratio in
  two-phase mixtures was determined from XRD data using Riqas Rietveld refinement software (MDI). Temperature-controlled XRD studies were performed under argon on the same diffractometer equipped with an Anton Parr HTK 1200 hot stage. The samples were heated at a rate of 5°C/min, and XRD patterns were recorded after holding at each temperature for
  , using a scan rate of 0.006°/s and a step size of 0.05°. The same procedure was used during the cooling process. Two-phase
  samples were also subjected to the same heating and cooling steps in a tube furnace under flowing argon, then studied at room temperature. Rietveld refinement of the XRD data was used to determine the phase composition of the samples, as well as the crystallographic parameters of the obtained phases.
Transmission electron microscopy
Transmission electron microscopy (TEM) and high-resolution transmission electron microscopy (HRTEM) experiments were carried out at the National Center for Electron Microscopy (NCEM) at LBNL, using a Philips CM200 field emission microscope operating at  . Samples for TEM were gently ground to decrease the size of the crystals and then dispersed in ethanol. The resulting dispersion was transferred to a holey carbon film fixed on a
  copper grid. Electron diffraction patterns were collected using the selected area electron diffraction (SAED) technique. Fourier transforms of the HRTEM images were carried out using DigitalMicrography software (Gatan Inc., v 3.3.1).
Results and Discussion
XRD phase analysis
Rietveld refinement of the XRD pattern obtained from hexagonal  crystals measuring
  along the
  ,
,  , and
, and  axes, respectively, gave unit cell parameters
  ,
,  ,
,  , and
, and  , in good agreement with the literature values.13 A series of crystal samples with lithium content
  of 0.14, 0.38, 0.50, 0.60, 0.65, 0.73, 0.77, and 0.85 were prepared by oxidation with stoichiometric amounts of bromine in acetonitrile. XRD patterns of these samples showed that the partially oxidized samples consisted of two-phase mixtures of the end members in the ratio
  . SAED studies showed that among crystals in a given sample, there was little variation in the phase ratio. The thermal behavior of these samples was studied either by in situ temperature-controlled XRD or by ex situ XRD after heating the samples to form solid-solution phases in a tube furnace and then cooling them to room temperature under argon. The XRD patterns for
  , 0.65, and 0.77 during heating and cooling are shown in Fig. 1. The peaks marked with an asterisk correspond to an unidentified impurity phase that does not participate in the formation or decomposition of solid-solution phases. In each case, significant structural changes occurred on heating to about 200°C, in accord with the reports of Delacourt et al. , Dodd et al. , and Ellis et al.14 As the peak intensities from
  and
and  decreased, a new set of peaks from a line phase,
  , emerged. Comparison of the XRD patterns at 200°C (Fig. 1d) indicated that this line phase was a common intermediate that appeared during heating with a constant composition but in increasing amounts until the initial quantity of
  was consumed. Thereafter, the solid-solution phase became more Li-rich as the remaining
  was absorbed. Based on the phase ratios obtained from XRD refinements and the known global Li content in the samples,
  was determined to be
  .
.
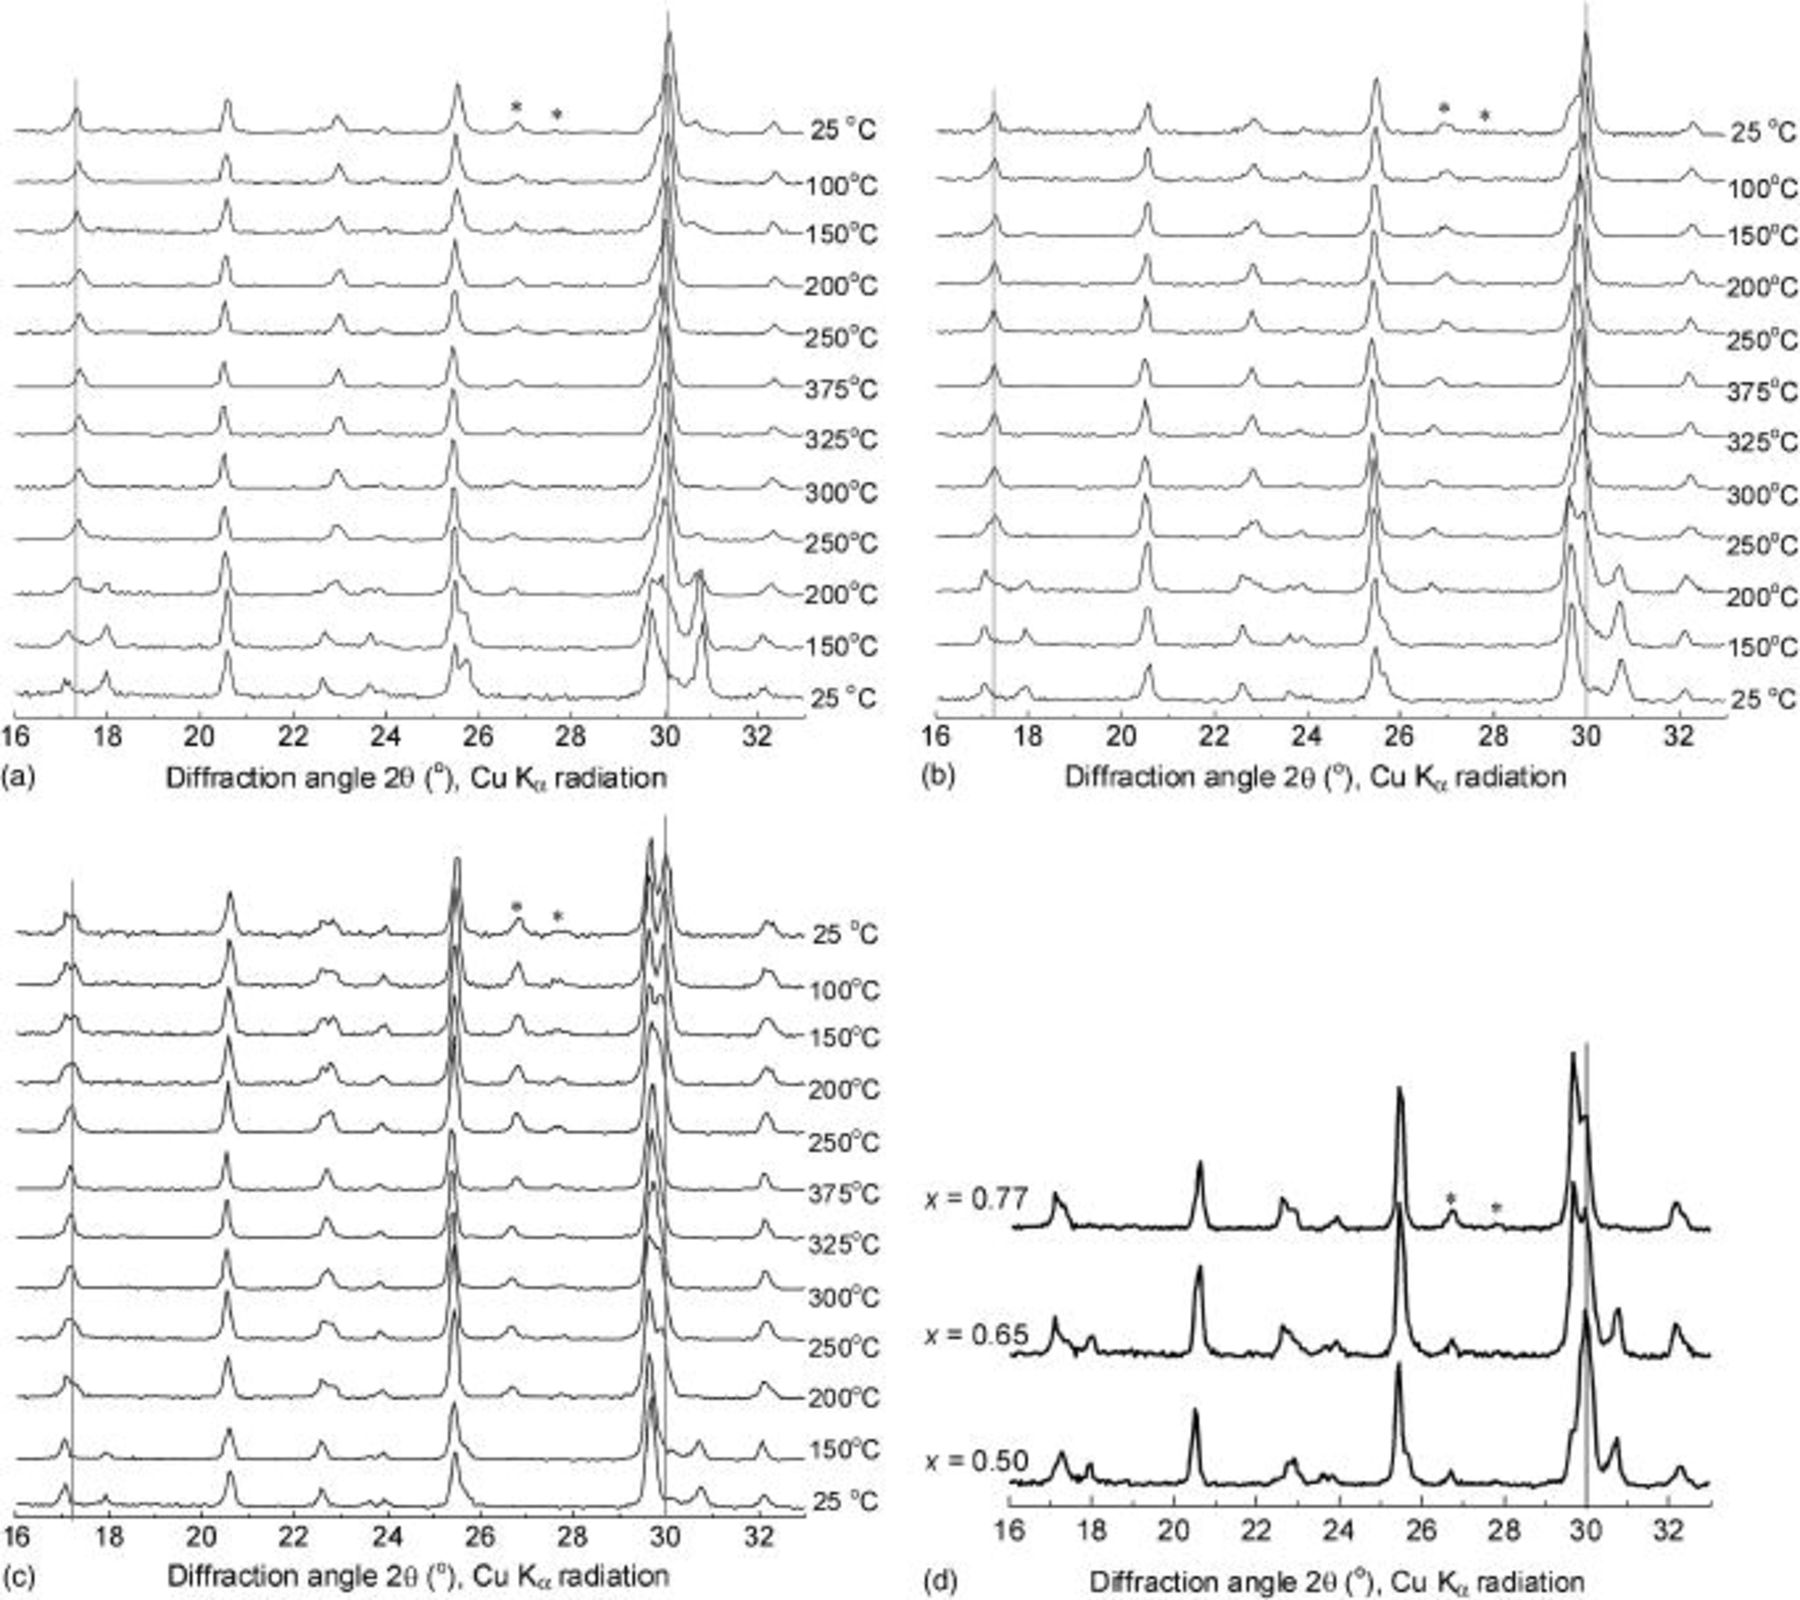
Figure 1. XRD patterns of  samples during heating and cooling: (a)
  , (b)
, (b)  , and (c)
  . Initial patterns are at the bottom. (d) Comparison of the three samples at 200°C during heating. Vertical lines indicate the positions of solid-solution 211/020 reflections.
In contrast to the earlier reports, we did not observe significant peak broadening during the transition. Delacourt et al. attributed the phenomenon to the presence of Li gradients within the crystal structure during the transformation of the two-phase mixture to the single-phase solid solution. In fact, this could result from nonuniform distribution of Li within the sample. For samples composed of aggregated particles with a wide primary size distribution, it is likely that some crystallites contain less lithium than others. This could result in local lithium contents below  , a regime in which we observed behavior different from that described here. Our use of uniform, discrete particles avoided wide variations in Li content and allowed us to detect the intermediate line phase during the transformation process.
The formation temperature of phase-pure solid solution was typically around 300°C, with a slight variation among the samples with different Li content. Upon cooling, phase separation was typically observed at around 150°C. For samples with  , the solid-solution phase disproportionated into a two-phase mixture of
  and the same intermediate phase,
  , that was observed during the heating process. The XRD patterns of the
  samples with
  , 0.73, 0.77, and 0.85 after cooling to room temperature are compared in Fig. 2a. The 211/020 peak intensities (which are nearly coincident for all phases) show the relative amounts of the two phases, which depend only on the global Li content. Refinement of the entire patterns gave 85% of the intermediate phase in the sample with
  , 67% for
  , 57% for
  , and 38% for
  . For samples with lithium content below 0.6 (Fig. 2b), cooling of the
  solid solutions produced more complicated mixtures.
  (83%) and
  (17%) were formed when
  . For
. For  , the product was 2%
  ,
,  , 43%
, 43%  , and 30% a new intermediate phase,
  . For
. For  , only two phases were present:
  and
and  . Refinement of the XRD patterns gave
  . This phase also exhibited room-temperature stability.
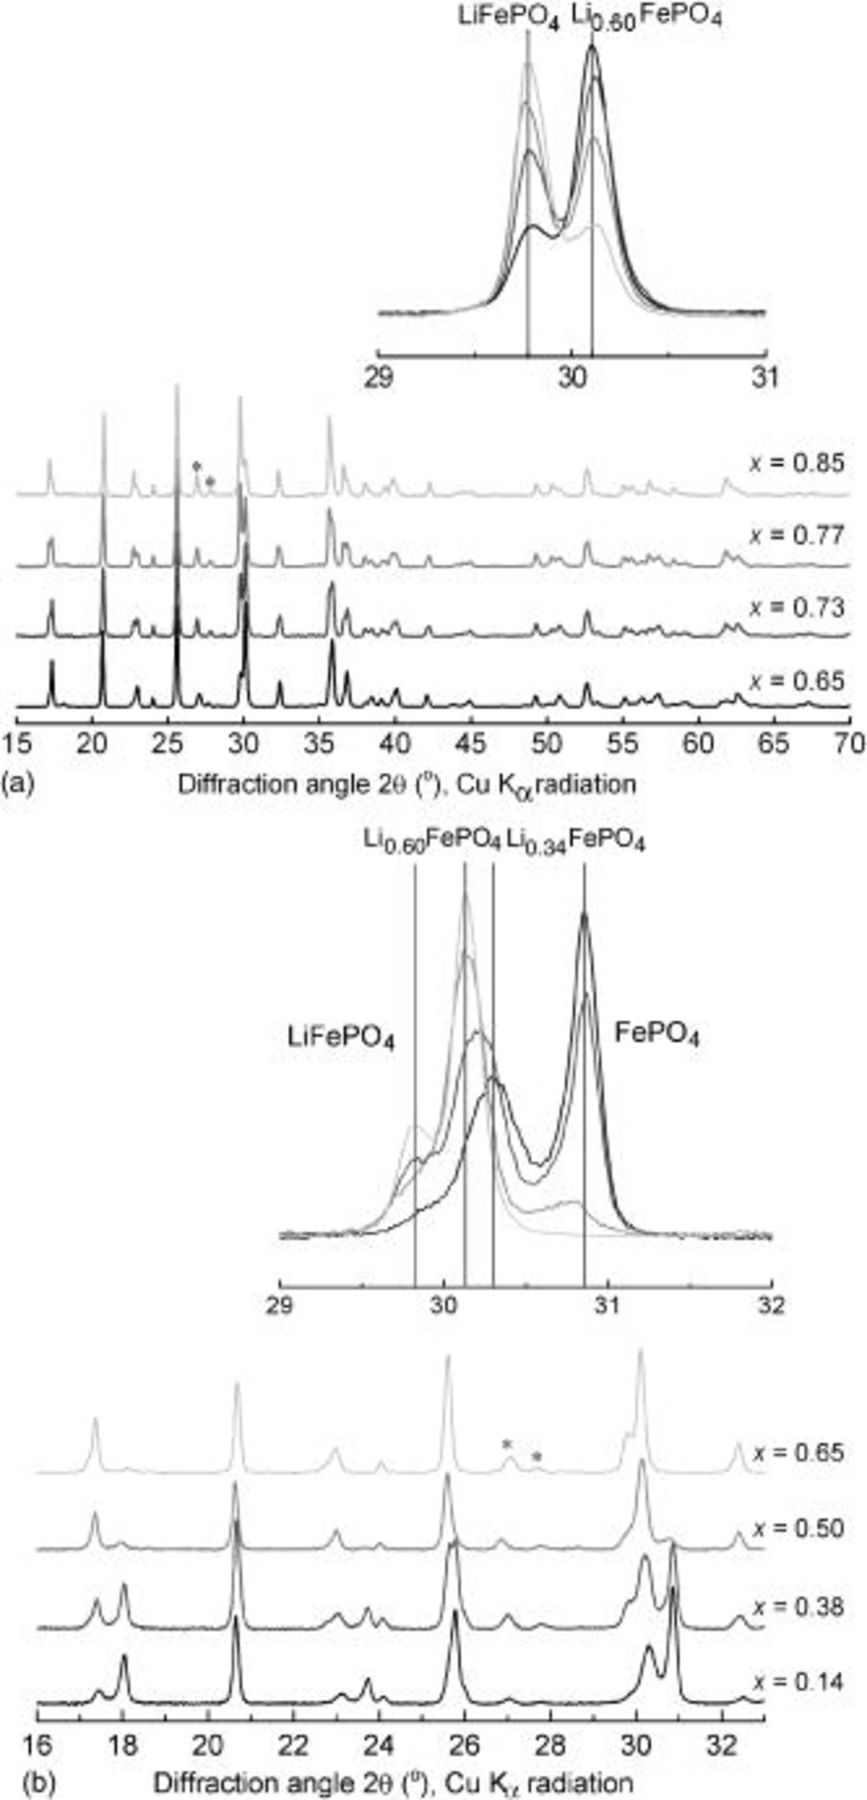
Figure 2. XRD patterns of  samples after cooling to 25°C: (a)
  and (b)
  . (Insets) Variation in 211/020 peak intensities of
  and
and  with
with  .
.
Figure 3 summarizes the lattice parameters and unit cell volumes of the four phases after cooling to room temperature, derived from XRD refinement of the samples with  , 0.14, 0.38, 0.50, 0.65, 0.73, 0.77, 0.85, and 1. Although the values of
  for
for  and
and  are approximately those expected for a linear variation with Li content,
  and
and  and the unit cell volumes of the solid-solution phases are substantially closer to those of
  , possibly due to the strong interaction between electrons and atoms in the system and the difficulty of accommodating both
  and
and  ions in close proximity.4, 7 There is some variation in the
  and
and  values for
  in the two-phase samples containing both this phase and
  . As the amount of
  increases, the
  and
and  parameters shift toward those of the fully lithiated phase, while
  is unaffected. The
  parameter is highly sensitive to variation in Li content,7 so that if this shift were due to a change in stoichiometry, it would be reflected by a similar shift in the value of
  . A more plausible explanation is the presence of residual stress between the two phases in the ac plane. This is further supported by the small shifts in the
  parameters toward those of the solid solution when only a small amount of
  is present
  .
.
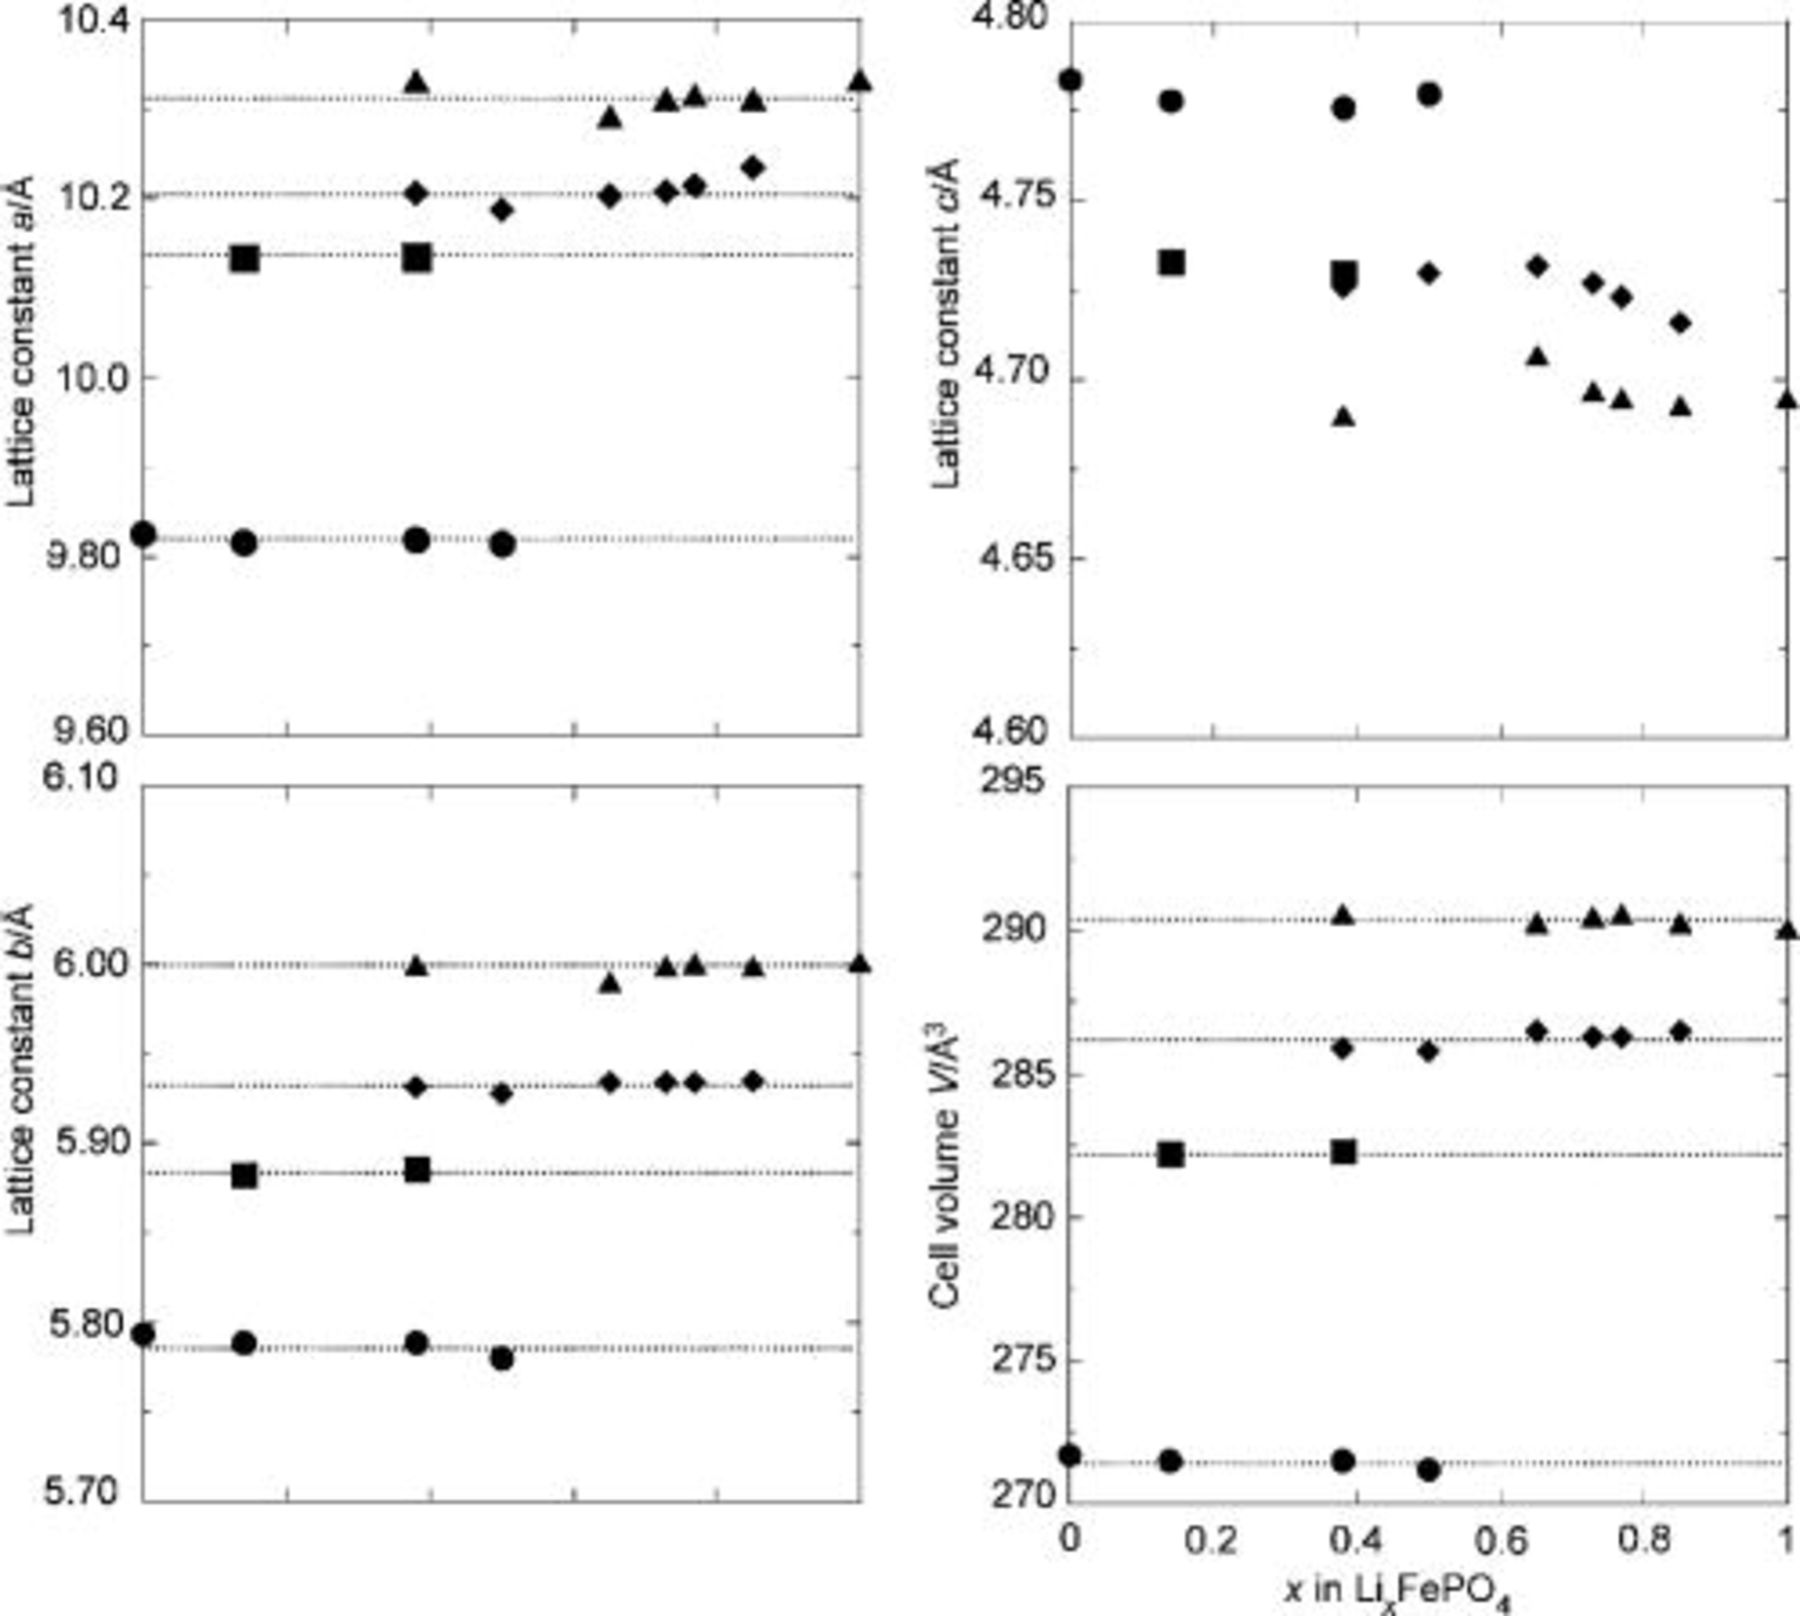
Figure 3. Lattice parameters and cell volumes of the phases present in cooled  samples:
 ,
, 
 ,
, 
 , and
, and 
 . Standard deviations of the refined lattice parameters were generally less than
  , and all were less than
  .
.
As we observed the presence of  in samples with varying Li content during heating and cooling and even at room temperature, it seems that this particular intermediate phase possesses unusual thermodynamic and kinetic stability. The phase diagram of
  reported by Dodd et al. showed
  as the eutectoid point, and Delacourt et al. reported
  as an important intermediate phase during the cooling process. In both of those reports, however, the intermediate phases quickly disproportionated to the end members when the sample was aged at room temperature. In contrast,
  is quite stable in our cooled crystals, even after 5 months (Fig. 4). Neither very slow cooling nor long-term annealing at 100°C were found to stimulate further phase separation.
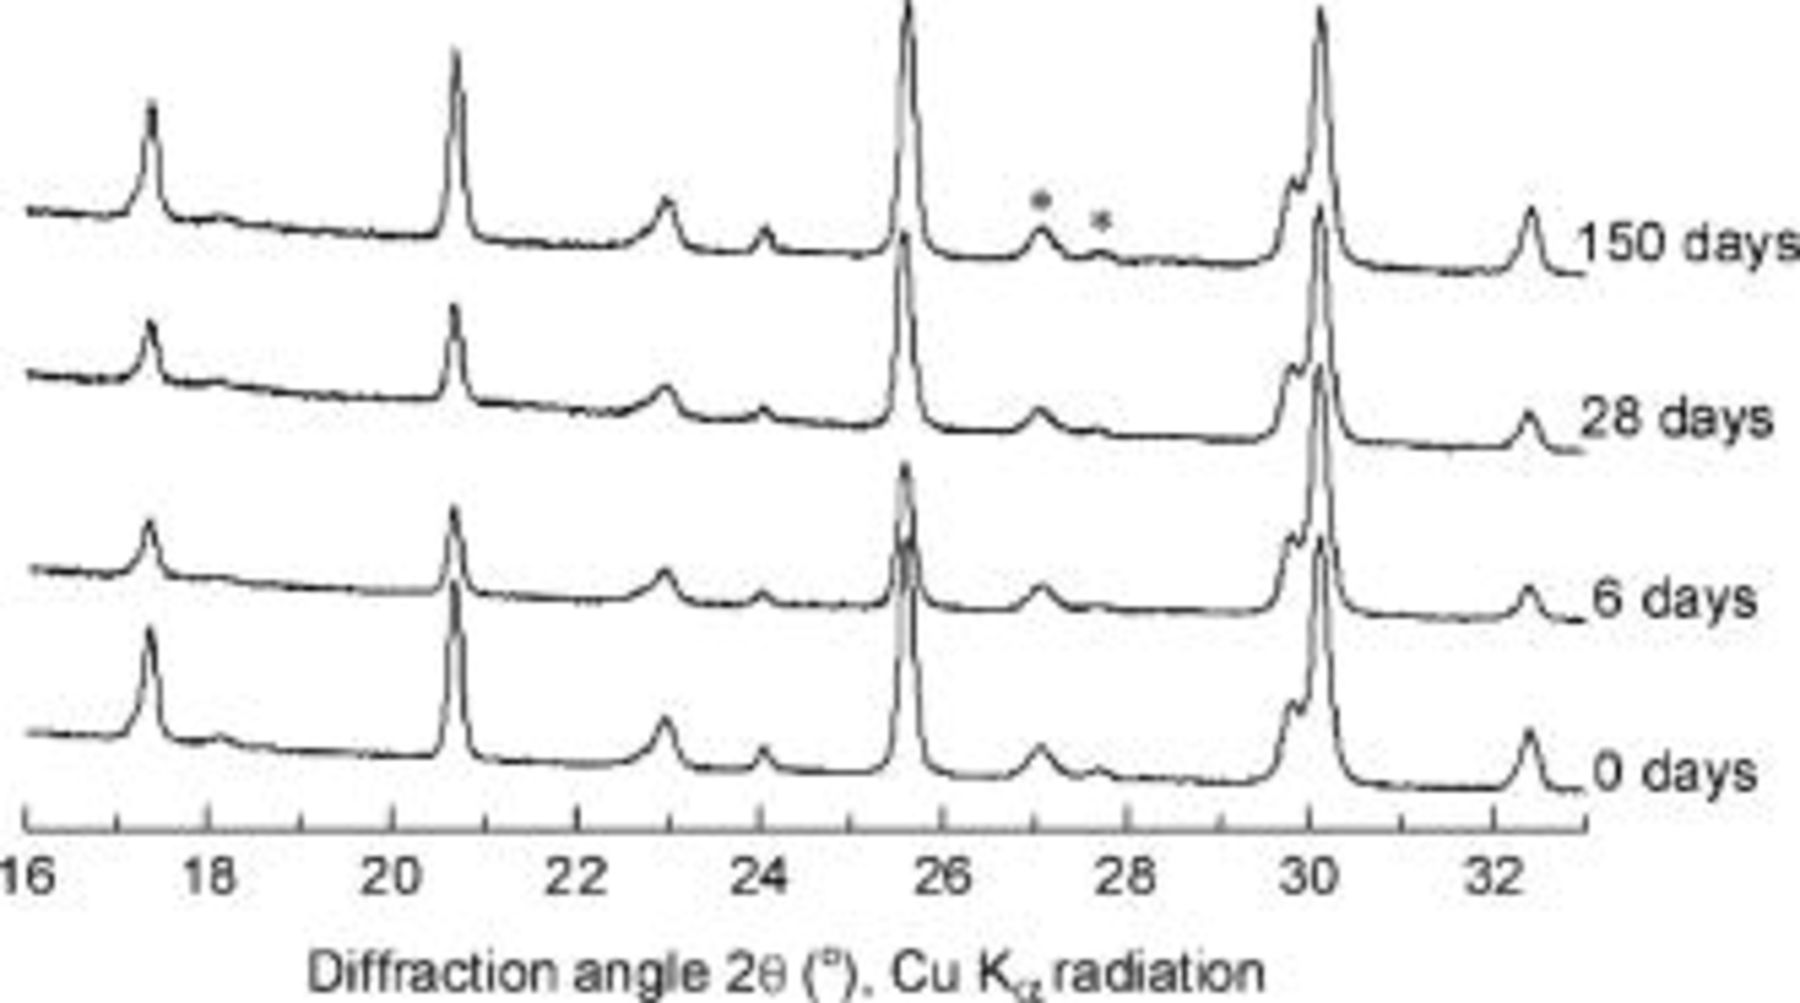
Figure 4. XRD patterns of cooled  sample during aging at ambient temperature.
We attempted to obtain a phase-pure room-temperature  solid-solution sample by heating delithiated crystals with
  . The patterns from the temperature-controlled XRD data experiment are shown in Fig. 5. As before,
  appeared at about 200°C and was the only phase present at 325°C. The solid solution maintained its phase purity until the sample had cooled to 100°C but then slowly began to disproportionate into a three-phase mixture containing
  ,
,  , and
, and  . After aging at room temperature for 2 weeks, about 20% of the
  had decomposed to
  and
and  . Apparently, the presence of some
  stabilizes
  during the cooling process.
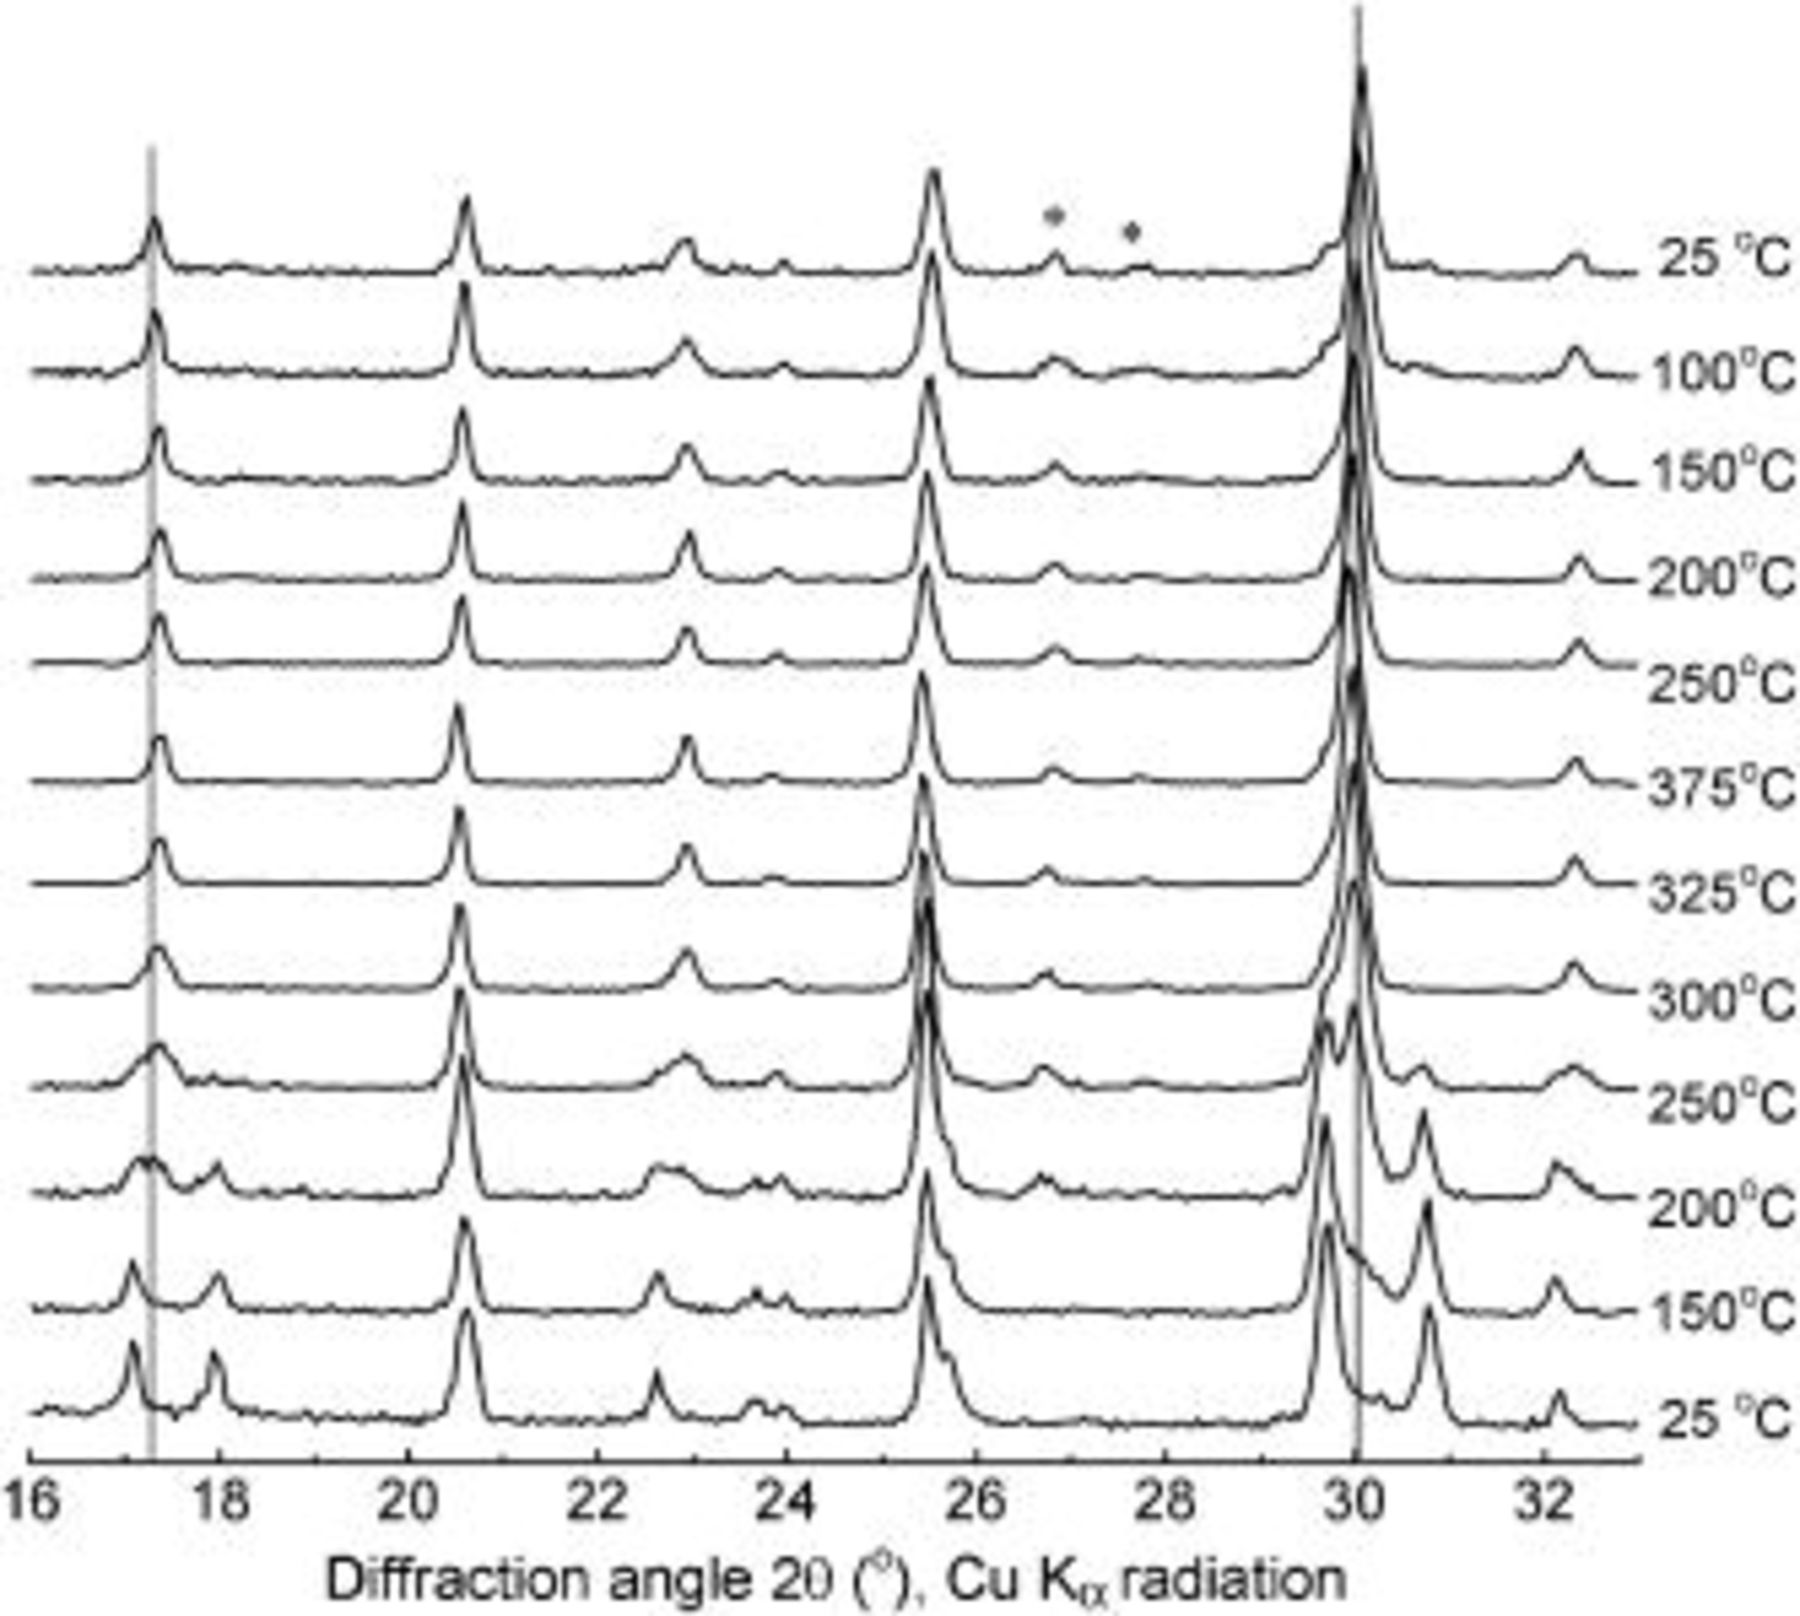
Figure 5. XRD patterns of  sample during heating and cooling.
Domain structure from TEM
In order to understand the metastability of the room-temperature solid solution in our crystal samples, we carried out detailed TEM studies on cooled  samples with
  and 0.77. In both cases, SAED showed the presence of both
  and
and  in individual crystals, with uniform phase ratios when sampled at different locations on the large (ac) faces. HRTEM images were obtained on a small, thin
  crystal, in which inner layers of the crystal were exposed due to breakage (Fig. 6a). The HRTEM image and the reciprocal lattice derived by Fourier transformation (inset) of region A are shown in Fig. 6b. The darker and lighter areas correspond to thicker and thinner portions of the crystal, respectively. The lattice spacings of the darker portion of region A correspond to
  and
and  , with two sets of spots relating to
  domains, each rotated by an equal amount but in opposite directions relative to those for
  . The lighter part of region A contains
  and only one set of spots due to
  . Figure 6c shows the HRTEM and the reciprocal lattice images derived from Fourier transforms of area B. In this case, the darker region consists of
  and
and  , while the lighter area is
  alone.
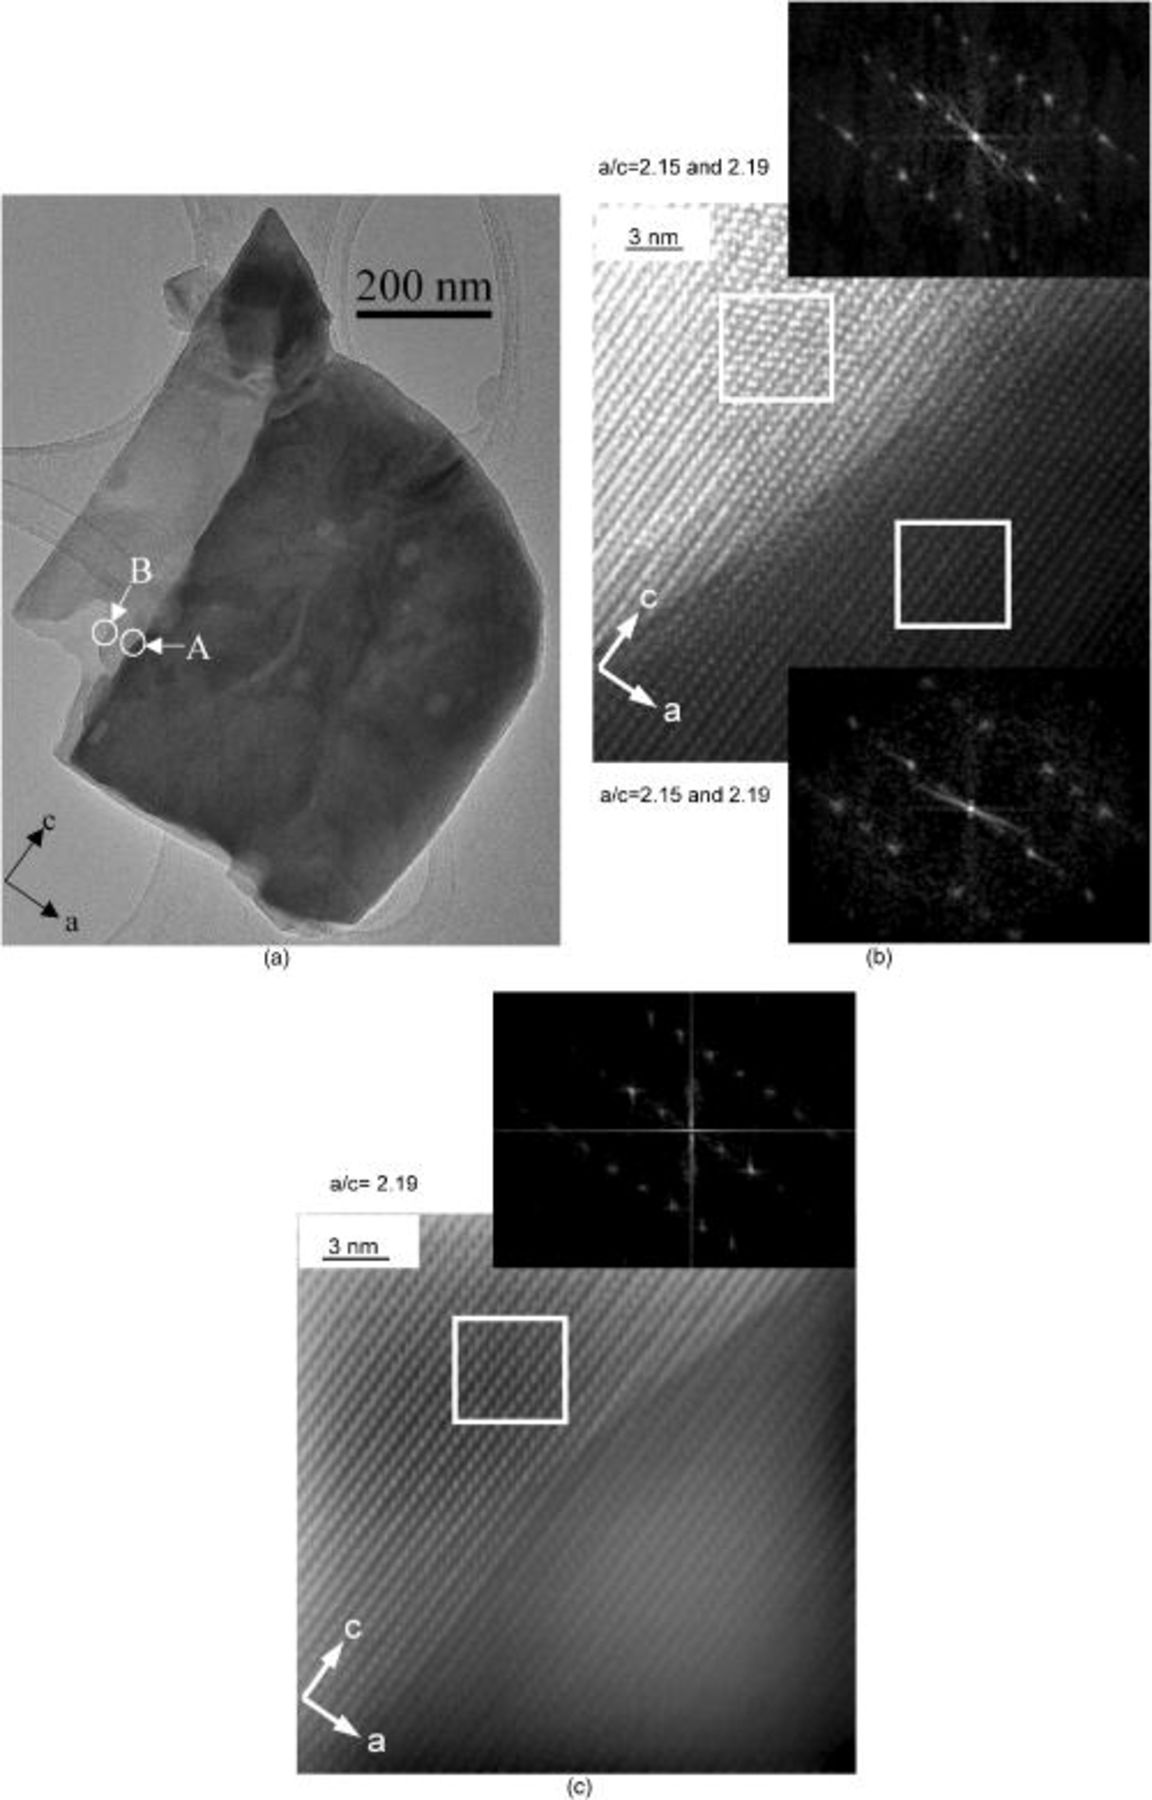
Figure 6. (a) TEM image of cooled  crystal, (b) HRTEM and reciprocal lattice images of area
  , and (c) HRTEM and reciprocal lattice images of area
  . An a/c ratio of 2.15 corresponds to
  and 2.19 to
  .
.
Before heating, the partially delithiated crystals consist of alternating domains of  and
and  with phase boundaries lying in the bc plane.11 A solid solution can be formed either by internal diffusion of Li ions that includes some component in the
  direction or by external exchange of Li between particles and between domains within particles. Our results indicate that upon cooling, the solid solution disproportionates into the fully lithiated phase and a partially lithiated intermediate phase via lithium-ion movement along the
  direction, with phase boundaries lying in the ac plane. Further,
  appears to form at the outer surface of the crystal, while the inner part of the crystal loses Li until the stoichiometry
  is reached. The crystals studied here have large ac faces which represent ca. 85% of the crystal surface. Because the lattice mismatch in the ac plane between
  and
and  is much larger than that for
  and
and  , one would expect a higher energy barrier to formation of
  . The solid-solution behavior of somewhat smaller crystals
  with the same morphology was identical. Separation into a larger number of phases, however, including other intermediate phases and
  , was observed at room temperature in crystals with still smaller ac dimensions
  . Such multiphase separation also occurred when the larger crystals were ground prior to delithiation and heating, whereas it did not take place in a sample ground after delithiation, heating, and cooling. Thus, the cumulative strain energy at the
  phase boundary may contribute to the stabilization of the metastable solid-solution phase during cooling. Yamada et al.6 reported that formation of room-temperature solid-solution phases was somewhat suppressed in larger particles.
The linewidths of the XRD peaks attributed to  at both high and low temperatures are similar to those of the end members in the starting materials. Aside from shifts due to thermal expansion, no significant differences were found between the high- and low-temperature XRD patterns of
  . Attempts to refine atom positions using the space group Pnma, however, led to some unreasonable bond distances due to the presence of two very different Fe ions. Although no superlattice reflections were detected by powder XRD, some additional spots were observed in SAED patterns.
Conclusions
Two metastable solid-solution phases were shown to persist in highly crystalline  .
.  was formed during both heating and cooling of samples with
  or greater. During cooling of single-phase samples consisting of crystals with large ac faces,
  and
and  formed by migration of Li in the
  direction within the crystals. The latter phase was formed at the ac surface, while
  was stabilized in the interior of the crystals and may persist indefinitely at room temperature. The basis of the inherent stability of
  and
and  and the significance of their stoichiometries remain unclear. A paper detailing spectroscopic characterizations of solid-solution samples is in preparation.
Acknowledgments
We thank the National Center for Electron Microscopy at LBNL for the use of TEM facilities and Dr. Charles Delacourt for valuable discussions. This work was supported by the Assistant Secretary for Energy Efficiency and Renewable Energy, Office of FreedomCAR and Vehicle Technologies of the U. S. Department of Energy under contract no. DE-AC02-05CH11231 .
Lawrence Berkeley National Laboratory assisted in meeting the publication costs of this article.