
Abstract
Ge nanoparticles with different particle sizes confined in a carbon matrix were prepared by annealing Ge nanoparticles terminated with butyl groups at 400, 600, and  . X-ray diffraction and transmission electron microscopy results showed that the Ge nanoparticles' size increased from
  as the annealing temperature of the as-prepared samples increased from
  . Raman spectra confirmed that the parts of the Ge nanoparticles were not covered by the carbon starting at
  after annealing for
  . Moreover, the graphitization degree of the carbon increases with increasing temperature, and the sample, annealed at
  for
for  , showed the graphitization degree. Electrochemical cycling results revealed that the
  Ge nanoparticles, confined in a carbon matrix obtained after annealing the as-prepared sample at
  for
for  , showed the best charge capacity of
  with 12% capacity loss after
  . On the other hand, Ge nanoparticles that had not been covered with the carbon matrix showed a rapid capacity decrease, along with pulverization of Ge nanoparticles to a size of about
  after cycling.
Export citation and abstract BibTeX RIS
Group III, IV, V elements are commonly investigated as anode materials in lithium secondary batteries with Si, Ge, and Sn being the most popular and interesting materials.1–5 Si and Ge showed specific capacities of 4000 and  , respectively, when forming the
  alloy.6–10 Despite these capacities, these materials exhibited a rapid capacity loss, accompanied by huge irreversible capacity, with the bulk metals approaching nearly
  after several cycles. In these studies, the materials have been acquired from sputtering and ballmilling. Considering practical aspects for using these materials in Li secondary batteries, particles are a more appropriate choice than thin films, and uniformly sized nanoparticles should be used for reducing inhomogeneous volume expansion between the particles.
There has been much interest in Si and Ge nanocrystals, especially in regards to the potential of obtaining useful levels of visible photoluminescence (PL) from these materials,11 So far, Ge nanocrystals have been produced by a variety of techniques, including sputtering,12 laser ablation,13 sol-gel processing,14 and ion implantation followed by high-temperature annealing.15 However, these techniques produce broad distributions of crystal sizes, along with broad optical absorption and PL features that make definitive interpretation in terms of quantum confinement difficult.13 It has been reported that solution-based synthesis of nanocrystals of these materials is more difficult than for the compound semiconductors. This factor has been largely responsible for the lack of highly crystalline monodisperse samples. Controlled nucleation and growth occur in the interior of nanosize surfactant aggregates, called inverse micelles.14 An anhydrous ionic salt, such as 
 , is dissolved in the hydrophilic interior of a solution of micelles. Since the ionic salts are completely insoluble in the continuous oil medium used, the nucleation and growth of Ge is restricted to the micelle interior. However, this method should use a reducing agent, such as
  , to reduce Ge(IV) to Ge(0) in water. In addition, there is a possibility of competing hydrolysis to
  because of the presence of water.
There have been reports of the low-temperature solution synthesis of Si and Ge nanoclusters terminated by alkyl groups. This synthesis utilizes reactive Zintl salts (KGe and NaGe). For instance, Taylor et al.16 reported that the metathesis reaction of NaGe with excess  in glyme solvents produced Ge nanocrystals. However, there was no measured particle size distribution for these nanocrystals obtained without further annealing. The X-ray diffraction (XRD) patterns of the further annealed sample at
  , on the other hand, showed a mean particle size smaller than
  .
.
In this study, we report the synthesis and optimization of Ge nanoparticle size confined in the carbon matrix for use as anode materials in lithium secondary batteries, and Ge nanoparticle size ranged between 10 and  , depending on an annealing temperature.
Experimental
For synthesizing the butyl-capped Ge nanoparticles, all the experimental procedures were carried out in inert atmosphere except for the washing process. Sodium naphthalide solution was prepared from 
 of sodium and
 of naphthalene, stirred in
  1.2-dimethoxyethane;
 of
of  and
and  of 1.2-dimethoxyethane solvent were thoroughly mixed and decanted into the sodium naphthalide solution. This mixed solution was stirred for
  , and then
  of butyllithium was added. Instantly, the solution turned orange, and the solvent and naphthalene were removed by using a rotating evaporator at
  for
for  . After the washing process, a viscous orange oil was obtained, and it was washed six times with water. The orange oil was annealed at 400, 600, and
  for
for  and
and  for
for  in a vacuum furnace to obtain a dark brown powder.
The cathodes for the battery test cells were made of butyl-capped Ge material, super P carbon black, and polyvinylidene fluoride (PVDF) binder (Solef) in a weight ratio of 8:1:1. The slurry was prepared by thoroughly mixing a  -methyl-2-pyrrolidone (Aldrich) solution of PVDF, carbon black, and the anode material. The coin-type half cells (2016R size), prepared in a helium-filled glovebox, contained a cathode, a Li metal anode, a microporous polyethylene separator, and an electrolyte solution of
 in ethylene carbonate/dimethyl carbonate
  (Cheil Industries).
A field-emission transition electron microscopy (TEM) (JEOL 2100F), operating at  , was used for investigating the microstructure of the samples. Raman spectroscopy (Renishaw 3000) was used to characterize Ge nanocrystals confined in an amorphous carbon matrix and to obtain the graphitization degree of an amorphous carbon phase in the sample (ratio of
  and
and  band of the carbon), using
  laser excitation. Fourier transform infrared (FTIR) spectra (JASCO 4000) for the nanoparticles were obtained at room temperature by dropping the hexane colloid on a KBr plate and allowing the solvent to evaporate.
Results and Discussion
Figure 1 shows the XRD patterns of the samples before and after annealing at 400, 600, and  for different times. The XRD pattern of the as-prepared sample confirmed the presence of amorphous Ge particles. As the annealing temperature increased, the XRD patterns started to sharpen and peaks were clearly distinguishable. The size of the annealed Ge nanoparticles was determined from the width of the peaks according to the Debye-Scherr equation,17 and the annealed samples at
  for 3 and
  were estimated to be 8 and
  , respectively. When the sample was annealed at
  for
for  , the particle size increased to
  . Figure 2 shows Raman spectra of the samples annealed at
  for
for  ,
,  for 3 and
  , and
, and  for
for  . Except for the sample annealed at
  , the spectra of the other samples show the carbon peaks at 1360 and
  , corresponding to
  and
and  bands, respectively.
  ratio in the Raman spectra was determined by integrating each area of the bands. The
  ratio, indicative of the graphitization degree of carbon, of the samples decreased with increasing annealing temperature and time at
  for 3 or
  and
and  for
for  , with the values of 2.5, 2.0, and 1.5, respectively. For comparison, the
  ratio for synthetic graphite was less than 0.09.18 This indicates that the sample annealed at
  has the highest graphitization degree among the samples. Amorphous carbon has limited Li intercalation/deintercalation amounts, depending on the graphitization degree, and its lower graphitization degree leads to lower capacity.18 In addition, it should be noted that the samples annealed at 600 and
  for 9 and
  showed the Ge–Ge vibration band at
  , and its intensity increased with increasing annealing temperature, indicating that Ge nanoparticles were not completely covered with a carbon layer. The combined XRD and Raman spectral results indicate that
  Ge nanoparticles were surrounded by the carbon. However, the sample annealed at
  showed a large portion of the Ge nanoparticles was not covered by the carbon. Therefore, Ge nanoparticles are expected to agglomerate into larger particles at higher annealing temperatures.
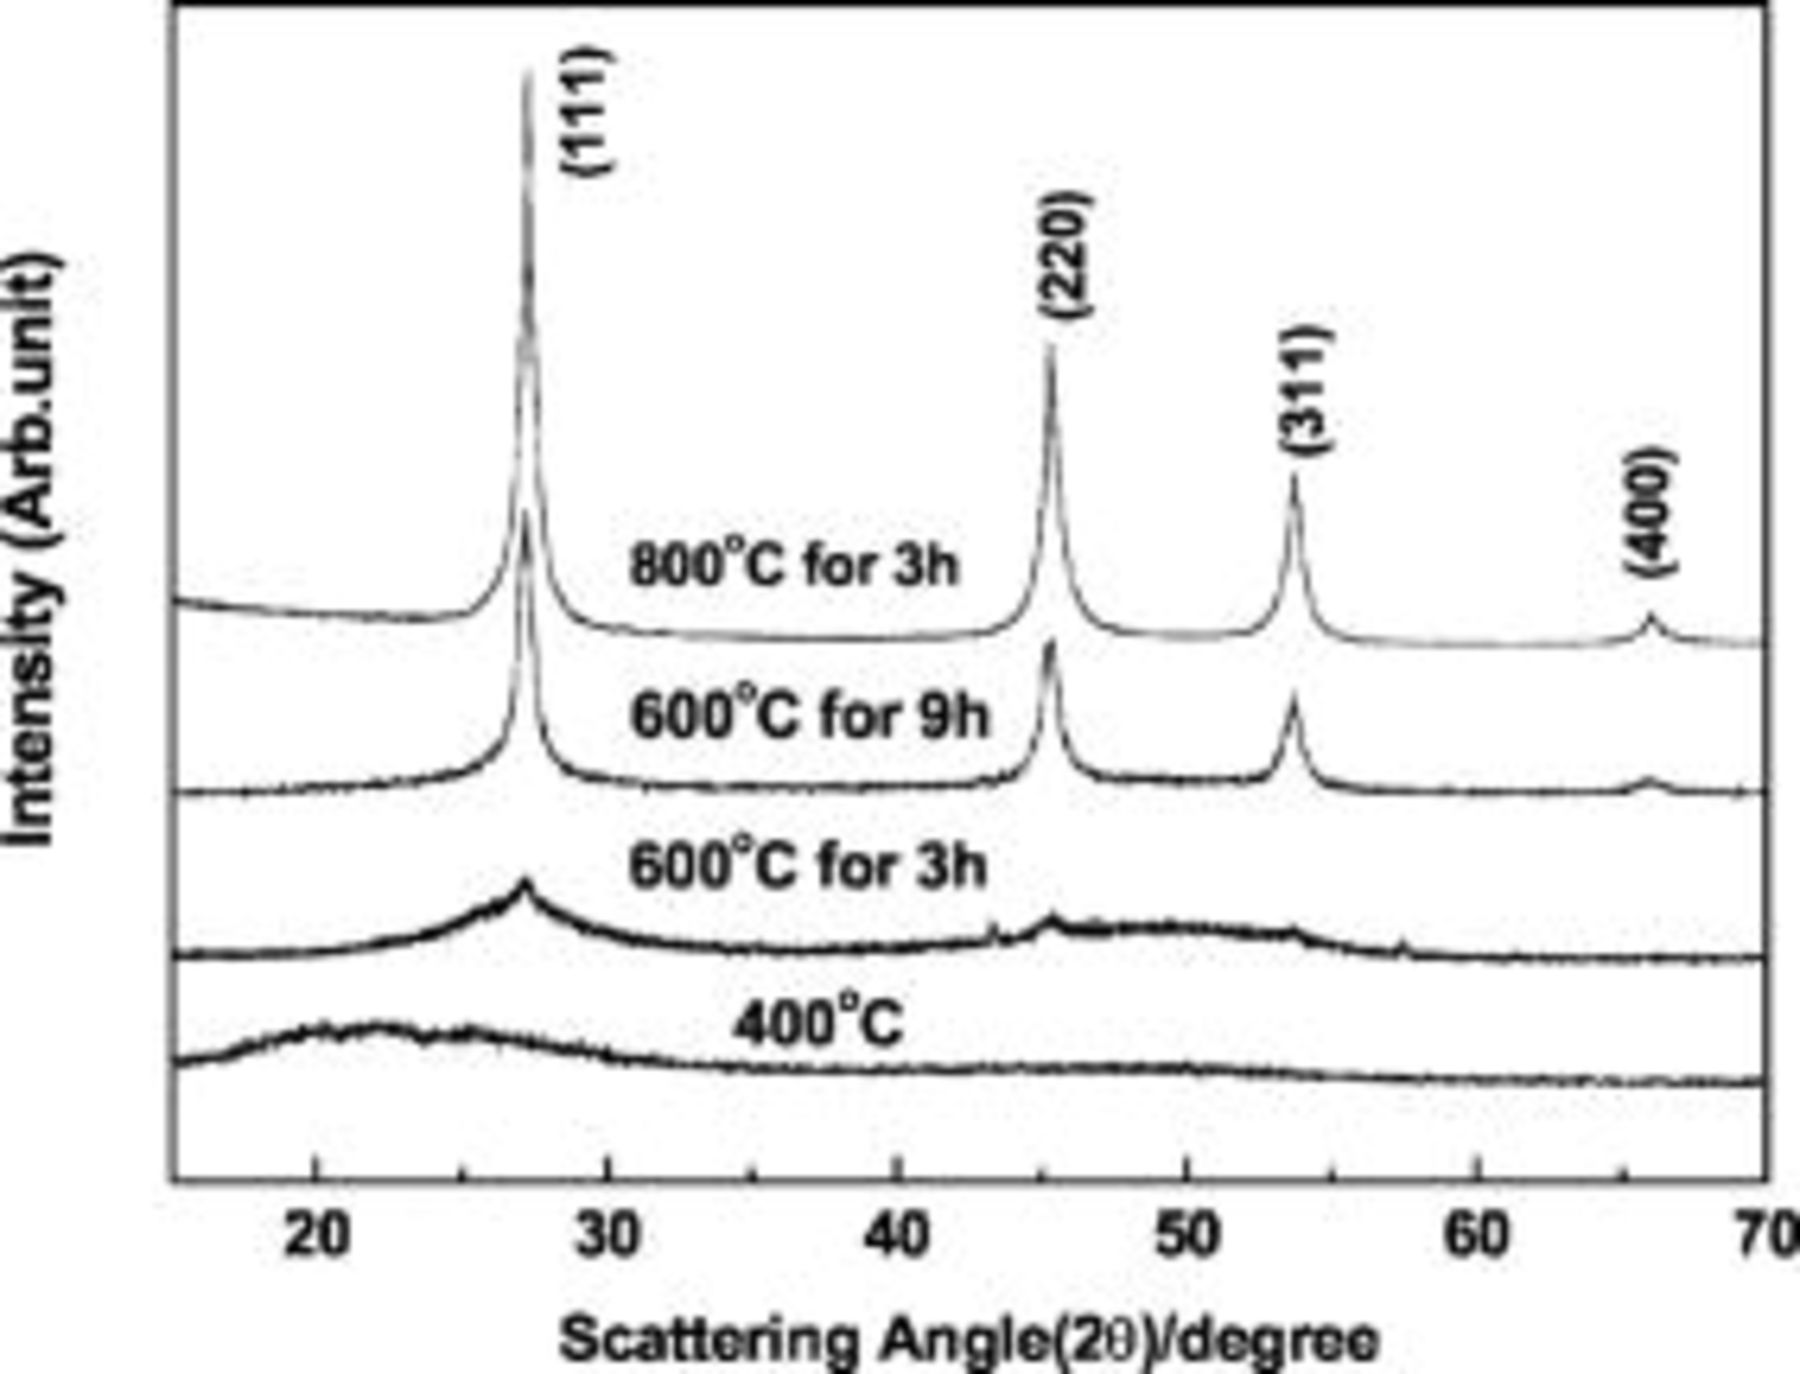
Figure 1. XRD patterns of the samples before and after annealing at  for
for  ,
,  for 3 and
  , and
, and  for
for  .
.
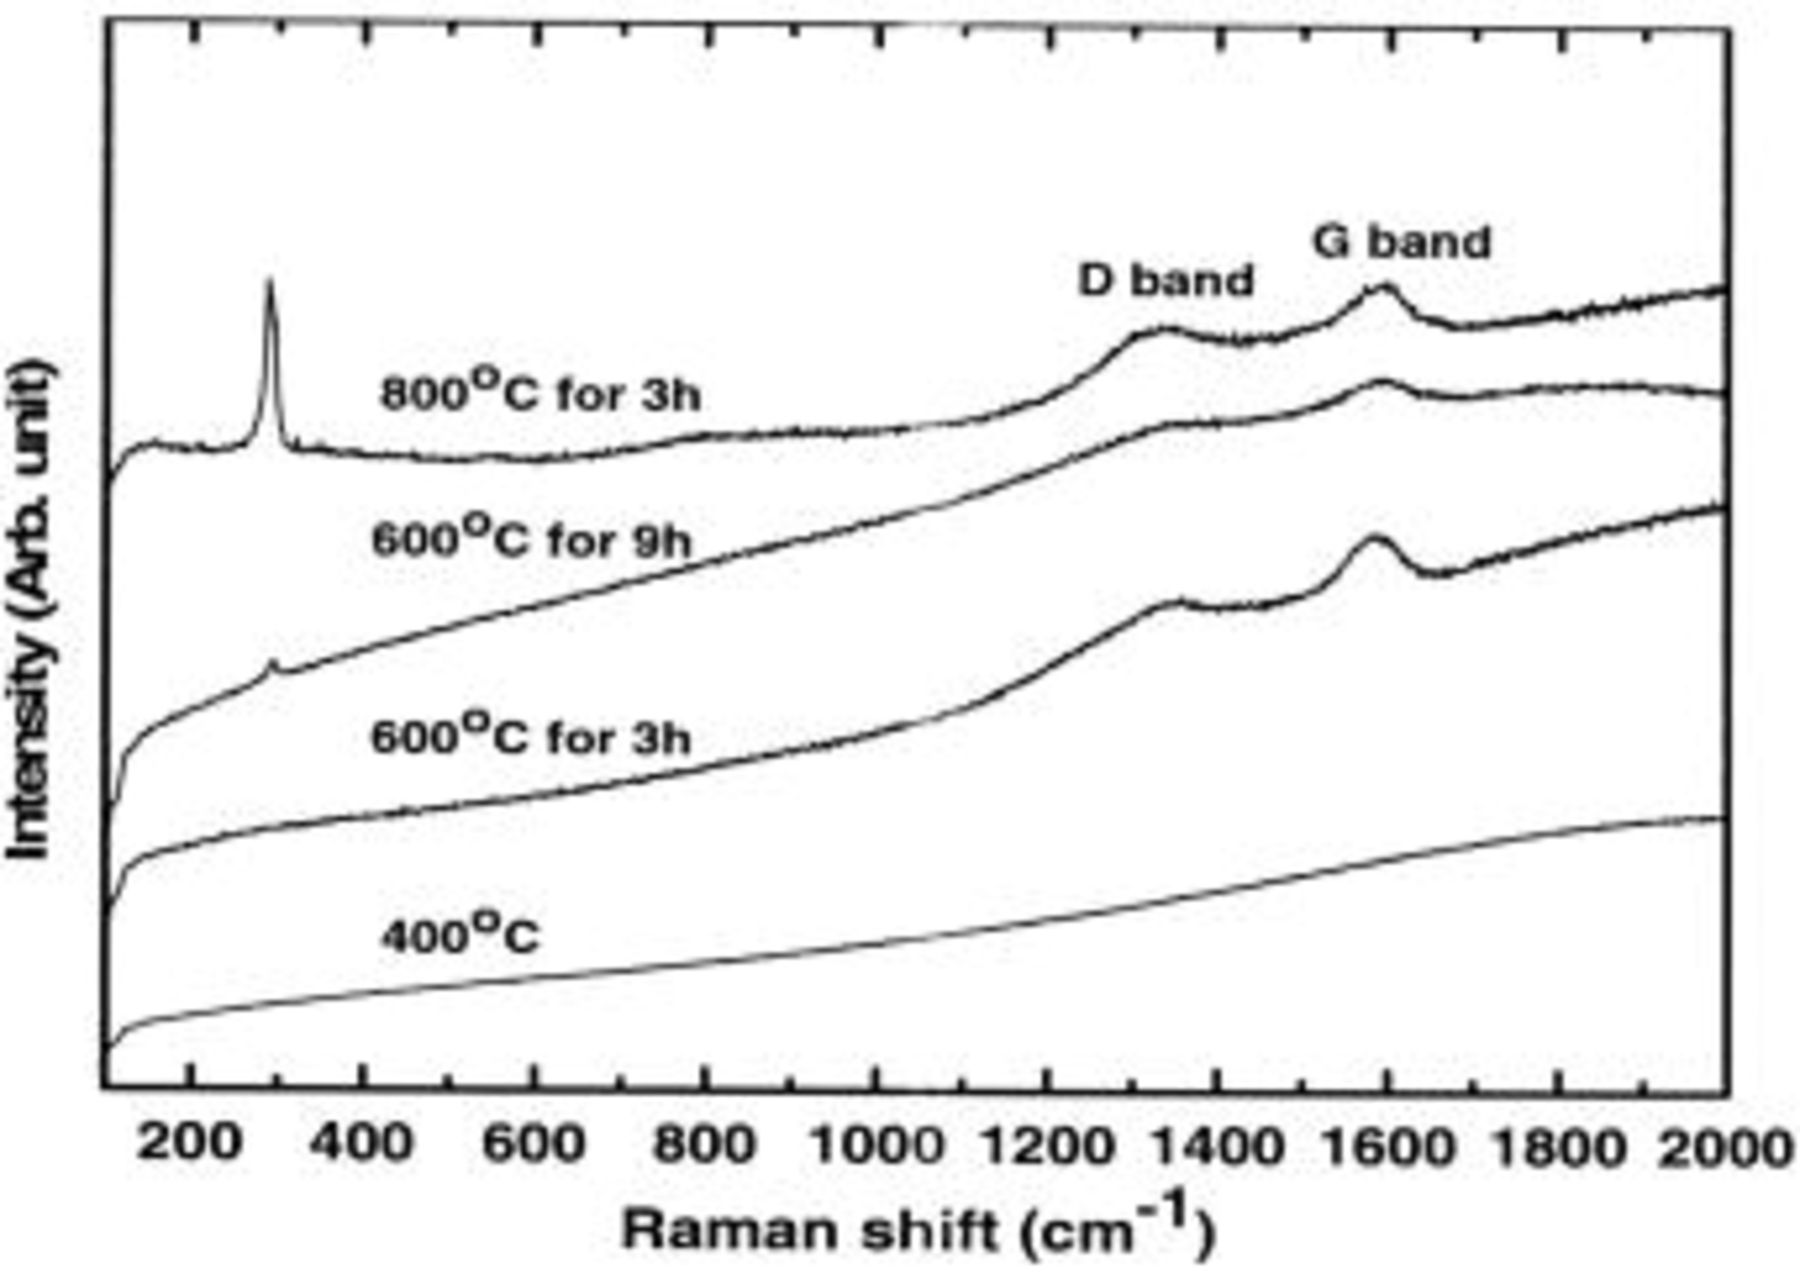
Figure 2. Raman spectra of the samples annealed at  for
for  ,
,  for 3 and
  , and
, and  for
for  .
.
Figure 3 shows FTIR spectra of the butyl-capped Ge particles before and after annealing at 400, 600, and  . The three peaks at 2955, 2924, and
  fall where expected for C–H stretches of butyl groups which was well matched with the result in Ref. 16 The peaks at 1376 and
  are the positions expected for the symmetric and asymmetric bends of the butyl group, respectively. As can be seen in Fig. 3, as the annealing temperature increased, the peak intensities assigned to butyl groups rapidly decreased, and the samples annealed at
  for
for  and
and  for
for  showed no traces of the butyl groups, indicating complete transformation into amorphous carbon. In the case of the sample annealed at
  for
for  , small residual
  peaks were observed.
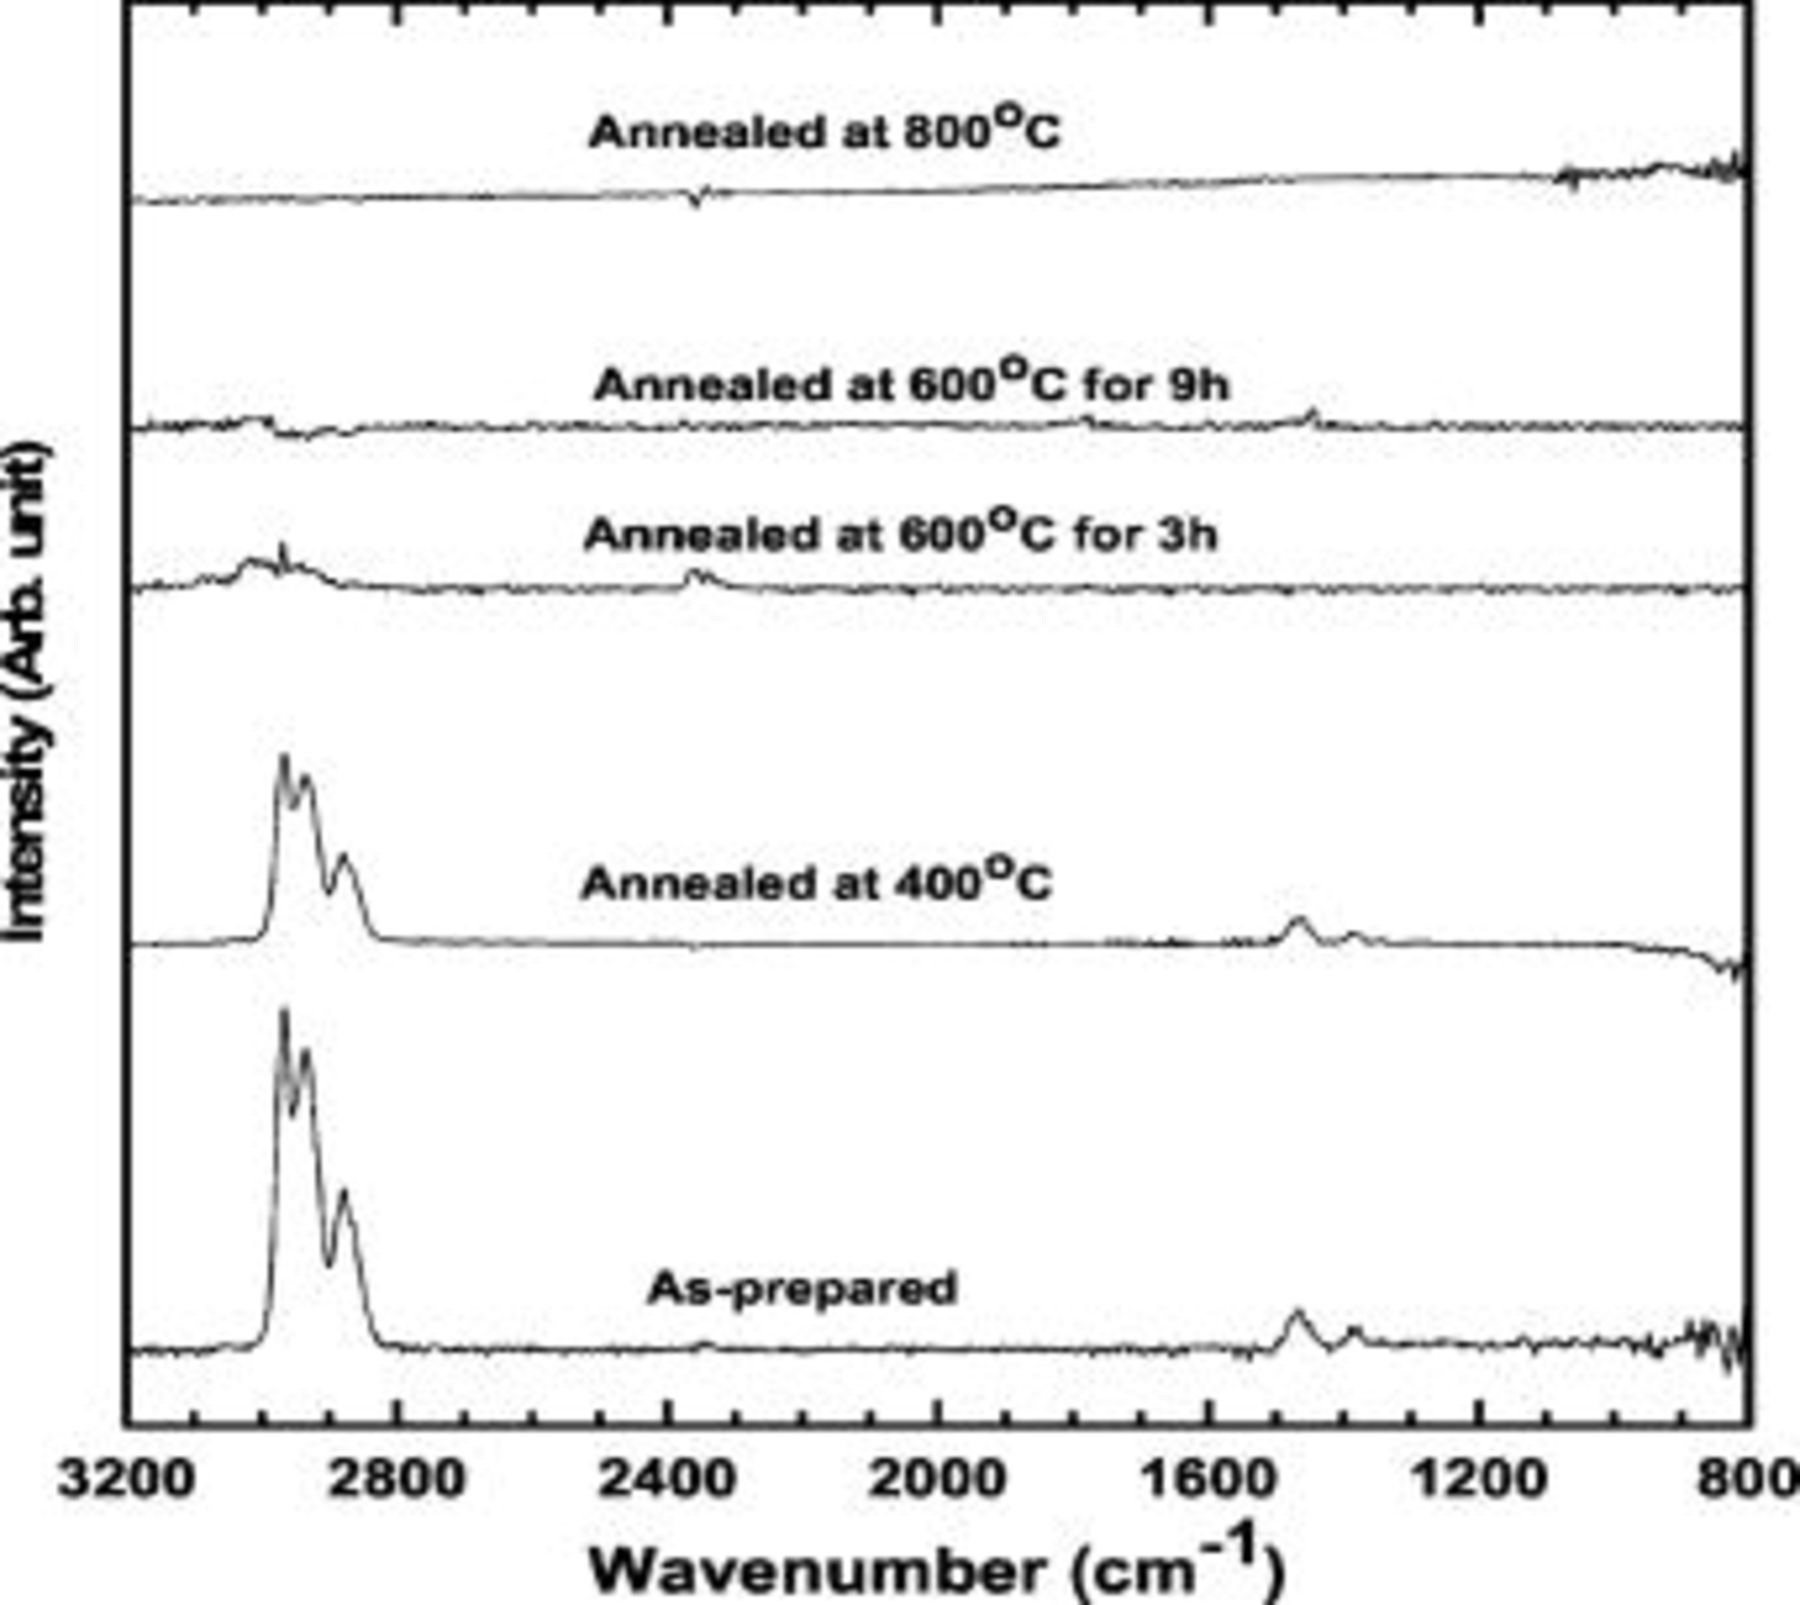
Figure 3. FTIR spectra of the samples before and after annealing at  for
for  ,
,  for 3 and
  , and
, and  for
for  .
.
In order to support these spectra results, TEM analysis (Fig. 4a, 4b, 4c, 4d, 4e and 4f) was performed, using the samples before and after annealing. The as-prepared sample shows a particle size distribution between 1 and  , but, after annealing at
  ,
,  Ge nanoparticles were confined to a different phase, which is believed to be carbon. This result reveals that the as-prepared sample consisted of micrometer-sized particles which contained many
  Ge particles capped with butyl groups, as shown in Fig. 5. In the case of the sample annealed at
  for
for  (Fig. 4c and 4d), no apparent Ge particle growth was observed showing the same particle size as above. The expanded TEM image of Fig. 4c clearly shows the {220} lattice fringe of the Ge (Fig. 4d). Upon extending the annealing time to
  , nonuniformly distributed Ge nanoparticles were observed with particle sizes ranging from
  (Fig. 4e). This is due to Ge nanoparticles that were not capped with carbon layers which would have aggregated to create larger particle sizes. A similar result was also observed in the sample annealed at
  , with severely aggregated Ge particles having a particle size of about
  , which was 12 times larger than the one annealed at
  for
for  . Such a large particle size is believed to be induced by accelerated disappearance of the capped carbon layer on the particle, which acts as an inhibitor for interparticle conglomeration. In this case, we clearly observed {111}, a lattice fringe, along with a carbon layer of
  . Table I exhibits the composition of the samples measured by CHS and inductively coupled plasma (ICP) analysis. H content rapidly decreases with increasing annealing temperature, and the sample annealed at
  has negligible amount of hydrogen.
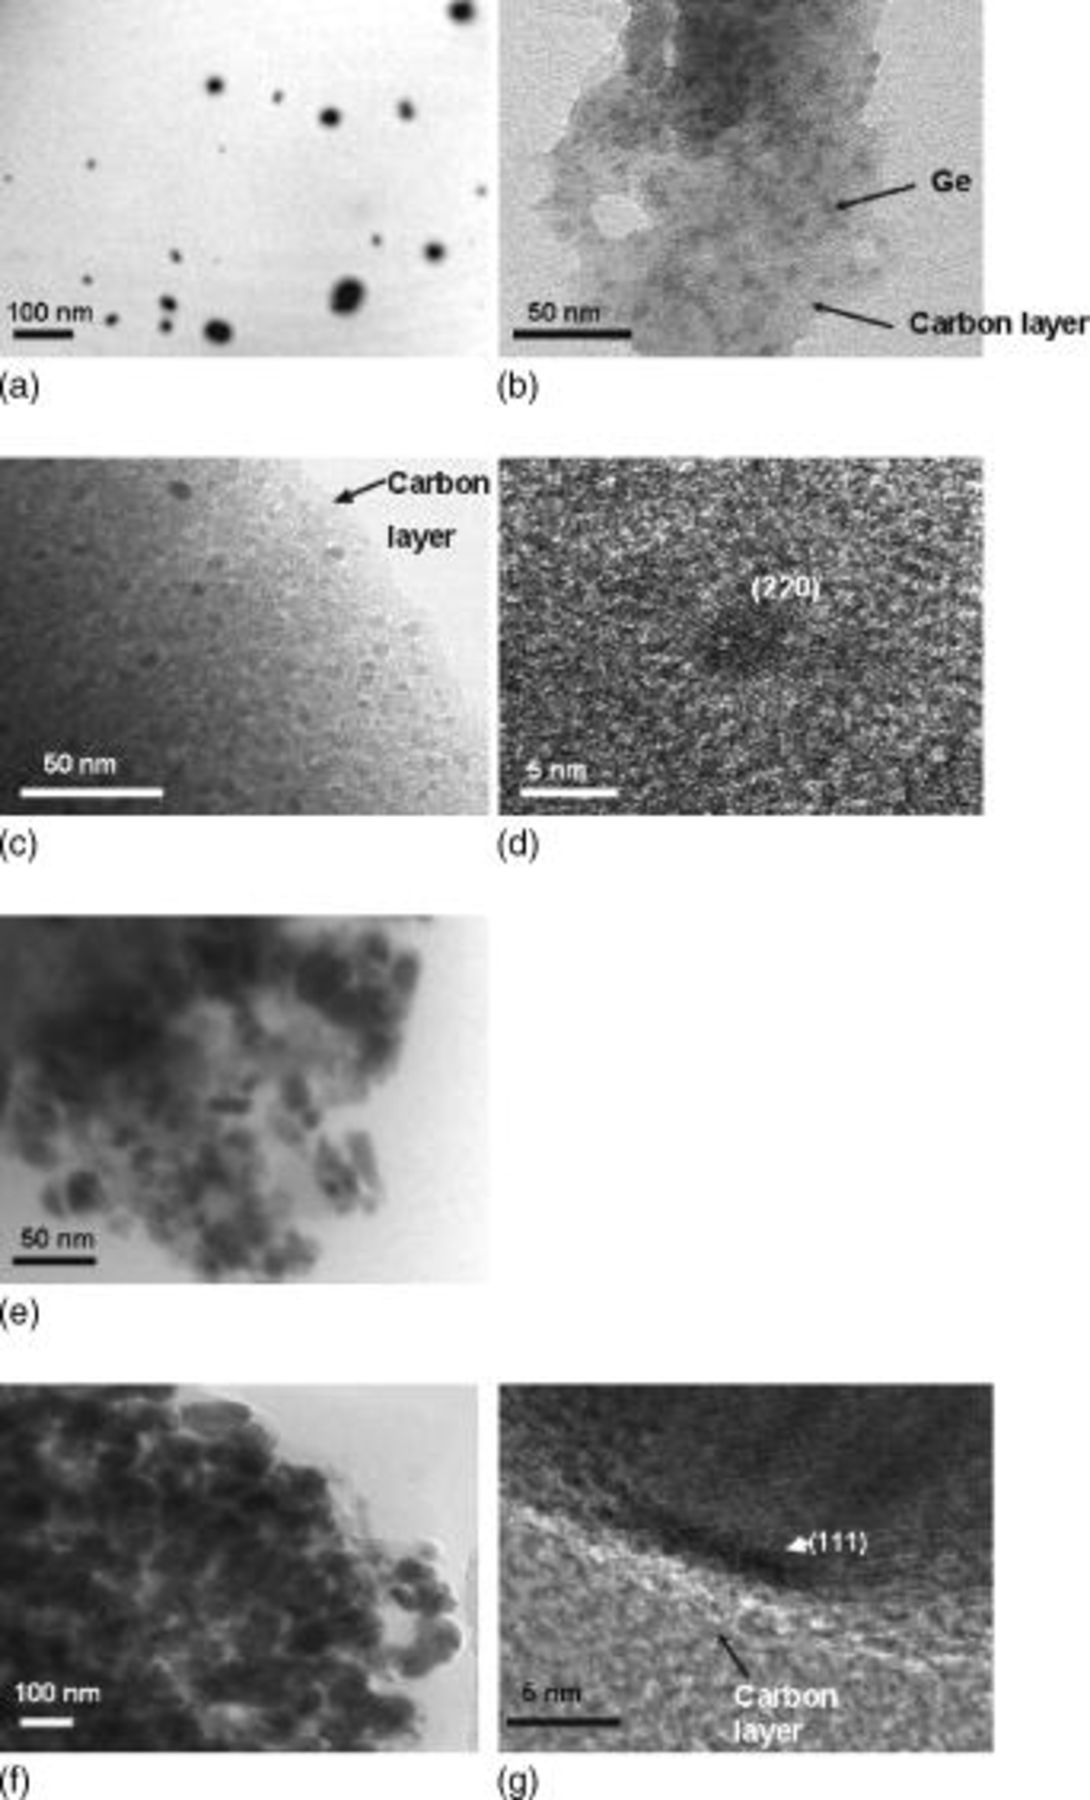
Figure 4. TEM images of the samples (a) before and after annealing at (b)  for
for  ,
,  for (c)
  and (e)
  , and
, and  for (f)
  . Parts (d) and (g) are expanded TEM images of (c) and (f), respectively.
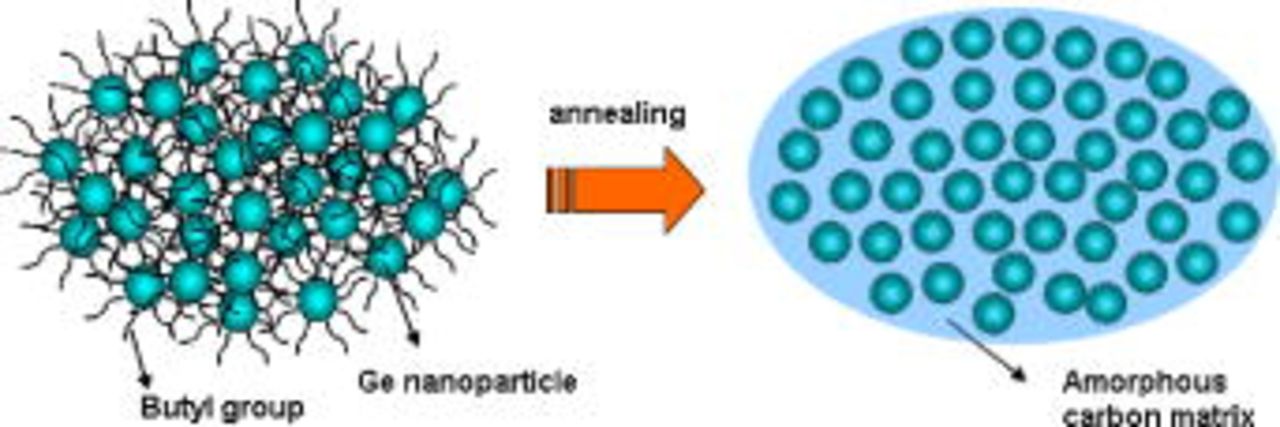
Figure 5. (Color online) Schematic view showing the formation of Ge nanoparticles confined in an amorphous carbon matrix after annealing.
Table I. The compositions of the samples measured by ICP and CHS analyzers.
| H (wt %) | C (wt %) | Ge (wt %) | |
|---|---|---|---|

| 9 | 11.5 | 79.5 |
 for for 
| 1.1 | 10.5 | 88.4 |
 for for 
| 0.1 | 9.6 | 90.3 |
 for for 
| 0 | 6.8 | 93.2 |
Electrochemical testing was performed, using the annealed samples at different temperatures in coin-type half cells, at a rate of 
 between 0 and
  , as shown in Fig. 6. Ge nanoparticles obtained from annealing at
  for
for  showed a small charge capacity of
  , with an irreversible capacity ratio of 69%, which was due to the low graphitization degree of the carbon. However, the sample annealed at
  for
for  showed a significantly improved charge capacity of
  , with an irreversible capacity ratio of 26% and capacity retention after
  of 88% (voltage profiles the sample annealed at
  for
for  after 2, 10, 20, and
  were shown in Fig. 7). The electrode density of the Ge embedded in a carbon matrix after discharging to
  was
was  (due to the volume expansion of the electrode after lithium alloying, it is reasonable to estimate the electrode density using discharged electrode). The case of the sample annealed at
  for
for  had a first charge capacity of
  , and, compared to the sample annealed at
  for
for  , had an increased irreversible capacity ratio of 42%. This was due to enhanced side reactions with the electrolytes of the uncovered parts with the carbon layer. In addition, note that capacity retention was decreased by 27%, compared with the sample annealed at
  for
for  . These results suggest that the increased graphitization degree of the carbon and carbon matrix improved the capacity of the Ge nanoparticles. In the case of the sample annealed at
  , its charge capacity was
  , with an irreversible capacity ratio of 24%, which was the smallest value among the samples. This is believed to be due to enhanced graphitization degree of the carbon layer. However, its capacity decreased to
  after
after  corresponding to a capacity retention value of 42%. Considering capacity contribution of the amorphous carbon (amorphous carbon showed the reversible capacity of
  ),2 its effect on the total capacity of the samples is negligible.
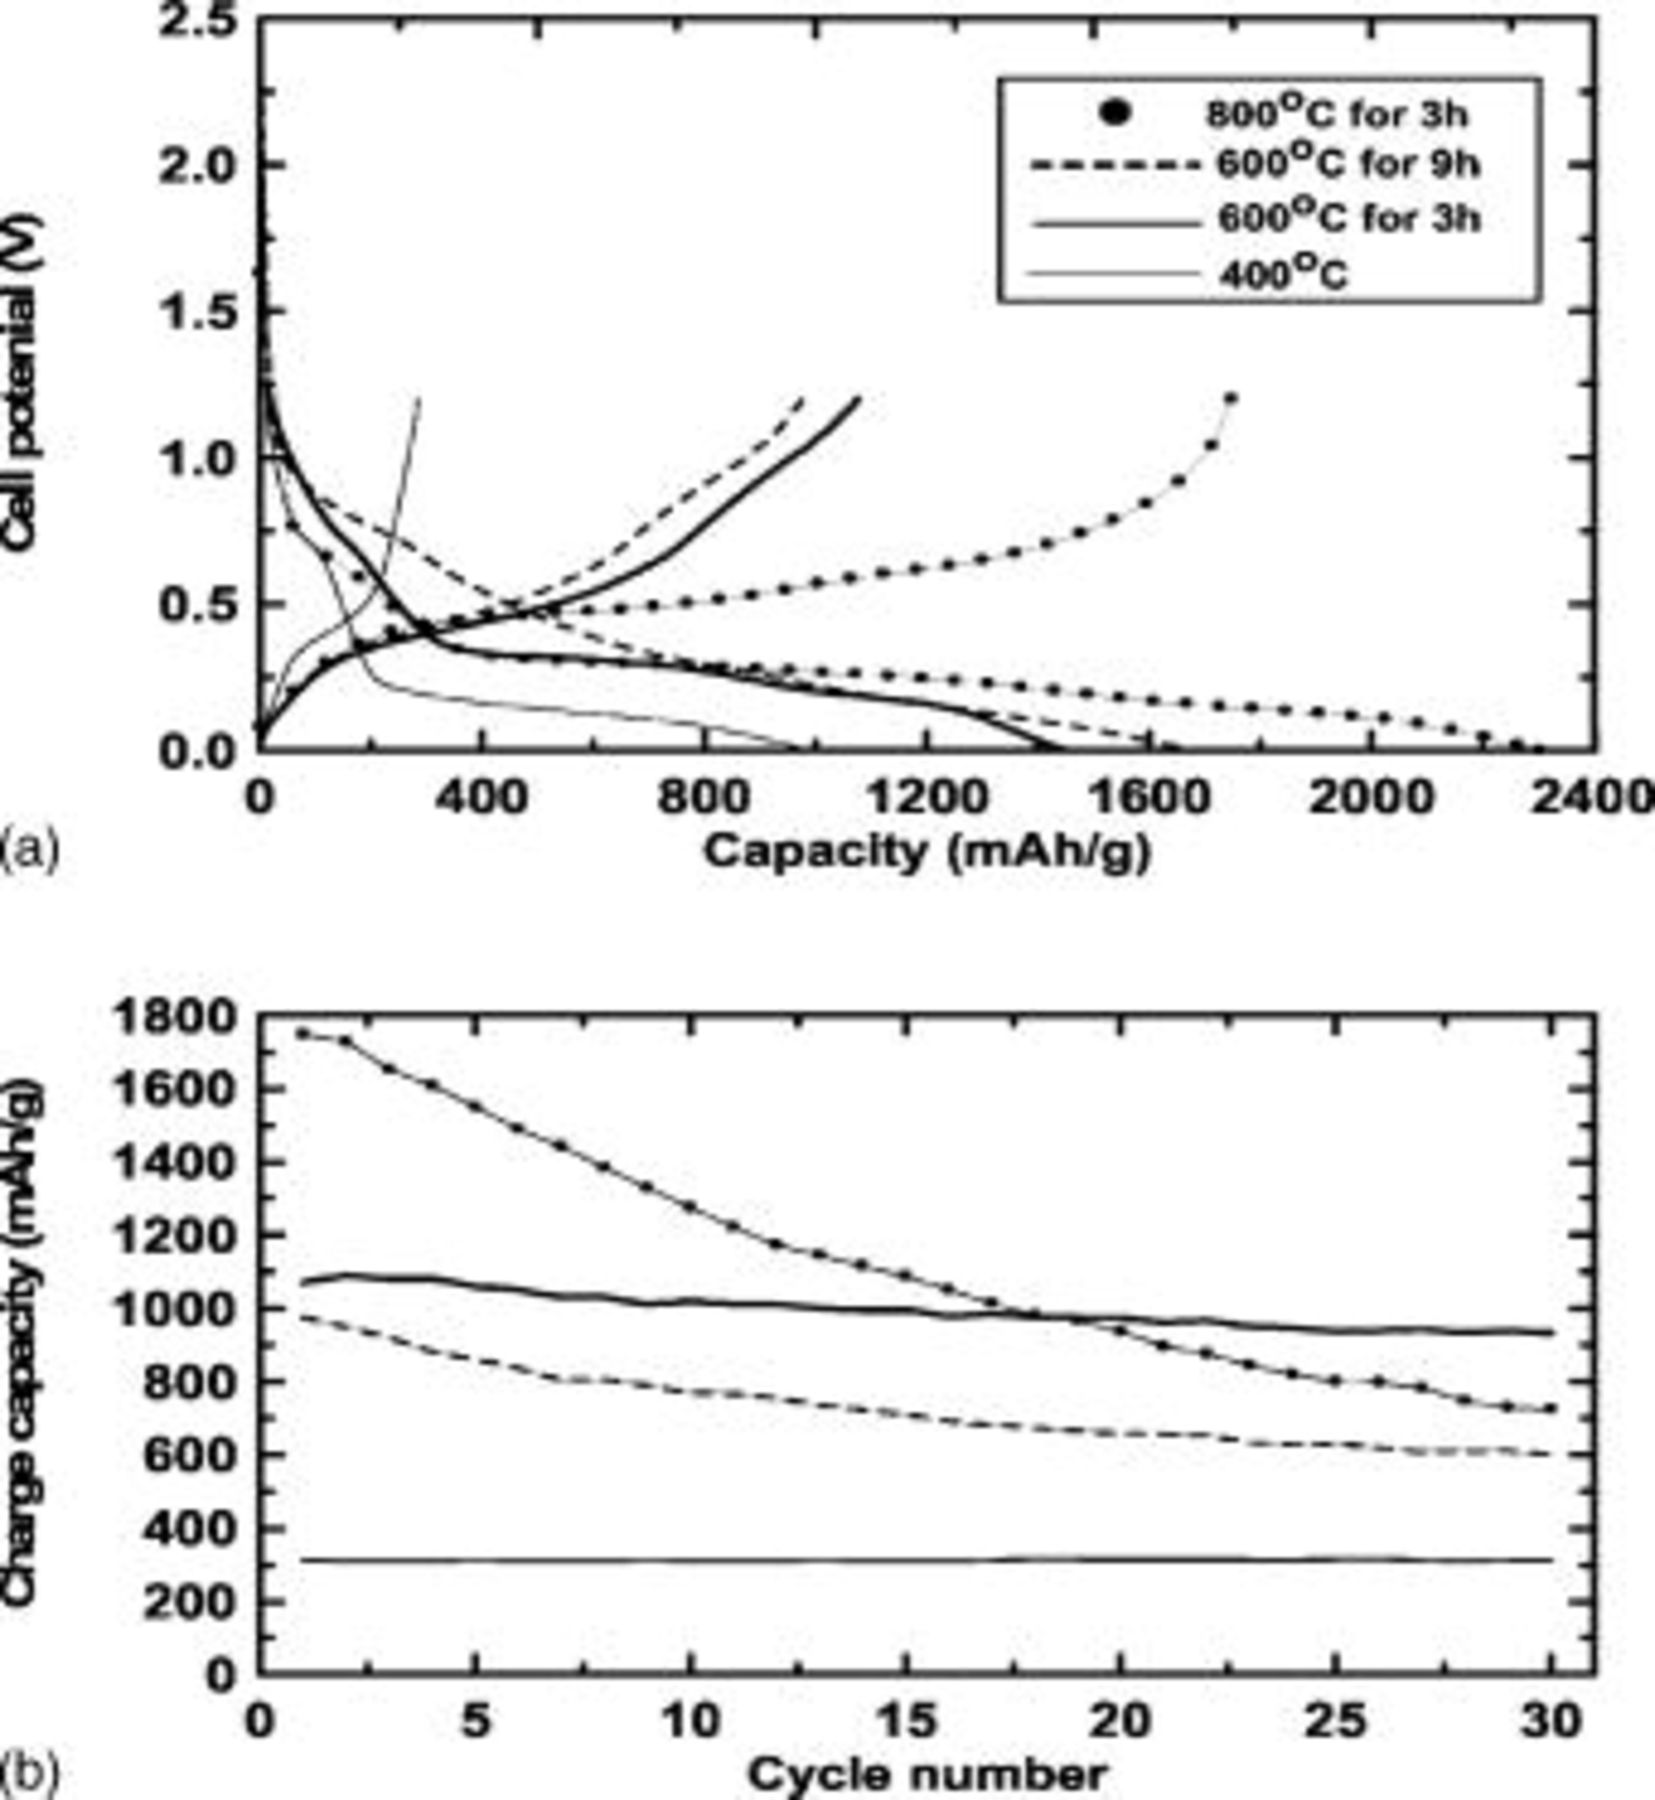
Figure 6. (a) Voltage profiles of the samples annealed at  for
for  ,
,  for
for  ,
,  , and
, and  for
for  in coin type half cells at a rate of
  between 0 and
  during the first cycle. (b) Cycle number vs charge capacity of (a).

Figure 7. Voltage profiles for the sample annealed at  for
for  after 2, 10, 20, and
  at the same test condition to Fig. 6.
Using the cycled electrodes, the particle size and morphology were analyzed. The sample annealed at  for
for  showed a particle size identical to that before cycling (Fig. 8a). Further, Ge nanoparticles were well dispersed without showing aggregation. On the other hand, a cycled electrode, obtained from annealing at
  for
for  , showed an increased particle size to
  , compared to that before cycling (Fig. 8b). In addition, partial particle aggregation with different lattice fringes (Fig. 8c) is observed, indicating that some particle breakup and subsequent aggregation occurred. Finally, rapid capacity fading of the sample annealed at
  was due to severe particle pulverization and direct electric disconnection from the current collector. The TEM image of the cycled sample in Fig. 8d shows direct evidence for this, with a particle size of about
  . That is, the original
  Ge nanoparticles were pulverized to
  ones. Similar behavior was observed in mesoporous tin phosphate anode material with a cellular foam structure.
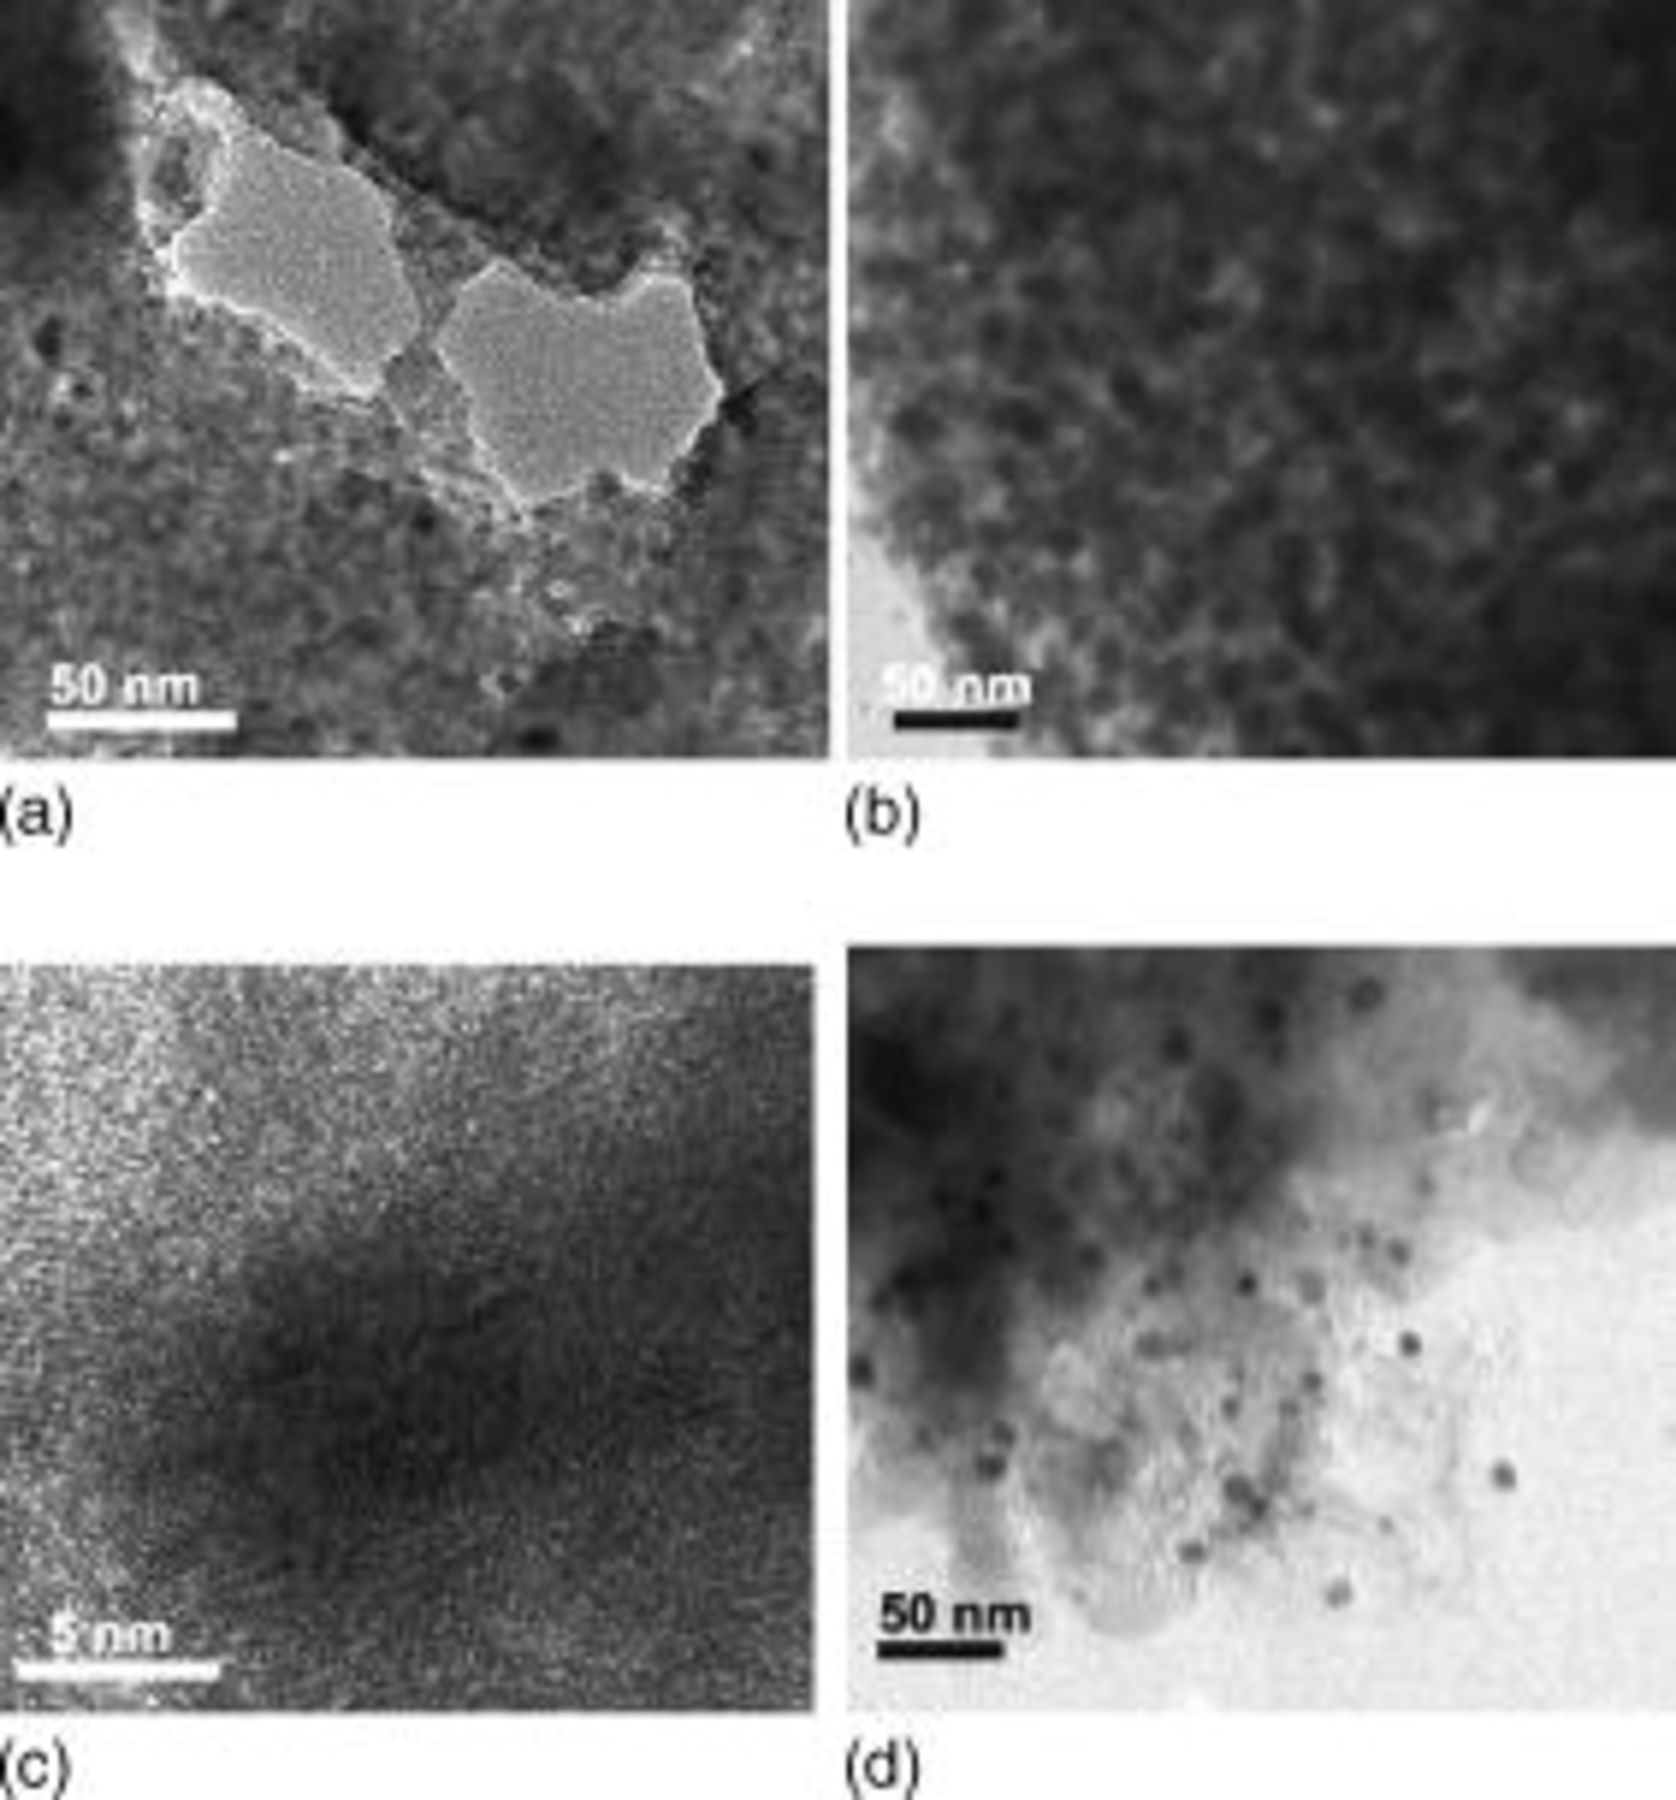
Figure 8. TEM images of the samples after annealing at  for (a)
  and (b and c)
  , and (d)
  for
for  after cycling; (c) is an expanded TEM image of (b).
Conclusions
Ge nanoparticles, surrounded by carbon, showed the best electrochemical performance when the butyl-capped Ge nanoparticles were annealed at  for
for  . The first charge capacity was
  , with an 88% capacity retention after
  . We believe that this effect was associated with the carbon layer, which acted as a buffer layer for volume expansion of the Ge nanoparticles. More importantly, uniformly formed Ge nanocrystals provided very little volume expansion between Ge and
  during Li alloying/dealloying.
Acknowledgment
This work was supported by the Korea Research Fondation Grant funded by the Korean Government (MOEHRD, Basic Research Promotion Fund) (KRF-2006-003-C00162).
Kumoh National Institute of Technology assisted in meeting the publication costs of this article.