
Abstract
Thermally stimulated luminescence (TSL) of β-Ga2O3 single crystals doped with Cr3+ and Mg2+ impurities was investigated. Based on the correlation between the Cr3+ concentration and light sum accumulated in the thermoluminescence (TL) glow peak at 285 K, it was concluded that doping of β-Ga2O3 with Cr3+ ions leads to the formation of electron traps manifested in this peak. The activation energy of peak at 285 K is equal to Ec-0.55 eV and close to E1. Thus the Cr3+e− centers can be a candidate for E1. The high-temperature TL glow peak at 385 K (Ec-0.94 eV) is related to oxygen vacancies which are created in gallium oxide doped by Mg2+ ions to compensate for the negative charge formed by the substitution of gallium sites by magnesium ions.The co-doping of β-Ga2O3 crystals with Cr3+ and Mg2+ impurities leads to the appearance of a new TL glow peak at 320 K with an energy close to E*2 (Ec-0.7). It is suggested that this peak is formed by defect complex, in particular, oxygen vacancies with Cr3+ or Fe3+ ions.
Export citation and abstract BibTeX RIS

This is an open access article distributed under the terms of the Creative Commons Attribution Non-Commercial No Derivatives 4.0 License (CC BY-NC-ND, http://creativecommons.org/licenses/by-nc-nd/4.0/), which permits non-commercial reuse, distribution, and reproduction in any medium, provided the original work is not changed in any way and is properly cited. For permission for commercial reuse, please email: oa@electrochem.org.
Gallium oxide β-Ga2O3 belongs to the semiconductor oxide family. It is an attractive wideband Eg ∼ 4.8 eV material for the optoelectronic devices operating in the far ultraviolet spectral region,1,2 Schottky diodes (SBDs), metal-semiconductor (MESFETs) and metal oxide-semiconductors (MOSFETs) transistors.3–5
Point defects of gallium oxide (intrinsic defects, impurities and their complexes) can create traps that affect the operation of the devices. Defects can be responsible for the reduced sensitivity of photodetectors, the reduction of breakdown voltage and the excessive dark current of transistors, as well as the reduced efficiency of devices.6,7 The development of Ga2O3 for power electronic applications requires knowledge of, and control over, point defects.7 Therefore, point defects in gallium oxide must be identified and their number needs to be reduced to the lowest possible concentrations. The first step towards the identification of defects is to study the energy levels that create impurities and host defects in the bandgap of the crystal.
There are a number of publications devoted to the study and analisis of traps created by impurities or host defects in β-Ga2O3.7–21 Electron traps spectra for β-Ga2O3, measured by deep level transient spectroscopy (DLTS) was first published by Irmscher et al. Ref. 8. The detected deep traps for electrons in β-Ga2O3 crystals were conventionally labelled as E1, E2, and E3. Depths of traps relative to the conduction band minimum were Ec-0.55, Ec-0.74, and Ec-1.04 eV, respectively. Zhang et al.9 performed deep level optical spectroscopy (DLOS) and DLTS to reveal deep traps in EFG-grown bulk β-Ga2O3 single crystals. Energy levels and trap concentrations were very similar to those found in Ref. 8. The DLOS method allowed authors9 to identify deeper levels, labeled as E4 and E5. Ingebrigtsen et al.10,11 also used various experimental methods and hybrid functional calculations to identify deep traps in β-Ga2O3. Luchechko12,13 and Islam14 used the TSL method to study traps in gallium oxide. It should be noted that the TSL method was for many years successfully used to study traps in wideband ionic crystals.22 The traps detected by the TSL method12–14 have activation energies close to the values obtained by the DLTS and DLOS methods.8–11
Various assumptions have been made by different authors regarding the origin of traps in β-Ga2O3. Some of the deep traps were associated with background Fe3+ 8,10,14,16–21 or Co2+ impurities.8 Moreover, the deep level transient spectroscopy results show that the level previously labeled E2 and attributed to Fe consists of two overlapping signatures labeled E2a and E2b related to Fe substituting for Ga on a tetrahedral or an octahedral site, respectively.18 Other researchers propose that some traps in this energy range can be created by native defects, such as oxygen9,11,13,15 or gallium10,14 vacancies. Also, additional new E2* traps with the energy of EC-0.75 eV was detected in neutron-irradiated β-Ga2O3 samples10,15 and may have an intrinsic origin. Since the traps created by various impurities or native defects can have close activation energies, therefore several traps can be located in the same energy range close to E1-E3. So, further studies are needed to establish the nature of the traps and their manifestation in the TSL or DLTS spectra.
Therefore, it is extremely important to determine how the concentration of doping impurities affects various traps. However, we did not find any papers devoted to a detailed study of deep traps with a controlled concentration increase of transition metals impurities, in particular, chromium ions in β-Ga2O3 crystals. Chromium is often presented as a background impurity even in high purity raw materials for β-Ga2O3 crystal growth and in the most pure unintentionally doped (UID) β-Ga2O3 single crystals. Therefore, understanding the processes that take place with the participation of chromium is important for the practical application of gallium oxide. On the other hand, the Cr3+ impurity is one of the best studied impurities in aluminum oxide, garnets and other complex oxide crystals.23 The Cr3+ ions located the octahedral sites have characteristic broad absorption bands (4A2 → 4T1 and 4T2 transitions) in the visible part of the spectrum as well as narrow (R-lines related with 2E → 4A2 transitions) and broad (4T2 → 4A2 transitions) luminescence bands in the red region of the spectrum.24–29 Strong red luminescence of the Cr3+ ions is observed both under the optical excitation within impurity absorption bands and under the excitation by ionizing radiation due to the recombination of charge carriers on the impurities. This luminescence is detectable and easily identifiable in the spectra even at very low concentrations of the chromium impurity (∼1–5 ppm) and is observed in a wide temperature range up to 500–600 K.20,25
The purpose of this work is to investigate TL glow curves of β-Ga2O3 crystals doped with different concentrations of chromium impurities as well as co-doped by chromium and magnesium impurities. It will allow more unambiguously identifying some of the deep traps created in gallium oxide by these impurities, and thereby contribute to further improvement and successful practical use of gallium oxide.
Experimental
The studies were performed on β-Ga2O3 crystals doped with Cr3+ impurity with a concentration that varied from a background concentration to 0.05% and β-Ga2O3 crystals a doped with 0.05% Cr3+ and 0.1% Mg2+ impurities. β-Ga2O3 single crystals for the study were grown by the floating zone technique with radiation heating. The raw material was gallium oxide with 4 N purity. According to the supplier´s specification, gallium oxide contains the following main impurities in ppm (Max): Si ≤ 10, Fe ≤ 5, Cr ≤ 1, Mn ≤ 1, Co ≤ 1. Impurities of chromium oxide Cr2O3 and magnesium oxide MgO with 4 N purity at the appropriate concentration were added to the mixture for the manufacture of ceramic rods, which were subsequently used for the crystal's growth. The pressed polycrystalline rods were sintered at a temperature of 1300 °C for 10–12 h. The single crystals were grown along a crystallographic direction of [100]. The growth and rotation rates of the sintered rods were 2–4 mm per hour and 6 rpm, respectively. The growth atmosphere was the air. The β-Ga2O3 crystals obtained had a length of up to 30 mm and a diameter of 5–7 mm. Samples for study 0.5 mm thick were cleaved from the grown crystals along the plane (100).
It was found that the luminescence yield of chromium impurity and TSL in gallium oxide crystals highly dependent on the conductivity of the crystals. As-grown samples were high-conductive and had very low luminescence yield of chromium impurity and TSL was absent. Also, it was experimentally established that annealing of crystals in an oxygen atmosphere leads to both a decrease in conductivity and an increase in the luminescence yield. After prolonged annealing in an oxygen atmosphere, all samples became high resistivity and the luminescence yield was maximal.
Prior to all studies, crystals with different concentrations of Cr3+ impurity were subjected to the same annealing in an oxygen atmosphere for 100 h at a temperature of 1300 °C. It should also be noted that all samples of β-Ga2O3:Cr crystals became high resistivity after annealing in an oxygen atmosphere. The activation energies of the conductivity of annealed crystals were ∼0.8 eV for β-Ga2O3:Cr crystals and ∼1 eV for β-Ga2O3:Cr, Mg crystals. All studies of luminescence and TSL were performed on such high-resistivity crystals of the same thickness.
Photoluminescence measurements were carried out on spectrofluorometer CM2203 in the 230–820 nm spectral range. Luminescence spectra were obtained with a spectral resolution of 0.5 nm. Hamamatsu R928 photomultiplier was used for luminescence detection. Photoluminescence spectra were automatically corrected by lamp intensity and photomultiplier tube sensitivity, respectively.
To measure the thermoluminescence (TL) glow curves, the β-Ga2O3 samples were exposed to X-ray irradiation for 20 min at 225 K. X-ray irradiation was provided by a microfocus X-ray tube URS-002 with copper anticathode (U = 45 kV, I = 0.3 mA) through the beryllium window of a cryostat. The TL glow curves of gallium oxide were recorded on a red luminescence band of Cr3+ impurity in the linear heating mode at the temperature increase rate of 0.1 K s−1. The emission wavelengths were selected by an SF-4A monochromator. The irradiation of the crystals and the subsequent registration of thermoluminescence were performed through a calibrated diaphragm.
Results
As-grown unintentionally doped (UID) β-Ga2O3 crystals had a blue color. After annealing in an oxygen atmosphere at 1300 °C during 100 h, the undoped β-Ga2O3 crystals became colorless. β-Ga2O3 crystals doped with Mg2+ impurity was colorless immediately after growing, and their annealing in an oxygen atmosphere did not lead to any noticeable color changes of the crystals.30 As-grown β-Ga2O3 crystals doped with Cr3+ impurity had a green coloration. The color saturation of crystals changed from weakly to dark green with increasing concentration of chromium impurity. The color of β-Ga2O3: Cr3+ crystals are caused by two broad absorption bands of Cr3+ ions in the visible region of the spectrum. Such broad absorption bands are characteristic for Cr3+ ions in the octahedral sites of crystals.23–29
The luminescence yield of Cr3+ impurity in as-grown β-Ga2O3:Cr crystals was low. It should be noted that it differs by several times for samples grown from the same raw material, but under other growth conditions in particular growth rate, overheating of the melt zone, etc. We found out that the additional annealing of the as-grown β-Ga2O3:Cr crystals in an oxygen atmosphere leads to a strong increase in the Cr3+ impurity luminescence. After annealing during 100 h at a temperature of 1300 °C, the luminescence yield of Cr3+ ions increased by more than 100-times in comparison with the luminescence yield of as-grown β-Ga2O3:Cr crystals. It should also be noted that after such annealing the crystals of β-Ga2O3 doped with Cr3+ impurity become light green. At the same time, β-Ga2O3 crystals co-doped with Cr3+ and Mg2+ impurity had light green color immediately after grown and a high yield of Cr3+ impurity luminescence. The additional annealing of these β-Ga2O3:Cr,Mg crystals in the oxygen atmosphere did not lead to a noticeable increase of luminescence yield of Cr3+ impurity.
Figure 1 shows the luminescence spectra of β-Ga2O3 crystals. The relatively low yield of Cr3+ impurity luminescence was observed in UID β-Ga2O3 crystals with a background concentration of chromium impurity. Broad emission band 300–550 nm with a maximum near 410 nm and a weak Cr3+ impurity luminescence band in the "red" region 650–820 of the spectrum were observed (Fig. 1a). This broad band is complex and related to the luminescence of host defects in β-Ga2O3 crystals.31,32 The spectral composition of the host emission did not change at chromium dopping, but the relative luminescence intensity of the chromium ions increased significantly in the β-Ga2O3:0.05%Cr3+ crystals (Fig. 1b). The co-doping with magnesium impurity of β-Ga2O3: 0.05% Cr3+, 0.1% Mg2+ crystals leads to a further increase in luminescence intensity over the entire spectral range (Fig. 1c).
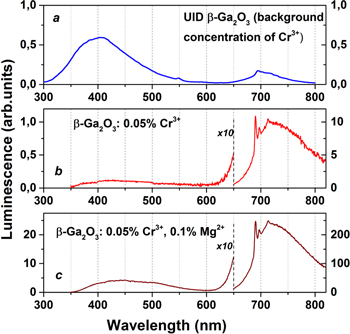
Figure 1. Luminescence spectra of as-grown UID β-Ga2O3 crystals (a), β-Ga2O3 crystals doped with 0.05% Cr (b) and β-Ga2O3 crystals co-doped with 0.05% Cr and 0.1% Mg (c) at 300 K under excitation with a wavelength of 260 nm.
Download figure:
Standard image High-resolution imageIt is known that irradiation of gallium oxide produces non-equilibrium electrons and holes that can be trapped by defects or impurities. The heating of the irradiated crystal is accompanied by the release of trapped carriers and subsequent radiative (or non-radiative) recombination. In order to determine, which of the traps occur as a result of doping, we investigated the TL glow curves of β-Ga2O3 crystals with various Cr3+ impurity concentrations. Figure 2a shows the TL glow curve of a β-Ga2O3 crystal with a background concentration of Cr3+ impurity. The intensity of TL was low as well as the TL glow curve was complex. The deconvolution of this curve into elementary peaks was carried out by the method of temperature cleaning. Obtained results showed that it arises from the overlapping of several simple TL glow peaks.
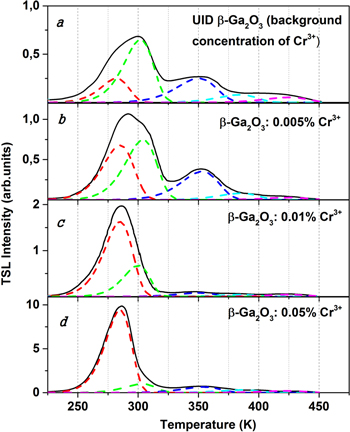
Figure 2. TL glow curves of β-Ga2O3 crystals with various concentrations of chromium impurity.
Download figure:
Standard image High-resolution imageAs a result of deconvolution, five elementary TL glow peaks can be distinguished in the temperature range 225–500 K. The resulting elementary peaks are located at 285, 300, 354, 385 and 430 K. The activation energies of these peaks were 0.55, 0.62, 0.78, 0.94, and 1.1 eV, respectively. The most intense was the TL glow peak located at 300 K (Fig. 2a). The peaks at 285 K and 354 K were approximately 30% of the intensity of this one. A negligible increase in the concentration of chromium impurity to ∼0.005% (Fig. 2b) leads to a slight increase in the total intensity of TSL. The maximum of the TL glow curve shifts to lower temperatures 290–295 K. The redistribution of the TSL intensity was also observed in favor of the TL glow peak at 285 K for β-Ga2O3:0.005% Cr crystals. The amplitude of this peak increases and becomes equal to the intensity of the peak at 300 K. The TL glow peaks at 354, 385 and 430 K have changed little compared to UID β-Ga2O3 crystals. Further growth of the chromium concentration to 0.01 at% (Fig. 2c) leads to a significant increase in the total TSL intensity. Moreover, the TL glow peak at 285 K becomes dominant on the TSL curve at such concentration. Its amplitude is more than one order higher than the amplitude of other peaks. There is a further increase in both the total and the relative intensity of the peak at 285 K at a concentration of chromium impurities of about 0.05% (Fig. 2d). This TL glow peak becomes the main one and it stored almost all the light sum upon irradiation of the β-Ga2O3:0.05% Cr crystals.
It should be noted, that the intensity of the TL glow peak at 285 K increases from 0.3 to 15 arbitrary units (see Fig. 2) with an increase of chromium concentration from background to 0.05%, relative to the TL glow peak with a maximum at 300 K. The low-intensity TSL peaks at 354, 385 and 430 K in β-Ga2O3:Cr crystals remained practically unchanged at chromium concentrations increasing.
The dependence of the total light sum stored in elementary TL glow peaks (integral under separated peaks) mentioned above on the concentration of chromium impurity in β-Ga2O3:Cr crystals is presented in Table I.
Table I. Dependence of light sum, stored in the separate TL glow peaks on the concentration of Cr3+ impurity in β-Ga2O3:Cr crystals.
| Light sum stored in separate TL glow peaks | |||||
|---|---|---|---|---|---|
| 285 К | 300 К | 354 К | 385 К | 430 К | |
| Concentration of Cr3+ ions, % | Ea = 0.55 eV | Ea = 0.62 eV | Ea = 0.78 eV | Ea = 0.94 eV | Ea = 1.1 eV |
| background content | 7.4 | 20.4 | 10.5 | 3.3 | 2.3 |
| 0,005% | 22.3 | 24.9 | 14.1 | 3.4 | 1.2 |
| 0,01% | 49.4 | 19.1 | 8.6 | 2.1 | 1.7 |
| 0,05% | 260 | 31 | 26 | 12 | 9 |
The TL glow curve of the UID β-Ga2O3 crystals (background content of Cr3+) doped with a 0.1% Mg2+ impurity is shown in Fig. 3a. The complex TL glow curve with a maximum in the temperature range of 380–390 K was observed for these crystals. This glow curve also is the result of the superposition of elementary peaks located at 285, 300, 320, 354, 385 and 430 K. A new peak located at about 320 K appears with the entering of magnesium impurity. Other peaks were observed in Cr3+ doped β-Ga2O3:Cr crystals (see Fig. 2). The TSL peak at 385 K is dominant. The intensity of the new TL glow peak at 320 K was about 0.4 of the peak intensity at 385 K. The intensity of the other peaks is relatively low.
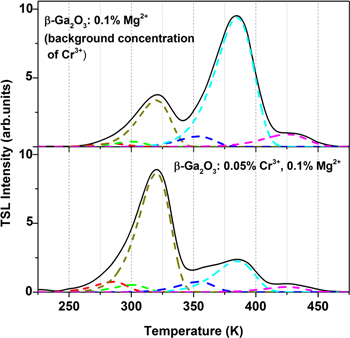
Figure 3. The TL glow curves of β-Ga2O3 crystals co-doped with Cr3+ and Mg2+ impurities.
Download figure:
Standard image High-resolution imageThe TL glow curve, when the concentration of Cr3+ impurity increased to 0.05% and the concentration of Mg impurity remained 0.1% are shown in Fig. 3b. Increasing the concentration of chromium impurity leads to significant changes in the overall shape of the TL glow curve. The maximum of TL glow curve is shifted to the 320–330 K for the β-Ga2O3:0.05%Cr3+, 0.1% Mg2+ crystal. This TL glow curve is also the result of the superposition of the simplest TSL peaks described above. As can be seen, the intensity of the 320 K peak increased at the chromium concentration grows in β-Ga2O3:Cr, Mg crystals. Namely, the TL glow peak at 320 K becomes dominant, while the intensity of the peak at 385 K is only 0.3 from its. The intensity of the low-temperature TL glow peak at 285 K also increases in the Cr3+ and Mg2+ co-doped crystals compared to the β-Ga2O3:0.1% Mg2+ crystals. The intensities of the TSL peaks with maxima at 300 K and 354 K remained actually unchanged in β-Ga2O3: 0.05%Cr3+, 0.1% Mg2+ crystal.
Discussion
The TL glow curves of β-Ga2O3 crystals doped with chromium and co-doped with chromium and magnesium revealed deep traps that manifest in peaks at 285, 300, 320, 354, 385 and 430 K. The traps depths relative to the bottom of the conduction band are EC-0.55, EC-0.62, EC-0.7, EC-0.78, EC-0.94 and EC-1.1 eV, respectively. The Fermi level in the investigated crystals should be located far from the conduction band minimum (CBM) in particular below the depth of the all available electronic traps, which are manifested in the TSL. With such a Fermi-level arrangement, most of these traps are free and can capture the electrons when exposed. At the same time, heating of the irradiated crystals results in the release of electrons with subsequent recombination on Cr4+ ions and the formation of excited (Cr3+)* states. As a result, the luminescence in the red spectral region is observed.
In particular, traps with an activation energy of Ec-0.55 eV that revealed in the TL glow peak at 285 K are the main traps in the Cr3+-doped β-Ga2O3 crystals. The activation energy of this trap is close to the energy of E1.8 The almost linear increase in the light sum stored in this TSL peak is observed when the concentration of Cr3+ impurity increases (see Table I). It should also be noted that the light sum is proportional to the concentration of the traps. The light sum stored in this TSL peak increases about 50 times with a growth of the concentration of Cr3+ impurity from the background to 0.05 at%. Accordingly, such concentration dependence of the 285 K TL glow peak intensity indicates the impurity nature of this trap level. Trapped electrons are localized on oxygen ions in the vicinity of the first coordination sphere of the impurity ion and form the center of Cr3+-e− or recharge the impurity ions from Cr3+ to Cr2+ state.
The TL glow peak near 300 K with an activation energy of ∼Ec-0,62 eV is most noticeable in the UID β-Ga2O3 crystals but it was detected in all Cr3+-doped β-Ga2O3 crystals. Its intensity is weak and practically does not depend on the Cr3+ and Mg2+ impurity concentrations. Therefore, it can be assumed that the traps responsible for the peak at 300 K are formed by one of the background impurities which are entered into the crystal from raw materials for crystal growing. The position and the activation energy of this TL glow peak are in good agreement with the location and energy of the main TSL peak in β-Ga2O3:Fe crystals.14 The negligible discrepancy between the peak maxima may be due to different crystal heating rates during the TSL study (0.1 K s−1 in our case and 1 K s−1 in work14). Therefore, the weak TL glow peak at 300 K can be analog of the peak 310 K registered by authors.14
A peak of TSL with a maximum near 354 K was also observed in all investigated samples. Its intensity did not change with the entering of chromium and magnesium impurities. Its depth of Eс-0.78 eV coincides very well with the trap E2, which is associated with an iron impurity.14,18–21 Therefore, we assume that this TL glow peak at 354 K can be also caused by a background impurity of iron.
The peak at 385 K with activation energies of 0.94 eV is main in Mg2+ doped crystals. Magnesium is known to create acceptor levels near the valence band7,13,17,33,34 and cannot be responsible for this peak. The entering of a divalent Mg2+ impurity in gallium oxide requires charge compensation to maintain the electroneutrality of crystals. The oxygen vacancies must be formed to compensate for the negative charge in the crystals doped with Mg2+ ions.13,34 More precisely, to compensate for the charge of each two magnesium atoms, one oxygen vacancy will be formed. So the TSL peak at 385 K can be associated with the release of electrons from the oxygen vacancies.
The weak peak of the TL with a maximum near 430 K has an activation energy of Eс-1.1 eV close to the energy level of the E3 traps.8 This weak peak was noticeable in all the studied crystals. It can be created by one of the uncontrolled impurities or by intrinsic defects. Further studies are needed to establish the nature of this energy level.
Unlike β-Ga2O3:Cr crystals, in β-Ga2O3 crystals co-doped with Cr3+ and Mg2+ impurities, the main one is the TL glow peak at 320 K with activation energy 0.7 eV. This peak did not occur in TSL of β-Ga2O3:Cr crystals with different concentrations of Cr3+ ions. This additional peak is new and appears only in the co-doped β-Ga2O3:Cr, Mg crystals. Moreover, the intensity of this peak increases when chromium content growth at a constant concentration of magnesium ions and an accompanying decrease in the 385 K peak intensity (see Fig. 3). This allows us to assume that the formation of these traps, occurs due to the same defects as for peaks at 285 and 385 K in the crystals β-Ga2O3: 0.05%Cr and β-Ga2O3: 0.05%Cr, 0.1%Mg, respectively. Since the deep traps EC-0,55 eV (peak at 285 K) are formed by Cr3+ ions, and the traps EC-0,94 eV (peak at 385 K) are likely to be related to oxygen vacancies, then new traps EC-0.7 can be formed by the association of these simple defects. Located near to the Cr3+ ion, a positively charged oxygen vacancy VO additionally attracts the trapped electron, thereby shifting the trap energy level towards the middle of the band gap forming a new level EC-0.7 (peak at 320 K). Moreover, the Ec-0.7 eV level is close to the level of the E2* state that has been credibly related to native defects produced by irradiation.10 And this natural defect of E2*, which was noticed in the spectra of DLTS of irradiated samples, can be the associate of oxygen vacancy with Fe3+ ions. A similar level but with a slightly higher value of energy (0.75 eV) in the gallium oxide irradiated with protons was also observed by the authors.11 They suggest that the origins of these levels are more likely due to a defect complex than an isolated point defect. Accordingly, the associates responsible for the peak at 320 K can include vacancies of oxygen and Cr3+ or Fe3+. However, further studies are needed to uniquely establish the nature of traps responsible for this TL glow peak.
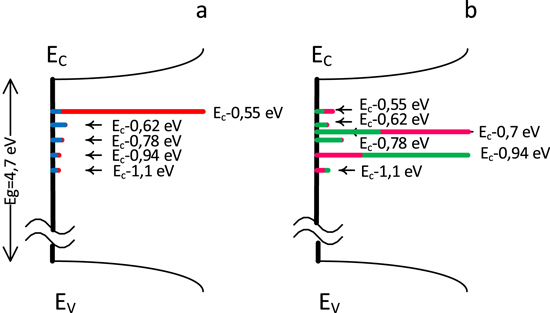
Figure 4 shows the energy scheme of the main traps in β-Ga2O3 crystals doped with Cr3+ (a) and co-doped with Cr3+ and Mg2+ (b) impurities. Chromium creates deep traps for electrons in gallium oxide with an activation energy of EC-0.55 eV manifested in TL glow peak at 285 K (Fig. 4a, red column). New traps with energy EC-0.7 eV are created by defects associations Cr3+−VO in co-doped with Cr3+ and Mg2+ impurities β-Ga2O3 crystals. Deep traps EC-0.94 eV are related to oxygen vacancies.
Figure 4. Energy diagram and trap levels in gallium oxide crystals: (a) UID β-Ga2O3—blue lines and β-Ga2O3:0.05%Cr3+—red lines; (b) β-Ga2O3:0.1%Mg2+—green lines and β-Ga2O3:0.05%Cr3+, 0.1%Mg2+—magenta lines.
Download figure:
Standard image High-resolution image
Conclusions
The results of the TSL studies of β-Ga2O3 single crystals doped with Cr3+ and co-doped with Cr3+ and Mg2+ impurities are presented. The growth of the chromium content from the background concentration to 0.05% is accompanied by an increase of the intensity of this peak by about 50 times. It was established that doping with the Cr3+ leads to the formation of electron traps with a depth of EC-0.55 eV manifested in the TL glow peak with a maximum at 285 K. A TSL peaks at 300 and 354 K were observed in all investigated samples and its intensity did not change with the entering of Cr3+ and Mg2+ impurities. They can be caused by a background impurity of iron. The deeper traps EC-0.94 eV (Tm = 385 K) is related to oxygen vacancies which are formed in the crystals when doped with divalent impurities, for example, Mg2+ ions. The co-doping of β-Ga2O3 crystals with Cr3+ and Mg2+ impurities leads to the appearance of new traps with a depth of EC-0.7 eV and, accordingly, a new TL glow peak with a maximum near 320 K appears.
It has been established, that the TSL peak at 285 K is caused by the release of the electrons trapped by the Cr3+ ions (Cr3+e−-centers) and the TSL peak at 385 K is caused by the release of the electrons from the defects related to oxygen vacancy. It was also suggested that the TSL peak at 320 K is caused by the release of the electrons from the associate centers formed by impurity and native defects in particular oxygen vacancies.
The obtained results indicate that at sufficiently high concentrations of dopants or intrinsic defects it is necessary to consider the interaction of closely spaced charged defects because such interaction can lead to changes in traps activation energy. Moreover, since chromium creates trap levels at Ec-0,55 eV, in the manufacture of high-resistive substrates of gallium oxide for high-power devices, it is necessary to use raw materials with the lowest possible content of chromium impurity.
Acknowledgments
The work was partially supported by the Ministry of Education and Science of Ukraine (project no. 0118U003612).