
Abstract
Reduction in the internal resistance of lithium-ion batteries (LIBs) is an inevitable task to practical application of LIBs to electric vehicles. In this study, we focused on electronic resistances in composite electrodes derived from conductive materials. As electronic conductive materials, acetylene black and fine graphite particle were used. Electronic resistances of electrode-slurries and composite electrodes with different conductive materials were investigated and it was found that the kind of conductive materials strongly influenced direct current-internal resistances. In the Nyquist plots of symmetric cells, semi-circles assigned to electronic contact resistances at active material/conductive material interface appeared in high-frequency region. Based on the transmission line model, an influence of the electronic contact resistance on charge-transfer resistances was examined.
Export citation and abstract BibTeX RIS
In practical lithium-ion batteries (LIBs), a positive electrode is composed of active material powders, conductive material powders, and polymeric binders and is referred to as a composite electrode.1,2 A capacity of a LIB is determined by the amount of the active material inside the LIB. In order to increase the capacity, the proportion of the active material in the composite electrode must be increased. Carbonaceous materials used as the electronic conductive material and the polymeric binders are electrochemically inactive and thus decrease the capacity. However, the conductive material is indispensable for constructing an electronic conduction network for delivering electrons from a current collector to active materials in the composite electrode. Therefore, the appropriate amount of conductive material for constructing the electronic conduction network should be considered. Because electrons are conducted in the composite electrode, the electronic resistance must be a component of the internal resistances of LIBs. Although there have been many studies of different kinds of conductive materials and their dispersion state in the electrode-slurries, detailed research on an influence of the electronic resistance on the internal resistances has not been carried out.3–11
Regarding the influence of the electronic resistance on the performance of LIBs, Ligneel et al. and Mandal et al. showed that the reversible capacity of the positive electrode varied with the amount of conductive material,11,12 and Liu et al. reported that the electrochemical reaction was non-uniform on the basis of broadening of the redox peak in cyclic voltammograms.13 From the viewpoint of the dispersion of the conductive materials, Li et al. and Porcher et al. found that the IR drop decreased when the conductive materials were well dispersed in the composite electrode.14–16 Using alternating current (AC) impedance spectroscopy, Patey et al. concluded that the impedance was decreased by improving the dispersion of the conductive materials,17 and Zheng et al. and Lu et al. reported that pressing of the composite electrode brought about an increase in the electronic conduction network and the impedance decreased.18,19 In many reports, it was pointed out that the improvement of the electronic conductivity of the composite electrode enhanced the cycling performance of LIBs. However, the differentiation of the electronic resistance from the internal resistance and the influence of the electronic resistance on the charge-transfer process have not been discussed.17
The internal resistance of the composite electrode is composed of the ionic conduction resistance, the electronic conduction resistance, and the reaction resistance related to lithium ions.20 So far, resistances related to ions have mainly been investigated and the electronic conduction resistance has not been considered. Several equivalent circuits have been proposed as models of the internal resistance of the composite electrode. A well-known equivalent circuit for a porous electrode is the transmission line model (TLM) based on a cylindrical pore, as proposed by Devie. This model is used to determine the ionic conduction resistance in the composite electrode, and the electronic conduction resistance is not considered.21,22 However, when the electronic resistance in the composite electrode is high, the large IR drop that results may influence the reaction distribution in the composite electrode. Orikasa et al. measured the electronic resistance in the composite electrode during battery operation. In the literature, electronic conductivity of the composite electrode in the in-plane direction has been measured, but the direction of electron-transport is perpendicular to the composite electrode in practical LIBs.23 Therefore, it is necessary to assume that the electronic conduction is isotropic to consider the obtained electronic resistance as the electronic resistance of the composite electrode. However, because the composite electrode used in practical LIBs is pressed, the orientation of the conductive materials should be considered. Therefore, it is necessary to analyze the detailed electronic resistance in the composite electrode.
In this study, the electronic resistance of the composite electrode is investigated via AC impedance spectroscopy of a symmetric cell.24 In order to emphasize the electronic resistance due to the electronic conductive material, three kinds of carbonaceous conductive materials (acetylene black (AB), fine graphite particle, and AB + graphite) are used. The Nyquist plots are interpreted in combination with electronic volume resistivities and rheological properties of the electrode-slurries based on our previous method.25
Experimental
Mg-doped LiCoO2 (Mg-LCO) particles (average particle size of 6.5 μm and BET surface area of 0.43 m2 g−1) were synthesized from a mixture of Li2CO3 and Co3O4 doped with 2 mol% Mg by a solid-state method. As conductive materials, AB (average primary particle size of 40 nm) and graphite (KS-4, maximum particle size of 4 μm) were used. Mg-LCO particles were mixed with the conductive materials, polyvinylidene difluoride (PVdF) in 1-methyl-2-pyrrolidone (NMP), and NMP using a mechanical stirrer. The weight ratio of the electrode-slurry was Mg-LCO:conductive material:PVdF = 95:3:2 wt%. In the case when AB + graphite was used as the conductive material, the ratio of AB:graphite was set at 1.
The obtained electrode-slurry was cast on a polyethylene terephthalate (PET) strip or aluminum foil to give a composite layer and a composite electrode, respectively. The electronic volume resistivity of the composite layer on the PET strip was measured by the four-point probe method. A direct current-internal resistance (DC-IR) test and AC impedance spectroscopy were performed using a symmetric cell. A half-cell was assembled from a composite electrode (20 mm × 20 mm), lithium metal foil, an electrolyte of 1.25 mol dm−3 LiPF6 dissolved in ethylene carbonate (EC)/ethyl methyl carbonate (1:3 by volume), and a microporous polyethylene separator. The specific parameters for composite layers on PET strip and composite electrodes on Al foil were summarized in Table I. After the potential of the half-cell was adjusted to 4.0 V vs. Li+/Li, the symmetric cell was assembled with two composite electrodes. Galvanostatic polarization measurements were performed using an electrochemical apparatus. The open-circuit cell voltage was measured at first, and then the cell was charged at a current of 7.2 mA for 10 s from the open circuit at various temperatures. The voltage after the current pulse was measured for 10 s. The value of DC-IR was calculated from the following equation:
![Equation ([1])](https://content.cld.iop.org/journals/1945-7111/164/14/A3862/revision1/d0001.gif)
where V0 is the open-circuit voltage, V1 is the voltage recorded at 10 s after the current pulse, and I is the current. The reason of choice of 10 s after current pulse is to evaluate the influence of the electronic resistances derived from the conductive materials on battery performances under operating condition. AC impedance spectroscopy was carried out at an AC voltage of 10 mV in the frequency region from 100 kHz to 10 mHz.
Table I. Specific parameters for composite layers on PET strip and composite electrodes on Al foil.
| conductive carbon | loading (mg cm−2) | coated porosity (%) | calendared porosity (%) | thickness (μm) | theoretical capacity (mA h g−1) | theoretical capacity (mA h cm−2) | |
|---|---|---|---|---|---|---|---|
| PET strip | AB | 30 | 70 | 33 | 100 | - | - |
| AB+graphite | 30 | 66 | 33 | 97 | - | - | |
| graphite | 30 | 53 | 33 | 95 | - | - | |
| Al foil | AB | 30 | 70 | 33 | 100 | 121 | 362 |
| AB+graphite | 30 | 66 | 33 | 97 | 121 | 373 | |
| graphite | 30 | 53 | 33 | 95 | 121 | 381 |
The electronic volume resistivity of the electrode-slurry was measured by AC impedance spectroscopy utilizing a rheometer. The details are shown in previous paper.25 In addition, measurements of steady-flow viscosity and dynamic viscoelastic behavior were carried out on the electrode-slurry at 25°C with a strain-controlled rheometer, and the viscosity as a function of the shear rate and the dynamic storage modulus (G') as a function of the angular frequency (ω) were determined. Cone plate fixtures with a gap angle of 0.02 rad and a plate diameter of 50 μm were used.
Results and Discussion
Figure 1 shows DC-IR values obtained from symmetric cells at each temperature. The DC-IR values followed the order of AB < AB + graphite < graphite and decreased with an increase in temperature. In particular, the DC-IR value was highest at −20°C in all symmetric cells. This was because the activation energy of the interfacial lithium-ion transfer resistance was reported to be high (50–60 kJ mol−1) when an EC-based electrolyte is used,26 and the interfacial lithium-ion transfer resistance increases at low temperatures. On the other hand, the interfacial lithium-ion transfer resistance decreases at high temperatures; therefore, the change in the DC-IR value became gradual above 0°C. This result showed that the ionic conduction resistance and the electronic conduction resistance, which had low activation energies, provided the main contribution to the DC-IR value at high temperatures.
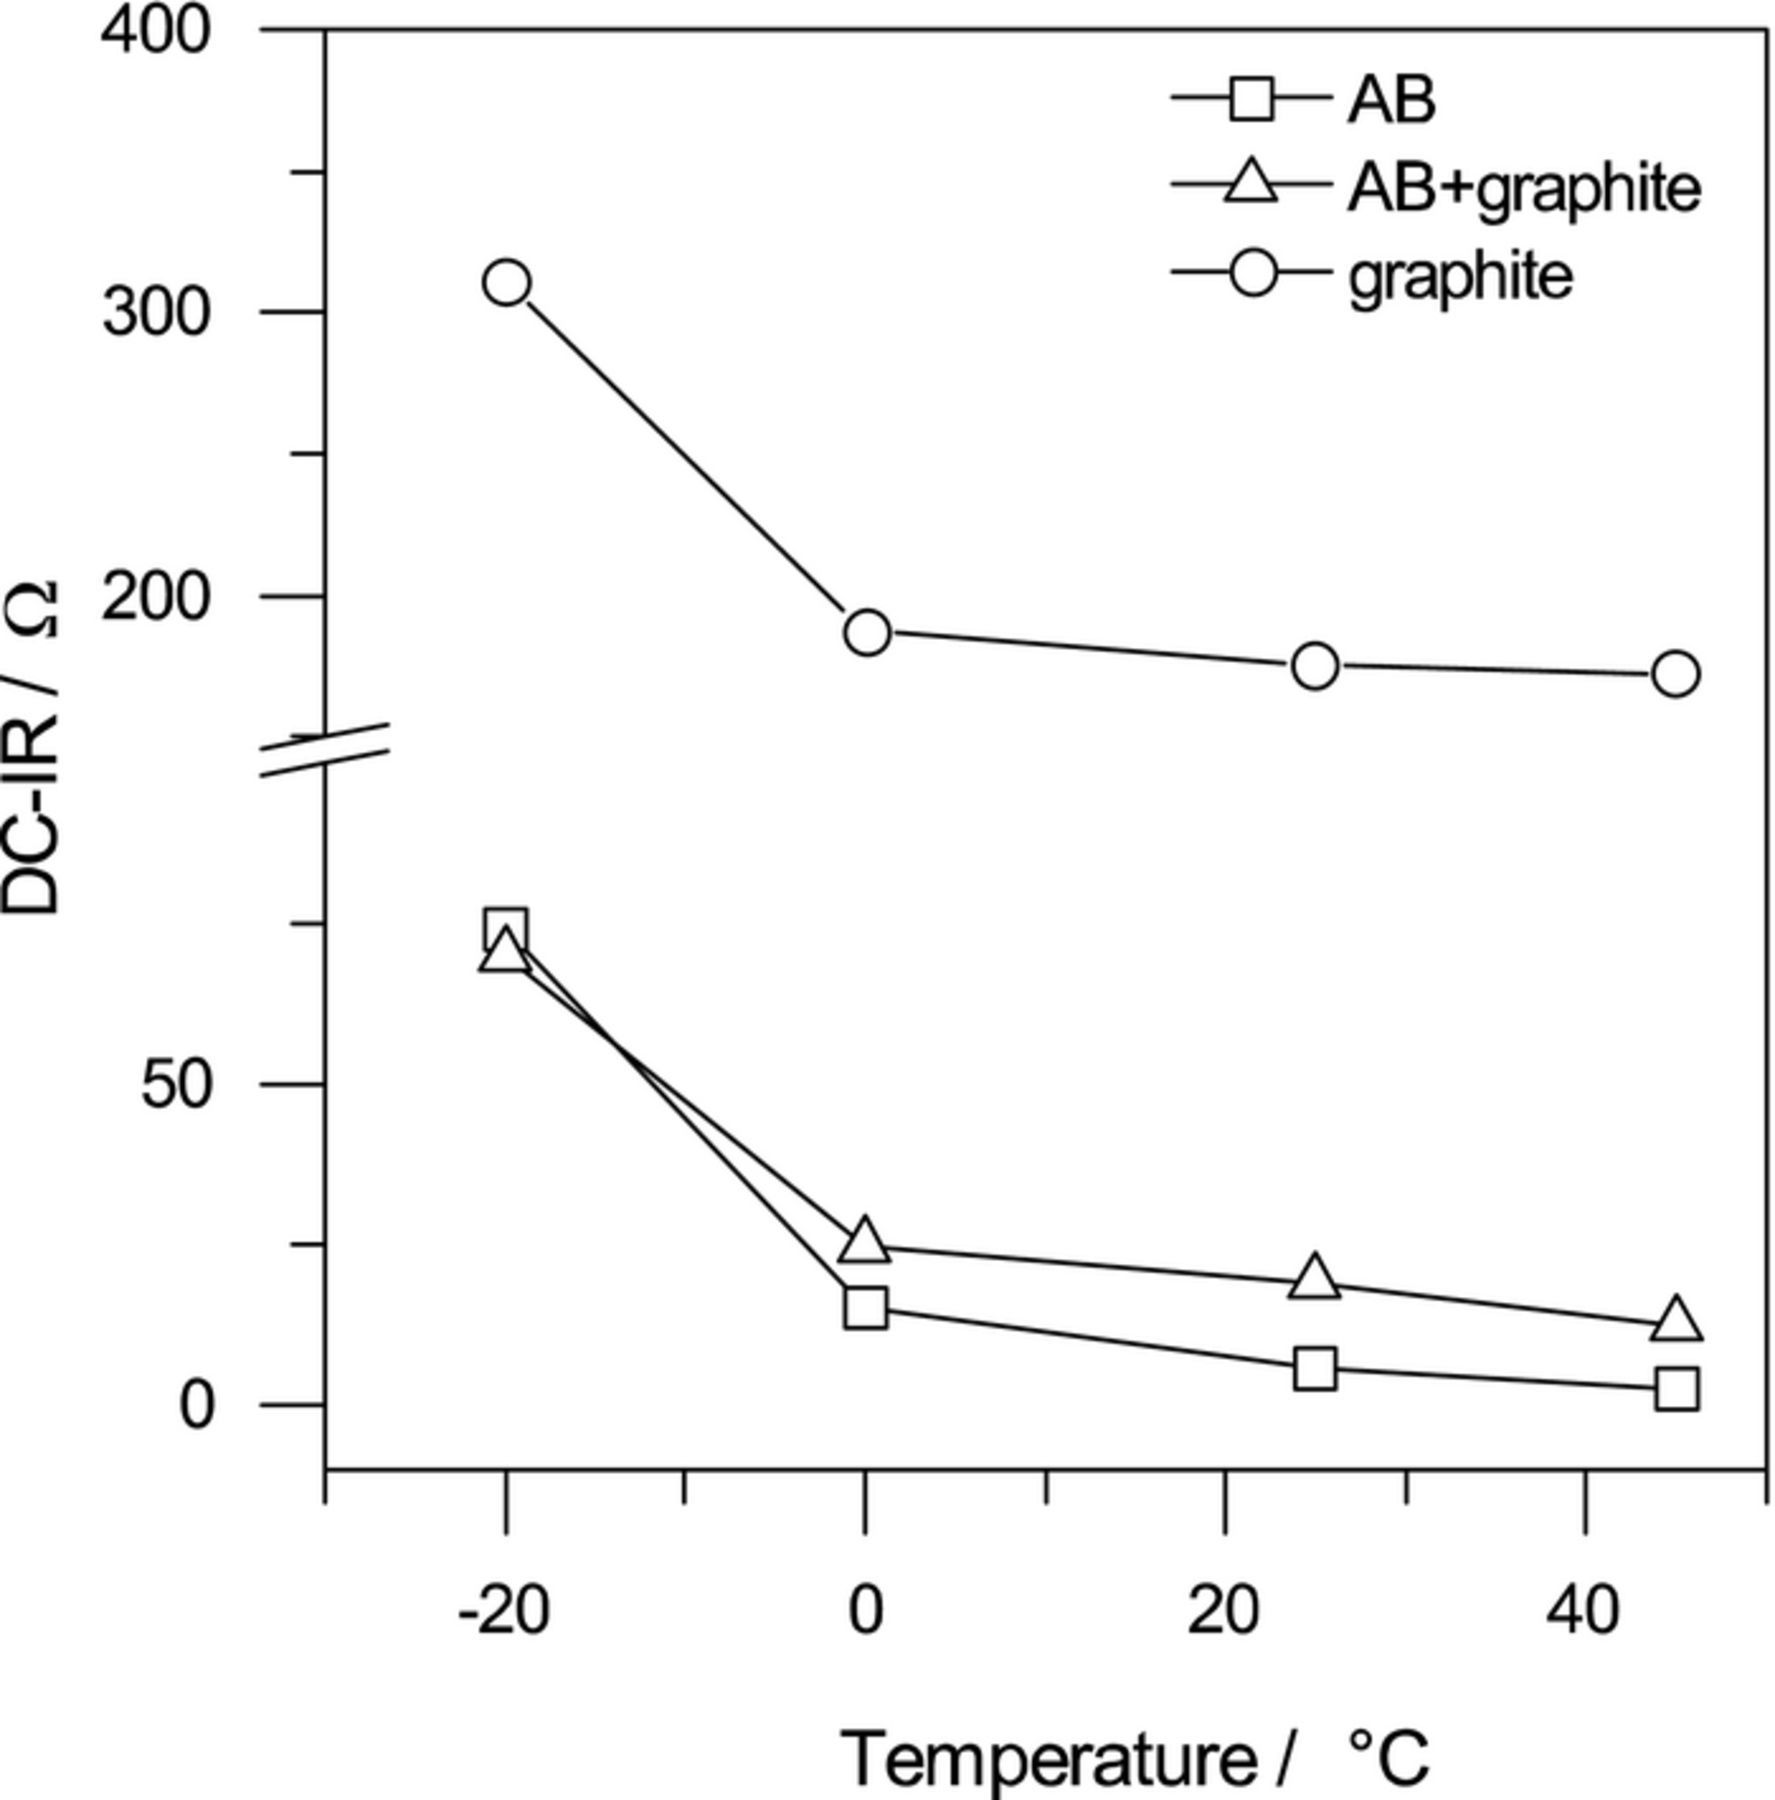
Figure 1. DC-IR values of each symmetric cell at various temperatures.
In order to investigate the influence of the conductive material on the internal resistance, the rheological analysis of the electrode-slurry was carried out at first. AB has a developed network structure, and its structural properties gave rise to shear thinning owing to the steady-state viscosity and as a plateau in the plot of G' at low frequency owing to the dynamic viscoelasticity. Figure 2 shows the steady-state viscosities and the dynamic viscoelasticities of the electrode-slurries. The electrode-slurry containing AB + graphite behaved more like AB than graphite. Because the content of AB was 1.5 wt% and the network that formed in the electrode-slurry was constructed from AB rather than graphite, as shown in our previous paper,27 it is thought that the network structure in the electrode-slurry comprised AB when AB + graphite was used. Figure 3 shows the electronic volume resistivities of the electrode-slurries (ρvs) and the composite sheets (ρve). The ρvs values of the electrode-slurry for AB + graphite were intermediate between those for AB contents of 1 wt% and 2 wt% given in a previous paper,26 and it was confirmed that the electronic conduction network was constructed from AB. The ρve values for AB + graphite were higher than for AB, although they were less scattered than for graphite. This was probably due to a decrease in the amount of the electronic conduction paths in comparison with AB, because the AB content was small and graphite is an anisotropic conductor.
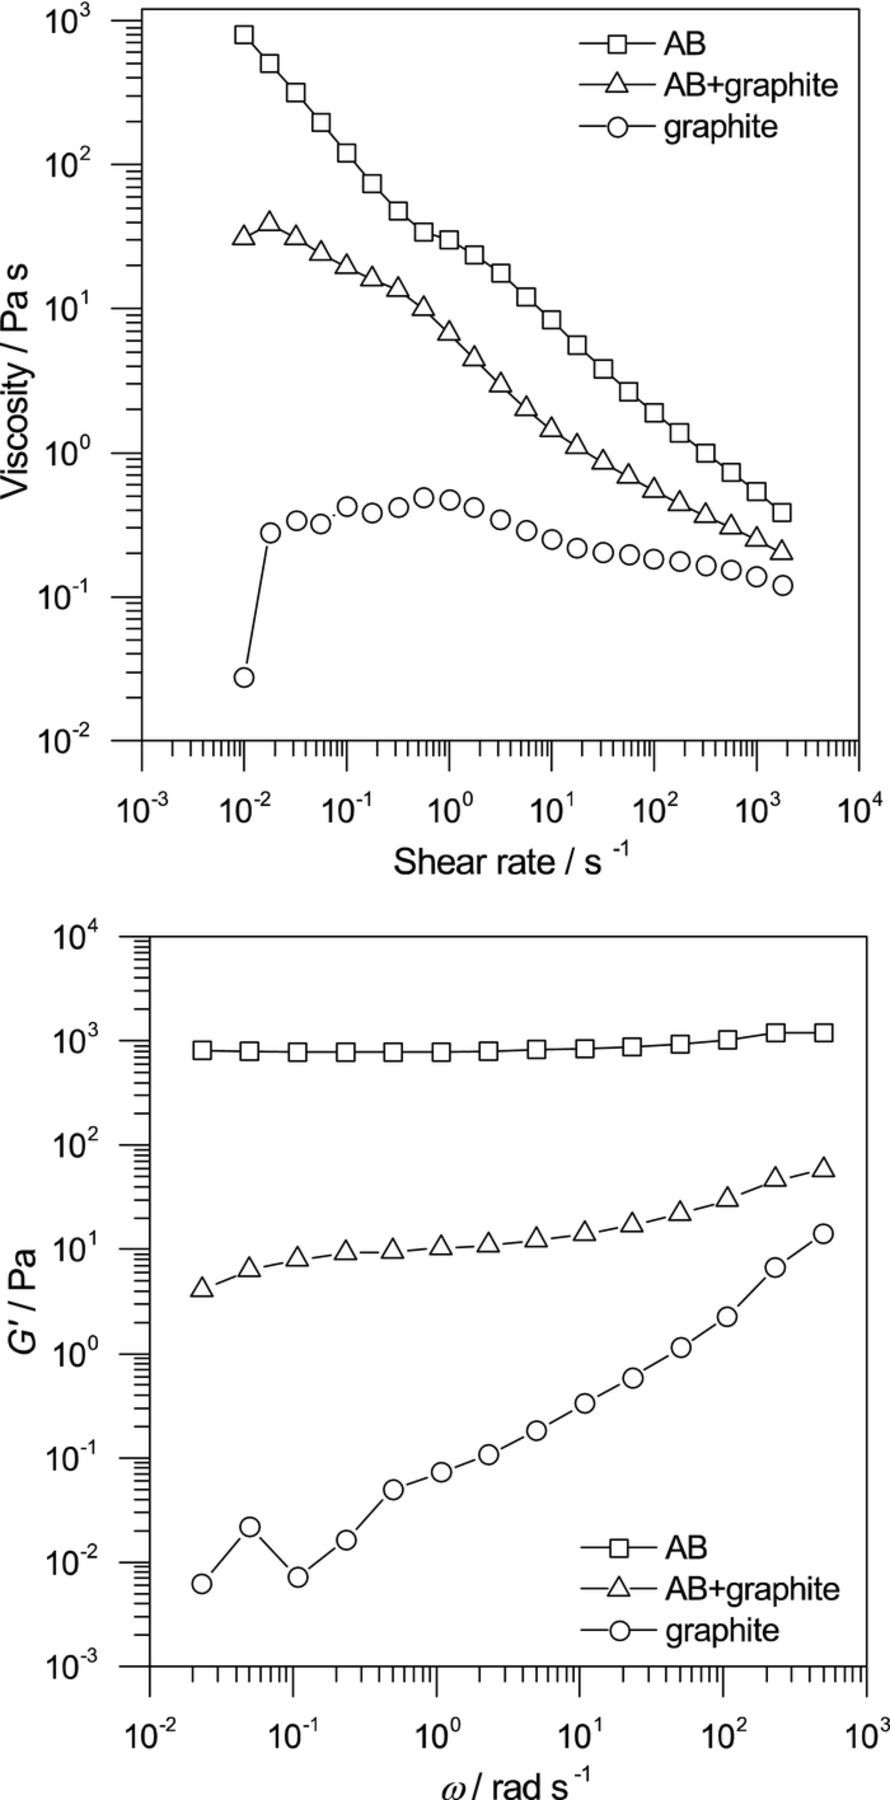
Figure 2. (a) Steady-state viscosity and (b) dynamic viscoelasticity of the electrode-slurries.
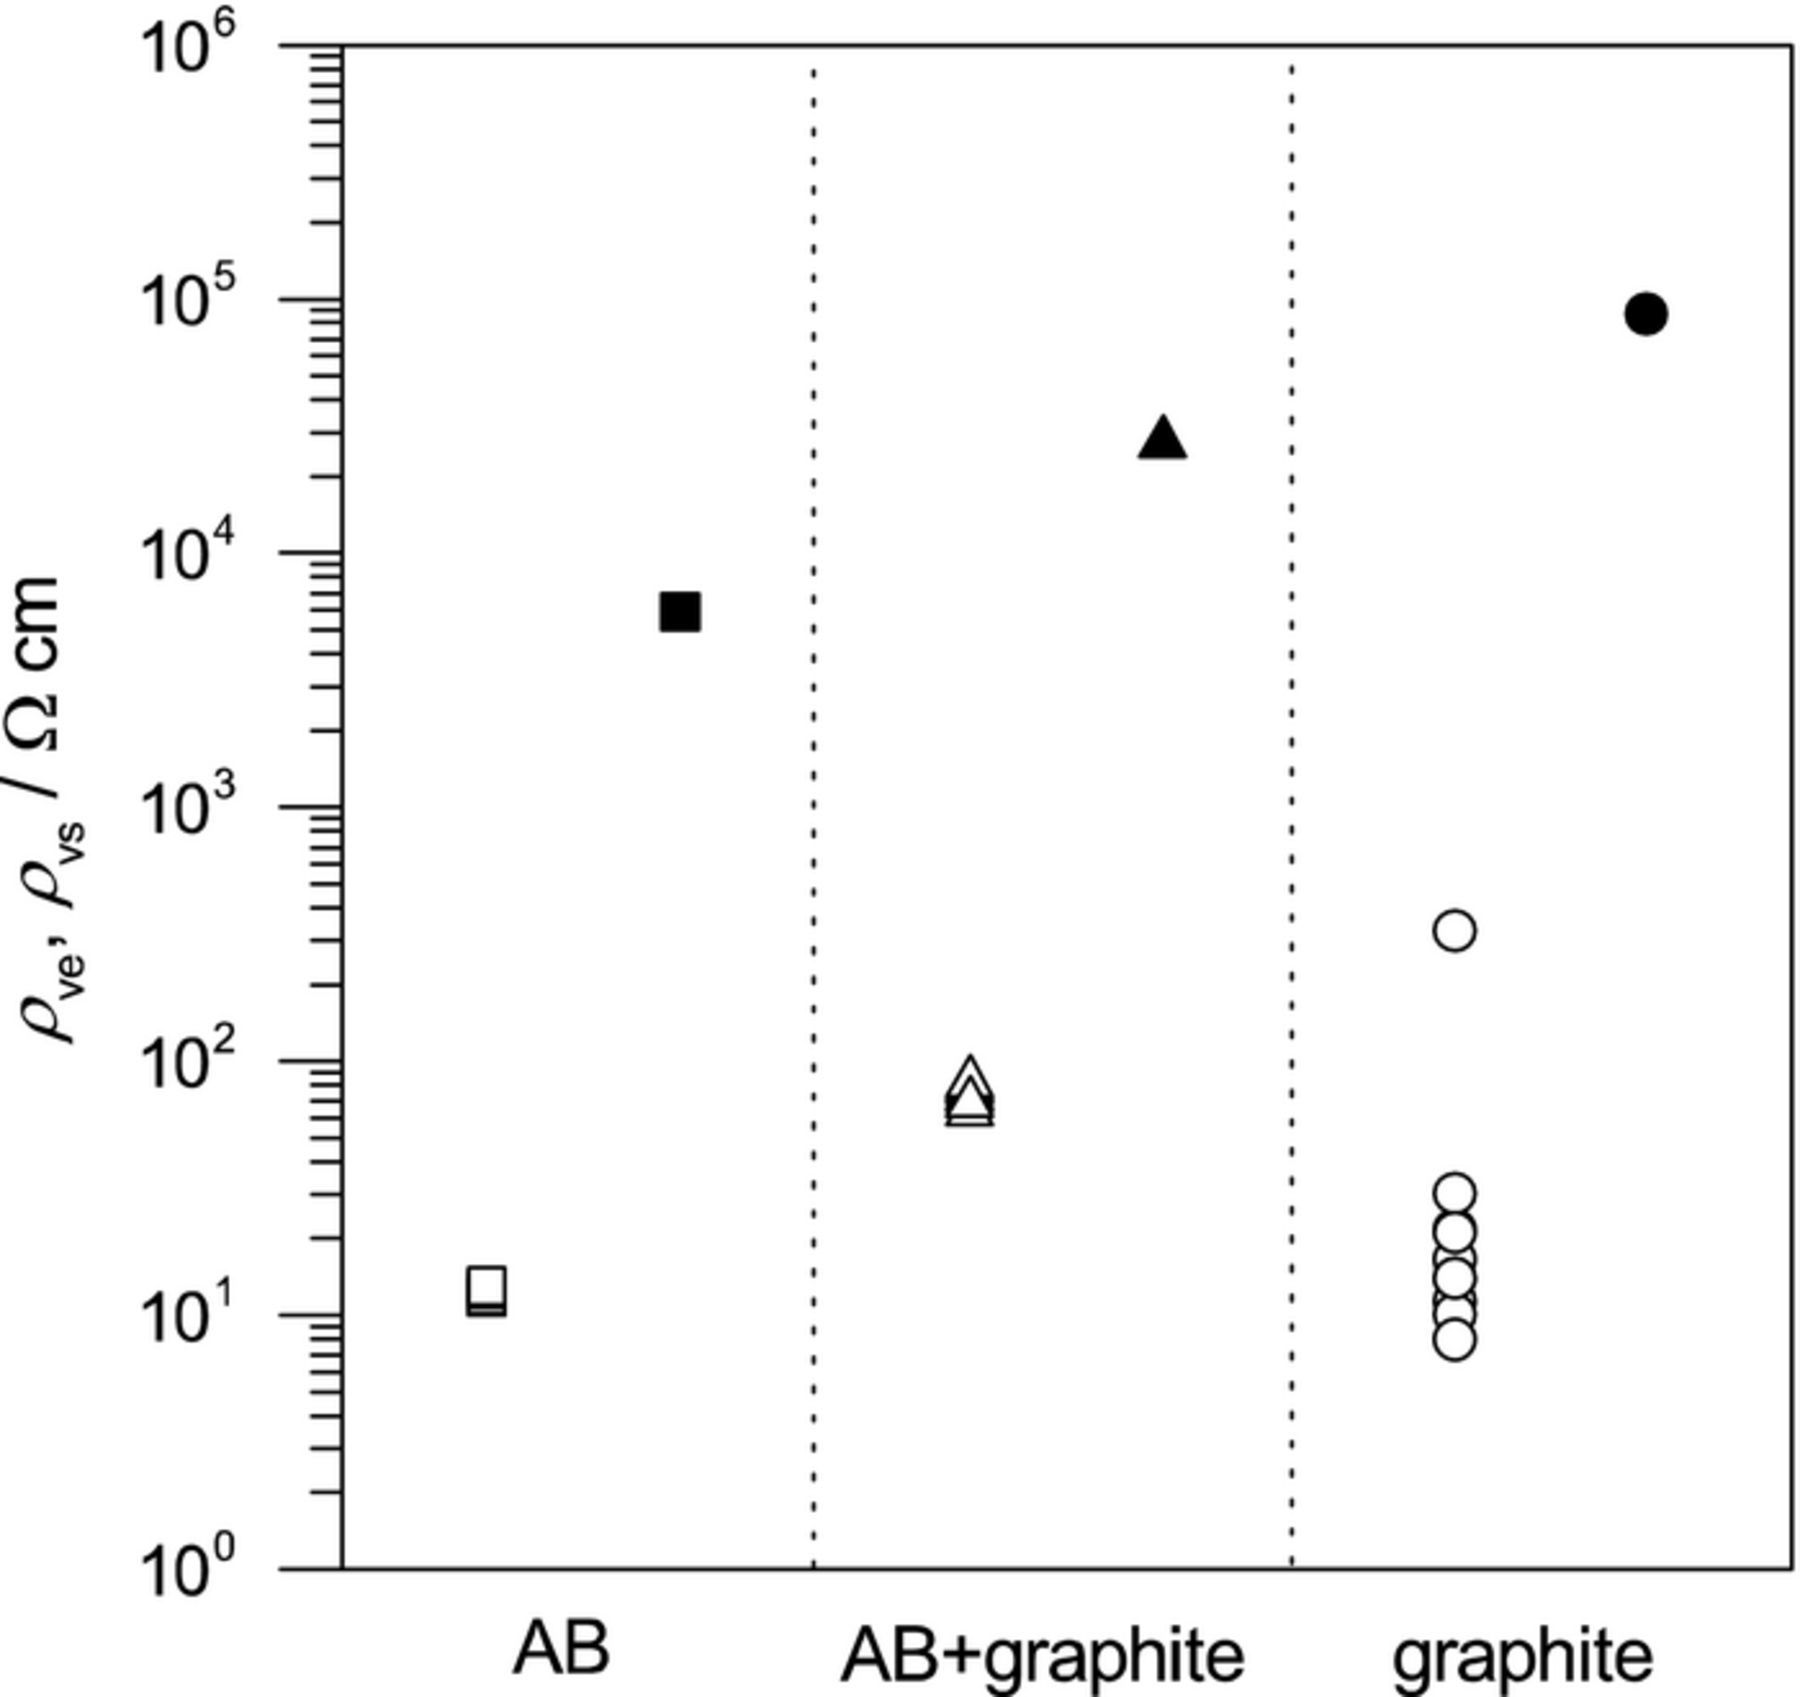
Figure 3. Electronic volume resistivity of the electrode-slurries (closed symbols) and the composite sheets (open symbols).
In order to investigate the influence of differences in conductive materials on the internal resistance in more detail, AC impedance spectroscopy was carried out on symmetric cells at various temperatures. Figure 4 shows the Nyquist plots for each symmetric cell at various temperatures (a: AB, b: AB + graphite, and c: graphite). The right-hand panels are enlargements of the high-frequency region. At first, we focused on the low-frequency region. As shown in Fig. 4a for AB, a clear semi-circle at a characteristic frequency of about 100 mHz was observed at −20°C. This semi-circle became smaller and distorted with an increase in temperature. In the case of AB + graphite (Fig. 4b), a clear semi-circle similar to that for AB was observed at −20°C, which also decreased as the temperature increased. As shown in Fig. 4c, a semi-circle in the low-frequency region was observed at −20°C. However, when the temperature increased this semi-circle overlapped another semi-circle in the high-frequency region and could no longer be recognized. The semi-circle in the low-frequency region for the symmetric cell has been assigned to the charge-transfer (lithium-ion transfer) process at the active material/electrolyte interface.24 In Table II, the obtained charge-transfer resistances (Rct) obtained by the instant fitting of the semi-circles in the low-frequency region like a Fig. 4b are shown. The semi-circles were difficult to distinguish for AB + graphite and graphite above 25°C and 0°C, respectively; therefore, not all Rct values could be obtained. The activation energy determined from the temperature dependence of Rct was calculated to be 49 kJ mol−1 for AB, which corresponded to the activation energies of the interfacial lithium-ion transfer resistance in EC-based electrolytes.26 From this result, it was confirmed that the semi-circle in the low-frequency region can be assigned to the charge-transfer process. Next, we focused on the semi-circles observed in the high-frequency region, which appeared to be distorted, and their sizes depended on the kind of conductive material used. Because the size of these semi-circles increased in the order of AB < AB + graphite < graphite, it was found that this semi-circle should be derived from the electronic resistance related to the conductive material. In this case, a capacitance element should exist in parallel with the resistance. The interface between the active material and the conductive material can be considered to be such an element, because the active material and conductive material are in contact with each other and the electrolyte solution can diffuse into the space near the interface, which gives rise to the capacitance element. Therefore, the semi-circle can be assigned to the electron-transport process at the active material/conductive material interface, and the size of the semi-circle gives the electronic contact resistance (Rc). Since the electronic contact resistance between the conductive material and the current collector cannot be distinguished from Rc, the value of Rc would contain the electronic contact resistance between the conductive material and the current collector. In addition, the intercept of the semi-circle in the high-frequency region with the real axis was assigned to ionic conduction in the composite electrode and separator, because the activation energy was calculated to be about 20 kJ mol−1, which is similar to that of the ionic resistance of the electrolyte solution.28 From the above considerations, it was found that the charge-transfer resistance (Rct), the electronic contact resistance (Rc), and the ion-transport resistance of the electrolyte can be determined from the Nyquist plots for the symmetric cell.

Figure 4. Nyquist plots obtained for the symmetric cells at various temperatures (a) AB, (b) AB + graphite, and (c) graphite. The right-hand panels are enlargements of the high-frequency region.
Table II. Charge-transfer resistance of each symmetric cell at various temperatures.
| Rct / Ω | ||||
|---|---|---|---|---|
| −20°C | 0°C | 25°C | 45°C | |
| AB | 88 | 15 | 1.7 | 0.9 |
| AB+graphite | 63 | 10 | - | - |
| graphite | 50 | - | - | - |
From the Nyquist plots, a schematic model of the impedance elements was proposed, as shown in Fig. 5. In this model, with an increase in Rc the two semi-circles overlap because the time constants of the corresponding processes are similar, and it is impossible to separate them. In Fig. 4c, the semi-circle in the high-frequency region exhibited temperature dependence, and it is thought that this semi-circle represented both Rct and Rc. Therefore, the difference in Rct cannot be discussed in the present study, but the difference in Rc (AB < AB + graphite < graphite) is discussed. The difference in Rc reflects the contact area at the active material/conductive material interface. In other words, because the particle size of AB is smaller than that of graphite, the contact area of AB with the active materials is larger than that of graphite, which reduces the electronic contact resistance. This difference in the electronic contact resistance would result in changes in the impedance and the value of DC-IR. It was found that analysis of the electronic conductivity of the electrode-slurry was effective for analysis of the electronic conduction network, and the electronic contact resistance at the active material/conductive material interface can be determined by AC impedance spectroscopy of the symmetric cell. In other words, the electronic resistances in LIBs were clearly distinguished and calculated. In AC impedance spectroscopy of a conventional half-cell, it is difficult to clearly distinguish the electronic resistance. Gaberscek et al. reported that the various electronic resistances appeared in the intermediate-frequency region and overlapped the charge-transfer resistance.29 However, the time constant of the electronic contact resistance is in the high-frequency region, and the influence of the inductance element in large LIBs disturbs the analysis.30 In this study, the use of the symmetric cell with a small electrode area made it possible to distinguish the electronic resistances.
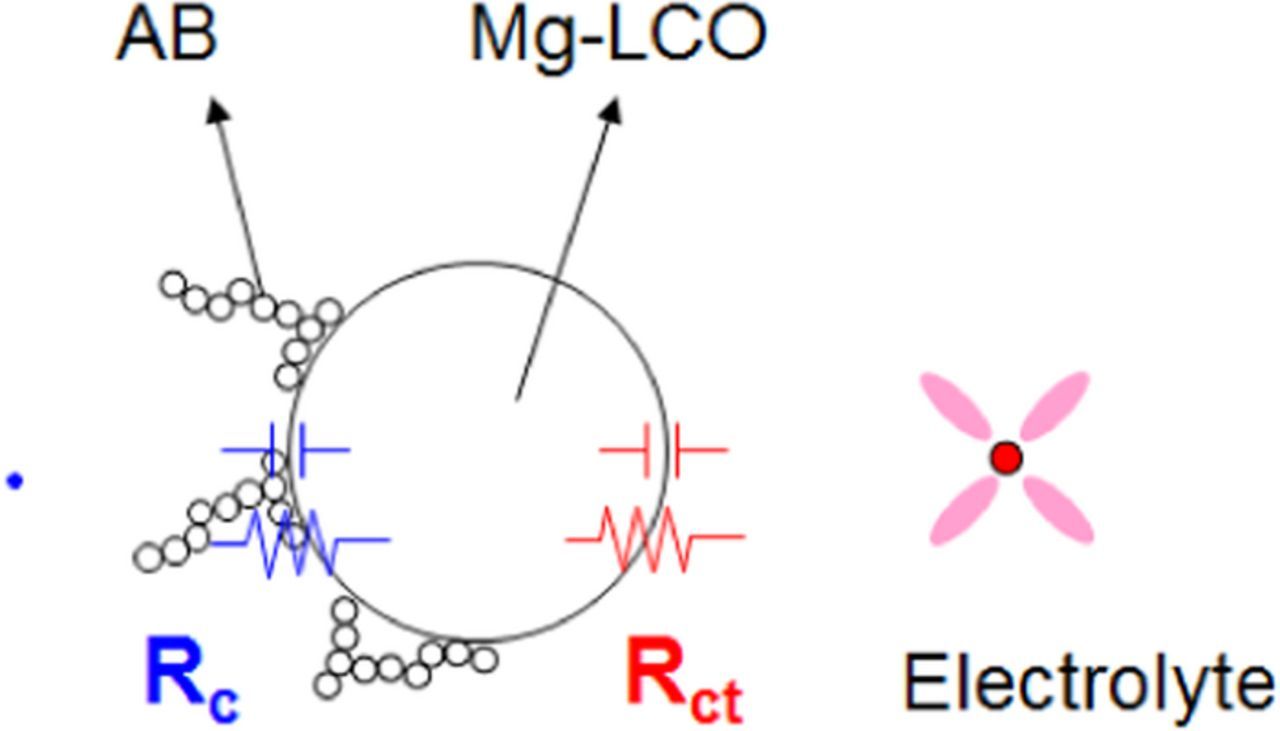
Figure 5. Schematic model of the impedance elements. Rc represents the electronic resistance at the AB/Mg-LCO interface and Rct represents the charge-transfer resistance at the Mg-LCO/electrolyte interface.
Finally, the influence of the electronic resistance on the charge-transfer resistance was considered. The reason why the semi-circle assigned to the charge-transfer process was distorted cannot be explained by the use of a simple equivalent circuit. The distorted semi-circles are interpreted as resulting from the non-uniform nature of the reaction and are expressed by replacing the capacitance with a constant phase element (CPE).31 In a practical composite electrode, active material powders that exhibit a particle size distribution are irregularly aggregated. It is therefore difficult to explain the non-uniform nature of the reaction in physical terms. On the basis of the model in Fig. 5, an equivalent circuit of the composite electrode based on the TLM32–36 was proposed, as shown in Fig. 6. Here, Rc represents the electronic contact resistance of the active material/conductive material interface, Rct represents the charge-transfer resistance at the electrode/electrolyte interface, and Ri represents the ion-transport resistance in the composite electrode. Because the same electrolyte was used throughout this experiment, the value of Ri is assumed to have been the same in all the composite electrodes. Considering the distribution of current in the composite electrode, when Rct was high, which corresponded to low temperatures such as −20°C, there was no great difference in current density from i1 to in. Therefore, it is considered that the semi-circle was formed by the superposition of identical semi-circles and was not distorted, as shown in Fig. 6. On the other hand, as the temperature increased the value of Rct rapidly decreased. As a result, a distribution of current densities arose between i1 and in, and the semi-circle for the charge-transfer process was formed by the superposition of different semi-circles and was distorted, as shown in Fig. 6. In these measurements, Ri, Rc, and Rct have different activation energies, and it is suggested that the current density in the depth direction changes at low temperatures. This is thought to be one of the reasons why the semi-circle for the charge-transfer process was distorted, other than the geometric factor (CPE) of the composite electrode.
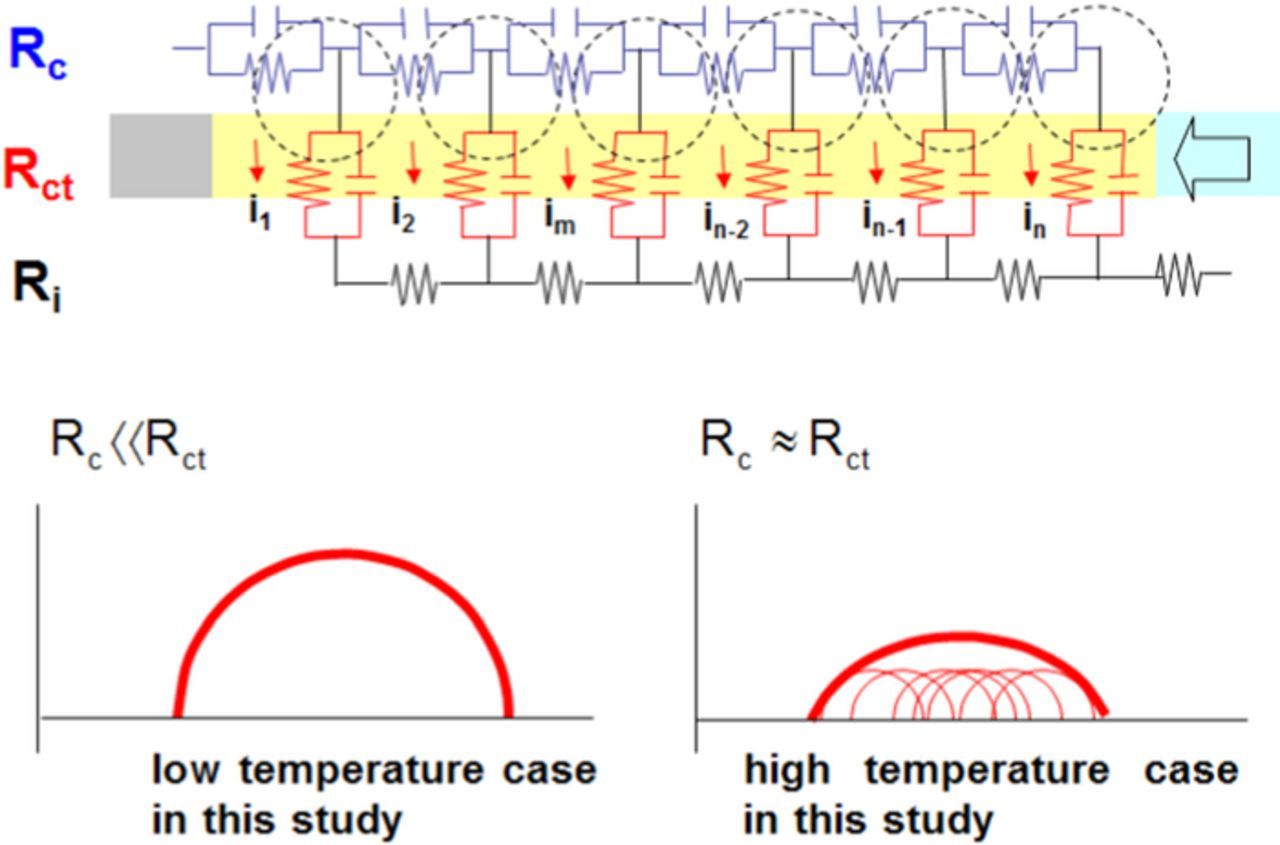
Figure 6. Equivalent circuit of the composite electrode in this study based on the transmission line model and the Nyquist plots obtained in this study. Rc represents the electronic resistance at the AB/Mg-LCO interface, Rct represents the charge-transfer resistance at the Mg-LCO/electrolyte interface, and Ri represents the ionic resistance in the composite electrode.
Conclusions
In this study, electronic resistances of LIBs were analyzed by using composite electrodes with various conductive materials. It was found that the semi-circle assigned to the electronic contact resistance at the active material/conductive material interface appeared in the high-frequency region in the Nyquist plots of the symmetric cell. The order of the electronic contact resistances corresponded to that of the DC-IR values, which confirmed that the electronic resistance greatly influenced the internal resistance of the LIBs. Furthermore, the influence of the electronic contact resistance on the charge-transfer resistance was examined by using the TLM. A factor that distorted the semi-circle for the charge-transfer process was proposed. On the basis of this study, it was established that the reduction in not only the ionic resistance but also the electronic contact resistance is important for reducing the internal resistance of LIBs.
Acknowledgments
This work was partially supported by CREST, JST (JPMJCR12C1).
ORCID
Tomokazu Fukutsuka 0000-0002-8731-9078
Kohei Miyazaki 0000-0001-5177-3570