Abstract
Internal short-circuit is the most dangerous abusive condition for Li-ion batteries and has been the root cause for several catastrophic accidents involving Li-ion batteries in recent years. Large-format Li-ion batteries are particularly vulnerable to internal short-circuits because of high energy content. Nail penetration test is commonly used to study the internal short-circuits, but the test results usually have poor reproducibility and offer limited insight. In this work, a 3 D multiscale electrochemical-thermal coupled model is used to investigate the nail penetration process in a large-format Li-ion cell. A parametric study is carried out and the results reveal strong coupling of the cell thermal response and electrochemical behaviour, which is influenced substantially by key parameters including shorting resistance, nail diameter, nail thermal conductivity, and cell capacity. The present study provides some insight that will help design more reliable experimental internal short-circuit testing protocols and improve the abuse tolerance of Li-ion cells.
Export citation and abstract BibTeX RIS

This is an open access article distributed under the terms of the Creative Commons Attribution 4.0 License (CC BY, http://creativecommons.org/licenses/by/4.0/), which permits unrestricted reuse of the work in any medium, provided the original work is properly cited.
With the increasing interest in large-format Li-ion batteries for automotive applications, safety has become a primary concern due to the high energy density of Li-ion batteries and wide-ranging working conditions for electric vehicles compared with electronic applications. Safety must be maintained for electric vehicles. Even a single accident due to battery failure could turn public opinion against electric mobility and set back industry development for years.1
Several abusive conditions have been identified which have the potential to cause safety issues in Li-ion batteries. Typical examples of battery abusive conditions are: internal short-circuit, external short-circuit, over-charging and over-heating. Internal short-circuit in Li-ion batteries is usually caused by manufacturing defects and is intrinsically more hazardous than other abusive conditions. During the short-circuit process, a large current passing through the cell and short-circuit spot produces enormous amount of Joule heat, which easily triggers exothermic reactions of active materials and electrolyte, leading to thermal runaway. In addition, common protective equipment, such as PTCs, in Li-ion batteries cannot protect the battery undergoing internal short-circuit. The active material will continuously react until depletion during an internal-short circuit process. Large-format batteries are more vulnerable to internal short-circuit because of its high energy content.
Nail penetration tests have been widely adopted by battery manufacturers to emulate the internal short-circuit process in Li-ion cells. In a nail penetration test, an electrically conductive rod (e.g. stainless steel rod) with its end tapered to a sharp point is used to pierce through the testing cell (Figure 1). The typical nail diameters range from 3 mm to 20 mm and the penetration speed is typically 8 cm/s.2 The orientation of the penetration should be perpendicular to the cell electrodes. In addition to video monitoring, several important variables including cell voltage and cell surface temperatures are measured and recorded for the duration of the test.
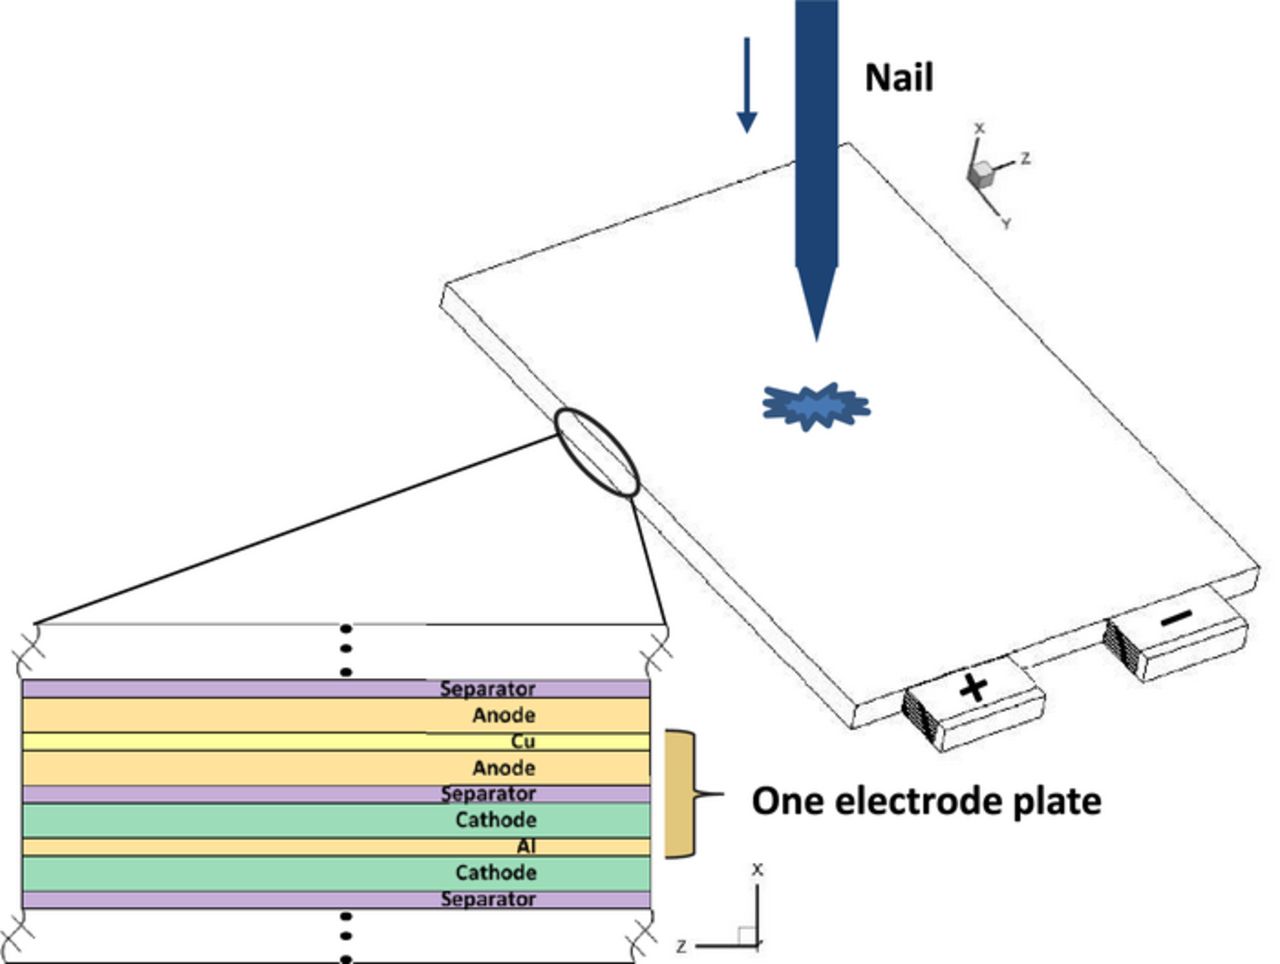
Figure 1. Schematic of nail penetration process in a large-format Li-ion cell of stacked-electrode design.
The result of several nail penetration tests have been documented in the literature.3–8 A common problem of these experimental investigations is poor reproducibility of the test results. The reason for this poor reproducibility is the difficulty of controlling the key parameters, such as shorting resistance, during the process of nail piercing through the cell. Another problem with nail penetration tests is that the experimental observations provide little insight into the fundamental mechanisms, such as the heating mode, internal species distribution, electrochemical and thermal coupling, etc., of the problem. Also, it is expensive and dangerous to perform all experimental parametric studies by nail penetration. Therefore, it is imperative that fundamental models are developed and utilized to explore the physics of nail penetration in a Li-ion cell and study the problem in tandem with experimental investigations.
Several modeling studies have been conducted to capture the Li-ion battery behavior under abusive conditions. Most of the work focuses on predicting the cell thermal response by exerting specific heat sources due to various exothermic reactions. Hatchard et al.9 developed a 1 D thermal model to study cell temperature response under abuse tests such as oven heating. For this model, heat generation due to various exothermic reactions was calculated using reaction kinetics functions. Accelerating rate calorimetry (ARC) and differential scanning calorimetry (DSC) tests were conducted to obtain the reaction kinetic parameters. Spotnitz et al.10 gave a comprehensive summary of the various exothermic reaction kinetics for different anode and cathode active materials and built a 1 D model to study the cell thermal behavior under different abusive scenarios. Spotnitz also extended his model to simulate battery packs.11 Due to the 1 D nature, Spotnitz's work cannot analyze internal shorting problems. Kim et al.12 developed a 3 D model based on Hatchard's work to capture the effect of size and shape on the cell's thermal runaway behavior. Maleki et al. conducted both experiments and thermal modeling to investigate internal short-circuit behavior of small-scale Li-ion cells for electronic applications.8
All the above-mentioned models can be categorized as thermal models, where only temperature field is solved on the Li-ion cell geometry (1 D or 3 D). No information about the cell's electrochemical performance during the short-circuit process can be obtained in these models. In reality, the heat generation due to Joule effect and electrochemical overpotentials, which may initiate exothermic reactions and thermal runaway, can only be accurately described from the solution of an electrochemical model. Yamauchi et al.13 developed an internal short-circuit study with consideration of solving current and species concentration distribution. Zavalis et al.14 used a 2 D coupled electrochemical-thermal model to simulate three short-circuit scenarios during the events from when the short circuit starts until the exothermic reactions are initiated. But in both studies the geometries for the battery cells were simplified and cannot represent realistic thermal boundary conditions for typical Li-ion cell designs. Santhanagopalan et al.15 presented an electrochemical-thermal coupled model to study the internal short-circuit on a real cell geometry. However, the electrochemical behavior of the cell during internal short-circuit, and how it connects to the cell's thermal behavior, was neither described nor illustrated with results. More recently, Fang et al16 conducted a numerical simulation of internal short in a Li-ion cell using a 3 D electrochemical-thermal model developed by our group. While the work discussed the coupling of cell internal electrochemical processes and the thermal responses during the short-circuit process, no 3 D results of current and temperature distributions in the cell geometry were given to advance the fundamental understanding of shorting in the literature.
A successful model must be able to address the following critical aspects in order to truly describe the fundamental mechanisms underlying the nail penetration process in large-format Li-ion cells: (i). Multidimensionality. Nail penetration is intrinsically a three-dimensional problem. Both the electrochemical reaction and heat generation distribution are highly non-uniform compared with the case of normal cell working condition. (ii). Multi-scale. The cell discharging rate during nail penetration is controlled by a number of electrochemical and physical processes that take place at different temporal and spatial scales. (iii). Electrochemical-thermal coupling. The nail penetration process is accompanied with dramatic temperature, current and voltage changes. The electrochemical and thermal processes are highly interactive in nail penetration.
In this paper, we aim to study the nail penetration process in a large-format Li-ion cell by using a 3 D multiscale electrochemical-thermal coupled model that is able to deal with the above-mentioned aspects. A comprehensive parametric study is carried out to explore the effect of various parameters, including shorting resistance, nail diameter, nail thermal conductivity and cell capacity, on the cell behavior during nail penetration. The ultimate goal is to provide insight that will be helpful for devising more reliable experimental testing protocols and improving the abuse tolerance of Li-ion cells.
Numerical Model
3D electrochemical-thermal coupled Li-ion cell model
There are two types of design for large-format Li-ion cells, namely spirally wound design and prismatic stacked-electrode design. In this work, we focus on the stacked-electrode design cells since they feature high performance and have become more popular in automotive applications. A schematic of a large-format Li-ion cell with stack-electrode design undergoing nail penetration is illustrated in Figure 1.
A volume-averaged electrochemical and transport model has been developed to study large-format Li-ion cells.17 The model is developed based on the work of several popular Li-ion models in the literature.18–24 Its 1 D version has been extensively validated by experimental data over a wide range of temperatures and C-rates,25 and its three-dimensional version was recently validated against local current density distributions measured by Zhang et al.,26 for the first time in the literature.27 Other key features of the model include multidimensionality, multiscale, an accurate material property database and efficient numerical algorithms offered through Autolion, a commercial software package for analyses of Li-ion batteries and systems.28 The governing equations of the model are summarized in Table I with details to be found in Ref. 17.
Table I. Governing equations of the 3 D Li-ion cell model.
| Conservation Equations: | ||
|---|---|---|
| Charge, Solid Phase | ∇ · (σeff∇ϕs) = jLi | [1] |
| Charge, Electrolyte Phase | ∇ · (keff∇ϕe) + ∇ · (keffD∇Ince) = −jLi | [2] |
| Species, Electrolyte Phase |  | [3] |
| Species, Solid Phase |  | [4] |
| Heat |  | [5] |
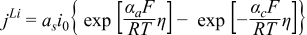 | [6] | |
| η = ϕs − ϕe − U | [7] | |
 | [8] | |
| qj = σeff∇ϕs∇ϕs + keff∇ϕe∇ϕe + keff∇lnce∇ϕe | [9] | |
| qr = jLi(ϕs − ϕe − Uj) | [10] | |
 | [11] |
Nail penetration treatment in the model
As mentioned above, in nail penetration tests, the typical penetration speed is 8 cm/s. Since most Li-ion cells have a thickness less than 1–2 centimeters, this means the nail will penetrate through the cell in less than 1 sec for most of the cases. Therefore, in the current study, we only consider the full penetration scenario, i.e. all the cell electrode plates are penetrated by the nail. When the stacked-layer design cell is fully penetrated, each electrode plate is shorted independently by a part of the nail. As shown in Figure 2, a closed-loop current path forms inside each electrode plate. No current flows through the tabs between different electrode plates. Since the cell thickness is much smaller than the cell length and cell width, we can assume that all electrode plates are identical in terms of the electrochemical behavior. Therefore, only one electrode plate is used for solving the electrochemical model (equation 1 – equation 4). The thermal calculation (equation 5), on the other hand, uses full 3 D geometry. The heat generation obtained from the electrochemical calculation is applied to all electrode plates.
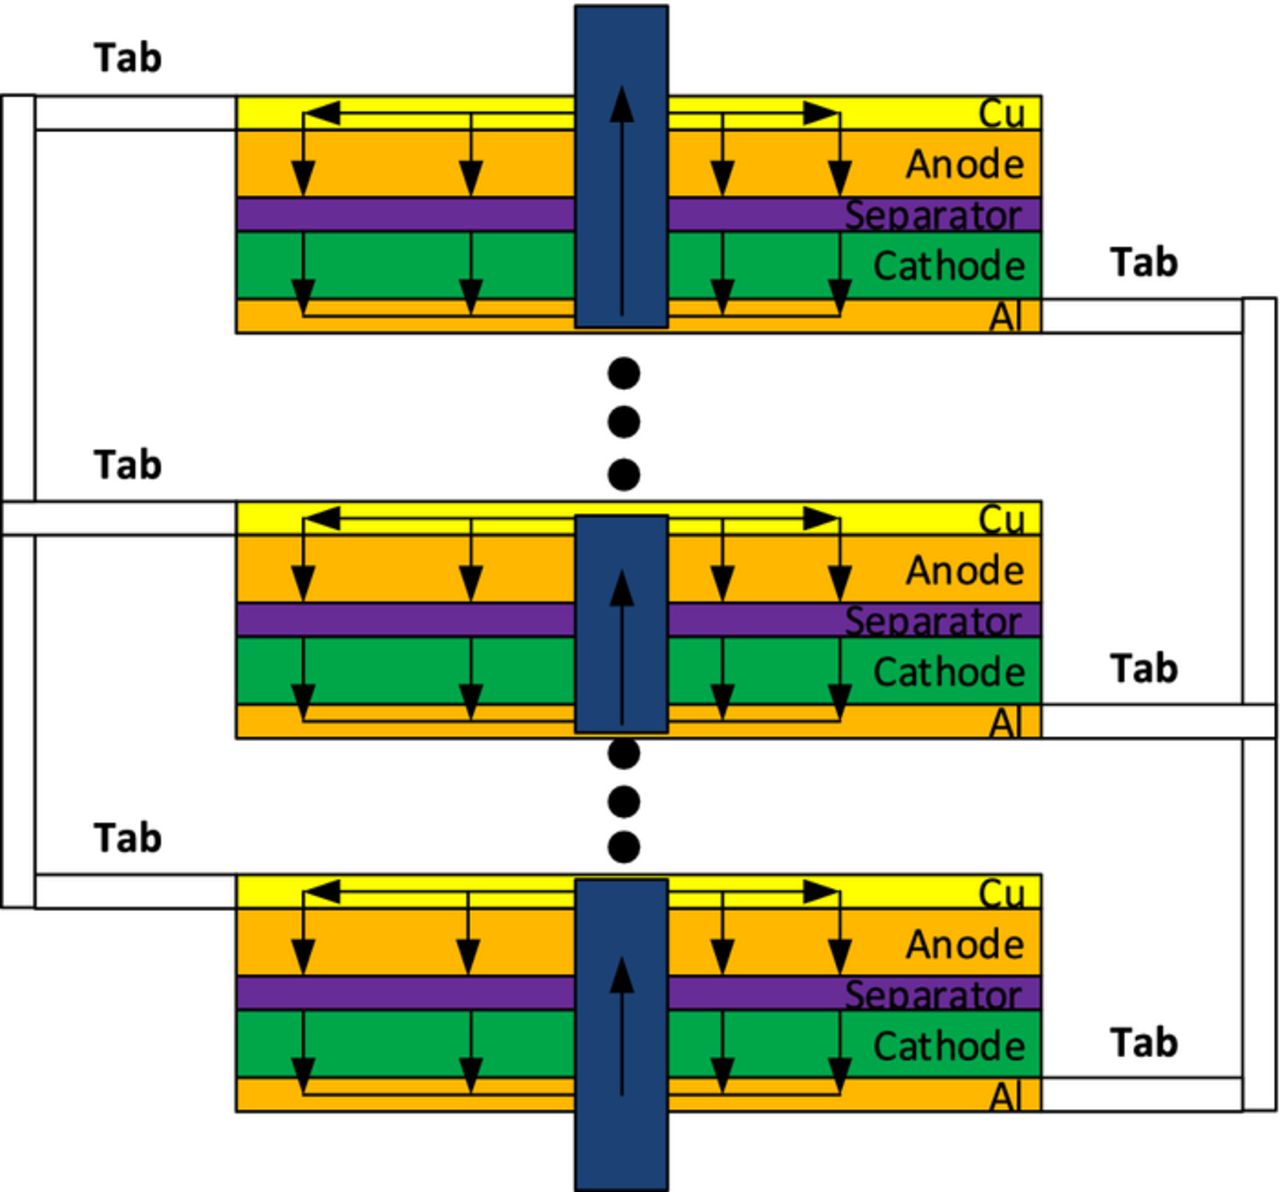
Figure 2. Schematic of the current flow path in the penetrated cell.
The current flow path within each electrode plate is three-dimensional. Figure 3 compares the electron and lithium ion transport paths of nail penetration with that of normal discharge operation. A small cell unit in the vicinity of the nail location, consisting of Cu foil, anode, separator cathode and Al foil, in the vicinity of the nail location is chosen for the illustration. When the nail is inserted, it internally connects the Cu foil and Al foil. The delithiation reaction occurs in the anode active materials releasing electrons and lithium ions. The electrons transport to the Cu foil and converge to the short-circuit spot. The electrons are further conducted through the nail and spread out throughout the Al foil. The lithium ions, on the other hand, transport through the separator to the cathode. The lithiation reaction happens in the cathode active material with the lithium ions from the separator and electrons from the Al foil. In comparison, the current path of a normal discharge process is much simpler and could be handled by using 1 D assumption. Therefore, a multidimensional model is essential to study the nail penetration problem.
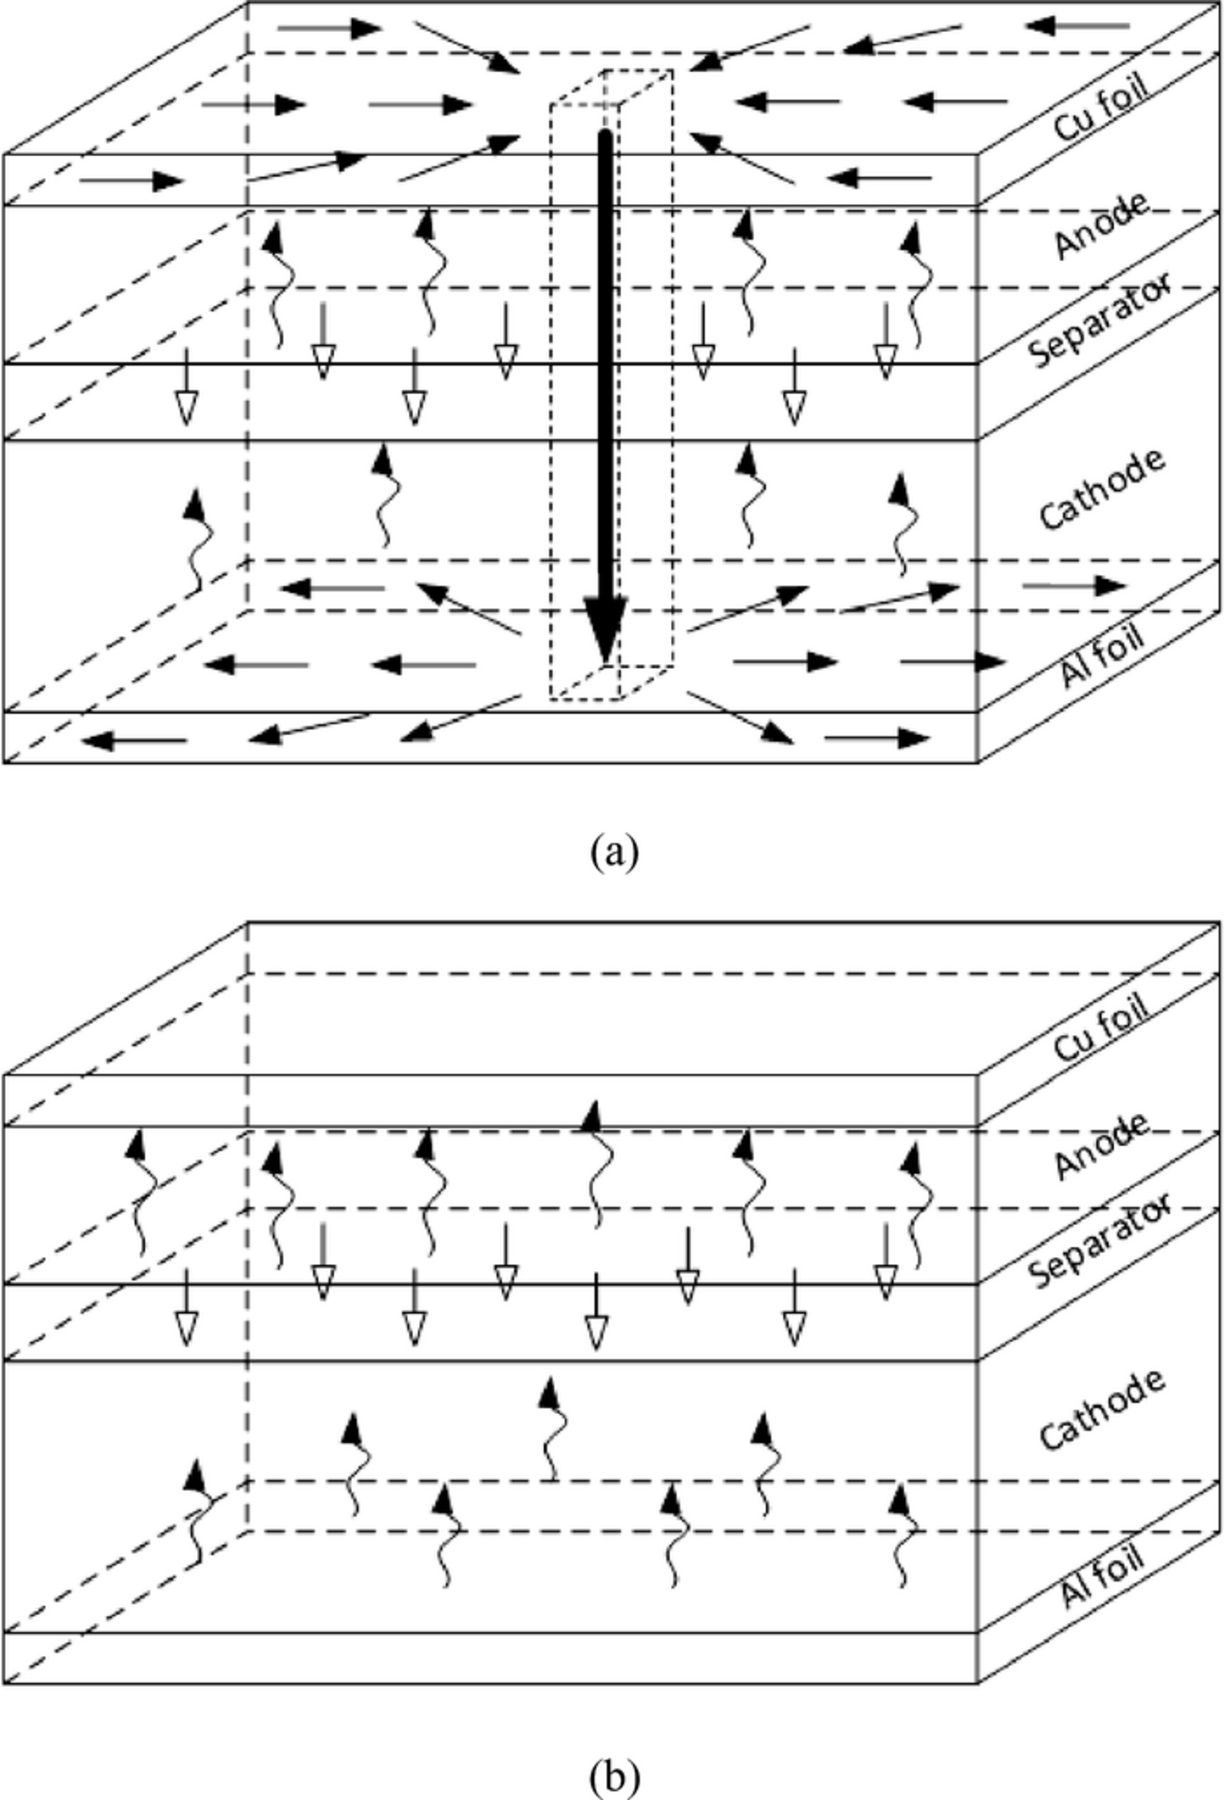
Figure 3. Schematic of the electrons and ions transport path in a Li-ion cell during (a) nail penetration process and (b) normal discharge process.
Shorting boundary condition
The boundary condition of nail penetration is implemented in the current model in such a way that it follows the same technique used for modelling normal operations, as in Ref. 17. Instead of explicitly solving the solid potential equation within the nail body, a constant resistance boundary condition is applied on the surface of Al foil at the location of penetration spot, as shown in Figure 4. A fixed voltage (usually 0) boundary condition is applied on the Cu surface at the location of penetration spot. In this way, the electron and lithium ion transport paths in the battery cell are equivalent to those shown in Figure 3a, but the implementation is greatly simplified.
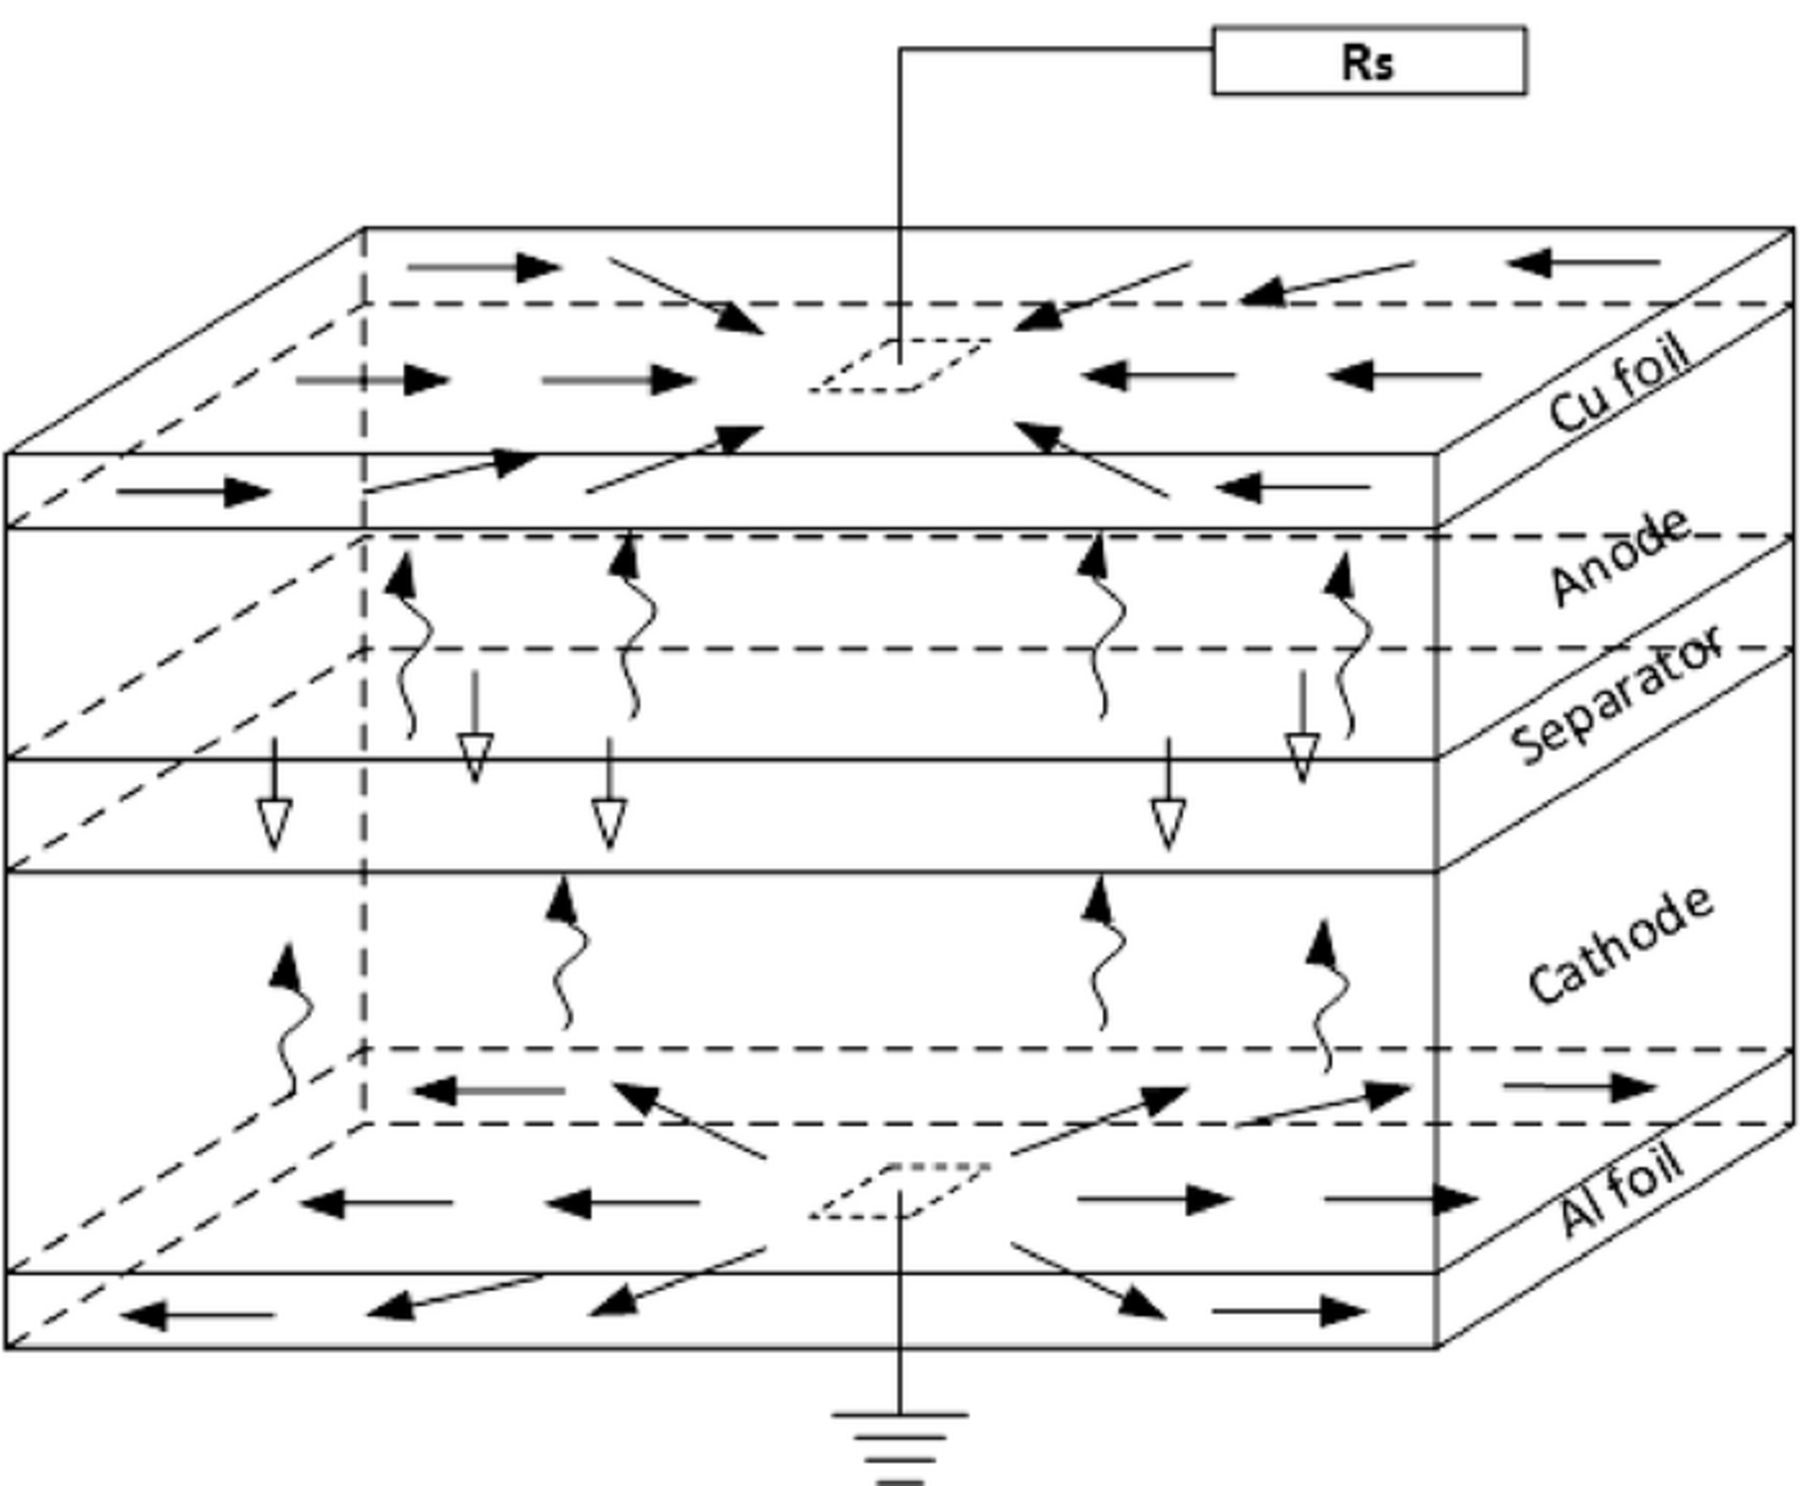
Figure 4. Schematic of applying constant resistance boundary condition at the penetration location.
The shorting resistance is determined by the intrinsic resistance of the nail material and the contact resistance created by the imperfect contact of the nail and cell body, as illustrated in Figure 5.
![Equation ([12])](https://content.cld.iop.org/journals/1945-7111/162/1/A207/revision1/jes_162_1_A207eqn1.jpg)
The intrinsic nail resistance is easy to calculate according to the nail geometry and conductivity.
![Equation ([13])](https://content.cld.iop.org/journals/1945-7111/162/1/A207/revision1/jes_162_1_A207eqn2.jpg)
where Lnail is the length of the nail portion that is inside the cell, σsco the electrical conductivity of the nail, and Anail the cross-sectional area of the nail ( ).
).
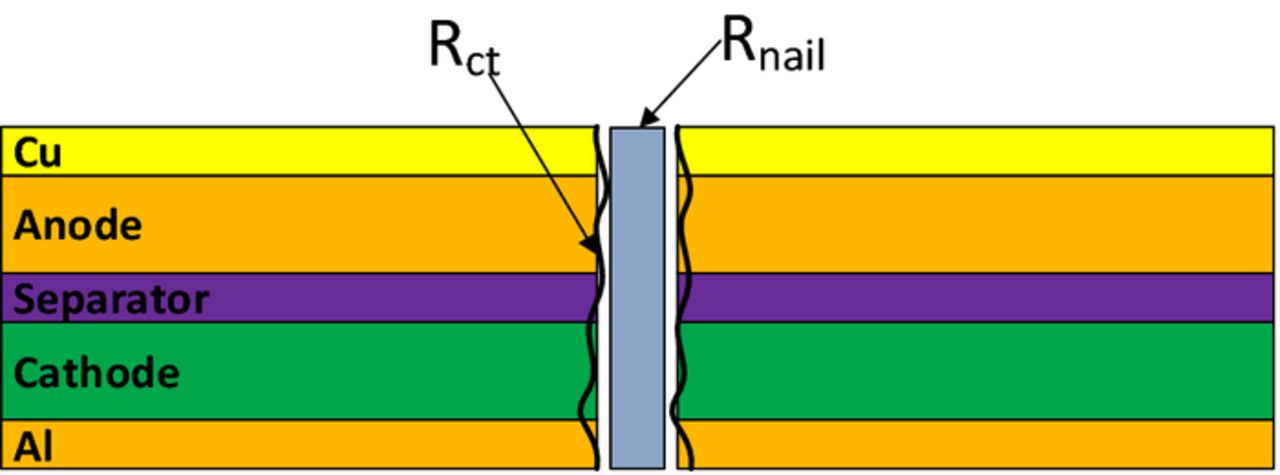
Figure 5. Schematic of intrinsic resistance of the short-circuit object and contact resistance.
However, the contact resistance is difficult to quantify and is a complex function of nail diameter, penetration speed, cell and nail material properties, etc. To date, there is no experimental study in the literature aimed at measuring the contact resistance or providing clues on how to precisely control the contact resistance during the nail penetration process. Here, we define the contact resistance as,
![Equation ([14])](https://content.cld.iop.org/journals/1945-7111/162/1/A207/revision1/jes_162_1_A207eqn3.jpg)
where  is the area specific contact resistance and Act is the side area of the nail part embedded inside the cell (Act = πdnailLnail).
The current passing through the nail body can be calculated using Ohm's law,
![Equation ([15])](https://content.cld.iop.org/journals/1945-7111/162/1/A207/revision1/jes_162_1_A207eqn4.jpg)
where Δϕs, P is the solid potential gradient along the nail axial direction. The volumetric heat generation within the nail body is then calculated using Joule's law,
![Equation ([16])](https://content.cld.iop.org/journals/1945-7111/162/1/A207/revision1/jes_162_1_A207eqn5.jpg)
where Vnail is the volume of the nail body inside the cell ( ).This heat generation is added as a source term to the cell volume occupied by the short-circuit object when solving the energy equation (e.g. equation 5).
Other boundary and initial conditions
The solid phase and electrolyte concentration distributions are prescribed at the beginning of simulation as initial conditions.
![Equation ([17])](https://content.cld.iop.org/journals/1945-7111/162/1/A207/revision1/jes_162_1_A207eqn6.jpg)
Because the electrolyte is confined in the electrodes and separator, zero flux boundary conditions are applied for equation 3 and equation 4 at the interface between the current collector and electrode.
![Equation ([18])](https://content.cld.iop.org/journals/1945-7111/162/1/A207/revision1/jes_162_1_A207eqn7.jpg)
At all other boundaries,
![Equation ([19])](https://content.cld.iop.org/journals/1945-7111/162/1/A207/revision1/jes_162_1_A207eqn8.jpg)
Numerical procedures
The governing equations are discretized using finite volume method (FVM) and solved along with their initial and boundary conditions, using the user-coding capability of the commercial computational fluid dynamics (CFD) package, STAR-CD. All the equations are solved sequentially at each time step and the calculation proceeds to the next time step if the convergence criteria are met. For shorting condition, the residual of shorting current is used as a critical convergence criterion.
![Equation ([20])](https://content.cld.iop.org/journals/1945-7111/162/1/A207/revision1/jes_162_1_A207eqn9.jpg)
where Ia and Ic are the total output current of anode and cathode electrode, respectively.
![Equation ([21])](https://content.cld.iop.org/journals/1945-7111/162/1/A207/revision1/jes_162_1_A207eqn10.jpg)
![Equation ([22])](https://content.cld.iop.org/journals/1945-7111/162/1/A207/revision1/jes_162_1_A207eqn11.jpg)
And I0s is the solution of the shorting current for the previous iteration. εI is chosen to be sufficiently small (<1.0×10⁻⁶) to ensure converged results.
Figure 6 illustrates the computational mesh for the baseline large-format cell. The cell is 13 cm in height (y-dir) and 8 cm in width (z-dir). It consists of 26 electrode plates, stacked together in the cell thickness direction (x-dir). The total cell thickness is 2.6 cm. Each plate has a Cu foil, an anode electrode, a separator, a cathode electrode, and an Al foil. The Cu and Al foils are double-side coated with anode material and cathode material, respectively. The tabs are welded outward on foils at the top edge of the cell and are clamped together. The anode and cathode tabs have the same size, which is 2 cm in width and 1 cm in height. The cell has a graphite based anode and NCM based cathode. The cell nominal capacity is 5 Ah. Other design parameters of the cell are listed in Table II. For the baseline case, the nail is penetrated at the center of the y-z plane. The mesh is refined in the region near the nail to capture the large variable gradients. Mesh-independence study has been carried out and the total mesh number is 419,464. The baseline case parameters and other physiochemical parameters used in the model are listed in Table III and Table IV, respectively.
Table II. Design parameters for the 5 Ah cell.
| Positive electrode | Negative electrode | |
|---|---|---|
| Chemistry | LiyCo1/3Ni1/3Mn1/3O2 | LixC6 |
| Loading amount | 12.5 mg/cm2 | 6.05 mg/cm2 |
| Electrode thickness | 78 μm | 82 μm |
| Electrode height | 13 cm | 13 cm |
| Electrode width | 8 cm | 8 cm |
| Foil thickness | 15 μm | 8 μm |
| Separator thickness | 20 μm | |
| Electrolyte | PC-EC-DMC 1.0 M LiPF6 | |
| NP ratio | 1.14 | |
| No. of plates | 26 | |
| Total active area | 2704 cm2 | |
| Nominal capacity | 5 Ah | |
Table III. Parameters of the baseline nail penetration case.
| Parameter | Value |
|---|---|
| Cell capacity | 5 Ah |
| Penetration depth | Full penetration |
| Nail length outside of cell | 10 cm |
| Nail diameter | 4 mm |
| Area specific contact resistance | 16.3 mΩ cm2 |
| Effective shorting resistance | 50 mΩ |
| Nail material | Stainless steel |
| Ambient temperature | 25°C |
Table IV. Physiochemical parameters used in the Li-ion battery model.
| Parameter | Unit | Cu foil | Negative electrode | Separator | Positive electrode | Al foil |
|---|---|---|---|---|---|---|
| Density | kg/cm3 | 8960×10−6 | 1200×10−6 | 525×10−6 | 2860×10−6 | 2700×10−6 |
| Specific heat | J/Kg K | 385 | 1150 | 2050 | 1150 | 897 |
| Thermal conductivity | W/cm K | 3.95 | 0.004 | 0.005 | 0.004 | 2.4 |
| Electron conductivity | S/cm | 5.8×10⁵ | 1.0 | 0.1 | 3.538×10⁵ | |
| Maximum Li capacity | mol/cm3 | 0.031 | 0.0518 | |||
| Stoichiometry at 0%/100% SOC | 0.042/1.0 | 0.98/0.39 | ||||
| Charge transfer coefficient | 0.5 | 0.5 | ||||
| Reference exchange current density | A/m2 | 26 | 4.0 | |||
| Diffusion coefficient – solid phase | cm2/s | 9.0×10⁻¹⁰ | 1.5×10⁻¹⁰ | |||
| Bruggeman tortuosity exponent | 1.5 | 1.5 | 1.5 | |||
| Transference number | 0.363 | |||||
| Porosity | 0.27 | 0.32 | 0.27 | |||
| Thickness | cm | 10×10−4 | 74×10−4 | 20×10−4 | 63×10−4 | 20×10−4 |
| Particle radius | cm | 10×10−4 | 3×10⁻⁴ | |||
| Initial electrolyte concentration | mol/cm3 | 0.001 | ||||
| Heat transfer coefficient | W/cm2 K | 0.002 |
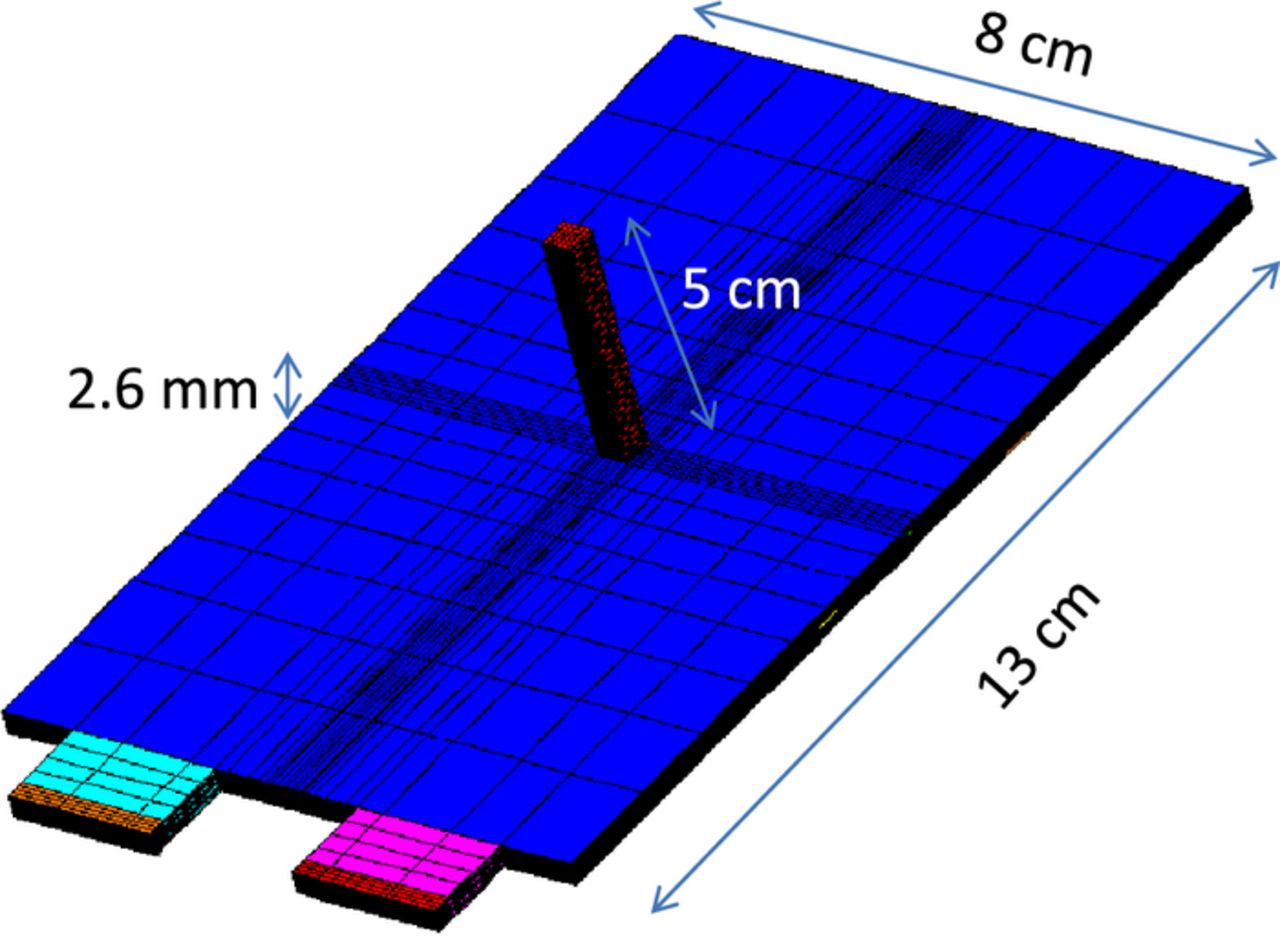
Figure 6. Computational mesh for the 5 Ah cell used in the nail penetration simulation.
Results and Discussion
Effect of shorting resistance
As discussed previously, the shorting resistance is controlled by the shorting contact resistance, which is caused by the imperfect contact between the penetrated nail and the cell components. Its value has not been able to be measured experimentally. Therefore, it is necessary to conduct numerical simulations to study the effect of a wide range of shorting contact resistance. In the following simulations, the nail diameter is fixed at 4 mm. By varying the  , we can obtain a wide range of shorting resistance.
Figure 7 shows the current and voltage during the nail penetration process. Four levels of shorting resistance are chosen for comparison. It can be seen from Figure 7a that the cell responses are very different for different shorting resistances. At small resistance, i.e. Rs = 0.2 mΩ, the discharge process has three stages. In the first stage, the in-rush current jumps to 87.4 C at the beginning of shorting. However, the cell cannot maintain this high in-rush current and the current rapidly decreases to ∼20 C in about 20 s. The second stage features a steady discharge of the cell at ∼15 C from 20 s to 180 s. At this stage the discharge current gradually decreases due to the reduction of cell electrochemical energy. After 180 s, the discharge enters the third stage, where a more rapidly current drop occurs. The current eventually drops to around zero indicating the full discharge of the cell.
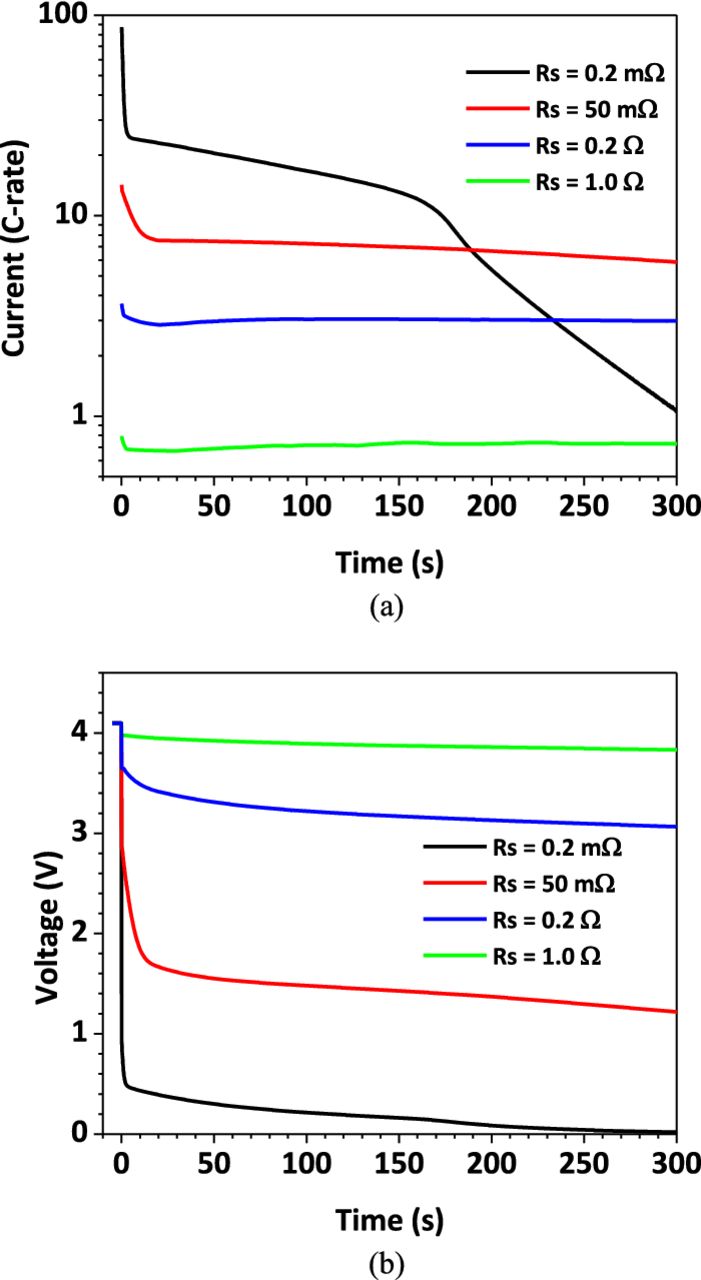
Figure 7. Shorting current and voltage profiles for different shorting resistance (a) current profiles; (b) voltage profiles.
Figure 7a also shows that the in-rush current decreases as larger shorting resistance is used. The in-rush current is 14 C, 3.8 C, and 0.8 C for Rs = 50 mΩ, 0.2 Ω, and 1.0 Ω, respectively. The lower the in-rush current, the more the discharge process resembles constant rate discharge.
The cell voltage profiles are shown in Figure 7b. The cell voltage is measured between the positive and negative terminals. As can be seen in the figure, the cell voltage has an instantaneous drop from the OCV to a lower value at the beginning of shorting. The smaller of the effective resistance, the larger of the drop. The initial voltage drop for Rs = 0.2 mΩ, 50 mΩ, 0.2 Ω and 1.0 Ω is 3.28 V, 1.34 V, 0.55 V and 0.22 V, respectively. After the initial drop, the voltage profile follows a trend similar to that of the current, gradually decreasing as the discharge process goes on. Since the cell voltage can be measured during nail penetration experiments, one may be able to quantify the shorting resistance from the cell voltage response during the experiment. For example, if the cell voltage drops to very small value immediately after shorting, it means a very small shorting resistance is caused by the penetration process. On the other hand, if the cell voltage does not change much from the OCV, the shorting resistance must be relatively large. This definitive relationship between nail contact resistance and cell voltage response during nail penetration, as discovered in the present simulation work for the first time, could provide an excellent means to measure the shorting contact resistance.
Figure 8 shows the Li+ concentration distribution in the electrolyte along the cell thickness direction, at the location of short-circuit spot, for the case of Rs = 0.2 mΩ. At t=0 s, the cell is at equilibrium state and uniform distribution of Li+ concentration is assumed. As the cell begins to discharge as a result of nail penetration, Li+ is released from the carbon material into the electrolyte at the anode, and Li+ is inserted to the metal oxide material from the electrolyte in the cathode. A Li+ concentration gradient begins to form across the cell thickness direction. The Li+ generation and consumption rate is proportional to the reaction current density, as shown in equation 6. The high in-rush current makes the Li+ in the cathode electrolyte consumed very quickly and become depleted. As shown in Figure 8, after 20 s of shorting, Li+ concentration in the cathode electrolyte drops to almost zero. The reduction of Li+ concentration in electrolyte will restrain the shorting current by two mechanisms. Firstly, the ionic conductivity decreases as the decrease of Li+ concentration,29 leading to higher ohmic loss in the electrolyte. Secondly, the exchange current density decreases as the Li+ concentration in electrolyte decreases, as shown in equation 8. As a result, the cell internal resistance increases rapidly and the shorting current decreases sharply to match the increased internal resistance.
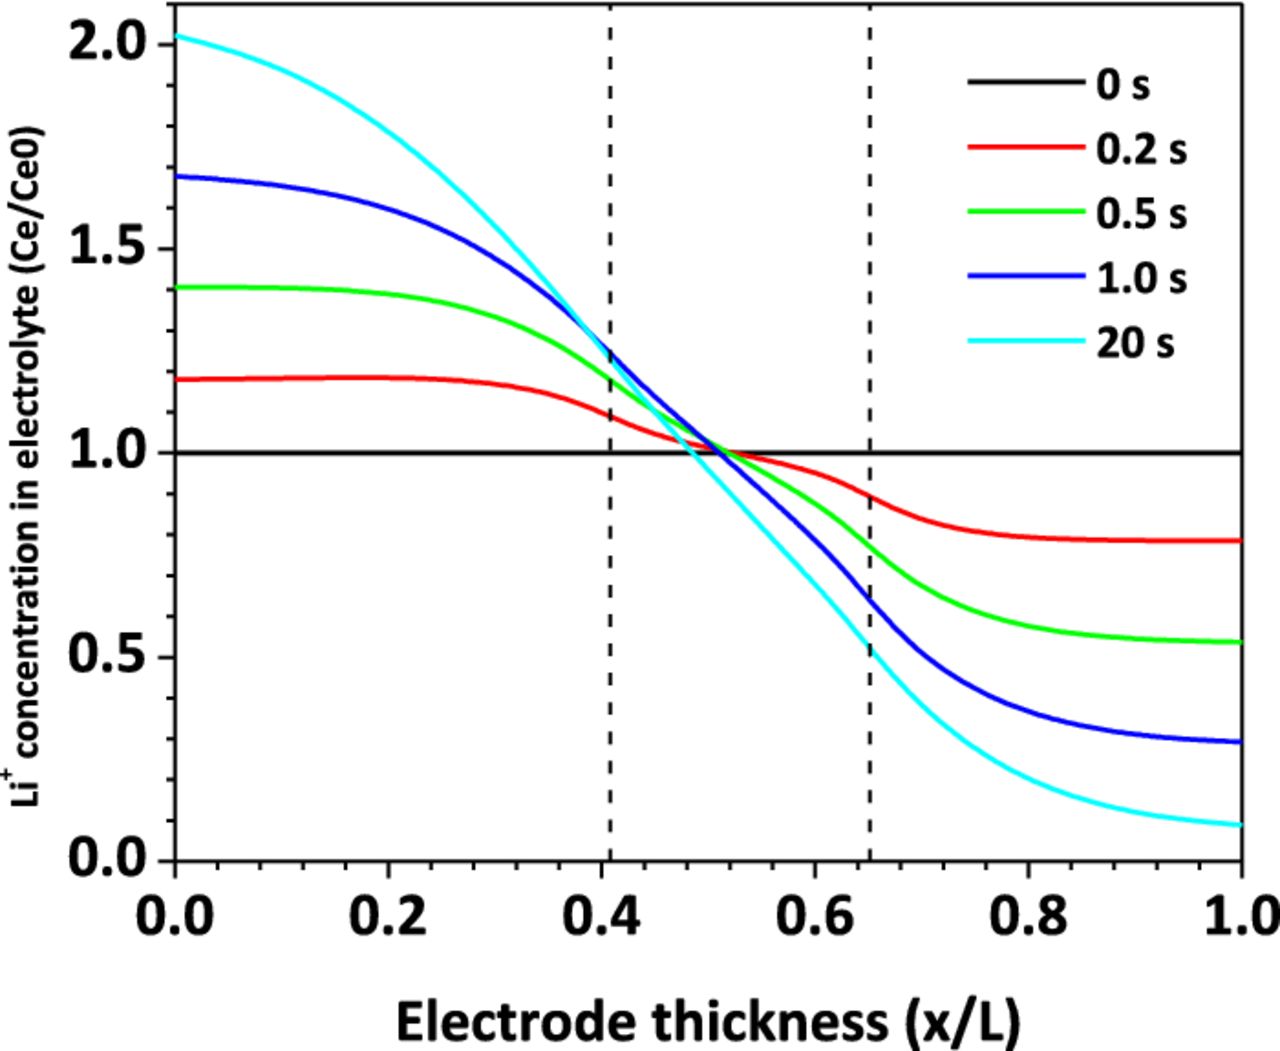
Figure 8. Li+ concentration distribution in electrolyte, Rs = 0.2 mΩ.
Figure 9a and Figure 9b show the Li+ concentration distribution in the active material particles of anode and cathode, respectively. The plot is normalized so that the non-dimensional concentration varies between 0.0 and 1.0, indicating fully discharged and fully charged states, respectively. It is shown that in the case of Rs=0.2 mΩ, within the 300s time frame, the Li+ is almost fully extracted from the anode particles and inserted into the cathode particles. This means the cell is almost fully discharged in 300 s, releasing all of its energy in the form of heat.
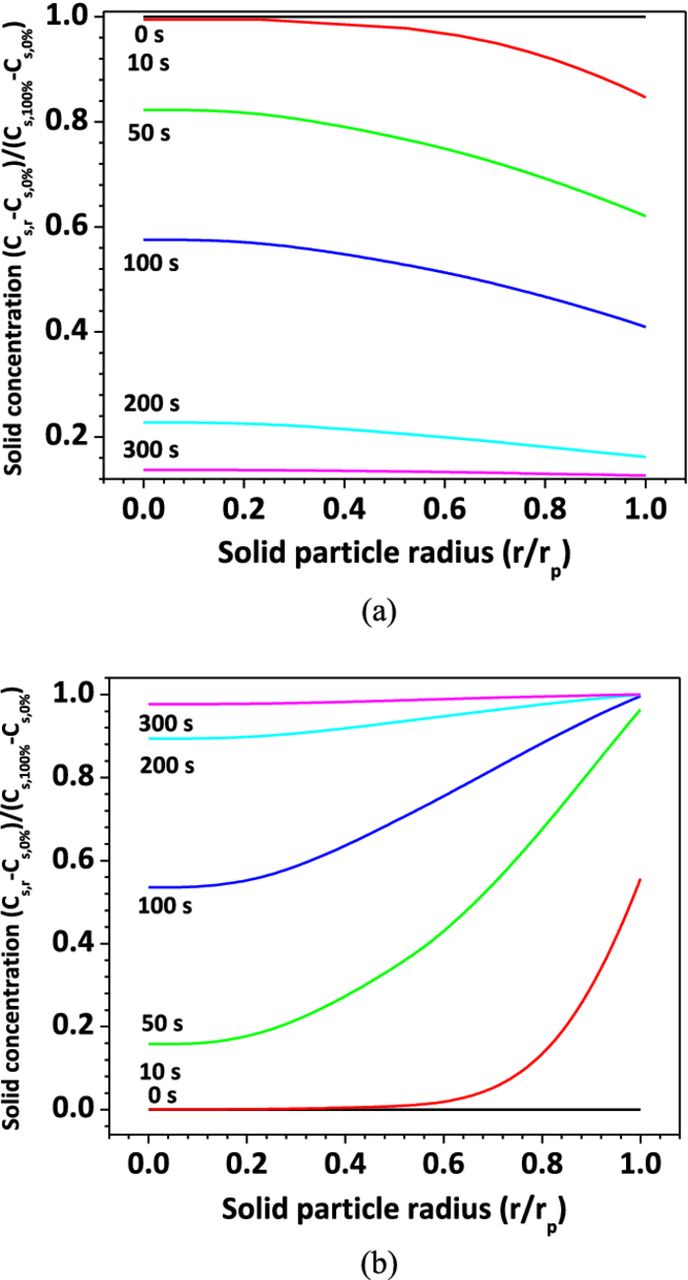
Figure 9. Li+ concentration in solid material particles, Rs = 0.2 mΩ (a) anode; (b) cathode.
Figure 10 and Figure 11 show Li+ distribution for the large shorting resistance case (Rs = 0.2 Ω). Compared with the small resistance case, no Li+ transport limitation is found in electrolyte or active material particles. Specifically, Figure 10 shows that the Li+ concentration gradient is much smaller than that shown in Figure 8. The Li+ distribution in the solid particles shown in Figure 11 also indicates that the cell only discharges a small portion of its energy within the 300 s time frame.
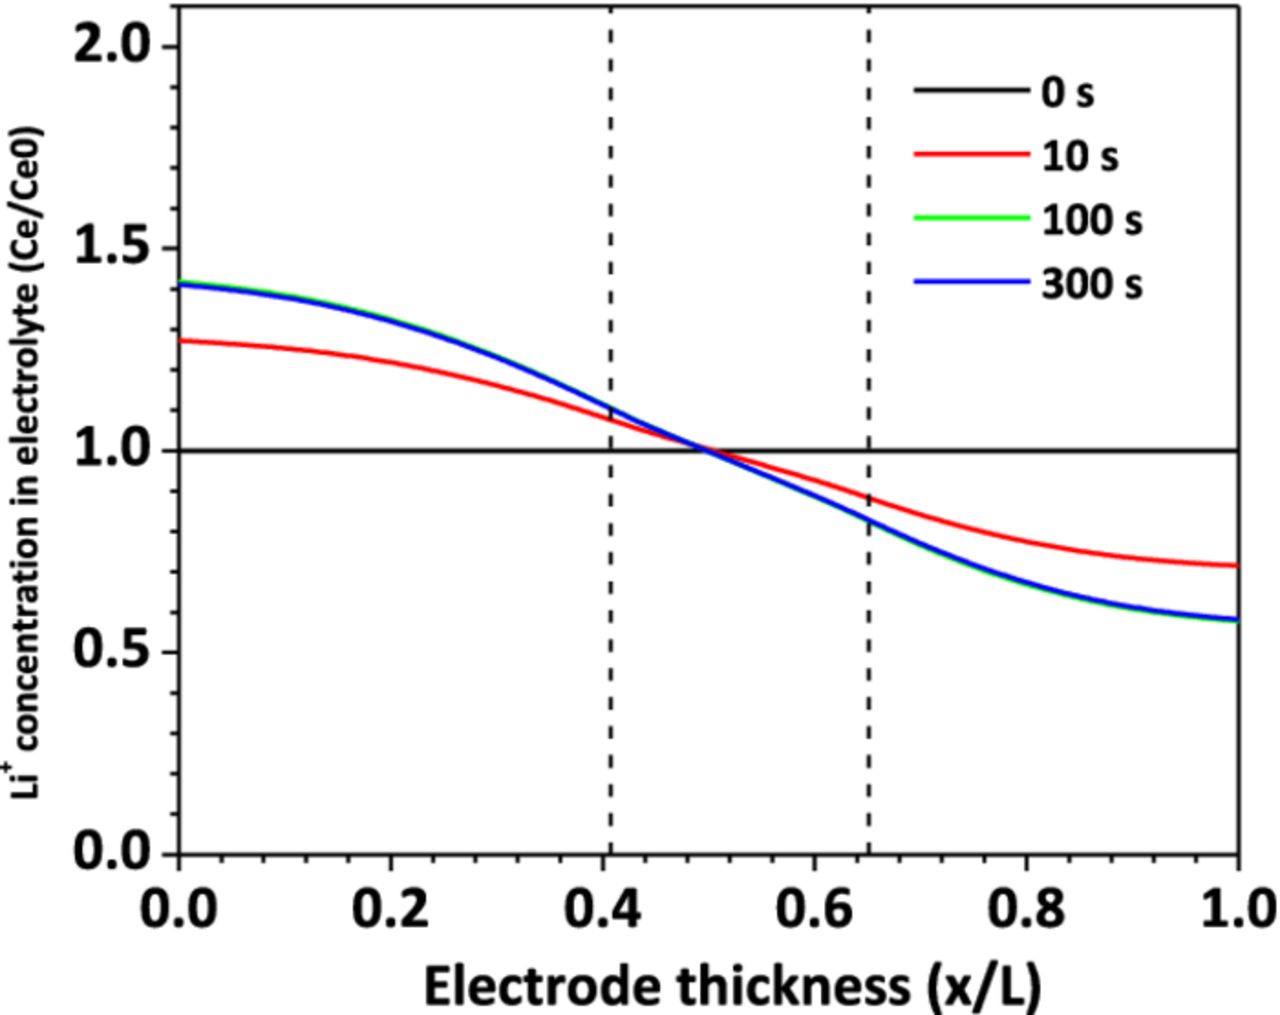
Figure 10. Li+ concentration distribution in electrolyte, Rs = 0.2 Ω.
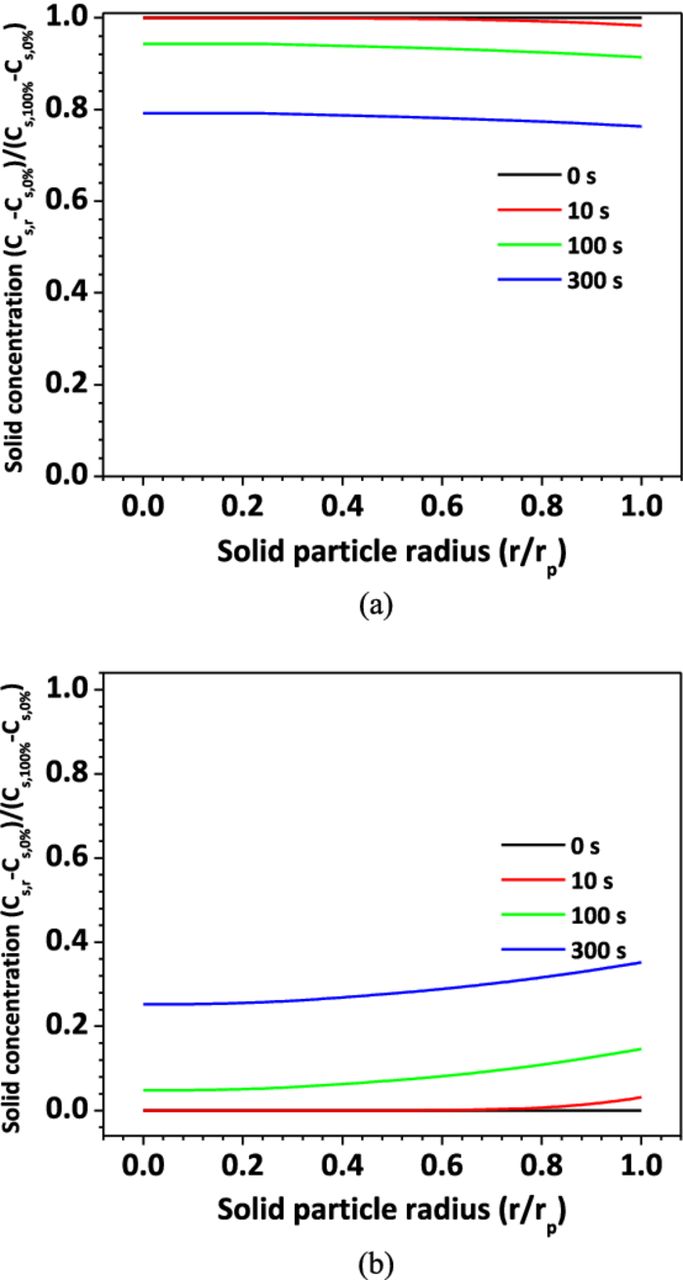
Figure 11. Li+ concentration in solid material particles, Rs = 0.2 Ω (a) anode; (b) cathode.
The above analysis reveals that the shorting resistance of the nail penetration process has a strong impact on the cell discharge behavior. Since the cell electrochemical performance and thermal response are closely coupled, the shorting resistance also has a significant influence on the cell thermal behavior. In the present simulation, both the cell surface temperature (Tsurf) and the temperature at the cell and nail interface (Tcell/nail)) are monitored. Figure 12 shows the Tcell/nail rise as a function of shorting resistance. This temperature is an indication of the maximum temperature in the cell and can be used to check whether exothermic reactions have already occurred inside the cell. From Figure 12, two regimes can be distinguished in terms of heating modes. At small shorting resistance (Rs < Ri), the cell discharge is controlled by the internal processes such as Li+ transport in the electrolyte and interfacial electrochemical kinetics. This results in global heating in cell because the internal processes occur everywhere within the cell. In this regime, as the shorting resistance decreases, the Tcell/nail also decreases. But when the shorting resistance is smaller after certain value, the Tcell/nail cannot be reduced any further. This is because the shorting resistance is negligible compared with cell internal resistance, and has no influence on the heat generation. At large shorting resistance (Rs > Ri), on the other hand, the cell discharge is dominated by the ohmic resistance of the nail. As the shorting resistance becomes larger, the shorting current reduces and the resulting heating rate decreases. Therefore, the Tcell/nail decreases linearly in this regime. Also, because Rs > Ri, the heat generation is mainly contributed from the localized ohmic heating from the nail. The Tcell/nail reaches its peak value when the shorting resistance is close to the cell internal resistance. This corresponds to the most dangerous scenario. The cell will undoubtedly go into thermal runaway under this condition.
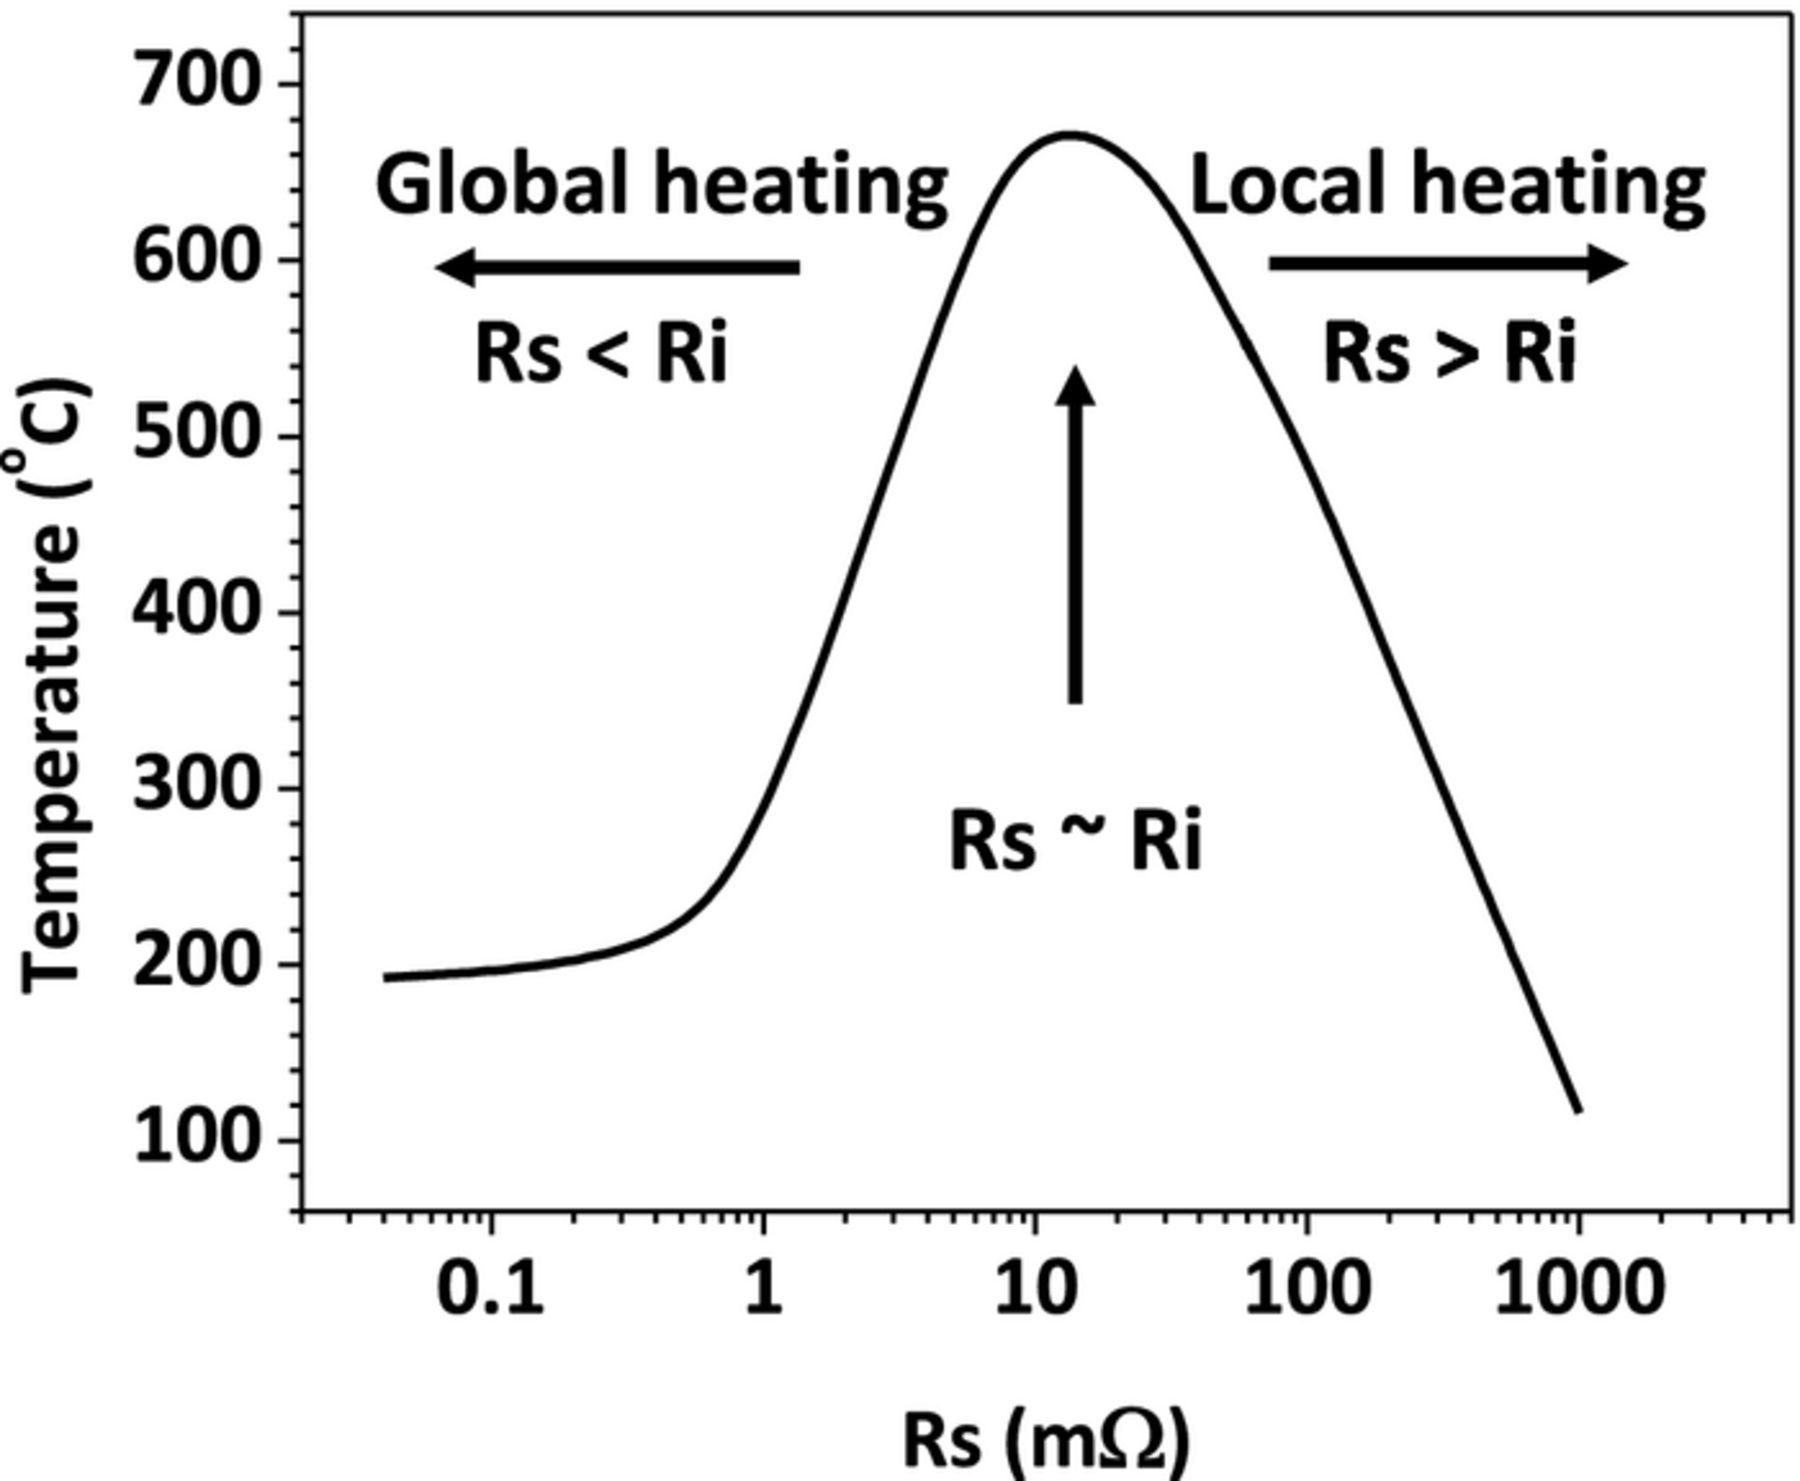
Figure 12. Tcell/nail during penetration as a function of effective shorting resistance.
Figure 13 and Figure 14 display the 3 D temperature distribution at different time instants for the small shorting resistance case and large shorting resistance case, respectively. The difference between global and local heating modes can be clearly seen by comparing the two figures.
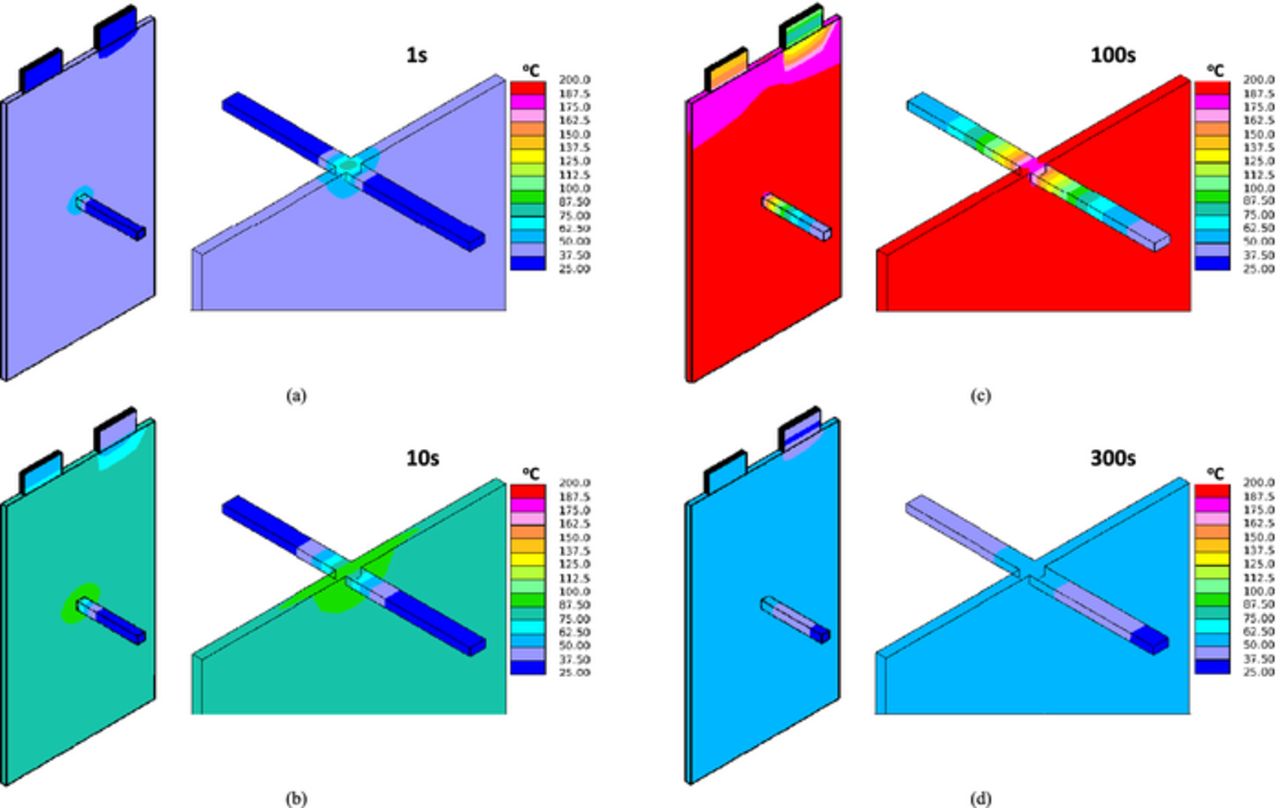
Figure 13. 3 D temperature distribution, Rs = 0.2 mΩ (a) 1 s; (b) 10 s; (c) 100 s; (d) 300 s.
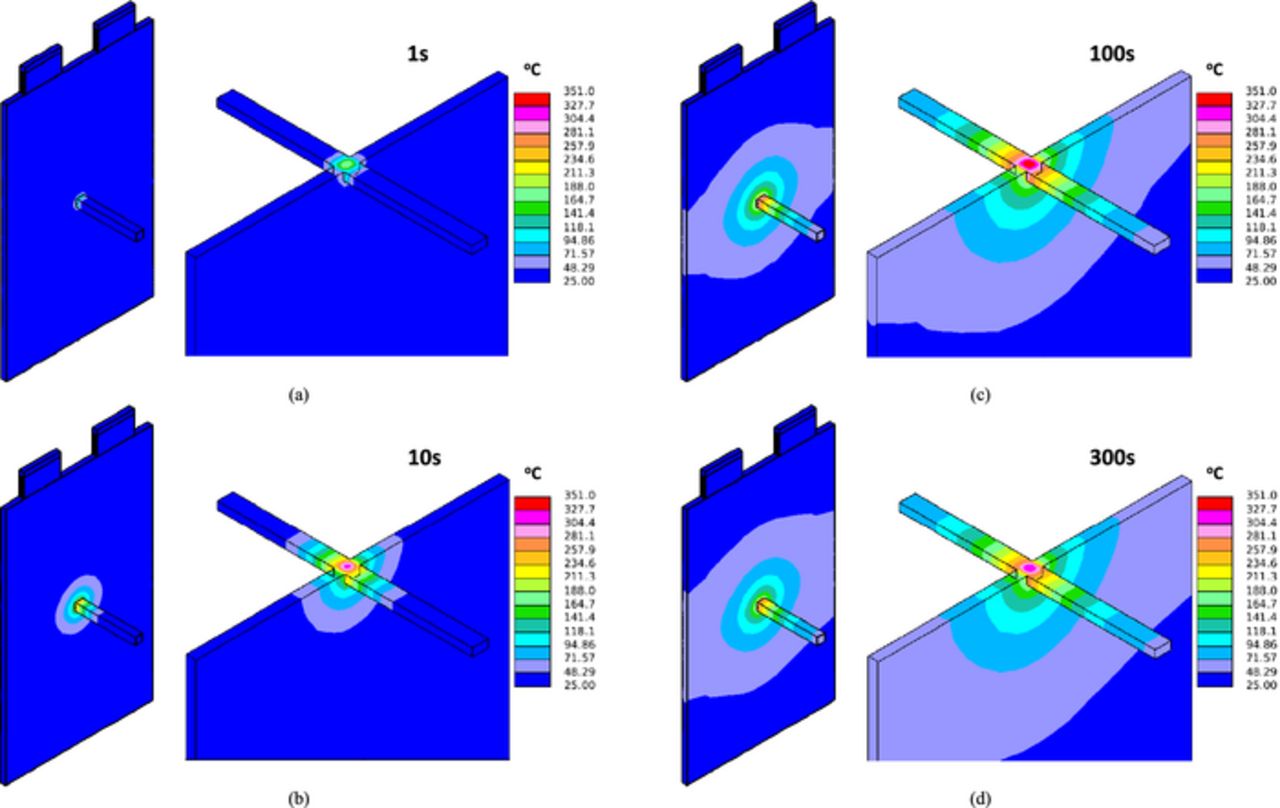
Figure 14. 3 D temperature distribution, Rs = 0.2 Ω (a) 1 s; (b) 10 s; (c) 100 s; (d) 300 s.
The temperature profiles for the two cases are displayed in Figure 15. On each figure, both the Tcell/nail and Tsurf are plotted. It can be seen from Figure 15a that at small shorting resistance, the Tcell/nail and Tsurf are close, indicating global heating. In comparison, Figure 15b illustrates the local heating case, where Tcell/nail is always much higher than Tsurf.
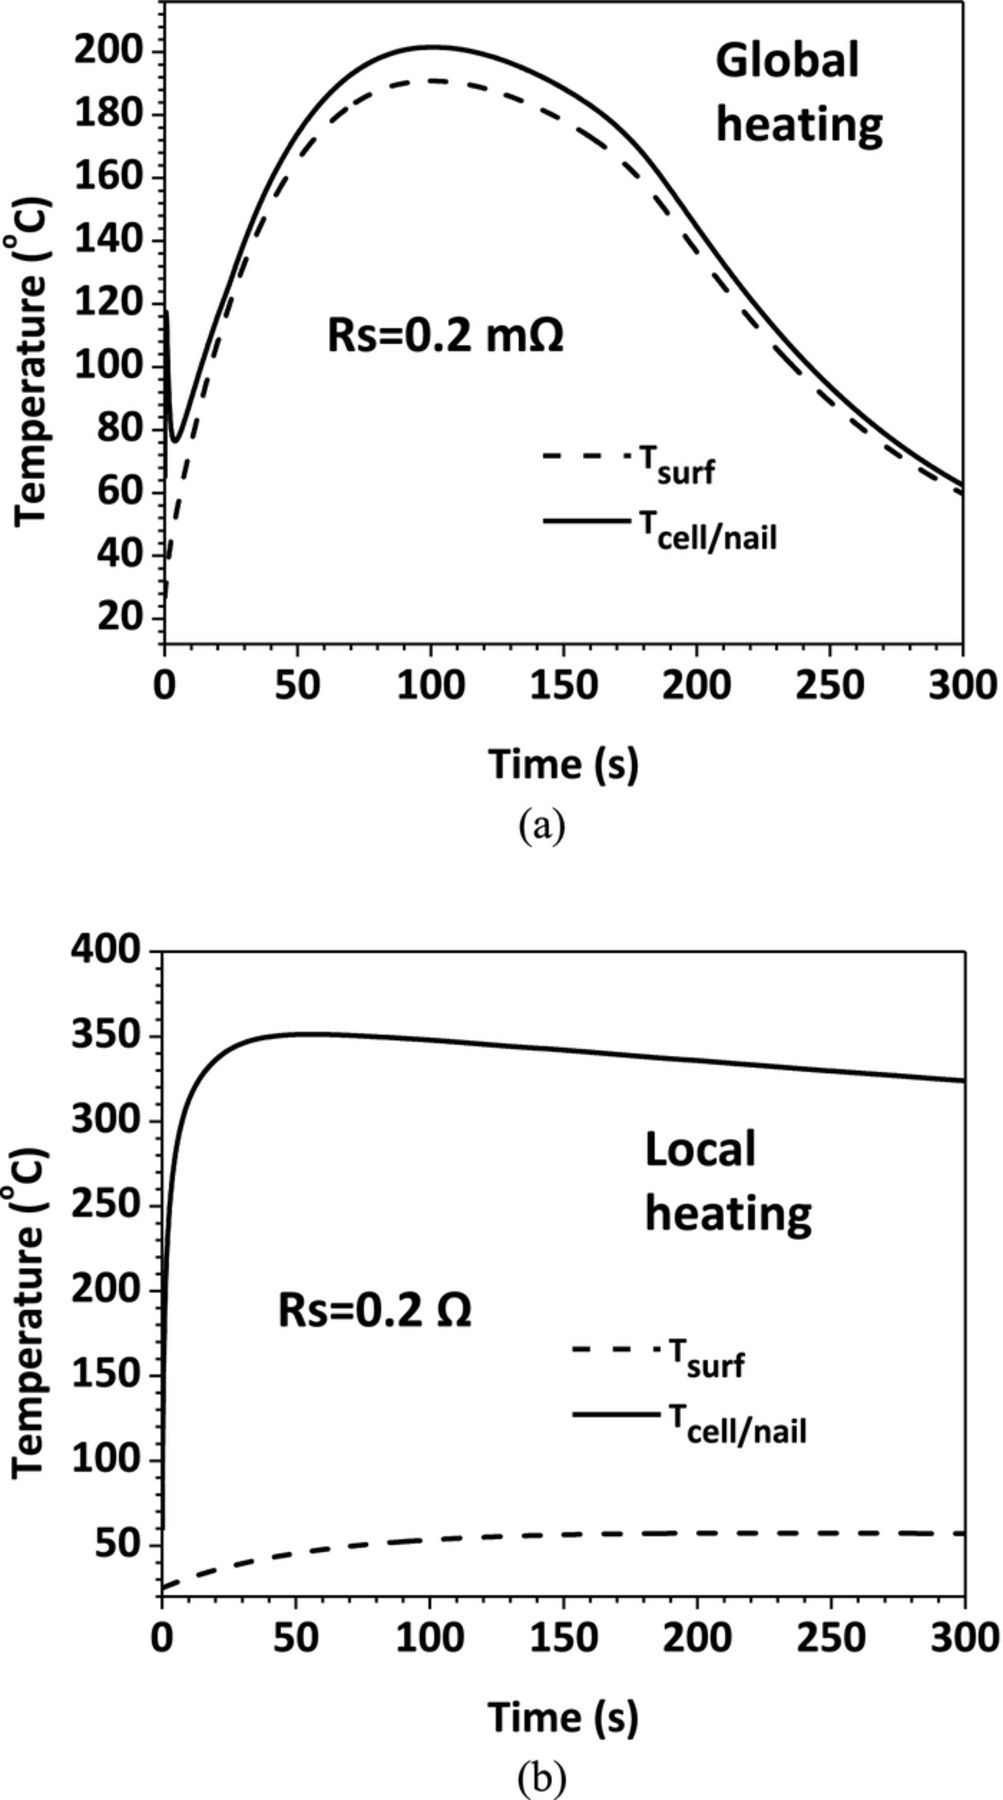
Figure 15. Tcell/nail and Tsurf profiles (a) Rs = 0.2 mΩ; (c) Rs = 0.2 Ω.
Effect of nail diameter
Equation 14 shows that the shorting resistance is not only a function of area specific contact resistance, but also a function of nail diameter. The nail diameter also influences the nail thermal mass. Therefore, it is necessary to explore the nail diameter effect on the penetration process.
Figure 16 shows the Tcell/nail rise as a function of nail diameter. From the figure, it is evident that using large diameter nail will decrease Tcell/nail rise during the nail penetration process. Since the lowest onset temperature of the various exothermic reactions is around 120°C, the onset temperature for the SEI layer decomposition reaction in anode, we can safely draw the conclusion that if Tcell/nail is below 120°C during the penetration, the cell will be absolutely safe and not go to thermal runaway.
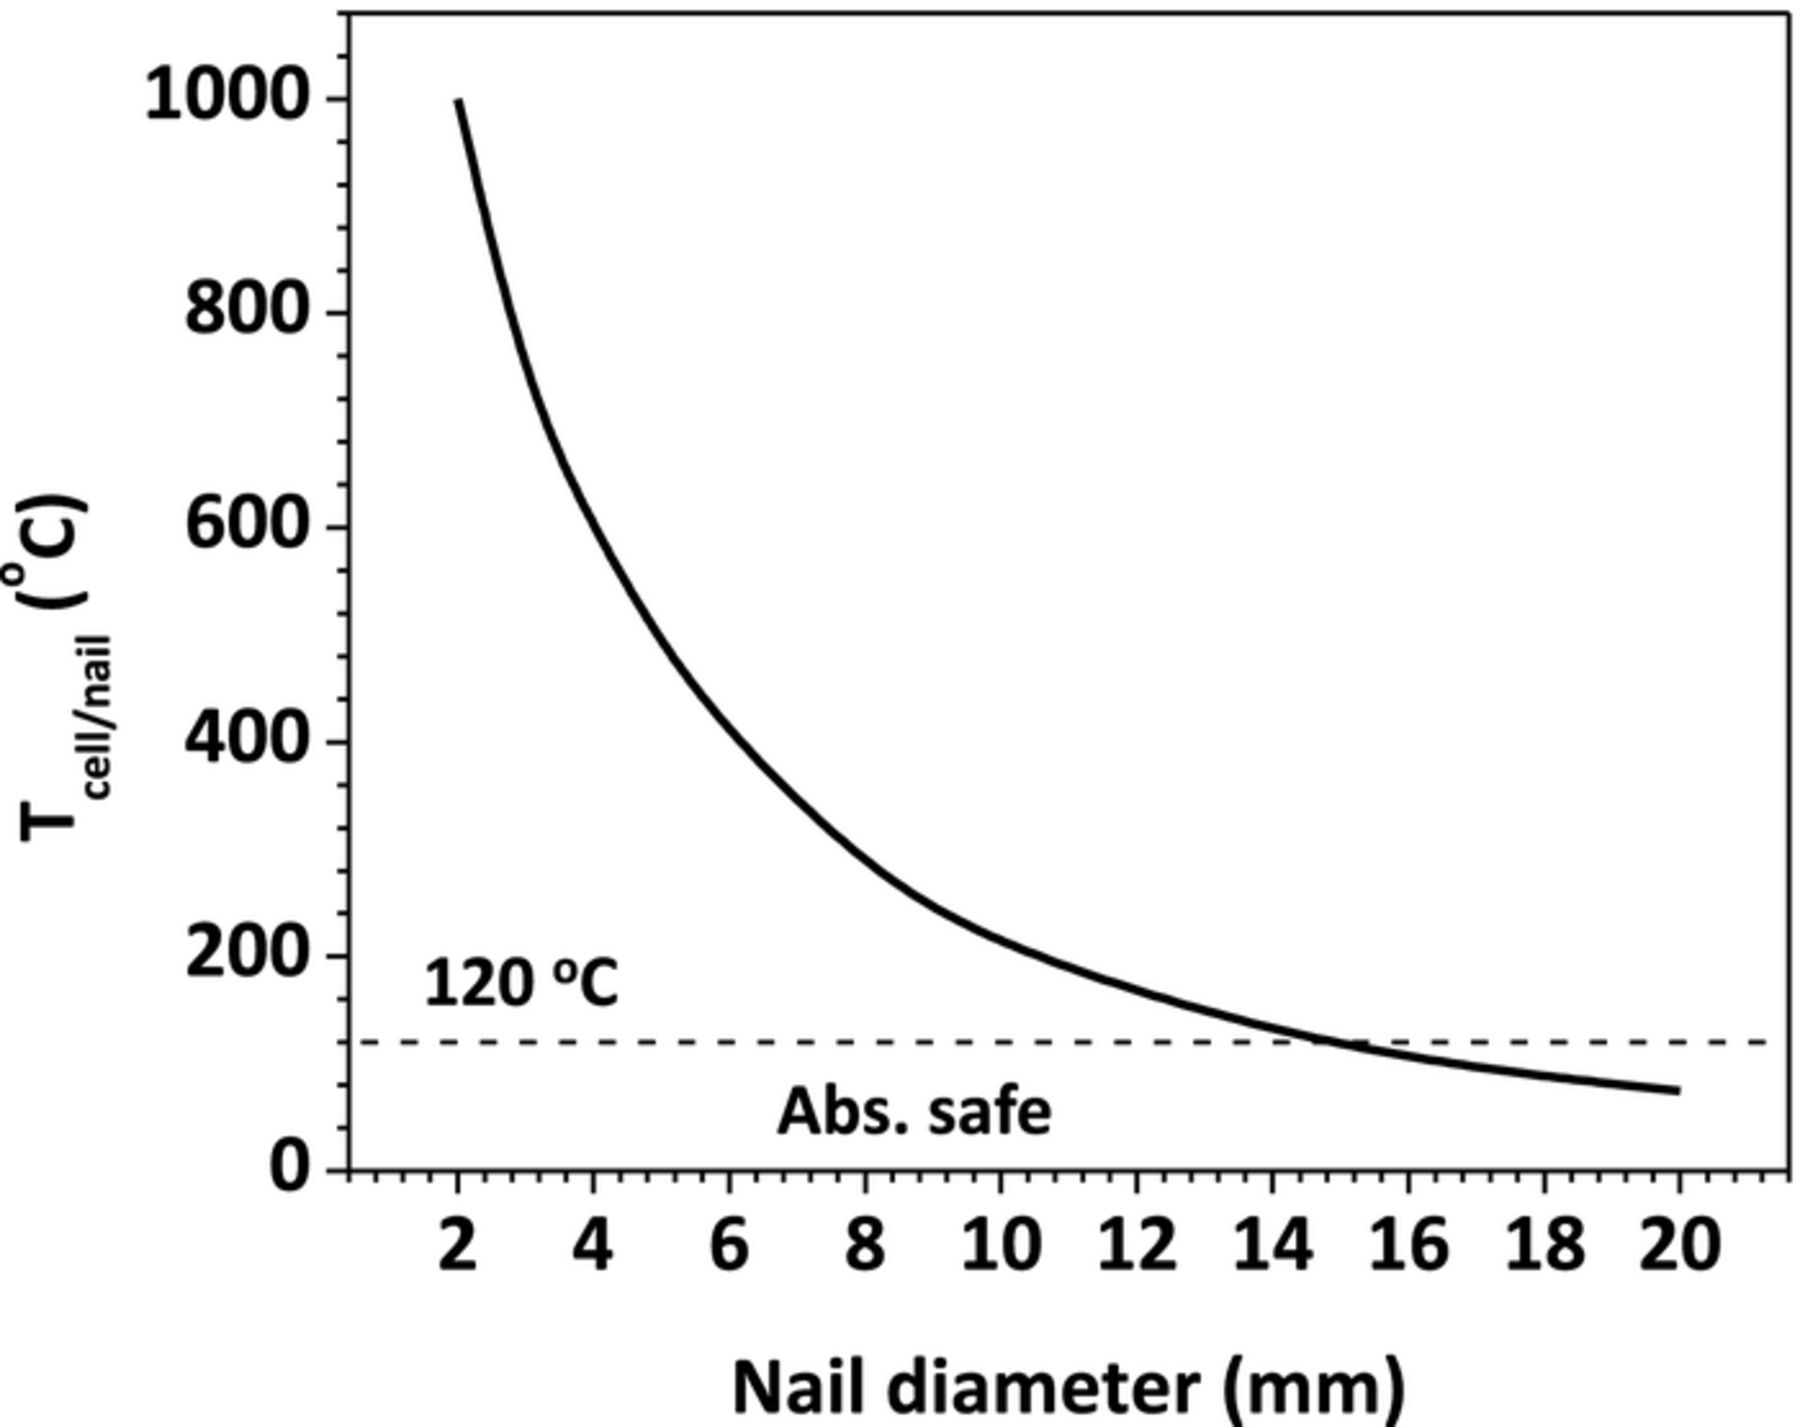
Figure 16. Tcell/nail rise during penetration as a function of nail diameter.
Similar to the shorting resistance effect, the nail diameter also has a significant influence on the heating mode. Figure 17 displays Tcell/nail − Tsurf versus the nail diameter. Tcell/nail − Tsurf is used to characterize the heating mode. If the value is small, it means all parts of the cell are uniformly heated, which indicates global heating. If large value of Tcell/nail − Tsurf is presented, there should be some locally concentrated hot spot within the cell. Here we define 200°C as the threshold temperature to differentiate global and local heating regime. As indicated in Figure 17, Tcell/nail − Tsurf decreases as the increase of nail diameter and vice versa. The switch from local heating to global heating occurs when the nail diameter is around 9 mm.
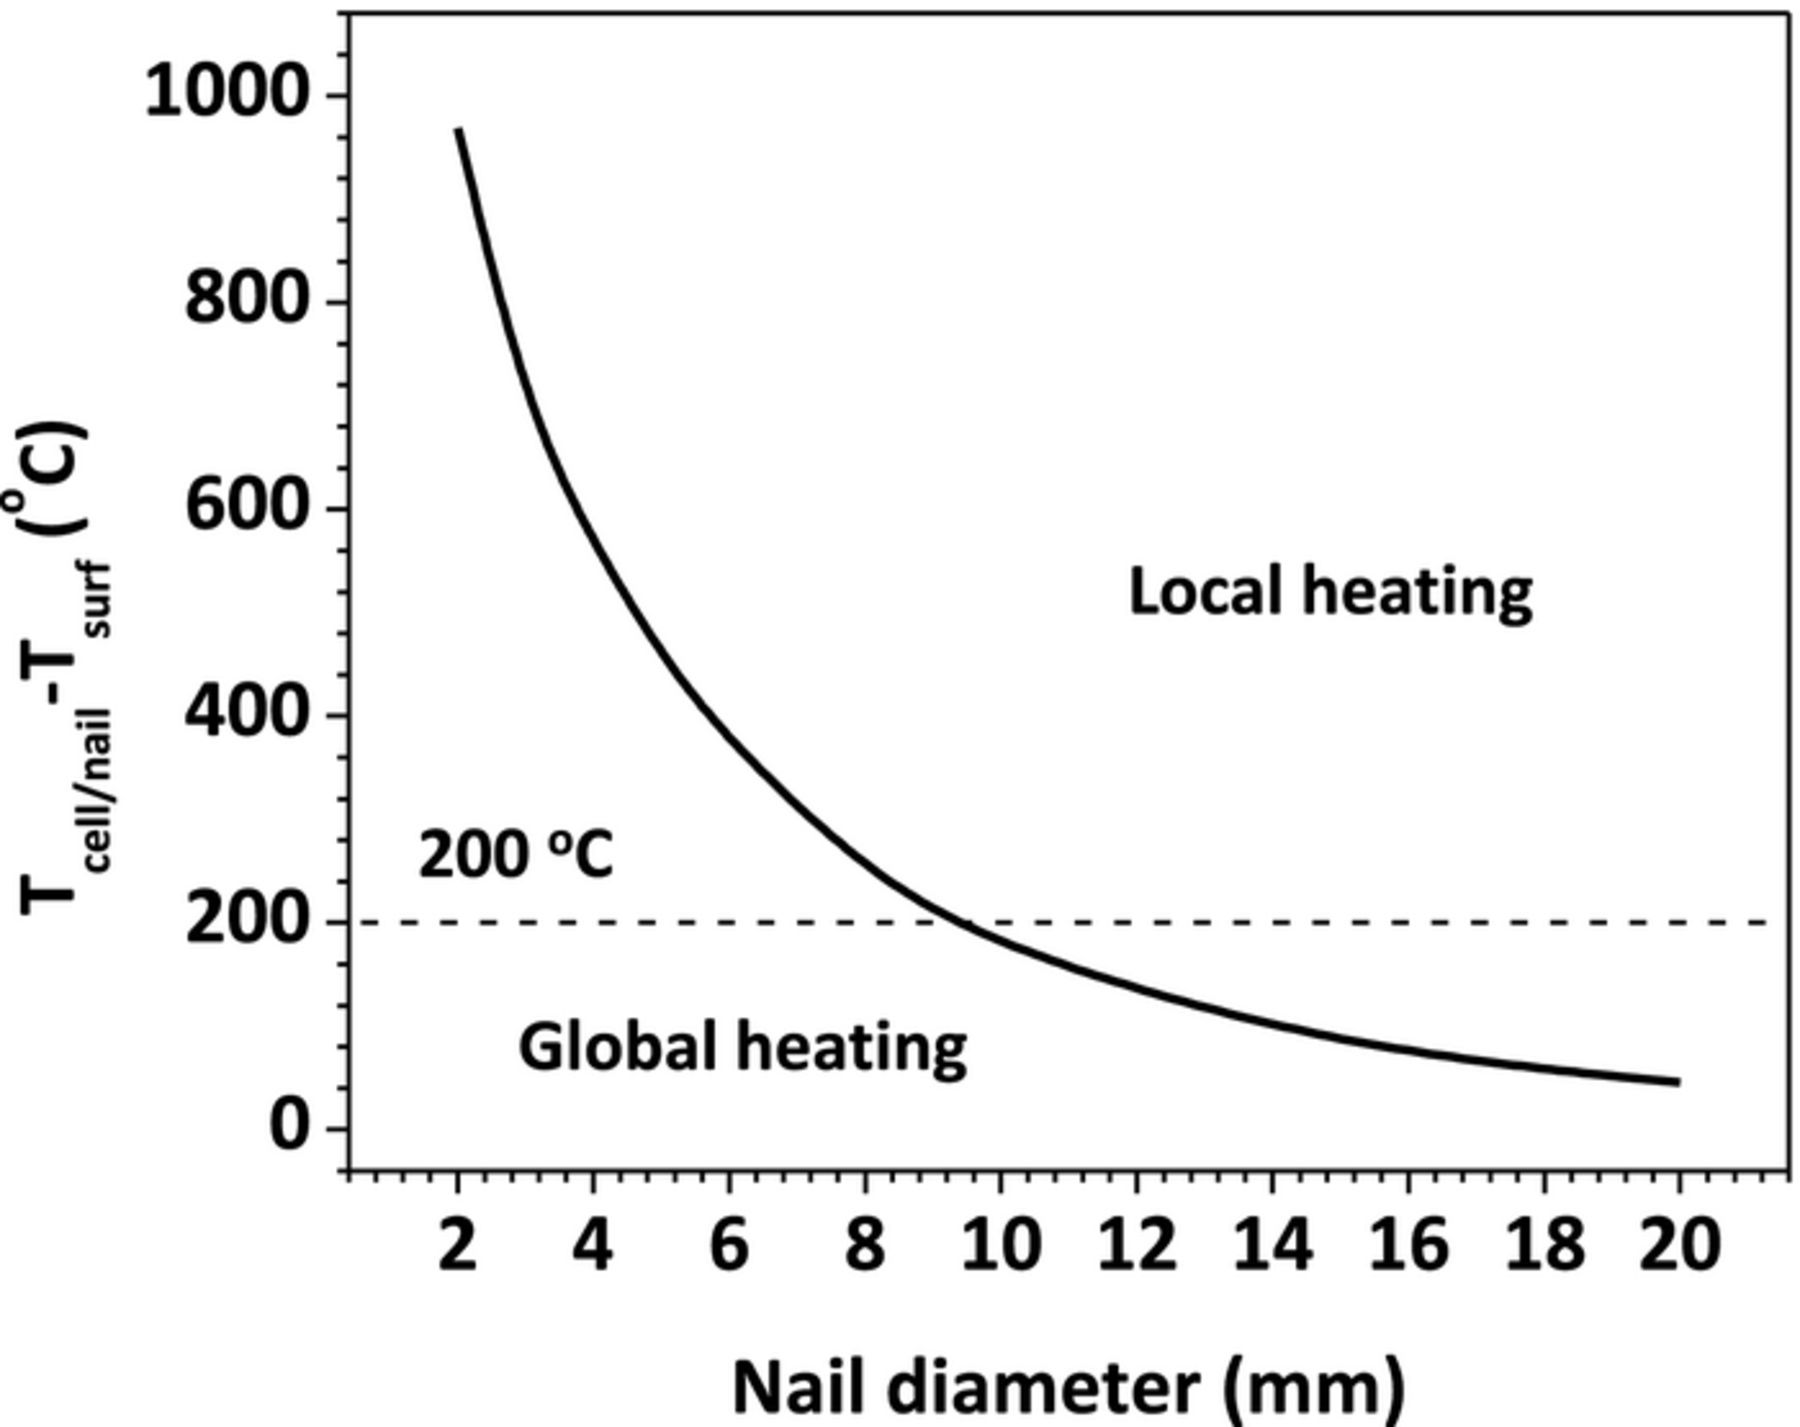
Figure 17. Difference between Tcell/nail and Tsurf as a function of nail diameter.
Figure 16 and Figure 17 tell us that using large diameter nail will induce global heating and reduce the Tcell/nail rise, which makes the cell more likely to pass the nail penetration test. Figure 18 shows the 3 D temperature contour for cells with different nail diameters. The difference between global and local heating can be clearly observed.
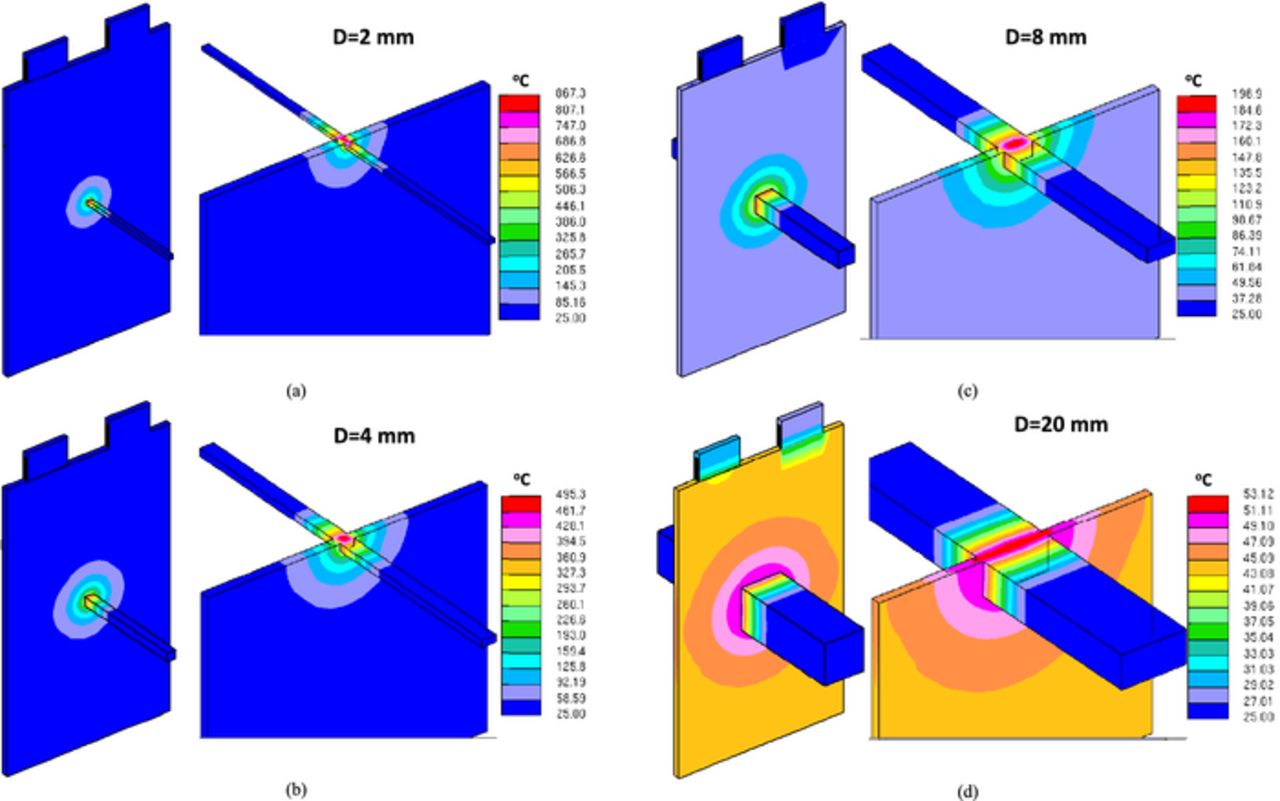
Figure 18. 3 D temperature distribution Rs = 50 mΩ (a) D = 2 mm; (b) D = 4 mm; (c) D = 8 mm; (d) D = 20 mm.
Effect of nail thermal conductivity
In most nail penetration tests, stainless steel is the typical material used for nails. As mentioned above, the electrical conductivity of the nail material has negligible effect on the shorting resistance. However, the nail thermal properties, particularly the nail thermal conductivity, plays an important role in the cell thermal response during the penetration process.
Figure 19 illustrates the Tcell/nail profile for nails with different thermal conductivities. The shorting resistance is kept constant for all cases. It is obvious that the nail thermal conductivity is a critical parameter to impact the cell thermal response. The higher the thermal conductivity, the lower the Tcell/nail rise and vice versa. Using nails with high thermal conductivity will therefore facilitate the cell to fake "passing" the nail penetration test.
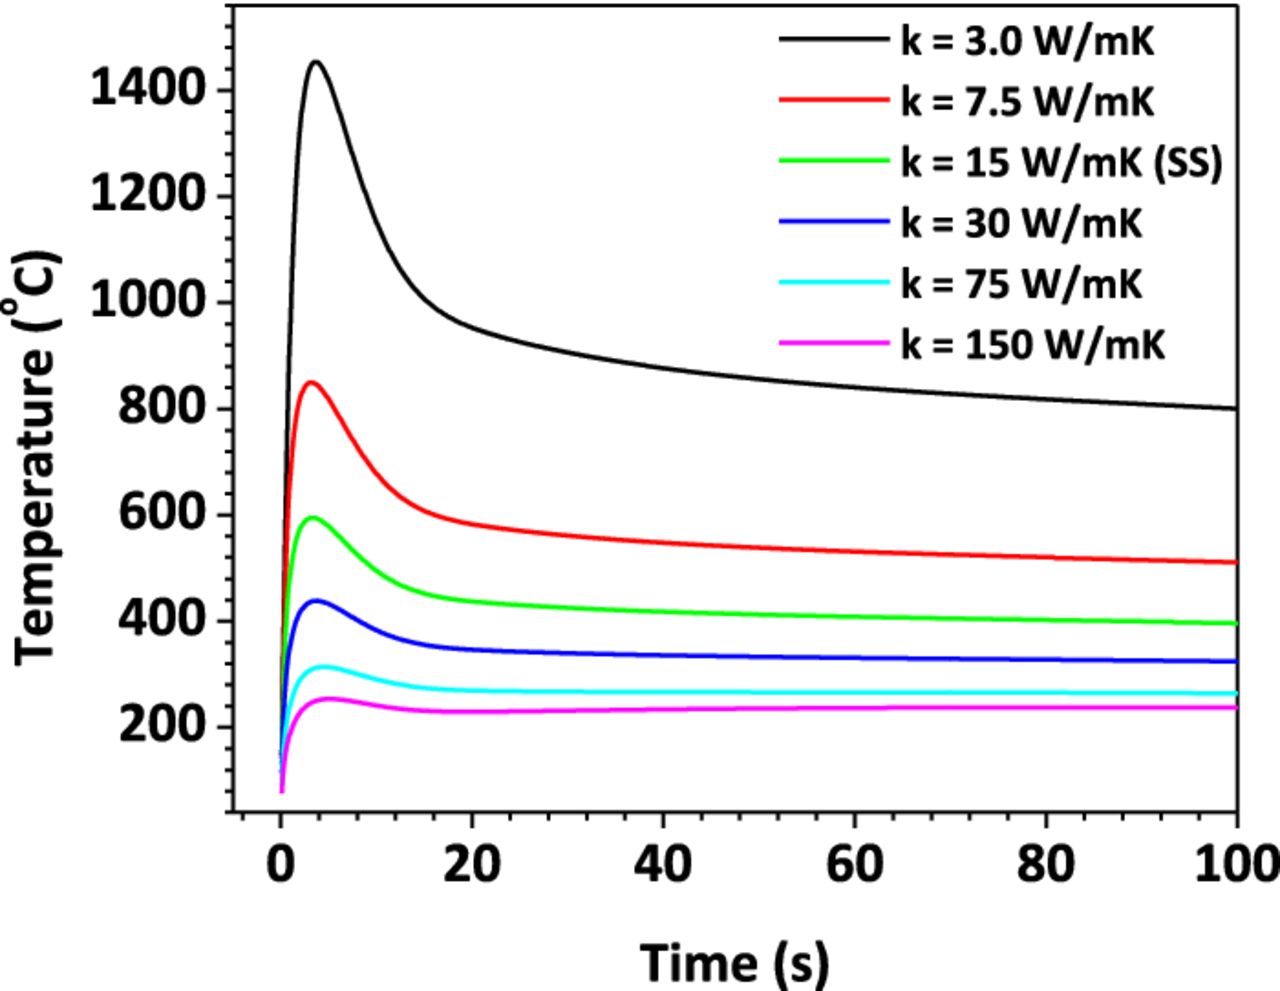
Figure 19. Tcell/nail profile for different nail thermal conductivities.
Effect of cell capacity
The above parameter studies use 5 Ah prismatic Li-ion cell, which is typical cell size used in plug-in hybrid electric vehicles (PHEV). As hybrid electric and electric vehicles (HEV/EV) become more popular, cells with larger capacity are being developed and utilized in these applications. In this section, cells with different capacities are studied to explore the capacity effect on the nail penetration process. We change the cell capacity based on the 5 Ah cell. The cell footprint area (8 cm × 13 cm) and electrode/separator/foil thickness are kept unchanged, and we change the number of electrode plates to get the desired cell capacity. For example, the baseline case 5 Ah cell has 26 electrode plates. The 10 Ah cell is therefore made of 52 electrode plates that are same as those used in the 5 Ah cell.
Figure 20a shows the Tcell/nail profiles for different capacity cells. It is evident that cell with larger capacity has higher temperature increase and will be more likely to go into thermal runaway. Figure 20b displays the Tcell/nail rise as a function of cell capacity. It can be seen that large capacity cells result in higher temperature rise and therefore are less tolerable to nail penetration and are more dangerous to use in real applications.
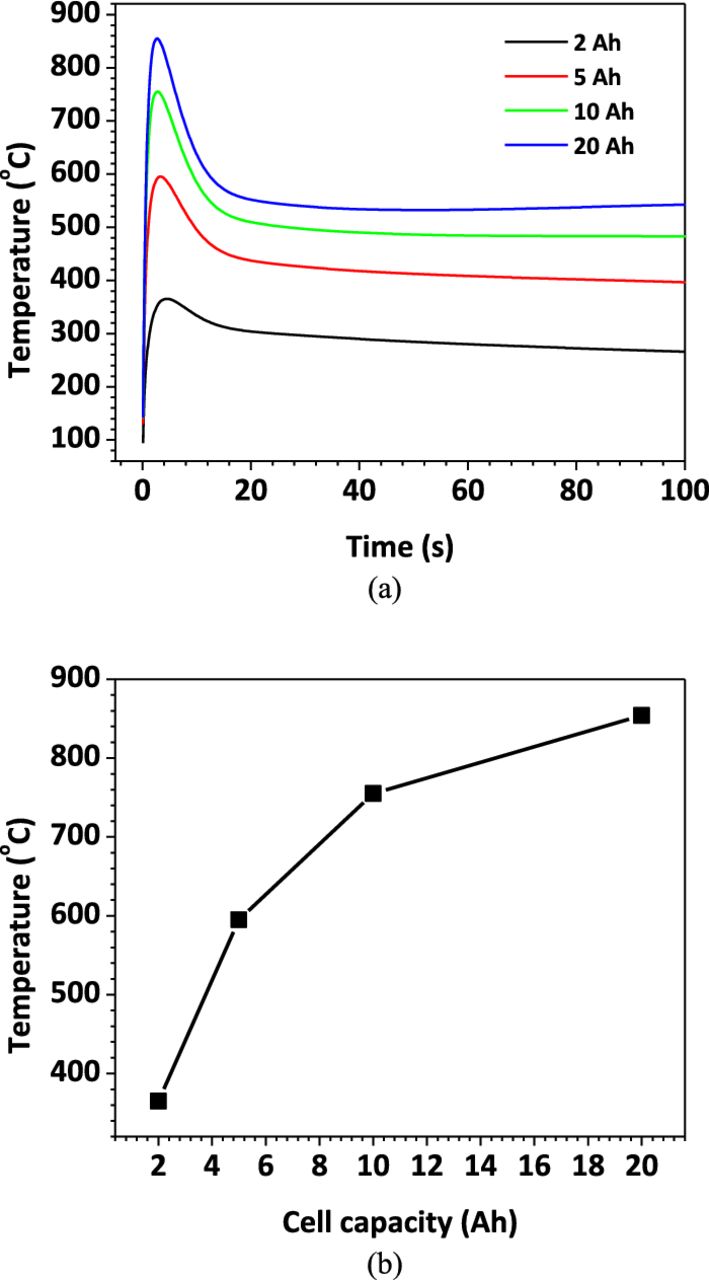
Figure 20. (a) Tcell/nail profile for cells with different capacities; (b)Tcell/nail rise during penetration as a function of cell capacity.
Conclusions
Nail penetration is a method widely used to emulate the internal short-circuit process in Li-ion cells. A common problem of the experimental investigations involving nail penetration tests is poor reproducibility of the test results. The experimental observations also provide little insight into the fundamental mechanisms that govern the cell behavior during the nail penetration process. In this paper, a comprehensive modeling study is carried out to explore the fundamental electrochemical and thermal behavior of a large-format Li-ion cell subject to nail penetration. Parametric study reveals that the shorting resistance has a significant influence on the cell electrochemical performance and heating mechanism during the penetration process. With small shorting resistance, the discharge rate is limited by the cell internal processes, such as the Li+ transport in the electrolyte. The heat generation from these internal processes contributes to most of the total heat generation, which leads to global heating of the cell. When large shorting resistance is presented, the shorting current and voltage are controlled by the shorting resistance. The total heat generation is mainly from the ohmic heat and concentrated in the nail. It is found that the Tcell/nail rise reaches its peak when the shorting resistance is close to the cell internal resistance. The effect of other parameters, including the nail diameter, nail thermal conductivity, penetration location, and cell capacity are also studied.
The present work does not consider exothermic side reactions triggered after a threshold temperature say 120°C, is exceeded. The side reactions include those of electrolyte decomposition, degradation between solvents and electrode materials, etc. Thus, thermal simulations could underestimate the cell temperature evolution after the cell undergoes thermal runaway. However, it is believed that the present model captures the onset temperature of battery thermal runaway and hence provides a useful tool to design and engineer cell structures that never reach the onset temperature of thermal runaway in nail penetration.
This modelling study provides clues to explain the fundamental mechanisms of the nail penetration process. It also partially explains the poor reproducibility of nail penetration experiment results previously reported in the literature. The shorting of the cell resulting from the nail penetration process is a highly dynamic process with strong electrochemical and thermal coupling. Modelling shows that this process is very sensitive to the various parameters of the experiment. The current nail penetration testing techniques are not able to precisely control the value of these parameters, which is the main reason for the irreproducibility of the experimental results.
Acknowledgments
Partial support of this work by DOE CAEBAT program is greatly acknowledged. We are grateful to EC Power for offering numerical algorithms and materials database through its AutoLion software and to Dr. Christian E. Shaffer for useful discussions.