Abstract
Replacement of conventional cars with battery electric vehicles (BEVs) offers an opportunity to significantly reduce future carbon dioxide emissions. One possible way to facilitate widespread acceptance of BEVs is to replace the lithium-ion batteries used in existing BEVs with a lithium-sulfur battery, which operates using a cheap and abundant raw material with a high specific energy density. These significant theoretical advantages of lithium-sulfur batteries over the lithium-ion technology have generated a lot of interest in the system, but the development of practical prototypes, which could be successfully incorporated into BEVs, remains slow. To accelerate the development of improved lithium-sulfur batteries, our work focuses on the mechanistic understanding of the processes occurring inside the battery. In particular, we study the mechanism of the charging process and obtain spatially resolved information about both solution and solid phase intermediates in two locations of an operating Li2S-Li battery: the cathode and the separator. These measurements were made possible through the combination of a spectro-electrochemical cell developed in our laboratory and synchrotron based operando X-ray absorption spectroscopy measurements. Using the generated data, we identify a charging mechanism in a standard DOL-DME based electrolyte, which is consistent with both the first and subsequent charging processes.
Export citation and abstract BibTeX RIS

This is an open access article distributed under the terms of the Creative Commons Attribution 4.0 License (CC BY, http://creativecommons.org/licenses/by/4.0/), which permits unrestricted reuse of the work in any medium, provided the original work is properly cited.
Lithium-sulfur (Li-S) batteries are an emerging battery technology that has the potential to meet the energy density and cost requirements of electric vehicles. Recently, several studies have identified that the attainment of areal capacities as high as 4–8 mAh/cm2 while minimizing the electrolyte content are the key factors in meeting these requirements.1–3 The only currently commercialized Li-S battery has a significantly lower areal capacity of 2.5 mAh/cm2 and operates in the presence of excess electrolyte,4 necessitating significant technological breakthroughs to facilitate the possible use of Li-S batteries in the transportation sector. One of the main barriers to achieving such breakthroughs is the lack of fundamental understanding of the mechanism behind the operation of Li-S batteries.1,5,6 In particular, it is not yet clear how the mechanism of discharge differs from the charge mechanism,5 and if these two processes might change upon an increase in active material loading or reduction in electrolyte volume.1 Consequently, there is a pressing need for performing operando characterization of Li-S batteries under a variety of conditions to identify fundamental aspects of the charging and discharging processes.
One attractive but insufficiently explored system for a mechanistic characterization of Li-S batteries is the charging process of a Li2S cathode, a possible alternative to the conventional S8 cathode, with a potential to enable batteries with silicon or tin rather than lithium anodes.7,8 Specifically, it has been recently reported that a Li-S battery, which is assembled in a discharged state using a Li2S cathode, requires an application of a high overpotential in the very first charge, even though each subsequent charge can be performed at a lower potential.9,10 Furthermore, several studies have shown that the exact value of the required overpotential during the first charge of Li2S can be manipulated and reduced by varying the charging rate,8,9,11 cathode morphology and structure,9,11–15 and electrolyte composition.9,16–20 The results of these recent studies, however, have not yet been incorporated into a general understanding of the charging process of Li-S batteries, and the intermediates of the initial charge of Li2S have only been characterized using X-ray diffraction (XRD),8,9 a technique that is capable of detecting crystalline solids, but cannot provide information about amorphous species. X-ray absorption spectroscopy (XAS) is an alternative operando characterization technique that is especially suited for the characterization of Li-S batteries, because it is capable of detecting solid S8 and Li2S as well as polysulfides dissolved in the electrolyte.21,22 To date, operando XAS has only been applied to the study of Li-S batteries assembled in a charged state using S8 cathodes,21–25 and has not been used to identify intermediates during the initial charge of Li2S. Since the initial charging process differs significantly from all the subsequent charges, XAS characterization of both the starting species and the intermediates associated with these charging processes has an opportunity to facilitate a significantly improved mechanistic understanding of the operation of Li-S batteries.
Motivated by advancing the mechanistic understanding of Li-S chemistry, we have performed XAS characterization of Li2S-Li battery using a spectro-electrochemical cell designed in our laboratory,21 which is capable of spatially resolved measurements. In the experiments, we obtain, for the first time, information about both solid and solution phase intermediates produced in two locations of the cell, the Li2S cathode and the separator, and thus generate a unique set of spatially resolved data that is able to discriminate between the changes in the concentration of the species in the separator and the changes in the composition of the species in both locations of the cell. Using the observed trends in the X-ray absorption spectra, we identify that S8 is forming in the DOL-DME based electrolyte throughout the entire charging process, propose a charging mechanism that is consistent with both the first and the second charge of the Li2S-Li battery, and discuss how different experimental conditions can change the charging overpotential. Furthermore, we identify that oxidation of parts of Li2S particle, which are not in direct contact with a conductive carbon support, requires a chemical step, and that during the second charge this chemical step is facilitated by the presence of a significant concentration of polysulfide intermediates. Our results demonstrate how spatially resolved spectroscopic measurements can aid in the development of a significantly enhanced fundamental understanding of an operating battery.
Experimental
Electrochemical measurements
Electrochemical measurements were performed in an operando cell developed in our laboratory21 and in a standard T-cell made from Swagelok components. In all studies, the same electrolyte was used. It consisted of 1 M lithium perchlorate (LiClO4, battery grade, 99.99% trace metal basis, Sigma-Aldrich) and 0.5 M lithium nitrate (LiNO3, 99.99% trace metal basis, Sigma-Aldrich) dissolved in a mixture of 1,3-dioxolane (DOL, anhydrous, 99.8%, Sigma-Aldrich) and 1,2-dimethoxyethane (DME, anhydrous, 99.8%, Sigma-Aldrich) (1:1 vol:vol); in the following text, we will refer to the electrolyte simply as DOL-DME. LiClO4 salt was used in our study instead of a more common bis(trifluoromethanesulfonyl) imide lithium (LiTFSI) salt, because it was important to avoid the signal of the sulfonyl group in the operando X-ray absorption spectra. Prior to use, all salts were dried under dynamic vacuum at 110°C for 48 h, using a glass oven (Büchi, Switzerland), while all solvents were dried over Sylobead MS 564C zeolites (3 Å, Grace Division) for a minimum of 24 h.
Li2S/C electrodes were prepared using commercially available powder (99.98% trace metal basis, Sigma-Aldrich), which was used as received. Weighed amounts of Li2S, Vulcan carbon (XC-72, Tanaka Kikinzoku Kogyo), and polyvinylidene fluoride (PVDF, HSV900, Kynar) were taken in an airtight container with a wt% ratio of 60:30:10 and mixed thoroughly using a planetary centrifugal vacuum mixer (Thinky, Japan). The obtained solid mixture was dispersed in 2.5 mL of N-Methyl-2-pyrrolidone (NMP, anhydrous, 99.5%, Sigma-Aldrich) in three sequential steps. After each addition of NMP, the contents were mixed until a total solid content of approximately 200 mg per milliliter of NMP was achieved. The ink was coated onto an 18 μm thick aluminum foil using a 250 μm gap Mayer rod. The ink preparation was performed under vacuum in the Thinky mixer, while the coating was done in an argon-filled glove box (MBraun; <1 ppm H2O and <1 ppm O2). Initially, the coating was dried overnight inside the glove box. Then, the electrodes were punched out either as disks with a diameter of 10 mm (for T-cells) or squares with 10 mm dimensions (for operando cells) and dried for an additional 8 h under a dynamic vacuum at 110°C, using a glass oven (Büchi, Switzerland). The obtained electrodes had Li2S loading of 2.0 ± 0.2 mg/cm2 and a thickness of approximately 90 μm.
The synthesized Li2S/C composite electrode, a lithium metal foil (99.9% purity, 450 μm, Rockwood Lithium, USA), 260 μm glass fiber separator (Glass microfiber filter 691, VWR, Germany), and 60–80 μl of electrolyte (∼40 μlelectrolyte/mgLi2S), were used to assemble electrochemical cells in an argon-filled glove box (MBraun; 1 ppm H2O and <1 ppm O2). Prior to cell assembly, the cell components of Swagelok T-cells and operando cells were dried in a vacuum oven at 70°C for several hours. The Swagelok cells and the operando cells were assembled with two or one glass fiber separators, respectively. After assembly, electrochemical cells were connected to a potentiostat (Bio-Logic SAS, France), which was used to record an electrochemical impedance spectrum (EIS) and the open circuit voltage (OCV). The open circuit voltage (OCV) period between the cell assembly and the beginning of the charge was typically 1–4 h. All charges and discharges of the cathode were performed galvanostatically at a C-rate of 0.1 h–1 or 0.2 h–1 (based on a theoretical capacity of 1165 mAh/gLi2S). Specifically, the first charge was performed at a C-rate of 0.1 h−1 to a cutoff voltage of 4.0 V vs. the lithium metal anode, while the subsequent discharge and charge were performed at a rate of 0.2 h–1 to a cutoff voltage of 1.5 V and 3.0 V vs. the lithium metal anode, respectively. To determine how the initial potential during the first charge varied with the prescribed current, two additional experiments were performed using charging rates of 0.05 h–1 (1.49 mAh/cm2) or 0.5 h–1 (0.09 mAh/cm2).
Operando sulfur K-edge XAS measurements
Sulfur K-edge XAS measurements were performed at the 14-3 beamline of the Stanford Radiation Synchrotron Laboratory (SSRL, SLAC National Laboratory, Menlo Park, USA) and at I18 beamline of the Diamond Light Source (DLS, Didcot, UK). The experimental conditions, which offered the best chance for avoiding radiation damage of the intermediate species forming in the electrolyte of the battery, were identified at the I18 beamline of the DLS, while the spatially resolved operando data presented in this paper were obtained at the SSRL. Beamline 14-3 at SSRL is an intermediate X-ray regime (2–5 keV) beamline with a Kirkpatrick-Baez (KB) mirror system, which offers a micro-focus capability. During the experiments, the beam was focused to 20 μm in one direction and defocused to 400–500 μm in the other direction to simultaneously offer spatial resolution in the direction normal to the electrodes and maximize the signal to noise ratio. The operando cell was mounted in a small sample chamber filled with helium gas at ambient pressure, and an 8 μm Kapton foil metallized with 100 nm aluminum layer (Multek, USA) was used as an X-ray window. The exact position of the cell relative to the X-ray beam was controlled by a Newport sample stage with submicron accuracy. During the OCV period, a line scan, which monitored sulfur fluorescence signal, was used to identify the positions of the Li2S electrode (sulfur containing region) and the separator (the region without any initial sulfur species).
Throughout the experiment, X-ray absorption spectra were recorded at the sulfur K-edge in fluorescence mode using a Vortex silicon drift detector (Hitachi) with Xspress3 pulse processing electronics (Quantum Detectors). The incoming X-ray beam was monochromatized using a Si(111) crystal, and its intensity (I0) was measured using an ion chamber positioned near the exit of the beam. To avoid unnecessary irradiation of the sample, data acquisition was performed approximately every 130 mAh/gLi2S and consisted of an average of two spectra with each spectrum lasting 3 minutes and having a step size of 0.5 eV in the 2466–2483 eV region. To account for possible changes in the incoming X-ray beam, all collected X-ray absorption spectra were divided by I0, yielding the raw absorption of the sulfur K-edge, in which the edge step provides a measure of the relative concentration of the sulfur species. These raw spectra were subsequently processed using the Athena software package to yield the normalized spectra with an edge-step of one.26 The energy scale of all spectra was calibrated to a literature value of the maximum of the sulfur K-edge of 2472.0 eV.27 Depending on whether the focus is on the changes in the concentration or the type of sulfur species, either the raw or the normalized spectra are presented.
XAS data analysis
Three standards: S8, Li2Sn in DOL-DME, and Li2S were used to perform analysis of X-ray absorption spectra using the same general approach as described previously.21 Li2S standard was prepared from a commercially available powder (99.98% trace metal basis, Sigma-Aldrich). To minimize the self-absorption experienced by the standard, the sample was both ball-milled to reduce the particle size of Li2S and diluted with boron nitride to 0.5 wt%. S8 standard was prepared from commercially available S8 powders (99.998% trace metal basis, Sigma-Aldrich), which was grinded using mortar and pestle and diluted with boron nitride to 0.5 wt%. Li2Sn (Li2S6 average composition) standard was a solution-based standard synthesized in a DOL-DME solvent using the same commercially available Li2S and S8 powders. More specifically, 11.5 mg of Li2S was mixed 40.1 mg S8 in 5 ml of DOL-DME solvent and stirred overnight. X-ray absorption near edge structure (XANES) spectra of the three references are presented in Fig. 1. The figure highlights the features, which are subsequently used to distinguish between the three types of sulfur species. S8 standard has only one peak at 2472 eV and a distinct concave feature at 2475.5 eV. Li2S has two peaks, with one peak centered at 2473 eV and the other at 2476 eV, and can be identified by a convex shape at 2475.5 eV. Li2Sx standard has a spectrum that is similar to the spectrum of S8, but with an additional smaller peak at 2470–2471 eV, which corresponds to a charged terminal sulfur atom found in all polysulfides.28 Although, in theory, it may be possible to distinguish between various polysulfide species by comparing the ratio between the two features at 2470 eV and 2472 eV,28 which correspond to terminal and internal sulfur atoms, such analysis is complicated by the fact that sulfur also has a feature corresponding to an internal atom at 2472 eV and by the possible effects of self-absorption, which cannot be avoided at sulfur concentrations above 30 mM.29 Therefore, in our study, we will not perform quantitative principle component analyses, but will use the three discussed features of S8, Li2S, and Sn2− to qualitatively analyze the obtained spectra.
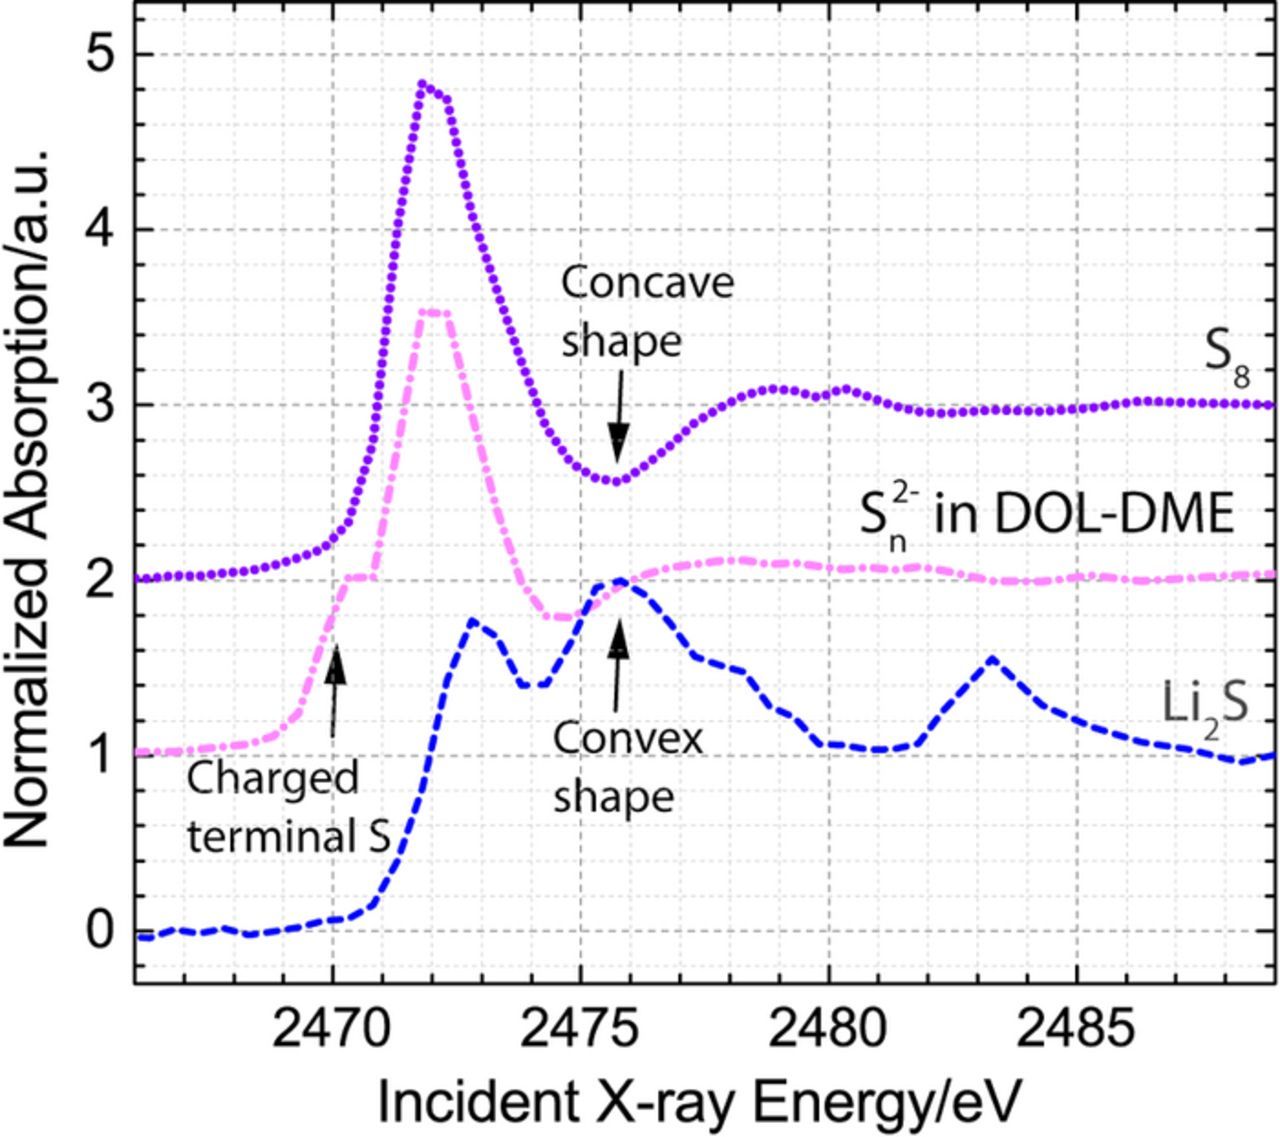
Figure 1. XANES spectra of three references: Li2S (dashed line) and S8 (dotted line) powders diluted to ∼0.5 wt% in boron nitride and solution phase polysulfides (Sn2−, average composition of Li2S6) dissolved in DOL-DME solvent (dash-dotted line).
Results and Discussion
Successful spatially resolved XAS measurements during the charging process of Li-S batteries require an operando battery cell that can achieve both a standard electrochemical performance and allow spectroscopic access to the electrodes and the separator. Consequently, prior to using our operando cell at the synchrotron facility, we had focused on the electrochemistry of the cell and confirmed that it could achieve the same electrochemical behavior as a standard T-cell design with a Li2S cathode (∼2 mgLi2S/cm2), a lithium metal foil anode, and a glass fiber separator soaked with 80 μl of electrolyte (1 M LiClO4 and 0.5 M LiNO3 dissolved in a DOL-DME). In Fig. 2, we plot the galvanostatic charge and discharge curves in both the operando cell and a standard T-cell as a function of time (Fig. 2a) and specific capacity (Fig. 2b). In the experiments, the first charge is performed at a C-rate of 0.1 h−1, while the subsequent discharge and second charge are performed at a rate of 0.2 h−1 (referring to the theoretical capacity of 1165 mAh/gLi2S). As seen in Fig. 2a, the electrochemical performance of the T-cell and the operando cell are nearly identical. Both cells reach close to 100% of the theoretical capacity during the first charge, then discharge to approximately 75% of the theoretical capacity, and finally, during the last charge, reach 55% of the theoretical capacity. Additionally, in agreement with literature,8,9,12 the first charge in both cells requires a significantly higher potential than the second charge. To highlight this difference in the required potential and to visualize what fraction of the theoretical capacity was reached during the first and the second charging processes, the same two charge curves are plotted as a function of specific capacity in Fig. 2b, while the discharge curve is omitted for clarity. Fig. 2b clearly demonstrates that the operando cell is able to reproduce the expected galvanostatic charge curves of the Li2S cathode and can therefore be combined with XAS measurements to identify the intermediates produced during the initial and subsequent charging processes.

Figure 2. a) Benchmarking of the operando electrochemical cell against a standard T-cell made from swagelok components. The electrode loading was 2.0 ± 0.2 mgLi2S/cm2 and 60–80 μL (∼40 μlelectrolyte/mgLi2S), of DOL-DME electrolyte with 1 M LiClO4 and 0.5 M LiNO3 was added; metallic lithium foil was used as anode. b) Visualization of the difference in the charging potential between the first (solid lines) and the second (dashed lines) charges of Li2S-Li cells.
After appropriately benchmarking the electrochemical performance of the operando cell, we confirmed its spectroscopic spatial resolution capabilities at a synchrotron facility. Fig. 3a compares the raw XANES spectra obtained in the cathode and the separator of the battery at the open circuit voltage (OCV) before starting the initial charge with the raw spectrum of the Li2S reference. We have chosen to present the raw spectra rather than the spectra with a normalized edge-step of 1, in order to provide a measure of the relative concentration of the sulfur species in the two locations of the battery. Since the battery is resting at OCV, the cathode (a sum of active material and solution species trapped in the pores of the electrode) is expected to contain exclusively Li2S, while the separator (solution species) is expected to not have any sulfur species, because Li2S is not soluble in organic solvents such as DOL-DME.30 Inspection of the spectra in Fig. 3 is consistent with these expectations, identifying the species inside the cathode as Li2S and failing to detect any significant absorption at the sulfur K-edge in the separator. Our results are the first demonstration of XAS measurements with spatial resolution in a direction normal to the electrodes, enabling a spectral distinction between species located in either one of the electrodes versus species contained in the separator of the same cell. After the successful confirmation of the spatial resolution capabilities of the operando cell and identification of the initial species in the cathode and the separator region, the battery was cycled using the same conditions as in the benchmarking experiments, and two new XANES spectra were collected in both locations at an interval of about 130 mAh/gLi2S. The resulting galvanostatic curves are plotted as a function of time in Fig. 3b. The same charging curves are also replotted as a function of specific capacity and are presented with the associated operando XANES spectra in Figs. 4 and 6.
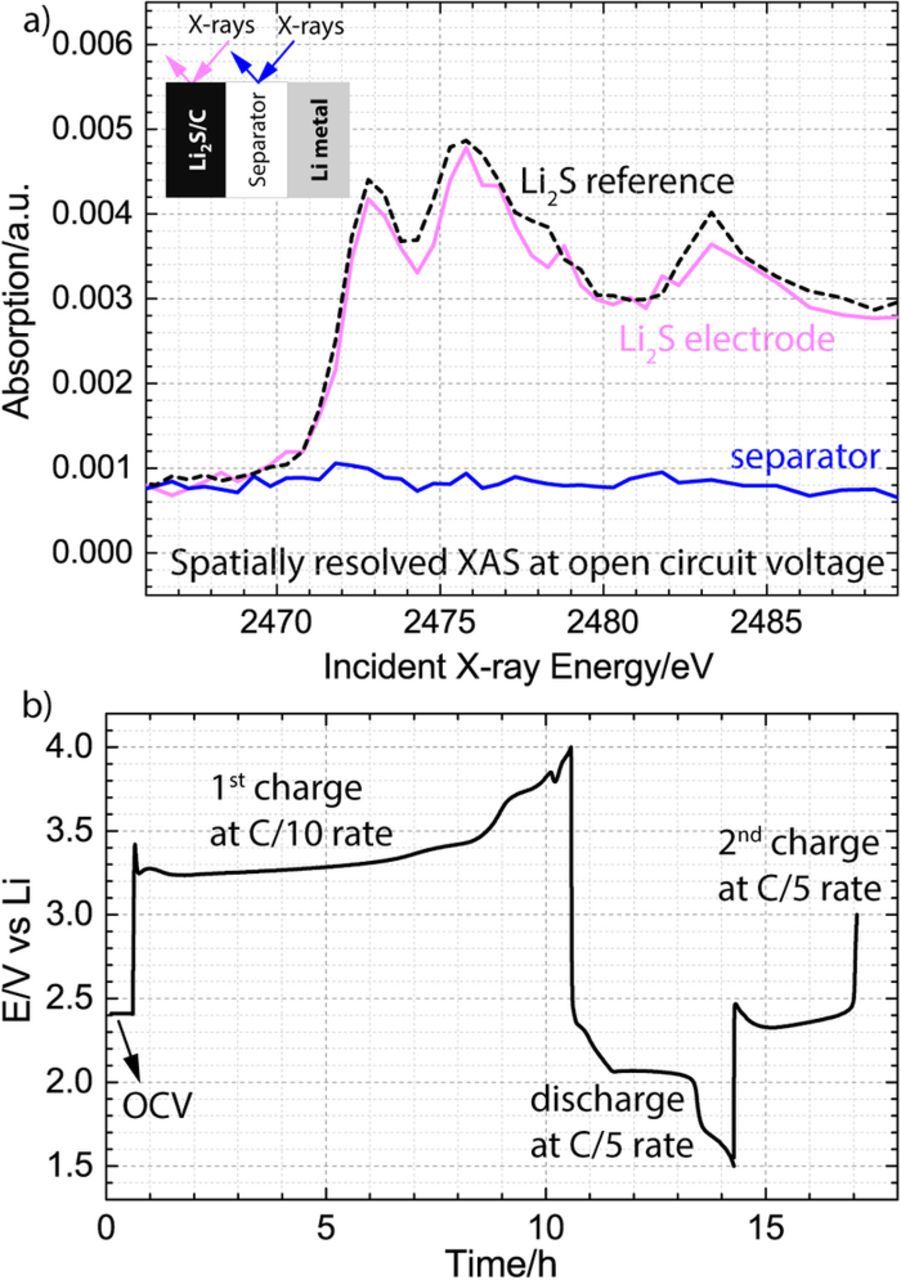
Figure 3. a) Validation of the spatially resolved X-ray absorption measurement capability during the open circuit voltage (OCV) period, demonstrating that the cathode consists only of Li2S and that the separator does not have sulfur species. b) Operando electrochemistry in 1 M LiClO4 and 0.5 M LiNO3 dissolved in DOL-DME solvent showing 0.5 h OCV period, the 1st charge at a rate of 0.1 h−1 (0.23 mA/cm2) as well as subsequent discharge and 2nd charge at a rate of 0.2 h−1 (0.46 mA/cm2). The loading of Li2S electrode was 2.0 mg/cm2, and 80 μl of electrolyte was added to one glass fiber separator (∼260 μm thickness).
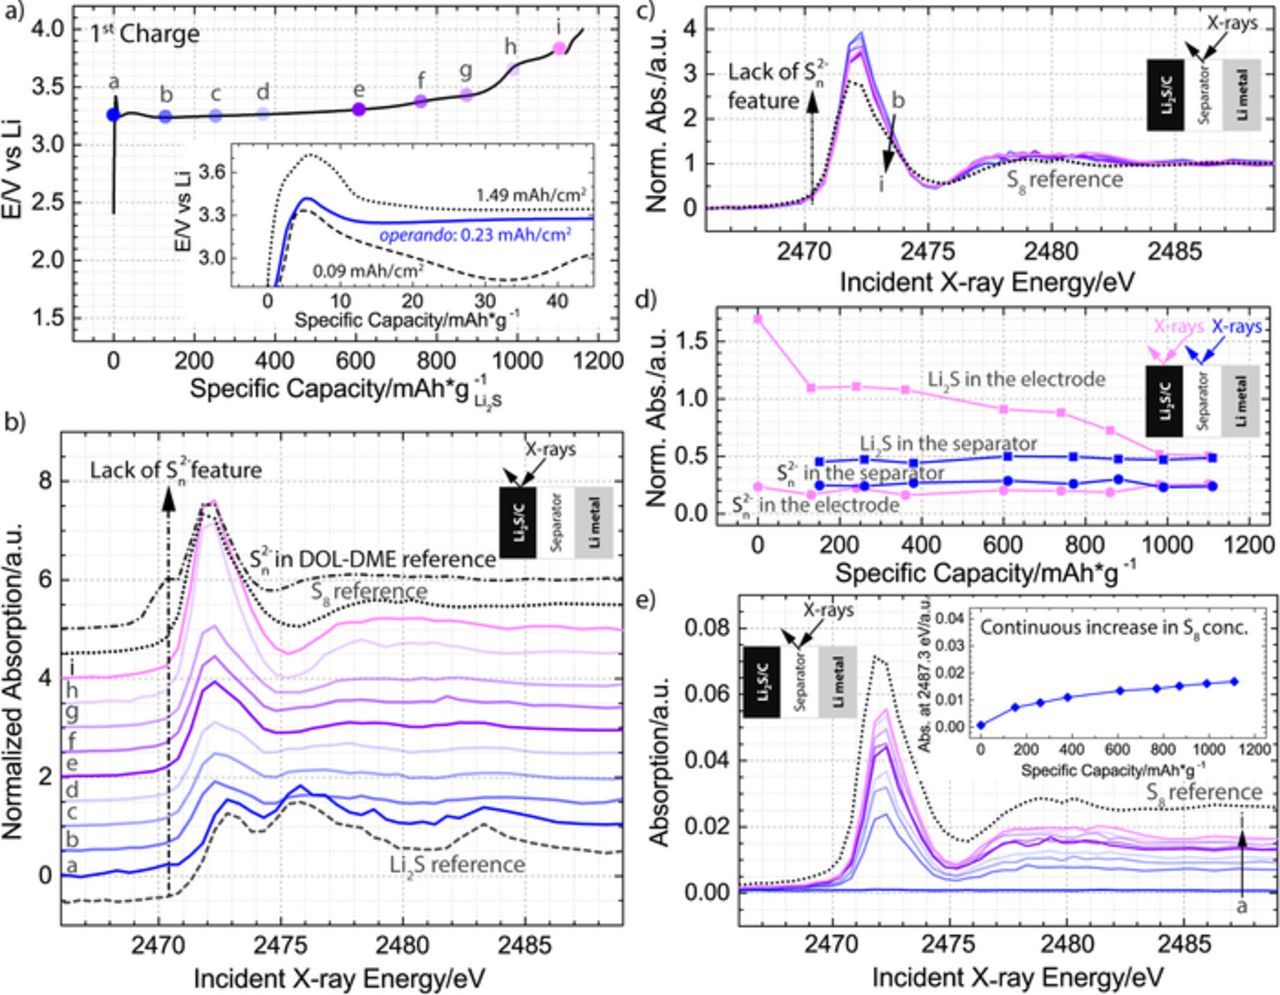
Figure 4. a) First charge in 1 M LiClO4 and 0.5 M LiNO3 dissolved in DOL-DME solvent plotted as a function of specific capacity normalized to the mass of Li2S in the cathode with dots a-i indicating where spatially resolved X-ray absorption spectra were obtained; the inset shows the initial activation barrier for the charging process shown in the main plot as well as two additional processes performed at charging rates of 0.5 h−1 (1.49 mAh/cm2) and 0.05 h−1 (0.09 mAh/cm2). b), c) Normalized XANES spectra collected in the Li2S cathode b) or the separator c); Li2S, S8, and polysulfide references are also plotted for comparison in b), while S8 reference is plotted in c). d) Demonstration of the decrease in Li2S component inside the electrode, without an associated increase in the Sn2− component in the electrode structure; for comparison, equivalent trend lines are shown for the spectra obtained in the separator, which did not have the features of either Li2S or Sn2−. Li2S (squares) is represented by the normalized intensity at 2475.3 eV, while Sn2− (circles) is represented by the normalized intensity at 2470.3 eV. e) Raw XANES spectra collected in the separator of the battery; S8 reference is plotted for comparison and the inset illustrates how the absorption intensity at incident energy of 2487.3 eV changes throughout the charging process.
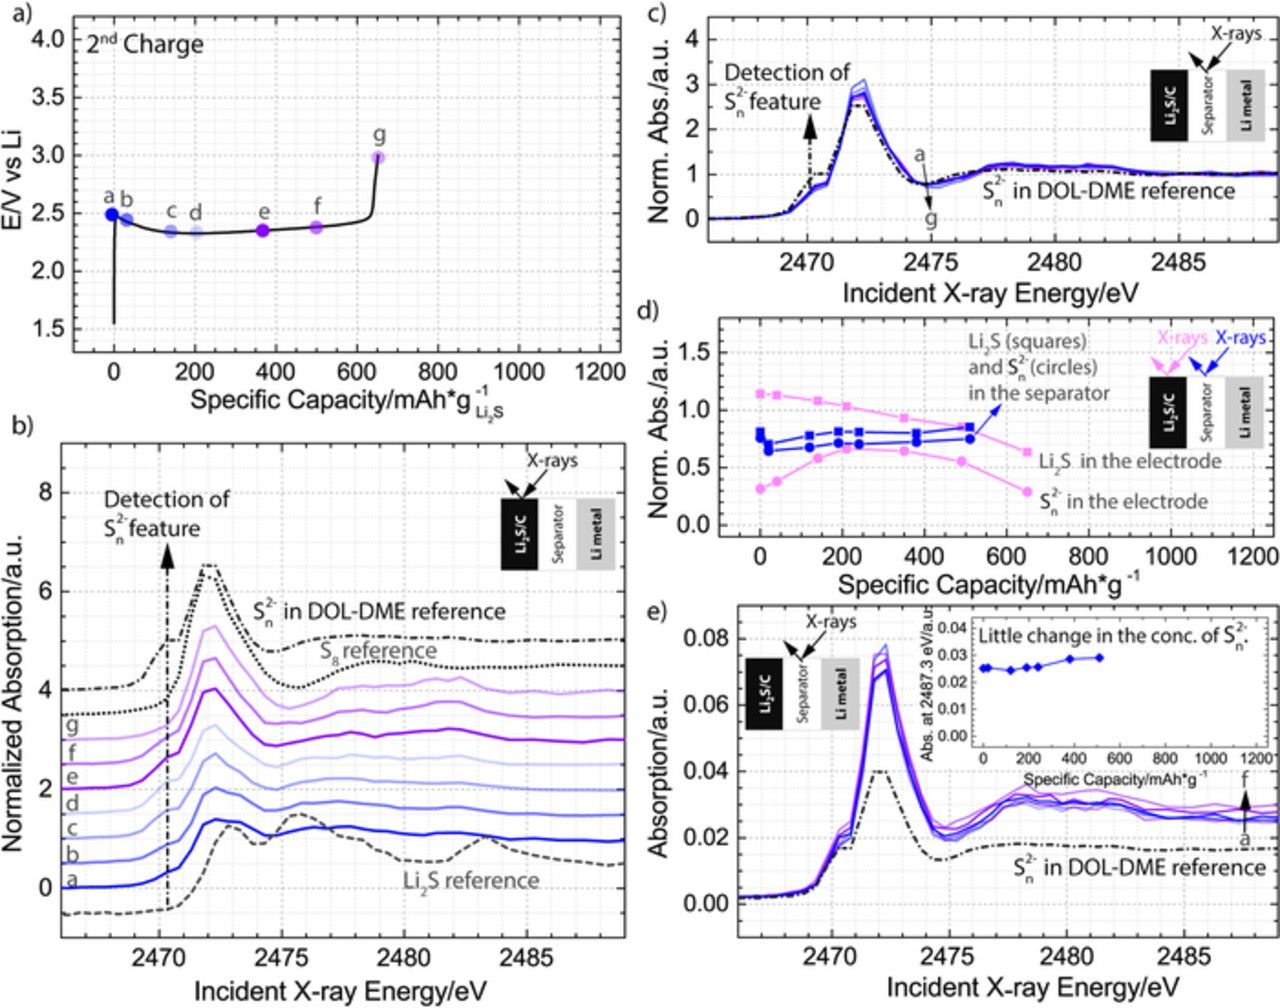
Figure 6. a) Second charge in 1 M LiClO4 and 0.5 M LiNO3 dissolved in DOL-DME solvent plotted as a function of specific capacity normalized to the mass of Li2S in the cathode with dots a-f indicating where spatially resolved X-ray absorption spectra were obtained. b), c) Normalized XANES spectra collected in the Li2S cathode b) or the separator c); Li2S, S8, and polysulfide references are also plotted for comparison in b), while the polysulfide reference is plotted in c). d) Demonstration of the decrease in Li2S component inside the electrode, with an associated detection of polysulfide species in the electrode; for comparison, the same trend lines are shown for the spectra obtrained in the separator, in which no significant changes in the composition of the components occurred throughout the charge. The Li2S fraction (squares) is represented by the normalized intensity at 2475.3 eV, while the polysulfide fraction (circles) is represented by the normalized intensity at 2470.3 eV. e) Raw XANES spectra collected in the separator of the battery; polysulfide reference is plotted for comparison, and the inset illustrates how the absorption intensity at incident energy of 2487.3 eV changes throughout the charging process.
Fig. 4a presents the initial charge of the Li2S cathode, demonstrating that close to 100% of the theoretical capacity (1165 mAh/gLi2S) was achieved using a C-rate of 0.1 h−1 and that the initiation of the charging process required a short-term rise in the potential to a maximum value of 3.4 V (Fig. 4a inset), which, in agreement with literature,9,11 is dependent on the charging current. Additionally, the figure identifies the approximate location of 9 points (a-i), which correspond to a set of operando spectra collected either in the cathode or in the separator. Inspection of the normalized spectra obtained in the cathode (Fig. 4b), which are progressively shifted up by 0.5 a.u. for clarity, shows that at the very beginning of the charge, the cathode consists of only Li2S, and that at the very end of the charge, the cathode consists of only S8. Furthermore, while the spectra are continuously changing throughout the charge, no additional features appear in the 2470–2471 eV region, the signature region of the polysulfide intermediates.28 The normalized spectra from the separator (Fig. 4c) further confirm that no detectable concentration of polysulfide intermediates is generated during the first charge. In particular, the spectra demonstrate that only one type of species, which correspond to a fully oxidized product, S8, is found in the separator throughout the entire process (b-i). A normalized spectrum is not associated with the OCV period (point a), because after the assembly of the battery, we did not detect any species in the separator (Fig. 3a). To visualize more clearly how the spectra are developing throughout the charge, we plot the normalized intensity related to the Li2S feature at 2475.3 eV and the normalized intensity of the polysulfide feature at 2470.3 eV for both the cathode and the separator in Fig. 4d. Although Li2S was present only in the cathode, and polysulfide species were not detected in either location, all four sets of data are included to facilitate comparison and demonstrate the expected normalized intensity in the absence of the species. From Fig. 4d, it is seen that the normalized intensity of the cathode at 2475.3 eV decreases up until 1000 mAh/gLi2S, indicating a gradual conversion of Li2S to S8. After this point, no additional change is detected in the measured spot, despite the fact that the charging process proceeds, indicating that there is heterogeneity in the electrode or that some electrolyte oxidation is occurring.
To extract more information about the intermediates in the separator, Fig. 4e presents the raw XANES spectra, which directly probe the amount of species present, rather than providing information on the relative ratios of components as is the case for the normalized spectra presented above. From the plot, it is evident that the concentration of dissolved S8 is changing throughout the charge. To visualize these changes, we plot the absorption intensity at incident energy of 2487.3 eV (i.e., the edge height) in the inset of the Fig. 4e. The inset demonstrates that formation of S8 can be detected as early as after 10% of the charging process, and that the concentration of S8 is increasing throughout the entire process. Our sensitivity to detecting S8 in both the separator and the cathode is a significant improvement over previous operando studies based on XRD characterization, which could detect formation of S8 only after 60% of the charging process,8 or not at all.9 Furthermore, our results demonstrate that during the first charge occurring at a significant overpotential, polysulfides do not exist in a detectable concentration, and that it is possible to extract the entire theoretical capacity by converting Li2S to S8.
To clarify what type of specific processes occur inside the battery based on DOL-DME electrolyte during the first charge, we need to consider how micro-meter sized insulating Li2S particles could become electrochemically activated. It has been originally proposed that the first step to oxidation of Li2S is a charge transfer step that leads to a lithium-deficient surface on the surface of large Li2S particles.9,12 This mechanism, however, does not provide a sufficient explanation for how an activation of an upper limit of 6% of the volume (10 nm outer layer of a particle with a diameter of 1000 nm, assuming that the whole outer surface of the particle is in contact with carbon) could lead to an extraction of the entire capacity. Therefore, a more likely mechanism involves a redox mediator that diffuses between the conductive carbon surface and the Li2S particle and thus eliminates the need for direct contact between the two materials.16 A recent study by Koh et al. has provided support for this mechanism by demonstrating that it was possible to charge Li2S particles that were electronically completely isolated from the carbon electrode in a cell using a DME electrolyte.31 The authors had proposed that the first charge of Li2S did not occur through a direct electrochemical oxidation of Li2S but rather through a combination of electrochemical and chemical reactions involving polysulfide impurities that lead to the generation of polysulfide redox mediators.31 Although our spatially resolved XAS measurements do not detect polysulfides (sensitivity of XAS is on the order 100 ppm32 or approximately 1 mM of dissolved sulfur (S1 basis) in DOL-DME) and therefore, rule out polysulfide intermediates as sole redox mediators during the first charge occurring at a significant overpotential, they are consistent with either a combination of S8 and a trace concentration of polysulfides or electrolyte oxidation fragments acting as such mediators.
To understand which of these two possibilities is occurring inside the battery, we need to consider the electrochemical and chemical reactions that can facilitate conversion of Li2S to S8 to an extent equating to close to a 100% theoretical capacity. The possible reaction pathway involving a combination of S8 and a trace concentration of polysulfides is shown in Equations 1–3. In this proposed mechanism, the electrochemically generated S8,solid subsequently dissolves and diffuses toward a Li2S particle. Then, S8,solution and Li2S react chemically to produce Sn2− in trace concentrations, and Sn2− converts through a series of chain-growth/disproportionation reactions to a polysulfide species that can be electrochemically oxidized to solid S8. The produced S8,solid can then dissolve and again react chemically with Li2S. Consequently, during the first charge, parts of the micro-meter sized Li2S particles which have interfacial contact with the conductive carbon support could become electrochemically activated (Equation 4), reflected by the occurrence of a peak potential (see inset of Fig. 4a) during the extraction of the first 10 mAh/gLi2S of the capacity (∼1% of the theoretical capacity). At the same time, other parts of the micro-meter sized Li2S particles could become oxidized through a series of chemical reactions (Equations 1–2), leading to production of polysulfides that can be electrochemically oxidized to S8 (Equation 3), thus, enabling the extraction of the entire theoretical capacity. The fact that no polysulfides were detected by XAS is also consistent with this proposed mechanism, invoking only a trace concentration of polysulfides at any particular point of the charging process.
![Equation ([1])](https://content.cld.iop.org/journals/1945-7111/163/6/A930/revision1/d0001.gif)
![Equation ([2])](https://content.cld.iop.org/journals/1945-7111/163/6/A930/revision1/d0002.gif)
![Equation ([3])](https://content.cld.iop.org/journals/1945-7111/163/6/A930/revision1/d0003.gif)
![Equation ([4])](https://content.cld.iop.org/journals/1945-7111/163/6/A930/revision1/d0004.gif)
When considering the possibility of electrolyte facilitating oxidation of Li2S, it is challenging to come up with a reaction pathway that is consistent with the observed electrochemistry. Unlike direct electrochemical oxidation of Li2S, electrochemical oxidation of ethers or salts is not expected to depend on the current density and therefore, the short-term rise in the potential at the beginning of the charging process cannot be primarily attributed to electrolyte oxidation. Additionally, if only a small concentration of electrolyte oxidation products is generated during the extraction of the first 10 mAh/gLi2S, it is unclear how these species would get regenerated during the rest of the charging process, after they are consumed in a redox reaction that leads to oxidation of Li2S. Alternatively, if the electrolyte species are electrochemically oxidized throughout the entire charging process, then the fact that electrolyte is present in excess in the battery would mean that this process can occur independently of subsequent oxidation of Li2S, pointing to an unwanted additional side reaction, rather than a mediating process. In this scenario, it is unclear why the charging process would stop and not continue beyond the observed extracted capacity of 1160 mAh/gLi2S. Taking into account these considerations, we only consider a combination of S8 and a trace amount of polysulfides as a viable reaction pathway that can lead to a complete conversion of Li2S to S8, but note that we cannot rule out that some electrolyte oxidation is also occurring during the charging process.
The discussed charging mechanism involving S8 and polysulfides is portrayed schematically in Fig. 5. In addition to Equations 1–4, the figure includes three additional processes that are expected to occur inside the battery. In the first additional process, the solution species may diffuse to the anode and react chemically with Li metal. This process explains why it may be difficult to accumulate a considerable concentration of polysulfides during the first charge of Li2S cathodes and is supported by recent results of Wang et al., who were able to first electrochemically activate Li2S at 3.8 V and then complete the charging process at a significantly lower potential of 2.6 V in the presence of a ceramic barrier separating solution species from the lithium anode.19 The other two additional processes correspond to chemical reactions that can occur in the event that a significant concentration of polysulfides is generated inside the battery. In addition to getting electrochemically oxidized at the electrode, these polysulfides can react chemically with solid Li2S and S8 and convert more of the total [S] concentration to polysulfides as shown by Equations 5 and 6.
![Equation ([5])](https://content.cld.iop.org/journals/1945-7111/163/6/A930/revision1/d0005.gif)
![Equation ([6])](https://content.cld.iop.org/journals/1945-7111/163/6/A930/revision1/d0006.gif)
Having clarified the intermediates of the first charge and identified a possible charging pathway in the DOL-DME electrolyte, we now examine the details of the subsequent charge. The second charge began after 75% of the theoretical capacity was extracted during the discharge and reached 55% of the theoretical capacity (73% of the capacity reached during the discharge) at an overpotential that was significantly lower than the overpotential of the first charge. The process is shown in Fig. 6a together with the approximate location of 7 points (a-g), which are associated with a set of operando spectra collected in the cathode, and a set of 6 points (a-f), which are associated with a set of operando spectra collected in the separator. Because the charging process had ended rapidly, it was possible to collect a final spectrum only in the cathode but not in the separator. Inspection of the normalized spectra in Fig. 6b indicates that the initial spectrum in the cathode is already different from the spectrum of the first charging process, due to a polysulfide feature in the 2470–2471 eV region. Furthermore, the presence of the polysulfides in the electrolyte is confirmed by the normalized spectra collected in the separator in Fig. 6c, which contain a charged terminal sulfur feature throughout the entire charging process. The relative changes in the Li2S and polysulfide components throughout the charge in both the electrode and the separator are visualized in Fig. 6d, while the components of the initial and final spectra of both the second and the first charge are compared in the Appendix. It is determined that the starting composition in the cathode of the second charge is consistent with presence of Li2S and a polysulfide component, as well as what is likely a small amount of S8, while, as discussed previously, the cathode of the first charge contains only Li2S. Furthermore, the figure indicates that the species found in the cathode at the end of both the first and second charge can be completely described by S8. Using the information about the sulfur species present in the cathode at the beginning and the end of the second charge, we can write the overall equation for the reaction process (Equation 7).
![Equation ([7])](https://content.cld.iop.org/journals/1945-7111/163/6/A930/revision1/d0007.gif)
When the process shown in the Equation 7 is compared against the process shown in Equation 4, it becomes evident that the presence of polysulfides is important to lowering the charging potential during the second charge, as has been previously suggested in the literature.9,19,33 When interpreted in the context of the mechanism in Fig. 5, the addition of polysulfides directly introduces a concentration of solution species that can undergo chain-growth and disproportionation reactions (ii.b) as well as diffuse to the electrode and either get electrochemically oxidized to S8 (ii.c) or react chemically with Li2S (ii.a) and S8 (iii.b) to produce more polysulfides. The electrochemically formed S8 can then regenerate polysulfide species by either dissolving into the electrolyte (iii.a) and subsequently reacting chemically with Li2S (ii.a) or by reacting chemically with polysulfides (iii.b). This process can occur throughout the entire charging process until all of Li2S is consumed. Consequently, the same charging mechanism shown in Fig. 5 is consistent with both the first and the second charge in the DOL-DME electrolyte.
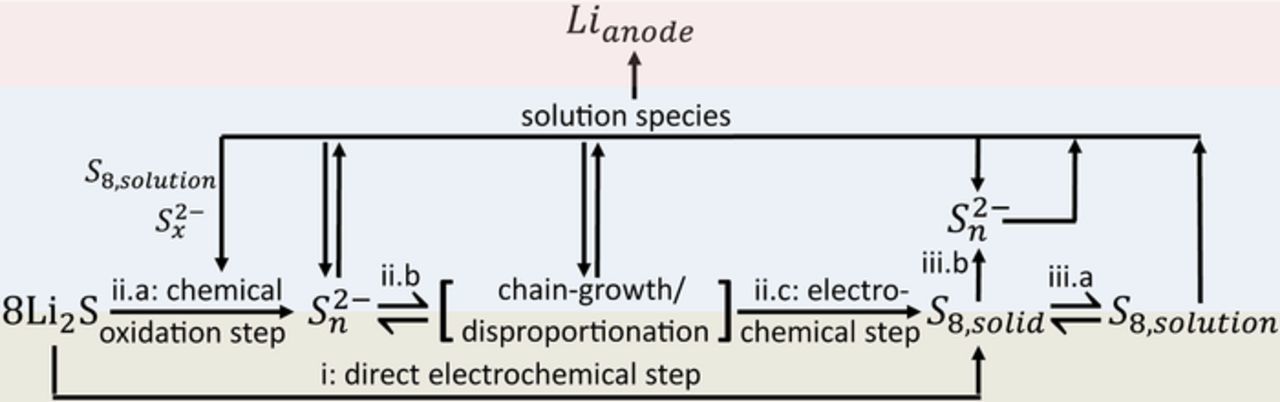
Figure 5. Schematic of the charging mechanism, consisting of either a direct electrochemical formation of S8,solid from Li2S at the carbon/Li2S interface (i), or a series of chemical steps (ii.a and ii.b) that eventually lead to the electrochemical oxidation of polysulfide species to S8,solid (ii.c). Once formed, S8,solid may dissolve in the electrolyte (iii.a) or react chemically with polysulfides to form a polysulfide species with a longer chain length (iii.b). Additionally, the schematic visualizes that during the charging process, a portion of the solution phase species (S8,solution or polysulfides) may diffuse to and react chemically with the lithium anode. With the exception of equilibrium between S8,solid and S8,solution species, none of the presented equations are balanced to simplify the illustration of the overall processes; for examples of balanced equations please see Equations 1–6 in the main text.
It has been previously suggested by several research groups that a higher order polysulfide, such as S62− or S82−, and not S8 is the initial oxidation product in the DOL-DME electrolyte.9,19,22 In this pathway, lower order polysulfide (Sn2−) could first be electrochemically oxidized to a higher order polysulfide, (i.e., S82−, Equation 8), which could then react chemically with Li2S and regenerate Sn2−(Equation 9), until all the lower order polysulfides and Li2S are converted to a higher order polysulfide. At this point, the second step of oxidation could occur at a higher potential, leading to electrochemical oxidation of a higher order polysulfide to S8 (Equation 10).
![Equation ([8])](https://content.cld.iop.org/journals/1945-7111/163/6/A930/revision1/d0008.gif)
![Equation ([9])](https://content.cld.iop.org/journals/1945-7111/163/6/A930/revision1/d0009.gif)
![Equation ([10])](https://content.cld.iop.org/journals/1945-7111/163/6/A930/revision1/d0010.gif)
To determine whether S8 or a higher order polysulfide is forming when polysulfides are electrochemically oxidized at a potential below 2.5 V during the second charge, we carefully examine the polysulfide feature. In the cathode this feature first increases in intensity, then remains constant for almost the entire charge, and decreases only in the last spectrum (Fig. 6d). Although these changes in the normalized intensity of the charged terminal sulfur in the polysulfide intermediate could be related to electrochemical and chemical processes occurring inside the battery, they can also be influenced by the diffusion of the polysulfides from the bulk electrolyte. In particular, at the end of both discharge and charge processes the concentration of polysulfides near the electrode surface would get smaller, as they would get rapidly reduced or oxidized. These rapid changes can explain both the initial rise in the polysulfide component in the cathode during the beginning of the charging process (the depleted polysulfides get replenished from the bulk of electrolyte) and the subsequent elimination of the polysulfide signal at the end of the process. Consequently, only the polysulfides in the separator (bulk electrolyte) could clarify whether a higher order polysulfide or S8 is forming throughout the charge.
The separator is expected to be representative of the bulk concentration of solution based sulfur species in the battery, because the reported diffusion coefficients of polysulfides and sulfur range from 1.2·10−5 to 2·10−7 cm2/s,34–36 which corresponds to a diffusion time through the entire cathode and the separator (340 μm) of less than 1 h, even when considering the smallest reported diffusion coefficient in the calculation. To directly illustrate that the species in the separator are associated with electrochemical processes occurring in the cathode, Fig. 7 presents the discharge curve and the associated intermediates forming in the separator during the discharging process. The presented spectra are characterized both by changes in the composition of the intermediates and in their concentration. Specifically, it is seen that as the discharge transitions from a high to a low voltage plateau, the concentration of the solution based species (Fig. 7b) as well as the relative fraction of the charged terminal sulfur atoms (Fig. 7c) significantly increase. These changes correspond to reduction of S8,solid to polysulfides and to shortening of the polysulfide chain length. Consequently, our data confirm that characterization of the separator provides information about the solution phase products that are forming in the cathode, and indicate that if a higher order polysulfide and not S8 was the main electrochemical oxidation product during the second charge, then its formation could be tracked by observing the changes in the separator species.
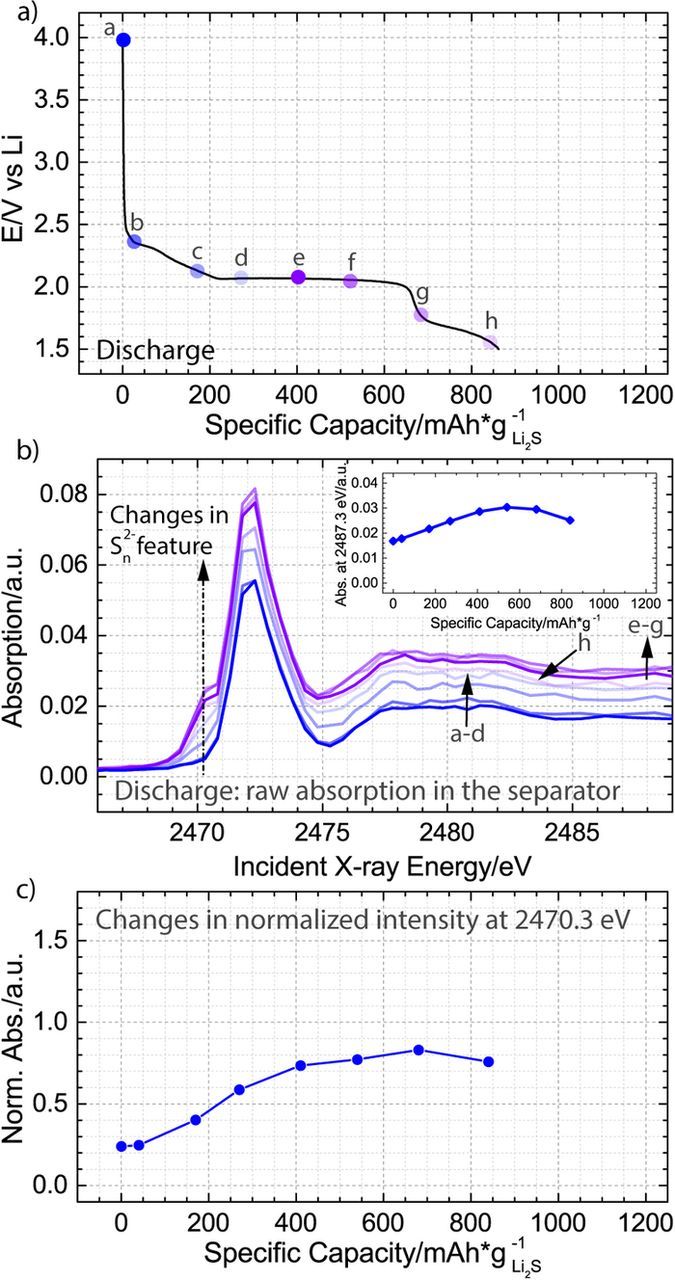
Figure 7. a) Discharge in 1 M LiClO4 and 0.5 M LiNO3 dissolved in DOL-DME solvent plotted as a function of specific capacity normalized to the mass of Li2S in the cathode with dots a-h indicating where spatially resolved X-ray absorption spectra were obtained. b) Raw XANES spectra collected in the separator of the battery and corresponding to points a-g in panel (a); the inset illustrates how the absorption intensity at the incident energy of 2487.3 eV changes throughout the discharge. c) Analysis of the normalized XANES spectra, demonstrating an increase in the polysulfide feature at 2470.3 eV in the separator throughout the discharge. We note that in agreement with our previous work21 and in contrast to recently published results by Wujcik et al.,37 we do not detect a measurable concentration of radical species during the discharge in our ether based electrolyte.
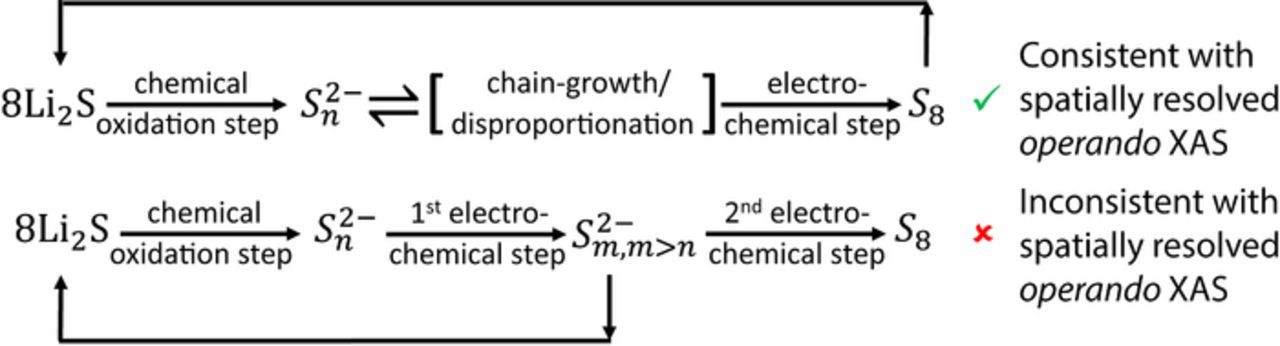
Figure 8. Schematic of two possible pathways to reach the final oxidation product, S8. Electrochemical formation of a higher order polysulfide, Sm2−, is found to be inconsistent with spatially resolved operando XAS measurements.
Considering formation of a higher order polysulfide, it is expected that this process would lead to a decrease in the relative ratio between the charged sulfur and internal sulfur atoms and/or a significant increase in the concentration of the solution based species. The decrease in the ratio of the two peaks would correspond to the formation of S62− or S82− from lower order polysulfides (reduction in the number of charged terminal sulfur atoms), while the change in the concentration of the solution based species would correspond to formation of polysulfides from solid Li2S. Because the discharge process in between the first and second charge resulted in 75% conversion of the capacity stored in S8 to Li2S, the starting concentration of polysulfides can be estimated to correspond to approximately 30% of the total sulfur species. Consequently, the formation of a higher order polysulfide instead of solid S8 should lead to a conversion of the remaining 70% of the species to S62− or S82− and a considerable increase in the concentration of the solution based species. Furthermore, the solubility of polysulfides is not expected to limit this process, as dissolution of the entire 2.0 mg of Li2S in the added electrolyte (80 μl) could only lead to 0.07 M concentration of S82− (0.09 M concentration of S62−).
The already presented Fig. 6c rules out the gradual decrease in the peak ratios, demonstrating that the peaks are characterized by a small increase and not decrease in the ratio (the feature at 2472 eV decreases slightly, while the feature at 2470 eV does not change) between spectrum-b and spectrum-f. These small changes could only correspond to a light shortening and not lengthening of the polysulfide chain. To understand how the concentration of polysulfides changes throughout the charge, Fig. 6e compares the raw spectra, in which the edge jump is proportional to the concentration of sulfur atom in all of its possible forms (both S8,solution and polysulfides). From the figure, it is evident that the concentration increases only slightly throughout the charging process. As discussed previously, insufficient diffusion time cannot play a role in the lack of significant changes in the concentration, because the charging process lasted 3 h, while the time that was needed to diffuse through the electrode and the separator can be calculated to be less than one hour. Consequently, as illustrated in Fig. 8, our measurements are consistent with the charging pathway in which the main electrochemical product is a solid S8 and not a solution based S82− and indicate that the first and the second charging processes occur via the same mechanism shown in Figure 5.
We note that Yamin and co-workers have previously speculated about a similar type of charging mechanism.34,37 More specifically, the authors had hypothesized that the anodic cyclic voltammetry (CV) features of various polysulfides dissolved in tetrahydrofuran (THF) solvent could only be explained, if all the polysulfides were to chemically convert to the same intermediate, which would then be electrochemically oxidized at the electrode surface.34,37 They based their reasoning on the fact that the value of the slope of the peak anodic current versus the scan rate plotted on a log scale had a value of significantly lower than 0.5, while the potential at which the sole anodic peak occurred was independent of the used polysulfide chain length and concentration. Because S8 is the most stable oxidation product, it was concluded by the authors that S8 and not a polysulfide was the most likely electrochemical product.34,38 Due to similarities in the cyclic voltammetry features of Li-S batteries based on THF19,34,37 and DOL-DME17,35,39 solvents, it is likely that Li-S batteries based on these solvents share the same mechanism of oxidation.
The developed understanding of the charging mechanism in the DOL-DME based electrolyte can be applied to the recent experimental reports that identify three main strategies of reducing the overpotential of the first charge: introduction of polysulfides into the electrolyte,9,19,33 reduction in the charging rate,9,16 and reduction in Li2S particle size.9,11,12 In the case of the introduction of polysulfides into the electrolyte, the charging mechanism has the possibility to occur via diffusion of the polysulfides to the electrode structure, if the added concentration of polysulfides is sufficient to sustain the charge at the prescribed rate without depleting the concentration of polysulfides to a trace level. Consequently, the process does not require pathway-(i) in Fig. 5, corresponding to an electrochemical activation of Li2S, and can occur at a normal overpotential using pathway-(ii). In the case of the slower charging rate, S8,solid, which is being produced electrochemically, has more time to dissolve into the DOL-DME electrolyte throughout the charging process (Fig. 5: iii.a) and react chemically with Li2S to produce polysulfides (Fig. 5: ii.a). As a result, if the charging rate is slow enough to generate a considerable concentration of the polysulfide species and the generated species are not lost to reactions with the lithium anode, then the first charge will be able to proceed at the same overpotential as the second charge. In the last strategy, which uses modified cathodes with smaller Li2S particles, the smaller particle size leads to a significantly larger surface area of Li2S, which facilitates the chemical reaction between S8 and Li2S (Fig. 5: ii.a). The increase in the chemical reaction promotes the charging pathway-(ii). The above analysis demonstrates how the effect of changes in experimental conditions, cathode structure, and electrolyte components can be understood from a mechanistic perspective and corroborates the charging mechanism proposed in our study. Future use of the identified mechanism will help inform rational design of novel cathodes and electrolytes and facilitate development of improved models of Li-S battery operation.
Conclusions
Our work highlights the advantages of spatially resolved XAS characterization, which can detect solution phase polysulfides and amorphous as well as crystalline solids, while also differentiating between the species forming in the electrode and the separator. Using this technique, we are able to obtain information about intermediates present in the cathode and the separator of an operating Li-S battery during the first and second charge of Li2S and gain insight into the mechanism of Li2S oxidation in the DOL-DME electrolyte solvent. Specifically, our results demonstrate that even though the first charging process, which occurs at a large overpotential, leads to the extraction of the entire theoretical capacity, corresponding to a complete conversion of Li2S to S8, no significant concentration of polysulfide intermediates can be detected throughout the process. Furthermore, analysis of the second charge, which occurs at a small overpotential, shows that the polysulfide species remain at a relatively constant concentration and composition, which is consistent with solid S8 forming during the entire process. Finally, our results indicate that oxidation of Li2S particles requires a chemical step, and that during the second charge, this chemical step is facilitated by the presence of a significant concentration of polysulfide intermediates. The identified pathways are expected to assist in reaching higher areal capacities in Li-S batteries by guiding both the development of models of Li-S battery operation and the design of improved cathode structures and electrolyte components.
Acknowledgments
The described XAS measurements were carried out at the Stanford Synchrotron Radiation Lightsource, a Directorate of SLAC National Accelerator Laboratory and an Office of Science User Facility operated for the U.S. Department of Energy Office of Science by Stanford University. Use of the Stanford Synchrotron Radiation Lightsource, SLAC National Accelerator Laboratory, is supported by the U.S. Department of Energy, Office of Science, Office of Basic Energy Sciences under Contract No. DE-AC02-76SF00515. The authors also thank Diamond Light Source, Didcot, UK for access to beamline I18 (SP 8734), K. Ignatyev and T. Geraki for support during the experiments at DLS, S. M. Webb and C. Roach for the support during the experiments at SLAC, as well as O. Gröger, A. Siebel, M. Wetjen, A. Berger, and A. Eberle for helpful discussions. Y. Gorlin gratefully acknowledges the support of the Alexander von Humboldt Postdoctoral Fellowship and Carl Friedrich von Siemens Fellowship Supplement. Portions of the research leading to these results have received funding from the German Ministry of Education and Research (BMBF) under agreement No. 03ET6045D.
: Appendix
See Figure A1.
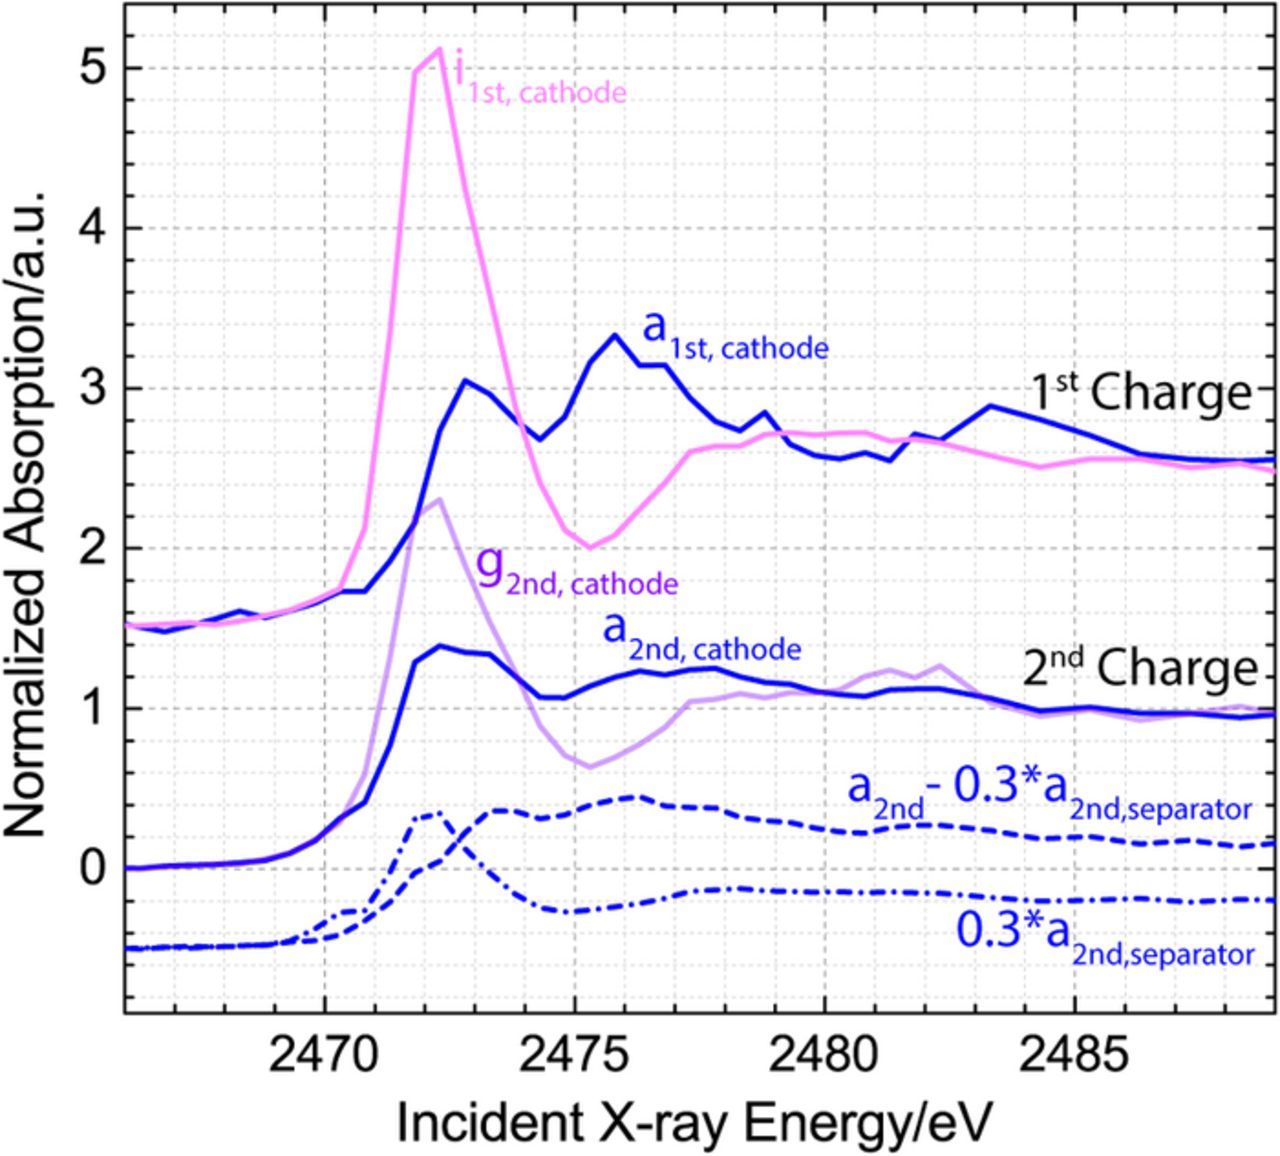
Figure A1. Demonstration of the initial and final XANES spectra in the cathode during the first and second charge. To visualize the components of the initial spectrum of the second charge, a fraction of the separator spectrum is subtracted from the cathode spectrum (after the end of discharge, the maximum possible concentration of solution based polysulfides is calculated to be ∼ 30%, considering S42− species) and both the separator fraction (dash-dotted line) and the resulting difference spectra (dashed line) are added to the plot.