Abstract
Start-up and shut-down (SUSD) events in proton exchange membrane fuel cells (PEMFCs) are a major source of cathode degradation, causing a loss of electrochemical surface area (ECSA) and carbon corrosion. Our study reveals that also the anode suffers significant damage during SUSD, dominated by the loss of ECSA, induced by potential cycling between ≈0 and ≈1 V upon the passage of H2/air fronts. Furthermore, we demonstrate the analogy of SUSD-induced anode degradation and that originating from quasi-square wave potential cycling between 0.05 and 1.05 VRHE. The performance penalties arising from a decrease of the kinetics of the hydrogen oxidation reaction (HOR) and growing H2 mass-transport resistances are measured via H2-pump experiments. The thus projected anode voltage losses for low anode Pt loadings (25 μgPt cm−2) predict HOR kinetic losses of ≈40 mV at 80°C and 3 A cm−2 for aged anode catalyst layers, suggesting that anode degradation by SUSD could be a significant durability issue in future PEMFC systems with ultra-low Pt loadings and with more stable cathode catalyst carbon supports. Moreover, SUSD-induced H2 mass-transport related overpotentials were identified and attributed to carbon corrosion, indicated by a thinning of the anode catalyst layer upon aging.
Export citation and abstract BibTeX RIS

This is an open access article distributed under the terms of the Creative Commons Attribution 4.0 License (CC BY, http://creativecommons.org/licenses/by/4.0/), which permits unrestricted reuse of the work in any medium, provided the original work is properly cited.
Proton exchange membrane fuel cells (PEMFCs) present themselves as viable alternative to internal combustion engines for automotive applications, and are currently at the edge of commercialization, as evidenced by the recent launch of PEMFC powered vehicles by Hyundai,1 Toyota,2 and Honda.3 Nevertheless, the key to a large-scale implementation in fuel cell electric vehicles (FCEVs) is a reduction of cost and an enhancement of system durability, both of which are intimately related to the design of the membrane electrode assembly (MEA). A major issue causing rapid MEA failure is system start-up or shut-down (SUSD), whereby the hydrogen atmosphere on the anode side is replaced by air (shut-down) or vice-versa (start-up), hence effecting the passage of H2/air fronts through the anode compartment of the PEMFC.4 The underlying degradation mechanism was initially reported and described in 2005 by Reiser et al.5 as the "reverse current" concept. During the passage of a H2/air front, a part of each cell acts as a fuel cell (H2 in the anode and air in the cathode compartment), while the other part acts as a galvanic cell (with air on both sides). The former supplies power to the latter, whereby the oxygen reduction reaction (ORR) occurring in the air-filled part of the anode compartment shifts the potential in the adjacent cathode electrode to ≈1.5 V vs the reversible hydrogen electrode (RHE) potential, high enough to lead to significant oxygen evolution and carbon oxidation currents. The electrochemical oxidation of the carbon electrode to CO2 according to Equation 1 is thermodynamically possible at potentials >0.2 VRHE,6 but due to its slow kinetics significant carbon oxidation rates are only reported at potentials ≥0.9 V.7–9
![Equation ([1])](https://content.cld.iop.org/journals/1945-7111/165/16/F1312/revision1/d0001.gif)
Accordingly, the carbon catalyst supports used exclusively in today's PEMFC systems are subject to severe degradation during SUSD events, leading to so-called cathode thinning, i.e., a loss of void volume within the cathode catalyst layer and a concomitant decrease in cathode layer thickness, observable, e.g., by scanning electron microscopy (SEM).9–11 Since this void volume is crucial for the transport of O2 through the electrode to the Pt surface, thinning directly results in O2 mass-transport related overpotentials, particularly at high current densities. Therefore, the degradation of the cathode catalyst layer during SUSD was subject to many studies, including various conditions, such as cathode gas humidification,12–14 cell temperature,15,11 gas front residence time,16 and the degree of graphitization of the cathode catalyst support.11,17
In contrast to the frequently investigated degradation of the cathode during a SUSD event, the anode stability over the course of SUSD cycles was only rarely examined11,10 and generally neglected. However, Engl et al. recently showed that SUSD in high temperature phosphoric acid fuel cells leads to significant amounts of carbon corrosion on the anode, along with a loss of Pt electrochemical surface area (ECSA), a finding which the authors attributed to the change of the anode potential upon switching the gas atmosphere between H2 and air.18 To the best of our knowledge, no study apart from our previously published ECS Transaction exists that is mainly focused on the degradation of the anode in low-temperature PEMFC systems.19 While the performance decay from SUSD-induced anode degradation is rather negligible compared to cathode degradation when high anode loadings are used (≥100 μgPt cm−2), it may start to become significant in future PEMFC systems, for which ultra-low anode loadings (≈25 μgPt cm−2) and the use of more stable graphitized cathode carbon supports are envisaged in combination with system mitigation strategies which restrict the occurrence of H2/air front events to room temperature, where cathode carbon support oxidation is strongly suppressed.11
To obtain a more quantitative understanding on the extent of anode vs cathode degradation, we will examine the PEMFC performance degradation induced by SUSD cycling by determining the loss of cell performance over the course of extended SUSD cycling and compare the concomitant ECSA-loss on anode and cathode. In order to quantify the voltage losses due to anode degradation, we will first compare the anode ECSA-loss during SUSD cycling with that observed during square-wave voltage-cycling of the anode potential between 0.05 and 1.05 VRHE (with the anode catalyst layer exposed to N2 and the cathode catalyst layer of the MEA exposed to H2, serving as counter and reference electrode), which mimics the potential profile experienced by the anode catalyst during the passage of a H2/air front. In the latter case, the cathode catalyst layer remains intact during the simulated SUSD test on the anode, so that losses in the HOR kinetics and increases in the H2 mass-transport resistance on the anode can be quantified. These data will be used to project the anode related voltage losses induced by SUSD cycles for future PEMFCs with ultra-low Pt loadings.
Experimental
The design of the experiments, the experimental set-up, as well as the detailed description of the electrochemical measurements were already reported in previous publications.19–21 For the reader's convenience, an abridged description is given below.
Set-up, hardware, and materials
All measurements were performed on single cells consisting of commercial 50 cm2 MEAs (Gore Primea Mesga, A510.1/M715.18/C580.4, W. L. Gore & Associates, Inc., USA) with anode/cathode platinum loadings of 100/400 μgPt cm−2 on a conventional carbon support and an 18 μm reinforced perfluorsulfonic acid membrane, sandwiched between two gas diffusion layers (GDLs) from Freudenberg & Co. KG, Germany (H15CX483 with an uncompressed thickness of ≈185 μm). Flow-fields machined from graphite plates were custom made and then pyro-sealed (Poco Graphite, Entegris GmbH, Germany) according to the 50 cm2 flow-field design provided by Kongkanand and Mathias,22 featuring 14 serpentine channels at a width and depth of 0.5 and 0.8 mm, respectively, separated by 0.5 mm wide lands. A contact pressure of 0.4 MPa was adjusted by quasi-incompressible, PTFE-coated fiberglass gaskets (Fiberflon, Fiberflon GmbH & Co. KG, Germany), assembled at a torque of 12 Nm (for details regarding the cell setup see Simon et al.).23 The low contact pressure in this study resulted in a contact resistance of ≈30 mΩ cm2, approximately 20 mΩ cm2 higher compared to a contact pressure of ≈2 MPa. The pressure was evaluated by assembling a regular cell and placing pressure sensitive dye paper (Prescale Ultra Low, Fujifilm Corp., Japan) between cathode flow-field and GDL. The electrical contact resistance was determined by a four-point probe measurement with two GDLs (MPLs facing each other), sandwiched between flow-fields, copper current collectors and foamed PTFE (Gylon Style 3545 Soft, Garlock GmbH, USA) as pressure distribution medium. To determine the resistance, a constant current of 3 A was directed through the current collectors and the voltage was measured at the flow-fields.
PEMFC testing was executed on customized G60 fuel cell test stations (Greenlight Innovation Corp., Canada) equipped with impedance capable potentiostats (Reference3000, Gamry Instruments, USA) using commercial fuel cell hardware (Fuel Cell Technologies, Inc., USA). All potentials are given versus the H2 anode potential (pure H2, i.e., corresponding to the reversible hydrogen electrode (RHE) potential) if not stated otherwise (i.e., V refers to V vs RHE). Furthermore, all area normalized values refer to the electrode area of the MEA (cm2), unless otherwise specified by a subscript (e.g., cm2Pt if referenced to the active Pt surface area of the electrode). Gases at a grade of 5.0 were supplied by Westfalen AG (Germany).
SUSD and E-cycling conditions
SUSD cycling was carried out at 80°C, a relative humidity (RH) of 66%, and at 12 kPag inlet gauge pressure. The time between start-up and shut-down events was 60 s, using a constant H2 or air flow rate at the anode of 980 nccm (nccm referenced at T0 = 273.15 K and p0 = 101.3 kPaabs), and a cathode air flow rate of 980 nccm. The resulting H2/air front residence time of 0.1 s can be calculated by Equation 2,11
![Equation ([2])](https://content.cld.iop.org/journals/1945-7111/165/16/F1312/revision1/d0002.gif)
where VFF equals the internal flow-field volume (VFF = 1.88 cm3), VGDL is the void volume of the compressed gas diffusion layer (VGDL = 0.65 cm3), and  is the anode wet gas flow rate at the given temperature, RH, and cell pressure pcell. The latter is calculated from the applied dry gas flow rate (
 in nccm), the water saturation pressure pH2O, satT, and the ideal gas law, whereby
  .
.
To simulate the effect of SUSD cycles on the anode catalyst layer, quasi-square wave potential voltammetry (termed E-cycles in this manuscript) between 0.05 and 1.05 V at a scan rate of 4 V s−1, and a hold time of 60 s at each potential was executed on the working electrode (anode compartment) under N2 atmosphere, applying a fixed flow of 980 nccm N2, while supplying 980 nccm pure H2 to the counter/reference electrode (cathode compartment), both at an RH of 66%, a cell temperature of 80°C, and 12 kPag inlet gauge pressure. The value of 1.05 V for the upper potential limit was chosen based on the reported potential of a platinum catalyst in an air/air cell,24 while the lower potential limit of 0.05 V, i.e., above the expected potential of ≈0 V was chosen to avoid excessive H2 evolution which would occur under N2-flow; the voltage transient rate of 4 V s−1 was the maximum applicable scan rate with our 30 A booster, mimicking the fast transient originating from the H2/air front in an actual SUSD experiment.
MEA conditioning, CVs, polarization curves, and H2-pump measurements
Prior to every experiment, MEAs were conditioned at 80°C, an inlet gauge pressure of 70 kPag and fully humidified flows of 1400 nccm H2 (anode) and 3300 nccm air (cathode); nccm refer to a volumetric flow rate in units of cm3 min−1, referenced to a pressure of 101.3 kPa and at temperature of 273 K. Gases were supplied to anode and cathode in counter flow mode in all measurements. MEA conditioning consisted of eight cycles, each with three potentiostatic steps: i) 45 min at 0.6 V, ii) 5 min at 0.95 V, and iii) 10 min at 0.85 V. Preceding the polarization curves, cyclic voltammograms (CVs) on the anode electrode (200 and 100 mV s−1) and on the cathode electrode (100 mV s−1) were recorded at 40°C and 50 kPag, with a flow of 50 nccm dry N2 at the working electrode and 500 nccm fully humidified H2 at the counter/reference electrode. Full CVs were recorded between a lower limit of 0.07 or 0.08 V and an upper limit of 1.00 V, while additional CVs with a limited potential range (0.07/0.08 V to 0.55 V) were used to extract the ECSA by integration of the charge corresponding to the hydrogen underpotential deposition (Hupd) and the associated anodic H-desorption. The ECSA was calculated from the mean value of adsorption and desorption charge and averaged over all MEAs at the same aging stage.
H2/air and H2/O2 polarization curves as well as H2-pump measurements were carried out at 80°C, 100% RH and 70 kPag. The flow rate for H2/air and H2/O2 polarization curves was 2000/5000 nccm. For H2-pump measurements with pure H2, 2000 nccm H2 was fed to both anode and cathode; on the other hand, when conducting H2-pump experiments with dilute H2 to examine H2 mass-transport resistances, the anode dry gas feed was mixed with N2 to achieve a mixture of 70% H2 and 30% N2, while the cathode served as counter/reference electrode operated with pure H2. The difference in the reversible potential for hydrogen oxidation/evolution between pure and dilute H2 was corrected for by calculating the potential shift according to the Nernst equation (at constant pH):
![Equation ([3])](https://content.cld.iop.org/journals/1945-7111/165/16/F1312/revision1/d0003.gif)
where ΔENernst is the Nernstian shift in V, R is the ideal gas constant (8.314 J mol−1 K−1), T is the temperature in K, n is the number of transferred electrons per H2 molecule (i.e., 2), F is the Faraday constant (96485 A s mol−1), and  and
and  are the partial pressures of H2 in the reference and working electrode, respectively. Each polarization curve was recorded after a 10 min recovery step, applying 0.6 V before H2/air curves, and drawing 1.5 A cm−2 before H2/O2 curves as well as H2-pump measurements. Thereafter, a galvanostatic curve was collected from low to high current densities, recording the potential after 10 min at the respective current density. The high frequency resistance (HFR) was determined from the intersect of the high frequency branch with the x-axis in a Nyquist plot obtained by galvanostatic electrochemical impedance spectroscopy (GEIS) from 100 kHz to 10 Hz at each current density (the amplitude was adjusted to 10% of the applied current with a minimum/maximum of 0.1/3.0 A).
Design of experiment
In order to allow for a sufficient averaging of the experimental results, a test plan was carried out for SUSD aging (Table I), where the end-of-test (EoT) of the first MEA was at 100 SUSDs and subsequent MEAs went through 100 × 2n SUSDs, up to 3200 SUSD (n = 1,...,5). CVs and H2/air polarization curves were recorded at beginning-of-test (BoT; after MEA conditioning), after each aging stage, and at EoT. Additionally, H2/O2 polarization curves were taken at BoT and EoT. Thus, several data points could be recorded for the same aging stage, except for EoT data of the H2/O2 polarization curves. All data for a given aging stage were averaged over the series (error bars in the graphs represent the standard deviation).
Table I. Experimental design, where each individual measurement is marked in the 1st column with the respective number of SUSDs. Columns 2 to 8 denote the individual steps throughout the measurement series for each MEA. At steps marked by an X, CVs at anode and cathode as well as H2/air and H2/O2 polarization curves were taken; at steps marked by an O, only CVs at anode/cathode and H2/air polarization curves were measured. All measurements, such as ECSA, H2/air and H2/O2 polarization curves, corresponding to a particular number of excecuted SUSD cycles were averaged, e.g., the BoT H2/air polarization curves of all measurements (regardless of their specific EoT). Modified from Schwämmlein et al. with permission of The Electrochemical Society.19
| Step [# SUSD] | |||||||
|---|---|---|---|---|---|---|---|
| Total # SUSD | BoT | 100 | 200 | 400 | 800 | 1600 | 3200 |
| 100 | X | X | |||||
| 200 | X | O | X | ||||
| 400 | X | O | O | X | |||
| 800 | X | O | O | O | X | ||
| 1600 | X | O | O | O | O | X | |
| 3200 | X | O | O | O | O | O | X |
Analogous to the above described SUSD aging procedure, the same amount of MEAs was tested using E-cycles, recording CVs and H2-pump polarization curves in pure H2 after each aging stage. In addition, a H2-pump measurement in dilute H2 at BoT and after 3200 E-cycles was carried out exemplarily on one MEA.
SEM imaging
SEM was used to determine the thickness of anode and cathode of the 50 cm² MEAs (from SUSD & E-cycles). 5 samples (≈1 cm diameter) were punched out from each MEA, one at each corner and one in the center (Figure 1). The punch-outs also included the GDL/MPL-layers, except for the pristine MEA. The samples were then embedded in a polymer resin (EpoThin 2 resin and hardener) at reduced pressure to remove gas bubbles, hardened at 40°C overnight, ground (CarbiMet S, P280) and polished to a mirror finish surface (MicroPolish II, Alumina, 1 μm, all purchased at ITW Test & Measurement GmbH, Germany). The thickness was measured using a benchtop scanning electron microscope (JCM-6000PLUS NeoScope, JEOL GmbH, Germany), operated in backscattering mode at an acceleration voltage of 15 kV and a magnification of 2000x. Each punch-out was evaluated at ten different spots to obtain an average thickness for each punch-out position (A-E in Figure 1) and its standard deviation. Here, the thickness at each position for a given MEA was determined from the area divided by the length to obtain a more precise average, whereby the area integration was executed semi-automatically based on the contrast between Pt rich electrodes and their less dense neighboring materials using the program ImageJ (as described by Harzer et al.).20 Furthermore, high resolution field-emission SEM images were taken to compare the morphology of the MEA cross-section (JSM-7500F, JEOL GmbH, Germany).
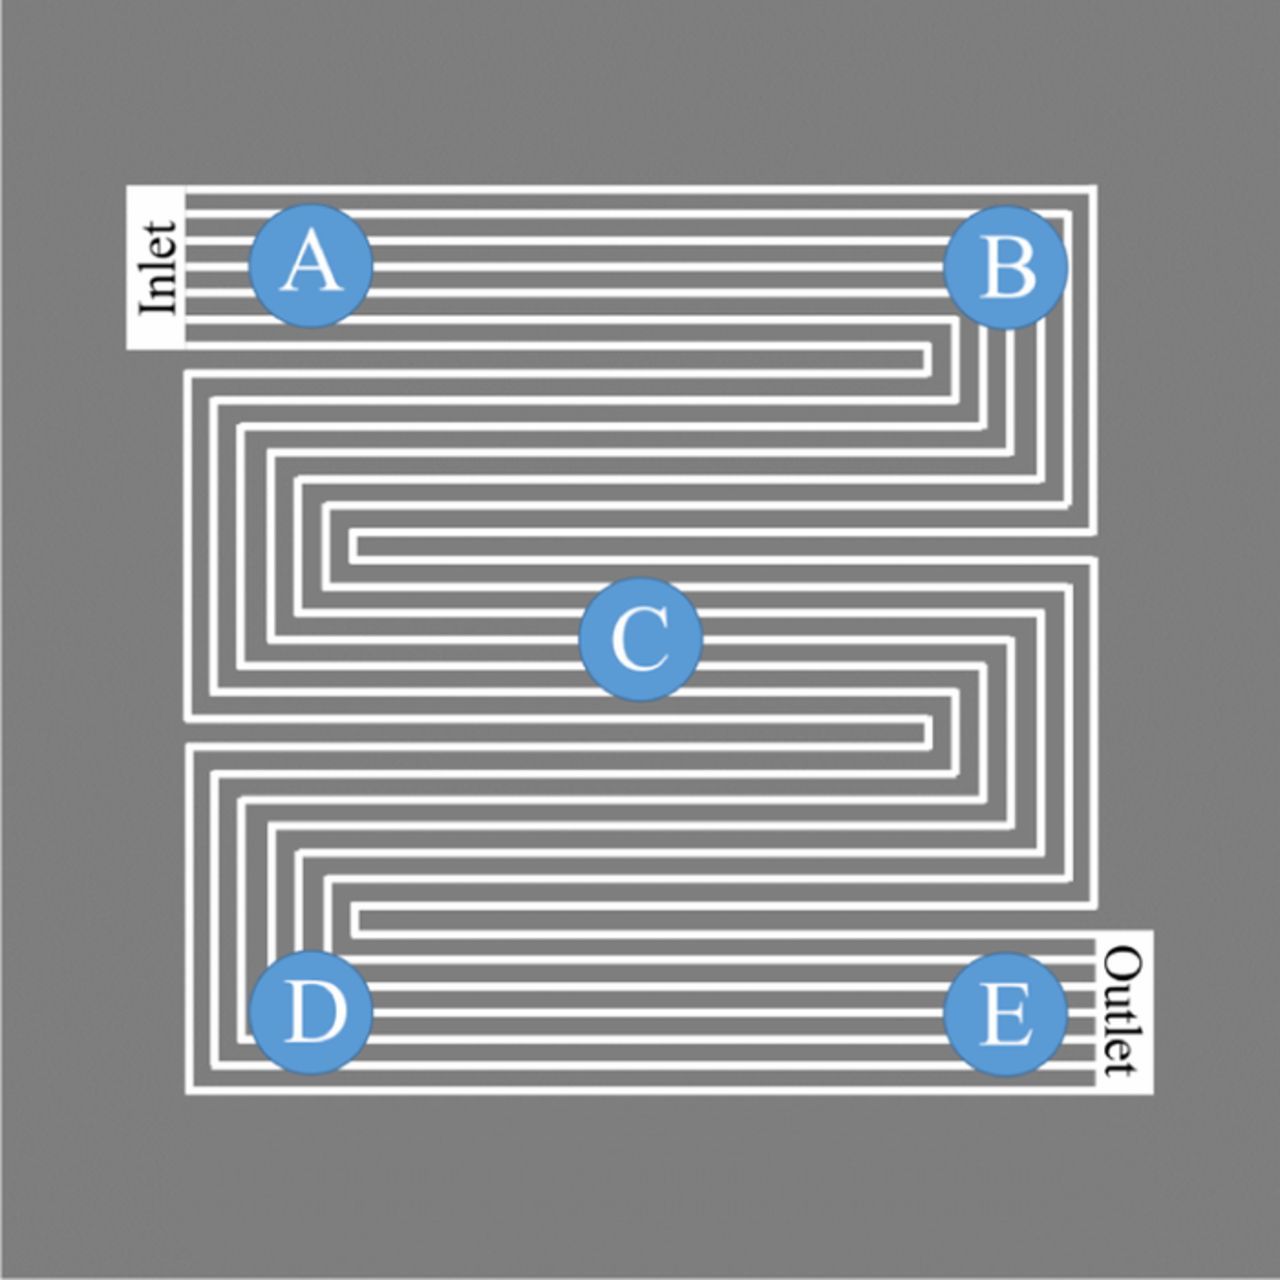
Figure 1. Schematic representation of the five punch-out positions for 50 cm² MEAs, showing the flow-field pattern, as well as the cathode gas inlet and outlet manifolds. The same flow-field was used on the anode and the gas was supplied in counter-flow mode. Please note that the scheme is not drawn to scale.
Results and Discussion
In the following, we will first examine the H2/air and H2/O2 performance loss as well as the anode and cathode ECSA-loss over extended SUSD cycles. This will then be compared to the anode ECSA loss during voltage-cycling of the anode catalyst layer, simulating the voltage-cycling experienced by the anode catalyst layer during SUSD events. The latter will allow to quantify the performance loss of the anode catalyst layer during SUSD cycling.
Cathode degradation during SUSD
To analyze the commonly reported SUSD-induced performance decay due to degradation of the cathode catalyst layer, Figure 2a shows the H2/air performance curves of a Gore MEA at BoT (after conditioning) and after the respective number of SUSD cycles. The ≈50 mV lower BoT performance at 2 A cm−2 in Figure 2a compared to the data shown by Simon et al. using the same MEA (see Figure 8b in Simon et al.)23 is due to the approximately 20–25 mΩ cm2 lower HFR in the latter study, originating from the lower contact resistance (for details see Experimental section). In general, the MEA performance decreases compared to their BoT with increasing number of SUSD cycles. The observed voltage decay is most pronounced at high current densities (i ≥ 1 A cm−2), where overpotentials are predominantly caused by O2 mass-transport losses, amounting to, e.g., ≈420 mV at 1 A cm−2 after 3200 SUSD. As outlined earlier, the corrosion of the carbon support occurs at high potentials during SUSD events, accompanied by a loss of void volume in the cathode catalyst layer and the so-called "cathode thinning".9 Since O2 is transported across the electrode through its void volume fraction, the collapse of the carbon structure upon carbon oxidation causes increasing O2 mass-transport resistances, which are the more pronounced the higher the current density. According to Gasteiger et al., a decrease of the electrode's total carbon inventory by solely 7–10%wt leads to a ≈70% lower current density at 0.5 V in H2/air polarization curves.25 Due to the rapid performance decay after 400 SUSD cycles (see Figure 2a), we conclude that such a structural collapse of the carbon structure occurs after an exposure to somewhere between 400 and 800 SUSD cycles under the here applied SUSD conditions.

Figure 2. a) Differential flow H2/air (2000/5000 nccm) polarization curves at BoT (after conditioning) and after the indicated number of SUSD cycles for 50 cm2 Gore MEAs recorded at 80°C, 100% RH, and 70 kPag. b) HFR determined at each current density via GEIS. Error bars represent the standard deviation from independent repeat measurements (as indicated in Table I, 6 for BoT and after 100 SUSD cycles, 5 after 200 SUSD cycles, etc.). Based on the data by Schwämmlein et al.19
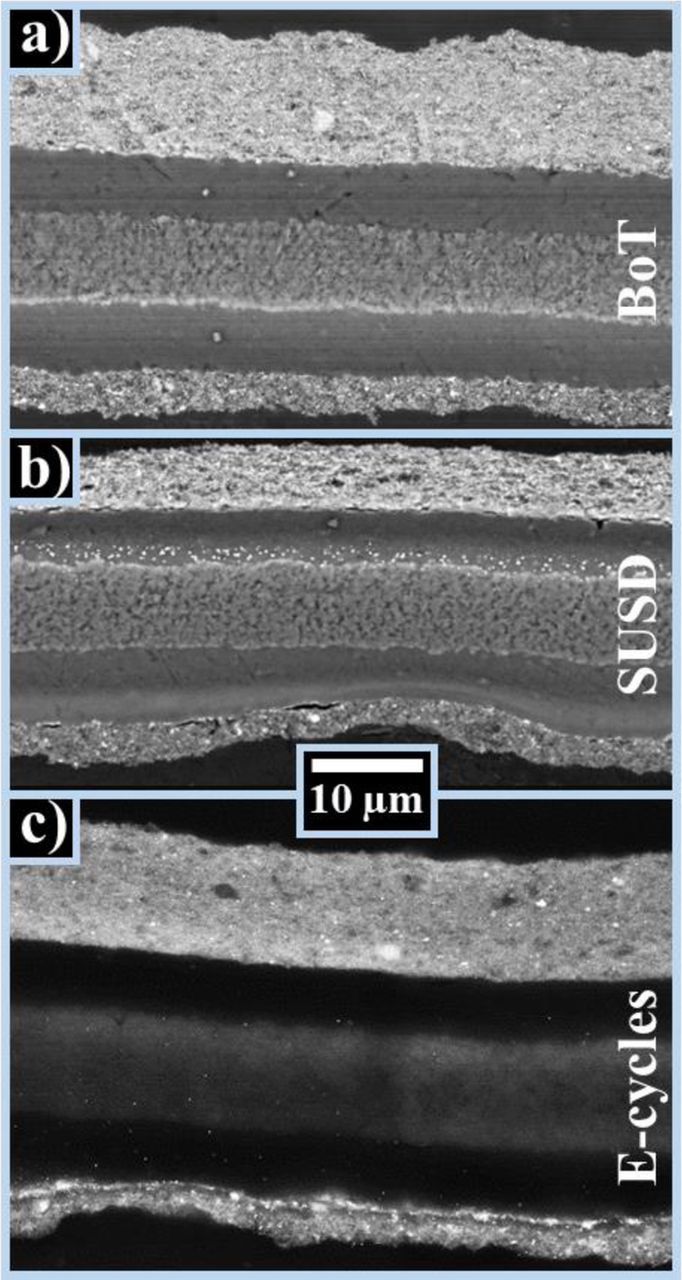
Figure 8. High-resolution SEM images of cross-sectioned embedded MEAs at a) BoT, b) after 3200 SUSD cycles, and, c) after 3200 E-cycles. From top to bottom, the layers are cathode, membrane (with PTFE reinforcement), and anode for each image. SEM images were taken at a magnification of 1500x and an acceleration voltage of 10 kV (a and b) or 25 kV (c).
In addition to the O2 mass-transport resistance induced voltage losses observed in the H2/air performance, the HFR (see Figure 2b) at each of the measured current densities nearly doubles from BoT (≈55 mΩ cm2) to after 1600 and 3200 SUSD cycles (≈100 mΩ cm2). In general, the HFR is composed mostly of the proton conduction resistance of the membrane as well as of the cell compression dependent electrical contact resistances at the flow-field/GDL and at the GDL/catalyst layer interface. Since significant membrane degradation is not expected within these relatively short experiments (less than 200 h for the longest experiment with 3200 SUSD cycles) under conditions which should minimize membrane degradation (i.e., with fully humidified reactants),26,27 the observed rise in HFR points towards an increase in contact resistance. For the here utilized cell setup, based on a strain-controlled cell assembly (see Experimental section), the ≈7 μm cathode thinning after ≥1600 SUSD cycles (cf. Figure 9) leads to a lowering of the compressive strain of the GDL by ≈2% (based on two GDLs, each with 185 μm uncompressed thickness). As the contact pressure of 0.4 MPa in this study is already relatively low at BoT (reflected by the rather high HFR value of ≈55 mΩ cm2, compared to ≈30 mΩ cm2 which one would usually find under these operating conditions with this type of MEA),23 and as the contact resistance rises dramatically at low compressive forces,28 the lowering of the compressive strain of the GDL upon cathode thinning is the most likely explanation for the observed HFR increase after extended SUSD cycles.
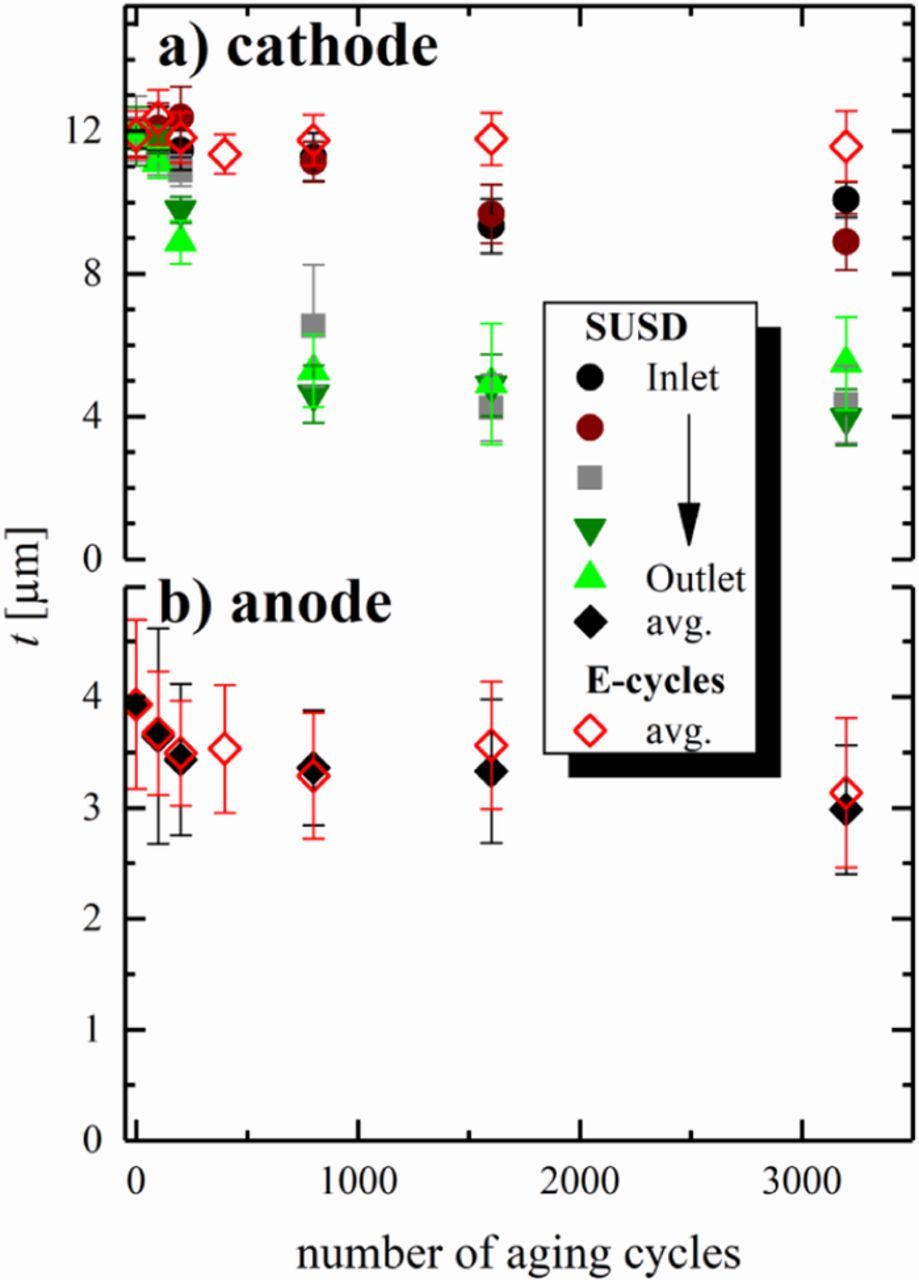
Figure 9. Thickness of a) the cathode and b) the anode at the respective number of aging cycles, determined via SEM analysis of embedded MEA cross-sections. Thickness values are averaged from measurements at 5 different locations (see Figure 1) with 10 measurements at each location, with the error bars representing their standard deviation. For SUSD cycled cathodes, thickness values are given for the 5 different locations along the anode gas flow, i.e., from the anode gas inlet (black, brown) via the center of the MEA (gray) to the outlet (olive, green). Owing to the small thickness changes, thickness values for SUSD aged anodes and anodes/cathodes aged by E-cycles are shown as average of all locations (error bars representing the standard deviation of 50 measurements).
In addition to the described voltage losses at high current densities, the H2/air performance also decreases substantially with SUSD cycling in the low current density region (e.g., 70 mV at 50 mA cm−2 after 3200 SUSD cycles), where the contribution from O2 mass-transport resistances should be negligible. This voltage loss is indicative of kinetic losses, i.e., of a decrease of the cathode ECSA with SUSD cycling. To monitor the development of the ECSA, we recorded cathode CVs at BoT and after each aging stage, shown exemplarily in Figure 3a for a single MEA over the course of 3200 SUSD cycles. In the course of aging, the charge in the Pt oxide formation/reduction region (E > 0.5 V), in the double layer region (approximately between 0.4 and 0.5 V), and in the Hupd region (E < 0.4 V) decreases significantly, whereas the qualitative shape of the CV remains largely unaltered. While the double layer charge originates largely from capacitive processes on the carbon surface, the decay of the Hupd and the Pt oxidation/reduction charge is associated with a decrease of the Pt surface area due to SUSD-induced cathode degradation.
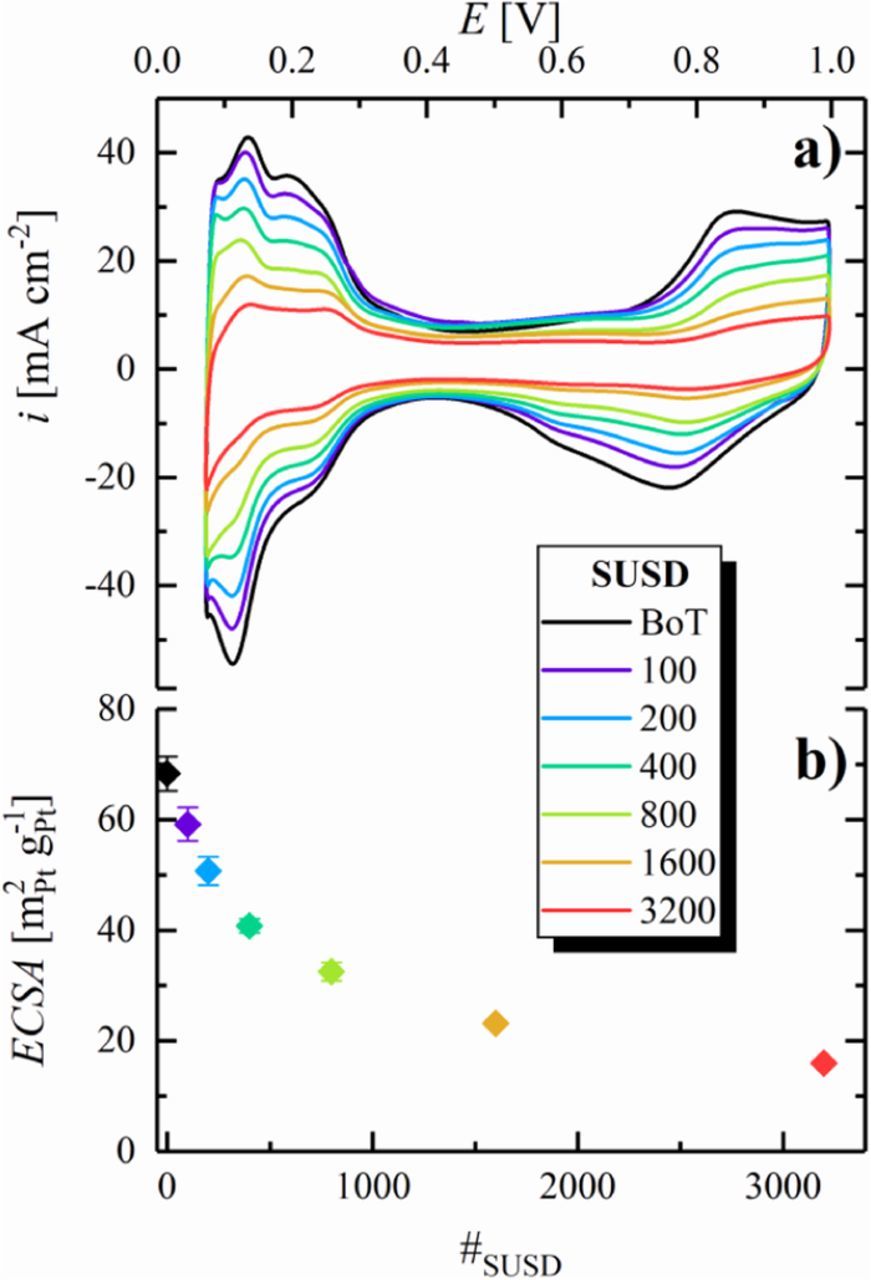
Figure 3. a) CVs of the cathode catalyst layer after different numbers of SUSD cycles, recorded between 0.07–1.00 V at a scan rate of 100 mV s−1 at 40°C, using a constant flow of 50 nccm dry N2 in the cathode compartment and 500 nccm fully humidified H2 in the anode compartment, at a pressure of 50 kPag. b) ECSA vs number of SUSD cycles, evaluated from the averaged Hupd charge from CVs with a limited potential window of 0.07–0.55 V under otherwise equal conditions (error bars represent the standard deviation from independent repeat measurements (as indicated in Table I, 6 for BoT and after 100 SUSD cycles, 5 after 200 SUSD cycles, etc.). Reproduced from Schwämmlein et al. with permission of The Electrochemical Society.19
To quantify the loss of Pt surface area, the ECSA was calculated from the average of the integrated hydrogen ad-/desorption charge in the potential range between ≈80 and ≈400 mV of CVs recorded with a limited upper inversion potential of 550 mV (not shown) to mitigate the superposition of the Hupd process with currents originating from the delayed reduction of Pt oxide in the cathodic scan. Figure 3b shows an exponential-like decrease of the cathode ECSA over the course of SUSD aging, with a strong initial decay during the first 800 SUSD cycles, followed by a more gradual ECSA-loss over the residual cycles. During SUSD, several contributions lead to a loss of ECSA: The aforementioned corrosion of the carbon support causes a physical detachment of Pt nanoparticles from the support material, rendering them inactive due to electrical insulation from the electrode. Additionally, repetitive oxidation during the SUSD events and partial reduction of the Pt surface leads to dissolution of Pt ions into the electrolyte phase. Even though these Pt ions can partially be re-deposited into larger particles,29–31 this so-called Ostwald ripening plays only a minor role in the loss of ECSA on the cathode due to the rather high potential in air. In contrast, Pt dissolved in the electrolyte phase can diffuse towards the membrane to eventually be reduced by H2 crossing over from the anode compartment, leading to electrically insulated Pt particles within the membrane, manifested by a Pt deposition band as was also observed for extended OCP (open circuit potential) holds.32 Initially, the electrode comprises Pt nanoparticles with a certain size distribution and an average diameter around 3 nm. Considering that the extent of Pt dissolution is highest for small Pt particles, the ECSA-loss is expected to be initially dominated by the dissolution of smaller Pt particles, which have a higher relative contribution to the total Pt surface area.31,33 This causes the observed steep decrease of the ECSA in the beginning, followed by a less pronounced loss in the remainder of the aging cycles.
To obtain further insights into the loss of performance and the development of the ORR overpotential with SUSD aging, polarization curves in pure O2 were recorded, in which case O2 mass-transport related voltage losses are typically negligible. Here, the measured current density was corrected for the H2 crossover current (≈3 mA cm−2), and the voltage was corrected by the HFR (determined via GEIS measurements at the respective current density). The Tafel slope of the recorded polarization curves was determined by fitting the corrected data in the current density region between 50 and 500 mA cm−2 (corresponding to approximately 0.2 to 2.0 mA cm− 2Pt at BoT), resulting in a slope of 69 ± 1 mV dec−1 at BoT, in accordance with the theoretical value of 70 mV dec−1 based on a cathodic transfer coefficient of 1, and in good agreement with values reported for Pt/C and Pt(pc)in the literature.34–37
According to the Tafel equation, the available active surface area of the cathode, i.e., the roughness factor (rf), is directly correlated to the kinetic ORR overpotential (η, given in mV).
![Equation ([4])](https://content.cld.iop.org/journals/1945-7111/165/16/F1312/revision1/d0004.gif)
In Equation 4, TS is the Tafel slope in mV dec−1, i is the H2-crossover corrected current density in mA cm−2, i0 is the exchange current density of the ORR in mA cm− 2Pt, and rf is the roughness factor in cm2Pt cm−2; the latter corresponds to 10 times the product of ECSA (in m2Pt g− 1Pt) and cathode Pt loading (LPt(ca) in mgPt cm−2). According to Equation 4, a decrease of the cathode's rf by a factor of ten should results in an increase of the ORR overpotential by approximately one TS (neglecting minor changes of i0 with Pt particle size), i.e., by ≈70 mV. In agreement with this, the H2/O2 performance decreases with the number of SUSD cycles (Figure 4a), reflecting the loss of the cathode ECSA. This kinetic offset between the performance of aged MEAs and that at BoT is well visible in the low current density region (i ≤ 200 mA cm−2), where O2 mass-transport losses are negligible.
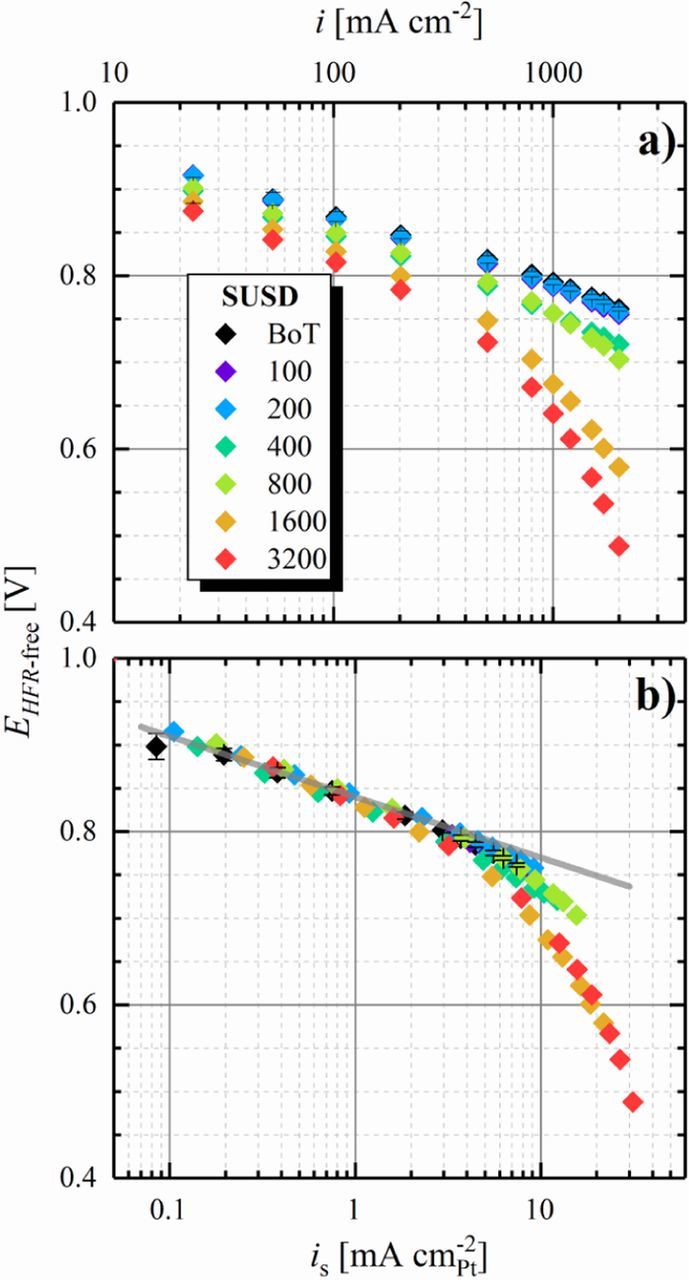
Figure 4. a) Tafel plot representation for differential-flow H2/O2 (2000/5000 nccm) polarization curves of 50 cm2 Gore MEAs at 80°C, 100% RH, and 70 kPag. The current density (i) was corrected for the H2-crossover measured in N2 atmosphere under otherwise identical conditions; the potential was corrected for the HFR determined via GEIS measurements at the respective current density. b) Tafel plot representation based on the Pt specific current density (is), obtained from the ECSA values measured at each individual aging step. The gray line represents the ideal Tafel slope of 70 mV dec−1. Reproduced from Schwämmlein et al. with permission of The Electrochemical Society.19
In order to clarify the correlation between rf and the kinetic ORR overpotential, the corrected polarization curves were normalized to the cathode rf and plotted against the Pt specific current density (is), yielding a superposition of the H2/O2 polarization curves at reasonably low current densities for all aging stages (Figure 4b). This demonstrates that the voltage loss at low current densities can be fully ascribed to a kinetic penalty arising from the loss of cathode ECSA according to Equation 4. Even though these polarization curves were recorded in pure O2, the strong performance decay at high current densities along with an increase of the Tafel slope in the course of aging, eventually reaching 95 mV dec−1 after 3200 SUSDs (limiting the fit to a maximum current density of 200 mA cm−2, i.e., ≈3.2 mA cm− 2Pt) is indicative for additional mass-transport related overpotentials even in pure O2. Moreover, the fact that a significant voltage loss in the high current density region is solely observed for MEAs exposed to >400 SUSD cycles is in accordance with the aforementioned collapse of the carbon support structure.
Anode degradation during SUSD
During the above described SUSD aging experiments, we also monitored the loss of anode ECSA via CVs in inert atmosphere (Figure 5a), utilizing the H2-filled cathode compartment as counter/reference electrode. Similar to the cathode catalyst layer, all CV features gradually decrease over the course of SUSD aging. As reported by Engl et al. for high temperature phosphoric acid fuel cells,18 this ECSA-loss can be attributed to the passage of H2/air fronts through the anode compartment during SUSD. This change of gas atmosphere effectively results in a step-change of the anode potential from the OCP under H2 (0 V) to the OCP in air (≈1.05 V in the case of a PEMFC)24 during shut-down and vice versa during start-up. According to a broad spectrum of literature focusing on the voltage-cycling stability of PEMFCs under various conditions,38–45 it is well-known that repetitive potential scanning leads to degradation of the electrode, namely a loss of ECSA and, if the upper potential is sufficiently high, also to carbon support corrosion. Therefore, the observed exponential-like decay of the anode ECSA with the number of SUSD cycles (Figure 5b) qualitatively agrees with that observed under conventional voltage-cycling protocols in PEMFCs.
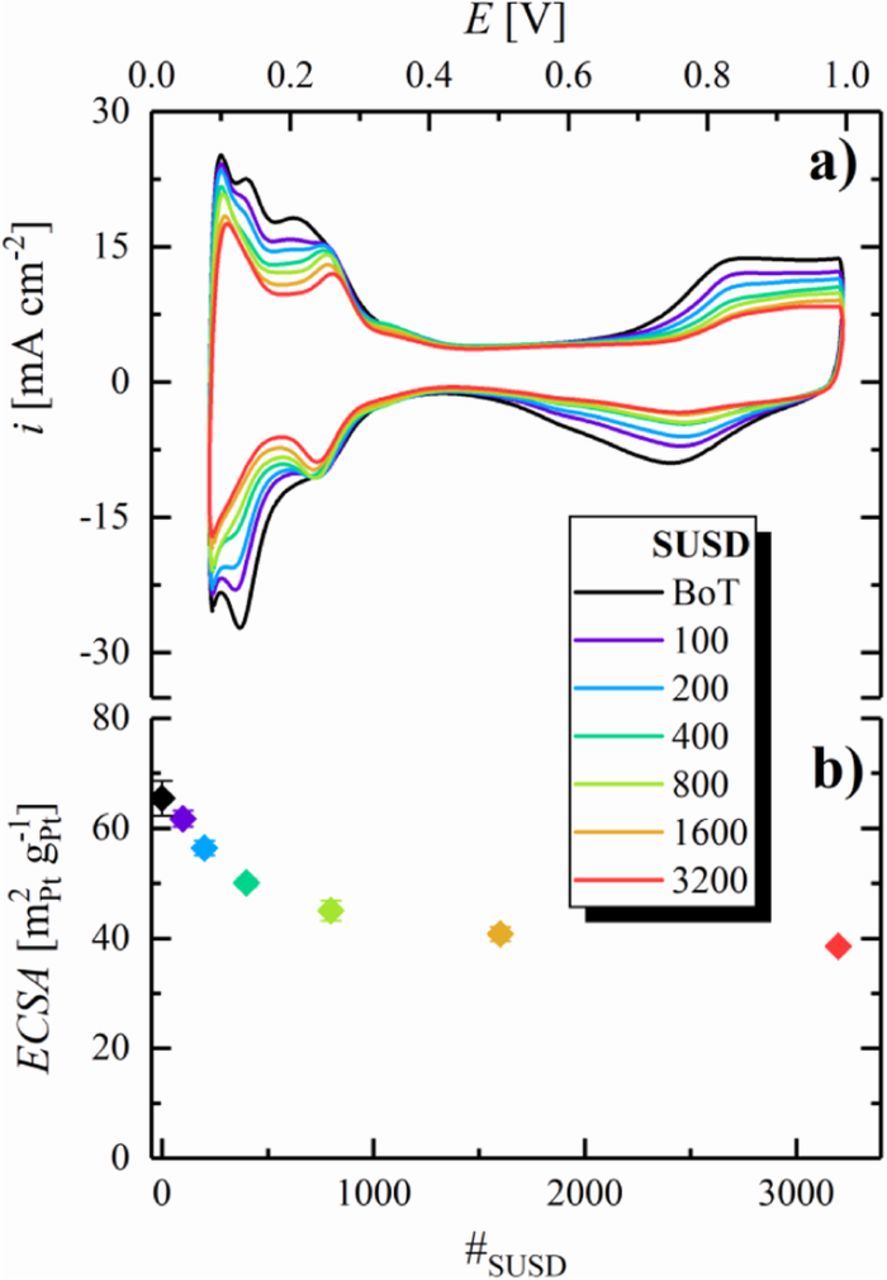
Figure 5. a) CVs of the anode catalyst layer at 40°C after different numbers of SUSD cycles, recorded between 0.08–1.00 V at a scan rate of 200 mV s−1, using a constant flow of 50 nccm dry N2 in the anode compartment and 500 nccm fully humidified H2 in the cathode compartment, a pressure of 50 kPag. b) Anode ECSA vs number of SUSD cycles, evaluated from the averaged Hupd charge in CVs with a limited potential range of 0.08–0.55 V under otherwise same conditions (error bars represent the standard deviation from independent repeat measurements (as indicated in Table I, 6 for BoT and after 100 SUSD cycles, 5 after 200 SUSD cycles, etc.). Reproduced from Schwämmlein et al. with permission of The Electrochemical Society.19
Following the same reasoning already outlined in the previous section, the exponential shape of the ECSA development is due to a selective dissolution of small Pt particles in the voltage-cycling induced aging process. In contrast to the cathode, Ostwald ripening is expected to be the major ECSA-loss mechanism on the anode during start-up (purging an air-filled anode compartment with H2), as Pt dissolved during the potential transient will immediately re-deposit at the low potential. On the other hand, during a shut-down the released Pt ions can diffuse into the membrane phase, where they are reduced to electrically isolated Pt particles (visible in the respective SEM micrograph in Figure 8b) by H2 dissolved in the aqueous phase of the membrane. Besides the different cycling window of the anode (≈0–1.05 V) vs that of the cathode (≈0.9–1.5 V) during SUSD, this is the likely reason for the smaller ECSA-loss of the anode vs the cathode during SUSD aging (≈40% vs ≈75% after 3200 SUSD for anode (Figure 5a) and cathode (Figure 3a), respectively).
Interestingly, the Hupd features in the anode CVs change not only with respect to the total charge from BoT to EoT, but also with respect to their shape. While the main Hupd feature around ≈0.13 V undergoes severe degradation, the Hupd processes occurring at more anodic potentials denote a less significant decrease, eventually forming a separate feature at ≈0.25 V. Derived from measurements on low-index Pt single crystals in liquid electrolyte,46,47 and confirmed later on by experiments including an ionomer film on a polycrystalline Pt electrode,48 the latter feature can be attributed to Pt(100) facets, while that at ≈0.13 V represents Pt(110)-like sites. Consequently, the CVs point at a preferential dissolution of Pt(110)-like sites and concurrent formation of Pt(100) facets on the anode, which is in accordance with the results presented by other researchers, showing a reconstruction of polycrystalline Pt surfaces when exposed to fast voltage scans or voltage steps in liquid electrolyte.49–51 With respect to Pt nanoparticles, commonly regarded as cubo-octahedra with Pt(111) and Pt(100) facets, and with Pt(110)-like Hupd features originating from the Pt atoms located on edges and corners, the evolution of the anode CVs with SUSD aging indicates a strong faceting of the Pt particles in the anode.
Estimation of the anode voltage losses during SUSD cycles
Since the loss of anode ECSA during SUSD cycles is modest, one might expect that the increase in HOR kinetic losses are rather small. At the same time, however, it is unclear whether the noticeable thinning of the anode catalyst layer (shown later on in Figure 9b) will lead to H2 mass-transport resistances in a real PEMFC system, where the N2 concentration in the anode compartment can be substantial. For example, based on the N2 permeability of a Nafion membrane at 80°C and 100% RH (9 ⋅ 10−14 mol cm cm−2 s−1 kPa−1),52 the N2 flux through a state-of-the-art 12 μm thick membrane at 70 kPag cell pressure (≡96 kPa N2 partial pressure) is ≈4.5-6.7 ⋅ 10−9 mol cm−2 s−1 (for 7–36 kPa N2 in the anode, corresponding to 6–30% on a dry gas basis), which for a H2 utilization of 99% would translate to steady state N2 concentrations of ≈30% (dry gas basis) at 0.2 A cm−2 (roughly the average current density of an automotive PEMFC) and of ≈6% (dry gas basis) at 2 A cm−2 (roughly the maximum current density of an automotive PEMFC). These estimates are based on assuming sufficiently high anode recycle flows, and are in good agreement with the study by Kocha et al.53 Thus, in an up-transient of the PEMFC system, the N2 concentration in the anode gas would be on the order of 30%, raising the question about the significance of H2 mass-transport resistances in a mixture of 70% H2 and 30% N2, particularly after SUSD-induced damage of the anode catalyst layer. Unfortunately, the possible increase of anode overpotential due to kinetic and H2 mass-transport losses cannot be determined experimentally from the SUSD cycled MEAs, as the substantial damage of the cathode catalyst layer prevents any meaningful diagnostic tests. Hence, an accelerated aging test to simulate SUSD-induced anode degradation while maintaining the cathode undamaged is required to estimate the extent of voltage losses induced at the anode by SUSD cycling.
Therefore, to simulate the anode degradation during SUSD cycling, we have employed a voltage-cycling procedure which mimicks the potential perturbations experienced by the anode electrode during SUSD events: a quasi square-wave perturbation between the OCP of the anode under H2 (i.e., ≈0 V) and the anode potential in a cell filled with air on both sides (≈1.05 V),24 with a ramp rate of 4 V s−1 between these two potentials (representing a short H2/air front residence time) and a hold time of 60 s at each potential (as was used in the above SUSD tests). A square-wave protocol was chosen to simulate the constant potential phases on the anode during OCV periods in H2 or air in SUSD events, including the fast transition from one to the other potential. Here, the cathode was used as counter/reference electrode supplied with H2, while N2 was fed to the anode compartment. The lower potential limit was chosen to be 50 mV higher than the reversible potential in pure H2 in order to limit the H2 evolution rate on the working electrode in N2 atmosphere. Even though, the anode voltage profile in the course of multiple SUSD events might slightly change due to electrode degradation, the employed AST test is based on a fixed E-cycle throughout the entire measurement to enable comparability between different experiments and laboratories. After different numbers of E-cycles, CVs were recorded on anode and cathode to quantify their ECSA via integration of the Hupd charge.
As expected, the ECSA of the cathode remains essentially constant during the anode voltage-cycling experiment (hollow symbols in Figure 6b), while the anode ECSA decreases substantially with voltage-cycling (filled symbols in Figure 6b). Similar to the trend observed for cathodes (Figure 3b), as well as anodes (Figure 5b) exposed to the SUSD test protocol, the anode ECSA shows an exponential-like decay over the course of E-cycling. The total ECSA-loss after 3200 E-cycles (≈65% loss compared to BoT, see Figure 6b) is significantly larger than that observed after 3200 SUSD events (≈40% loss compared to BoT, see Figure 5b). This is most likely related to differences in the extent of Pt loss from the anode into the membrane phase in SUSD cycles compared to the voltage-cycling test. In the latter, particularly for thin electrodes, the majority of the Pt loss is due to the formation of electrically isolated Pt particles in the membrane phase,39 which will happen for both up- and down-transients of the potential, as H2 is only present in the membrane phase (permeating through the membrane from the H2-filled counter electrode) due to the fact that the working electrode compartment is being purged with N2. On the other hand, in the case of SUSD cycling, any Pt dissolved during the SUSD start-up part (purging an air-filled anode compartment with H2) will immediately re-deposit at the low potential, so that the loss of Pt into the membrane phase should be minimized during start-up and should only be occurring during the shut-down part of the SUSD test, during which dissolved Pt ions can diffuse into the membrane phase, where they can precipitate during the subsequent start-up. This is probably the most likely explanation for the higher anode ECSA-loss during the E-cycling test compared to an actual SUSD test.
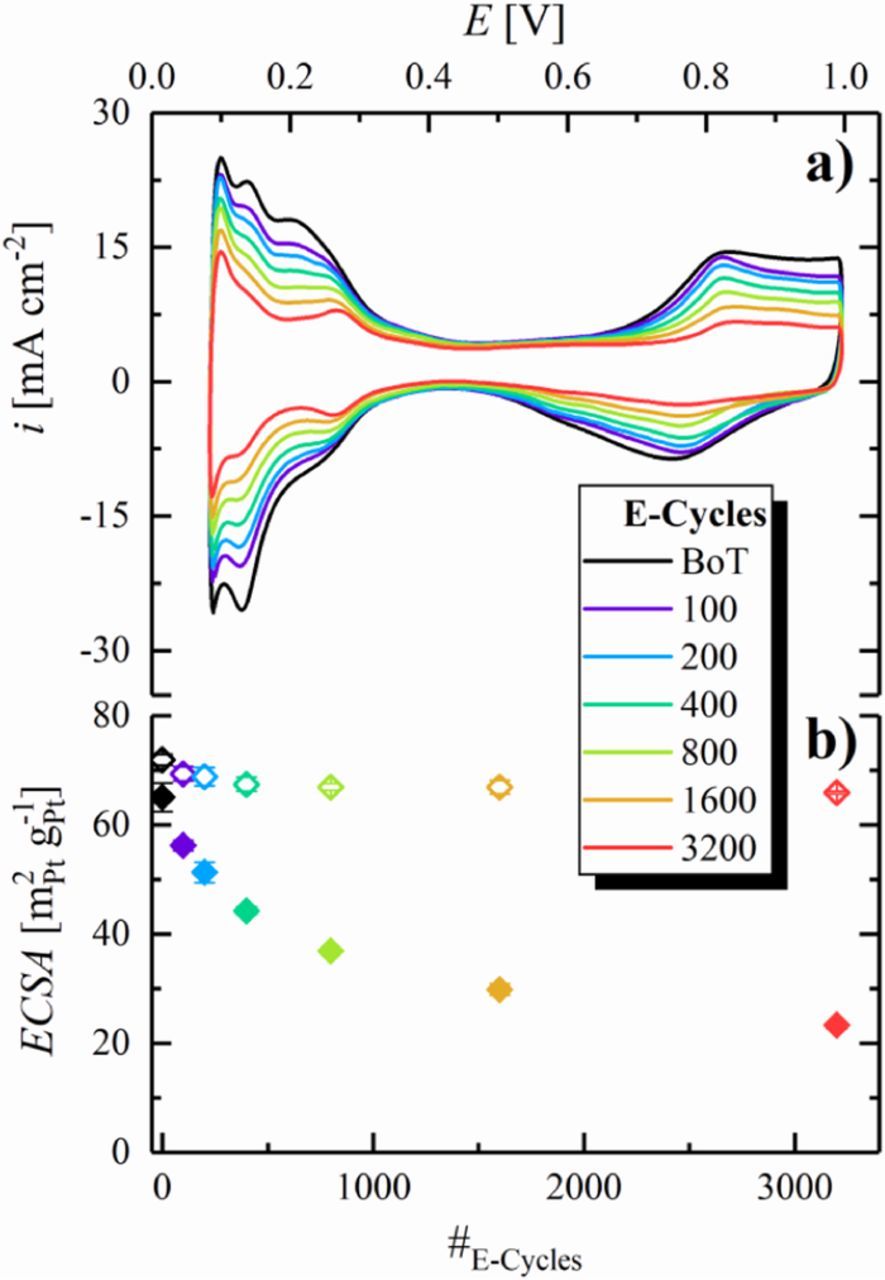
Figure 6. Voltage-cycling test of the anode catalyst layer designed to mimick the SUSD degradation of the anode, using a quasi square-wave perturbation between 0.05 and 1.05 V with a voltage ramp rate of 4 V s−1 between these two potentials and a hold of 60 s at each potential. a) CVs of the anode catalyst layer at 40°C after different numbers of E-cycles and at BoT (after MEA conditioning), recorded between 0.08–1.00 V at 200 mV s−1, using a constant flow of 50 nccm dry N2 in the anode compartment and 500 nccm fully humidified H2 in the cathode compartment, at a pressure of 50 kPag. b) ECSA vs number of E-cycles for the anode (filled symbols) and the cathode catalyst layer (hollow symbols), evaluated from the averaged Hupd charge in CVs with a limited potential range of 0.08–0.55 V under otherwise identical conditions (as indicated in Table I, 6 for BoT and after 100 SUSD cycles, 5 after 200 SUSD cycles, etc.).
Although the anode ECSA-loss during SUSD is lower than during anode voltage-cycling, the latter allows to quantify the loss in anode kinetics and changes in H2 mass-transport resistance induced by anode ECSA-loss, since the cathode catalyst layer remains intact throughout the entire measurement (shown in Figure 6b).
HOR overpotential caused by anode E-cycling
Due to the very fast HOR/HER kinetics on Pt, their quantification can only be done using the H2-pump method, first introduced by Neyerlin et al.54 In this, H2 is supplied to both sides of the MEA, and a current is applied to oxidize H2 on the anode side while the cathode serves as counter/reference electrode, providing a reductive current via the HER. In order to evaluate the HOR overpotential on the anode, the contribution of the HER on the cathode to the overall voltage needs to be comparably small in the current density region of interest (tested herein up to 2 A cm−2) and, more importantly, should not change significantly over the course of the experiment. Compared to the ORR,37 the HOR on Pt is faster by several orders of magnitude with an exchange current density of ≈250 mA cm− 2Pt at 80°C and 100 kPa H2 partial pressure.54–57 Here, the overpotential for the HOR/HER was shown to follow the Butler-Volmer equation
![Equation ([5])](https://content.cld.iop.org/journals/1945-7111/165/16/F1312/revision1/d0005.gif)
where i is the kinetic current density in mA cm−2, i0 is the HOR/HER exchange current density in mA cm− 2Pt, η is the overpotential in V, F is the Faraday constant, R is the gas constant, T is the temperature (in K), and αa and αc are the anodic and cathodic transfer coefficients, respectively. Using the above given exchange current density and the values of αa = αc = 0.5 determined by Durst et al.,57 an HOR overpotential of only 4 mV is predicted at a current density of 2 A cm−2 at the anode rf of 65 cm2Pt cm−2 at BoT in our case (0.1 mgPt cm−2 loading at a specific surface area of 65 m2Pt g− 1Pt). In fact, the high HOR exchange current density has been proven to enable Pt loadings in the anode catalyst layer of as little as 50 μgPt cm−2 without significant loss in the H2/air performance compared to higher anode loadings (400 μgPt cm−2).34 For the HER occurring at our cathode in the H2-pump experiments (rf ≈ 260 cm2Pt cm−2), the calculated overpotential at 2 A cm−2 is ηHER ≈ 1 mV. Due to this rather small contribution of the cathode and the fact that the cathode does not age during anode E-cycling (see Figure 6b), the cathode overpotential is neglected herein. Hence, the following analysis of the HOR overpotential can be directly correlated to the contribution of the anode in H2/air and H2/O2 polarization curves.
Figure 7a shows a measured EHFR+Nernst-free potential (corresponding to ηHOR) of 3 ± 4 mV at 2 A cm−2 at BoT (black diamonds), agreeing well with the above estimate based on the published HOR/HER kinetics, thereby confirming the absence of other voltage losses in the H2-pump configuration. Note that the large error bars are due to the very low overpotentials and to errors in determining the HFR (≈5%); this is the reason why for precise measurements of the HOR/HER kinetics, very low Pt loadings are required.54,57 The anode ECSA-loss of ≈65% after 3200 E-cycles translates into an additional kinetic overpotential of 7 mV at 2 A cm−2 according to the Butler-Volmer equation based estimate using the above given kinetic parameters, which is again perfectly consistent with the measured 10 ± 3 mV at 2 A cm−2 (red diamonds). The agreement between calculated and measured ηHOR gains upon anode ECSA-loss requires that the HOR/HER exchange current density is invariant with ECSA, which previously was shown to be the case for catalysts with largely different m2Pt g− 1Pt values.55
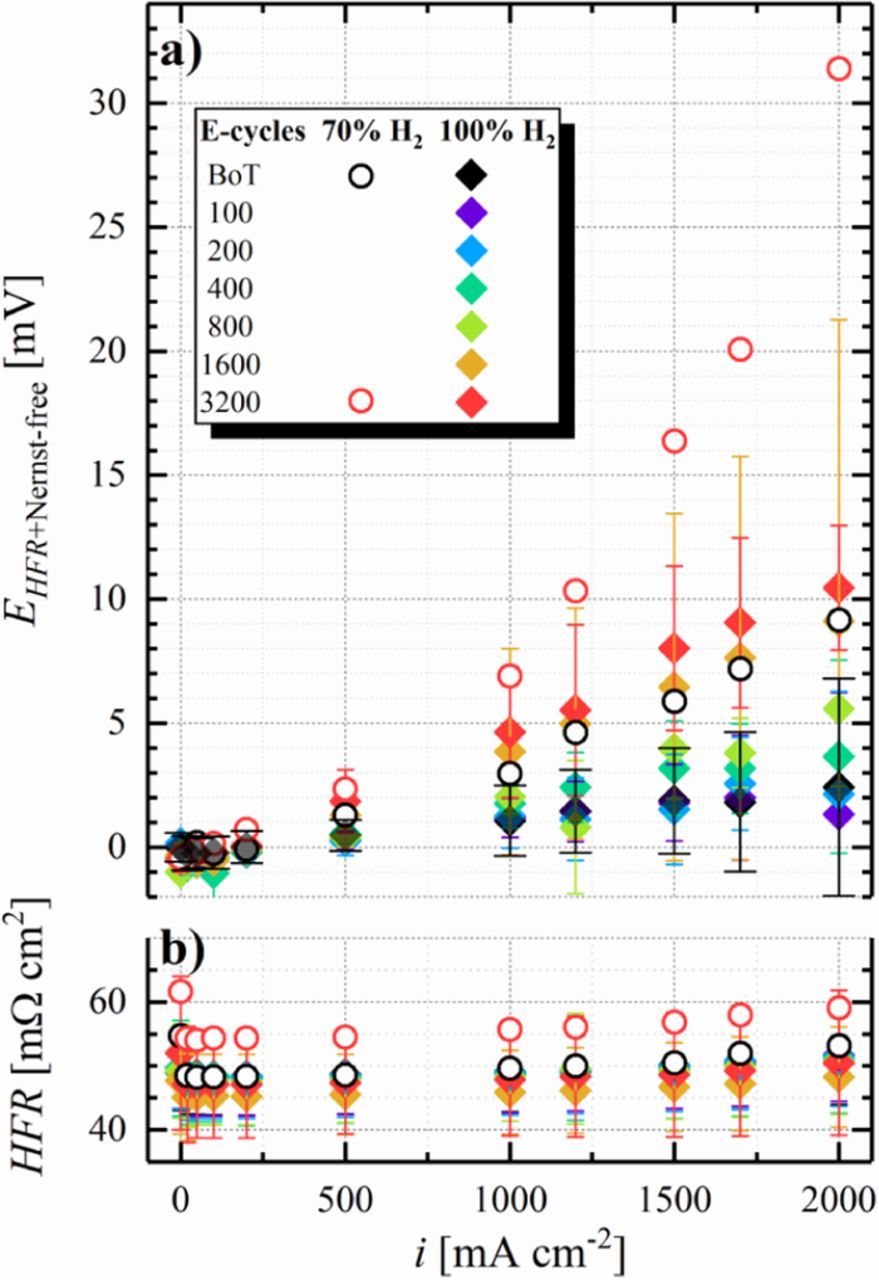
Figure 7. a) H2-pump polarization curves of a 50 cm2 Gore MEA at 80°C, 100% RH, and 70 kPag at a fixed flow rate of 2000 nccm H2 on the cathode and 2000 nccm H2 (diamonds) or 70% H2 in N2 (circles) on the anode, respectively. b) HFR determined via GEIS measurements at the respective current density. The potential (EHFR+Nernst-free) was corrected for the HFR and in case of the 70% H2 data (circles) for the Nernstian shift. Error bars represent the standard deviation from independent repeat measurements (analogous to the SUSD protocol shown in Table I, 6 for BoT and after 100 E-cycles, 5 after 200 E-cycles, etc.).
As discussed above, under automotive operating conditions with a H2 utilization of 99% and with an anode recycle loop, the N2 concentration in the anode flow-field can be as high as ≈30% at low current densities of 0.2 A cm−2. Thus, to obtain insights into the anode overpotential arising under such operating conditions, experiments with dilute feed gas (70% H2 in N2) were carried out. In addition to kinetic overpotential losses, these experiments with dilute H2 will also yield information with respect to the H2 mass-transport properties of the anode before (Figure 7, black, hollow circles) and after aging (Figure 7, red, hollow circles). Due to the lower concentration of H2 in the gas feed, the equilibrium potential of the anode shifts with respect to the counter/reference electrode operated under pure H2, which is corrected for in Figure 7 by subtracting the calculated Nernst shift (5.4 mV at 80°C and 70% H2) from the measured potential. Furthermore, reducing the concentration of H2 in the anode feed is expected to cause a small offset in the kinetic HOR overpotential compared to pure H2 (5 mV in dilute H2 compared to 4 mV in pure H2 at 2 A cm−2 and a rf of 65 cm2Pt cm−2) due to the slower apparent kinetics at the lower H2 partial pressure, following a 0.5-order dependence58 (i.e.,  ). However, the anode overpotential measured in 70% H2 at BoT of ≈9 mV at 2 A cm−2 (black circles in Figure 7a) is larger than that determined in pure H2 (3 ± 4 mV at 2 A cm−2), which must originate from an overpotential induced by H2 mass-transport to the Pt surface, likely due to the lower H2 diffusion coefficient in the N2 containing mixture. After 3200 E-cycles, the total anode overpotential in 70% H2 in N2 increases to ≈31 mV (red circles in Figure 7a), much larger than the ≈8 mV predicted by the HOR/HER kinetics for the decreased anode ECSA after 3200 E-cycles. Hence, we attribute this additional overpotential to a significantly increased H2 mass-transport resistance produced by E-cycling. As outlined in the analysis of SUSD-induced cathode degradation, such mass-transport overpotentials are typically caused by a loss of void volume in the electrode, originating from the oxidation of the carbon support to high potentials. In the case of SUSD-induced cathode degradation, the cathode potential can reach ≈1.5 V, where carbon support corrosion is very fast, and where it leads to the well-known effect of "cathode thinning". Quite clearly, cycling the electrode potential to only 1.05 V in the case of our anode E-cycling protocol, much less carbon support corrosion is expected, but as shown by Borup et al.,8 it is not negligible. Evidence for corrosion of the anode carbon support during SUSD was presented by Engl et al., who reported significant carbon oxidation on the anode electrode during SUSD in high temperature phosphoric acid fuel cells.18
MEA thickness after SUSD/E-cycles
To determine whether one can indeed observe a thinning of the anode catalyst layers upon extended SUSD cycles or E-cycles, cross sections of pristine and aged MEAs were prepared and analyzed via SEM. MEAs after 3200 SUSD cycles (Figure 8b) show a clear deposition of Pt inside the membrane, close to the cathode electrode, originating from the reduction of Pt ions by H2 permeating from the anode compartment, as outlined earlier. On the other hand, the SEM image after 3200 E-cycles presented in Figure 8c shows a clearly brighter contrast at the membrane/anode interface compared to BoT (Figure 8a), consistent with the above stated hypothesis that voltage-cycling on the anode leads to an accumulation of Pt precipitates in this region.
Due to the relatively inhomogeneous electrode thickness, already in their pristine state, and especially on the anode side (cf. Figure 8a), the electrode thickness was obtained by dividing the respective catalyst layer's cross section area by their length within the imaged MEA section. The calculated mean layer thicknesses were double-checked with ordinary thickness measurements in the center of each micrograph. All MEAs were investigated at five different positions along the anode gas flow direction (see Figure 1) to resolve local differences in the thinning profile from inlet to outlet, which is commonly observed for SUSD-aged cathodes.59 At each of these five locations, ten micrographs were taken to obtain statistically significant results. As expected, local disparities were only observed for cathodes aged by SUSD (Figure 9a, solid symbols), i.e., a moderate thinning by about 20% within 1600 SUSD cycles close to the anode inlet, while the cathode layer thickness at the center of the cathode active area and the region facing the outlet of the anode flow-field decreased by at least 50% of their original thickness. This much higher degradation near the cathode outlet can be assigned to the so-called pseudo-capacitive effect, which mitigates the carbon oxidation reaction (COR) during the reverse current event via capacitive charging of the electrodes during potential transients.16 Since the effectiveness of this mitigation is stronger during shut-down compared to start-up, cathode corrosion in the vicinity of the anode inlet, which is mainly occurring during shut-down, is more strongly suppressed, leading to the observed thinning profile. This pattern is expected whenever the H2/air front residence time is short, as is the case in our experiments (≈0.1 s), because capacitive effects can more effectively provide the reverse current at fast potential transients. Assuming that the volume of the fully humidified ionomer in the cathode is roughly the same as that of the carbon (i.e., an ionomer to carbon weight ratio of ≈0.6), and based upon the packing density of 18% for conventional carbons,60 the void volume fraction amounts to about 60% in the pristine cathode at 100% RH. Since electrode thinning is caused by carbon structure collapse after the corrosion of only 7–10%wt of the total carbon mass,25 the loss of electrode volume is at the expense of the electrode's void volume fraction. Consequently, the observed thickness reduction of 20 and 50% is indicative of a drop in void volume by 1/3 and 5/6, respectively, resulting in the unacceptably high O2 mass-transport penalties observed in the corresponding H2/air curves discussed above (Figure 2a).
In contrast to the clearly observable thinning of the cathode during SUSD, a much more subtle thinning of the anode upon SUSD/E-cycling is indicated by the measurements provided in Figure 9b (black and red diamonds), with rather large error bars compared to the overall changes. As no trend with respect to the sampling location (see Figure 1) could be determined at the five imaged positions, all anode thicknesses measurements on a given MEA were averaged. The results show a ≈25% anode thinning for both aging protocols, even though it must be noted that the respective error bars largely overlap for all measurements between BoT and 3200 aging cycles. Nevertheless, these relatively large error bars are mainly due to the high thickness variations of the anode electrodes in the pristine MEA (Figure 8a), so that the general trend of a ≈25% anode thinning over the course of 3200 SUSD or E-cycles is still significant. For an anode, for which the ionomer to carbon weight ratio is typically close to one, this translates into a more than 50% loss in void volume fraction, which suggests that the large non-kinetic overpotentials after 3200 E-cycles observed in H2-pump experiments conducted with 70% H2 at the anode side (red circles in Figure 7a) are indeed due to a H2 mass-transport resistance caused by anode carbon corrosion during voltage-cycling (and, by extension, during SUSD cycles). Finally, as expected, anode aging via E-cycles does not lead to a thinning of the cathode (red diamonds in Figure 9a).
Implications for low-loaded anodes
Even though the here observed kinetic HOR overpotentials were small both at BoT and after aging of the MEAs via E-cycling (see data in pure H2, Figure 7a), the targeted anode Pt loadings for commercially viable MEAs are on the order of 50 μgPt cm−2 (compared to 100 μgPt cm−2 in this study) at current densities up to 3 A cm−2.22 For example, in order to meet the current DoE target of 125 μgPt cm−2 total Pt loading in the MEA,61 and considering the large O2 mass-transport resistance when using cathode loading of less than 100 μgPt cm−2,62,63 anode loadings likely will need to be further reduced to as little as 25 μgPt cm−2. For such extremely low anode loadings, the HOR kinetic losses may become significant and anode ECSA-losses upon SUSD events can be expected to gain relevance.
To enable a comparison of the expected contribution of the HOR to the overall fuel cell performance with respect to the anode loading and the SUSD-induced anode ECSA-loss, Figure 10 shows the kinetic overpotential as a function of the anode roughness factor, calculated via the Butler-Volmer equation (see Equation 5), using an HOR/HER exchange current density of 240 mA cm− 2Pt and of 120 mA cm− 2Pt at 80°C and 40°C, respectively, anodic/cathodic transfer coefficients of αa/c = 0.5, and a H2 partial pressure of 100 kPa. As verified experimentally by the H2-pump measurements discussed in the previous section, the high anode roughness factor of ≈65 cm2Pt cm−2 (based on 100 μgPt cm−2 with a BoT specific surface area of 65 m2Pt gPt− 1) leads to minor kinetic overpotentials, estimated to be only ≈6 mV even at a current density as high as 3 A cm−2 at 80°C (black line in Figure 10). For an anode catalyst with the same ECSA applied at a loading of 50 μgPt cm−2, the rf decreases to ≈32 cm2Pt cm−2, while the kinetic HOR overpotential remains relatively low at ≈12 mV at 3 A cm−2 and 80°C, underlining the observation made by Gasteiger et al., that the overall fuel cell performance in H2/air is not noticeably affected when lowering the anode loading from 400 μgPt cm−2 to 50 μgPt cm−2.34 However, considering a future employment of anodes with a decreased Pt loading of 25 μgPt cm−2, the rf for the same catalyst would decrease to ≈16 cm2Pt cm−2, in which case the HOR overpotential would increase to ≈23 mV at 3 A cm−2. While PEMFC testing is most commonly studied at a constant temperature of 80°C, applied systems will at least partially operate at lower temperatures, e.g., after starting the system or at low ambient temperatures, leading to a more pronounced contribution of the anode HOR overpotential of ≈38 mV at 3 A cm−2 and 40°C for these ultra-low anode loadings (red line in Figure 10).

Figure 10. Kinetic overpotential for the HOR at 3 A cm−2 as a function of the anode roughness factor, calculated for an exchange current density of i0 = 240 mA cm− 2Pt or 120 mA cm− 2Pt at 80°C or 40°C, respectively, for a H2 partial pressure of 100 kPa, and for anodic and cathodic transfer coefficients of αa/c = 0.5.
While anode overpotentials in this order of magnitude are already at the limit of a tolerable voltage loss for practical applications, aging of the anode catalyst layer due to SUSD cycles, resulting in a reduction of the ECSA on the order of 50% will lead to non-tolerable increases of the anode overpotential, e.g., an increase at 3 A cm−2 to more than 40 mV at 80°C and more than 65 mV at 40°C. In conclusion, the degradation not only of the cathode, but also of the anode during SUSD needs to be taken into consideration in order to obtain a durable PEMFC system when reducing the Pt content on the anode to meet future loading targets.
Conclusions
In this manuscript, the effect of SUSD not only on the cathode, but also on the anode side of PEMFCs was shown. While the degradation of the cathode followed the expected pattern and was observable with respect to a decrease of ECSA, an associated increase in the kinetic overpotential, as well as an increase of the O2 mass-transport resistance, anode degradation was found to occur as also a combination of carbon corrosion, distinctive in the form of electrode thinning, and ECSA-loss. While the loss of ECSA can be simply monitored by recording CVs in the course of SUSD cycling, the development of an AST based on voltage-cycling between ≈0 and ≈1 V was necessary to determine the effect of carbon corrosion in a H2-pump measurement under dilute H2 on the working electrode. As outlined by our final analysis of the kinetic HOR overpotential as a function of anode rf, the implementation of ultra-low loaded anodes (i.e., 25 μgPt cm−2), necessary in the future to meet cost requirements for a widespread commercialization of PEMFC systems in automotive applications, requires to largely mitigate anode degradation. Among different strategies to mitigate SUSD-induced degradation, simply limiting the amount of SUSD events addresses both, cathode and anode deterioration and therefore is the strategy of choice with respect to our findings. Such system management-based approaches are e.g., to maintain the anode compartment filled with H2 during longer lasting idle times, or to consume the O2 in the cathode compartment before a full shut-down of the system. If this could decrease the number of SUSD events to ≤100 cycles throughout the lifetime of a vehicle, the ECSA-losses on both electrodes (<20%), as well as the associated H2/air performance loss would be tolerable, even for the target total Pt loading of 0.125 mgPt cm−2.
Acknowledgment
The authors of this study acknowledge the work of Nhat Long Tran Pham and David Fischermeier for providing some help in an early phase of this study. Furthermore, the expert work of Katia Rodewald to obtain SEM images of MEA cross sections is greatly appreciated. Finally, Greenerity GmbH is acknowledged for funding through a subcontract co-funded by the German Federal Ministry for Economic Affairs and Energy (BMWi; project "HyMotion5-Brennstoffzellenstapel" under the project support number 03ET2058C).
ORCID
J. N. Schwämmlein 0000-0001-8902-4508
P. J. Rheinländer 0000-0002-0018-065X