
Abstract
The corrosion and passivation behavior of carbon steel AISI 1020 in borate buffer pH 8.4 were studied in terms of a superposition model for corrosion partial reactions, applied for experimental polarization curves measured using two different cell arrangements of a batch and a flow cell. It was found that the kinetics of both the hydrogen evolution and iron oxidation reactions are affected by the hydrodynamic conditions at the electrode surface in combination with an strong influence of the borate buffer concentration in the active-transition region. Supporting facts with experimental interpretation are presented to explain this behavior.
Export citation and abstract BibTeX RIS
The passivity of iron1–3 has been subject of extensive research activity. From the large amount of information available on the subject, the structure of the iron passive film seems to be highly variable depending on the formation or measurement conditions. For instance, the wide variety of passive layer descriptions available in the literature includes a bilayer structure with Fe3O4 at the metal/oxide film interface and γ-Fe2O3 at the oxide film/solution interface,4–8 a passive film structure ranging from amorphous iron hydroxides or oxyhydroxides9 to crystalline like Fe3O4 or γ-Fe2O3,10 and diverse passive film structures formed depending on the method of formation.11 Under ideal experimental conditions the passive film structure has been found to be a combination of amorphous and crystalline iron oxides, with semiconductor properties.12,13 In view of their inherent complexities, the effect of the external hydrodynamic conditions of the electrolyte in the passive film formation is usually ignored.
Published works show that hydrodynamic conditions can affect different electrochemical processes, including the passive film formation which takes place at different potentials of iron and steels in various solutions, including borate buffer solutions. However, the experimental evidence is only descriptive and lacks any explanation or adequate mechanism for the reported effects.
Büchler et al.14 using a light reflectance technique found that hydrodynamic conditions notably affects the formation of a hydroxide layer during passivation on iron in neutral and alkaline solutions. They pointed out that the strong influence of the hydrodynamic conditions can explain many contradictory results in the literature concerning the presence of a hydroxide layer on the protecting oxide film. Significant differences in oxidation mechanism for existing different phases on steel could be an additional factor to explain contradictory results. Cabrera et al.15 using in situ electrochemical scanning tunneling microscopy for carbon steel corrosion immersed in a borate solution, presented evidence of the presence of pearlite and ferrite phases on carbon steel each showing distinctive corrosion features. In particular, the iron-rich phase (ferrite) showed faster oxidation growth than pearlite.
In the present work, the corrosion and passivation behavior of carbon steel AISI 1020 in borate buffer solution were studied in terms of a superposition model for hydrogen evolution, iron oxidation, iron passivity and oxygen evolution. The experimental data for this study was from linear voltammetric sweeps measured using two different electrochemical cells, namely a batch cell with a rotating disk electrode and an annular flow cell with a cylindrical band electrode. The aim of this work was to find evidence to propose and support a mechanism(s) to explain the kinetic behavior of the electrochemical processes of carbon steel in borate buffer pH 8.4 that takes place in a potential range between −1000 to 1200 mVSHE under different fluid dynamic regimes of the electrolyte.
Experimental
Materials
The metal specimens were carbon steel AISI 1020 (UNS G10200) with a chemical composition (% wt): Mn 0.3–0.6, C 0.18–0.23, S 0.05 maximum, P 0.04 maximum, and the balance Fe.
Three borate solutions (pH 8.4) referred as solution A, B and C were prepared from 0.6 mol/L H3BO3 + 0.15 mol/L Na2B4O7·10H2O, 0.3 mol/L H3BO3 + 0.075 mol/L Na2B4O7·10H2O, and 0.15 mol/L H3BO3 + 0.0375 mol/L Na2B4O7·10H2O, respectively. Ultra-pure water (Millipore, 18.2 MΩ cm) and Merck analytic reagents were used.
Electrochemical cells and electrodes
The experiments were performed in duplicate under forced convection in two different 3-electrode electrochemical cells: a classical batch cell with a rotating disk electrode (RDE) and a novel flow cell with different working electrode (WE) geometries.
The batch cell filled with 80 ml of solution had a 4 mm disk working electrode, a platinum coil as counter electrode and an Hg/Hg2SO4 (sat.) electrode as a reference electrode. The RDE was attached to a BASi RDE-2 rotating disk electrode Bioanalytical Systems, Inc. West Lafayette, USA. Its exposed area was 1.26 × 10⁻⁵ m2.
The flow cell set-up is represented in Fig. 1. Its main parts are a magnetic pump, a flow cell, a flow meter, an optical dissolved oxygen meter and a holding flask. The connecting tubing was a Master flex Pharmed type. All parts and accessories except for the test specimen and counter electrode were nonmetallic. The dissolved oxygen measurement device was a Thermo Scientific optical dissolved oxygen model Orion 3 Star. The flow cell has two main parts: a cylindrical electrode and a flow cell body (see Fig. 2). The cylindrical electrode contains the working electrode as a section firmly attached to the PVC electrode body. A cylinder rod extension from each side of the metal specimen was used to achieve a tight metal/plastic junction using epoxy resin adhesive for sealing. The annular space for solution circulation between the cylindrical electrode and the flow cell body have internal and external radius of 3.3 and 7.5 mm, respectively. The reference electrode is located 4 mm downstream from the cylindrical counter electrode. Given the high cost of a platinum hollow cylinder, a 316L stainless steel was used instead as a material for the counter electrode having an active internal surface of 5.03 × 10⁻³ m2.

Figure 1. Schematic arrangement of flow cell set up. 1) Nitrogen flow, 2) Holding flask, 3) Magnetic drive pump, 4) Flow meter, 5) Flow cell, 6) Potentiostat, 7) On-line optical dissolved oxygen concentration meter.
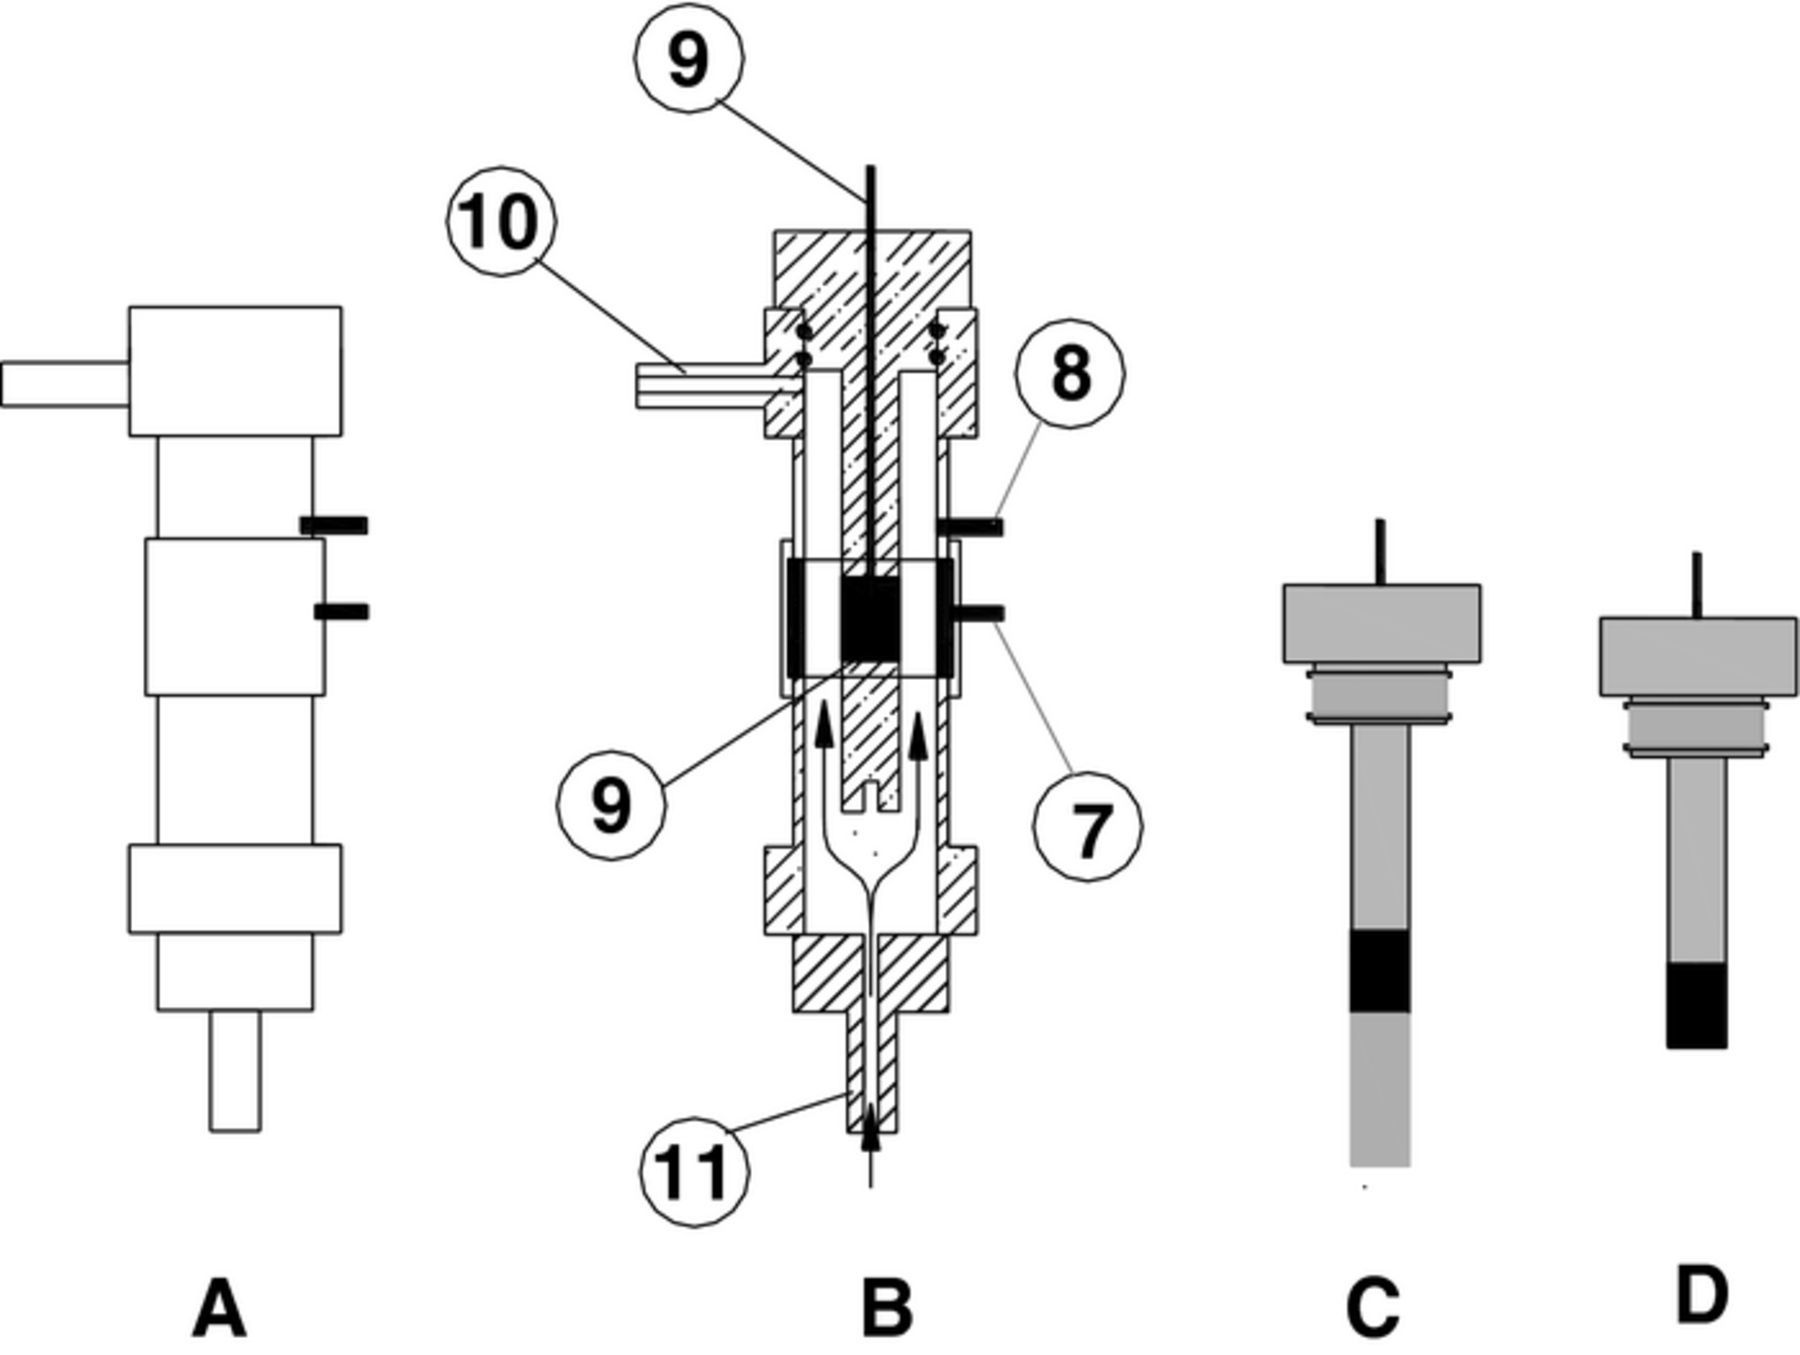
Figure 2. Schematic arrangement of the flow cell: A) Flow cell body, B) cross section and internal parts of the flow cell, 7) Counter electrode, 8) Reference electrode, 9) Cylindrical electrode, 10) Outflow and, 11) Inflow. Cylindrical electrode in two types: C) type CE with axial even flow, D) type CU with axial uneven flow.
The working electrodes for the flow cell were in two types, a cylindrical electrode with even axial flow (CE) and a cylindrical electrode with uneven axial flow (CU). The CE electrode area was a confined cylindrical section shown as a dark section in the PVC electrode body (see Fig. 2C); such geometry enables a fairly uniform axial flow over the specimen area. The CU electrode (see Fig. 2D) was a cylindrical section attached to the PVC electrode body at one end face leaving the other circular end exposed to the fluid solution; such geometry enables uneven flow over the exposed area. Electrodes CE positioned at 20 mm (from the bottom of the PVC body), were of two sizes, 2 and 6 mm length with areas equivalent to 4.40 × 10⁻⁵ and 1.36 × 10⁻⁴ m2, respectively. Electrode CU area was 2.01 × 10⁻⁴ m2. The electrical connection between the working electrode and the potentiostat is through a central steel 3 mm diameter bar inserted in the central axis of the upper PVC cylindrical section (see Fig. 2).
A hydrodynamic characterization based on a computation fluid dynamics described in the Appendix demonstrates that under the fluid conditions of the present research the CE electrodes are exposed to near developed laminar regime with constant velocities and shear stress over the electrode surface; in contrast with CU electrodes that are exposed to significant turbulence. A similar analysis made for RDE electrodes indicates a non-uniform velocity and shear stress profiles over the electrode surface.
Experimental runs
Sample preparation
The electrode surfaces were abraded in a lathing machine with 600 and 1200 grade emery papers, then cleaned by ultrasonic washing during 5 min with ethanol (C2H5OH) further washed with distilled water and acetone, and dried by compressed air.
Experimental with flow cell
Electrochemical experiments were conducted at room temperature (25 ± 0.5 ºC) in N2-purged solutions. The experimental runs started under continuous nitrogen bubbling and a fixed flow rate of the electrolyte until dissolved oxygen concentration reading below 0.01 mg/L was achieved. A linear sweep voltammetry was immediately performed in the positive direction from −1000 mVSHE at a scan rate of 2 mV/s.
Electrochemical parameters
Under the assumption of the mixed potential theory, any electrochemical reaction can be decomposed into two or more partial oxidation and reduction reactions. Applying this principle to each distinctive region namely active, transition, passive and transpassive in a polarization curve (see Fig. 3), a set of model equations for the total current density is formulated as follows:
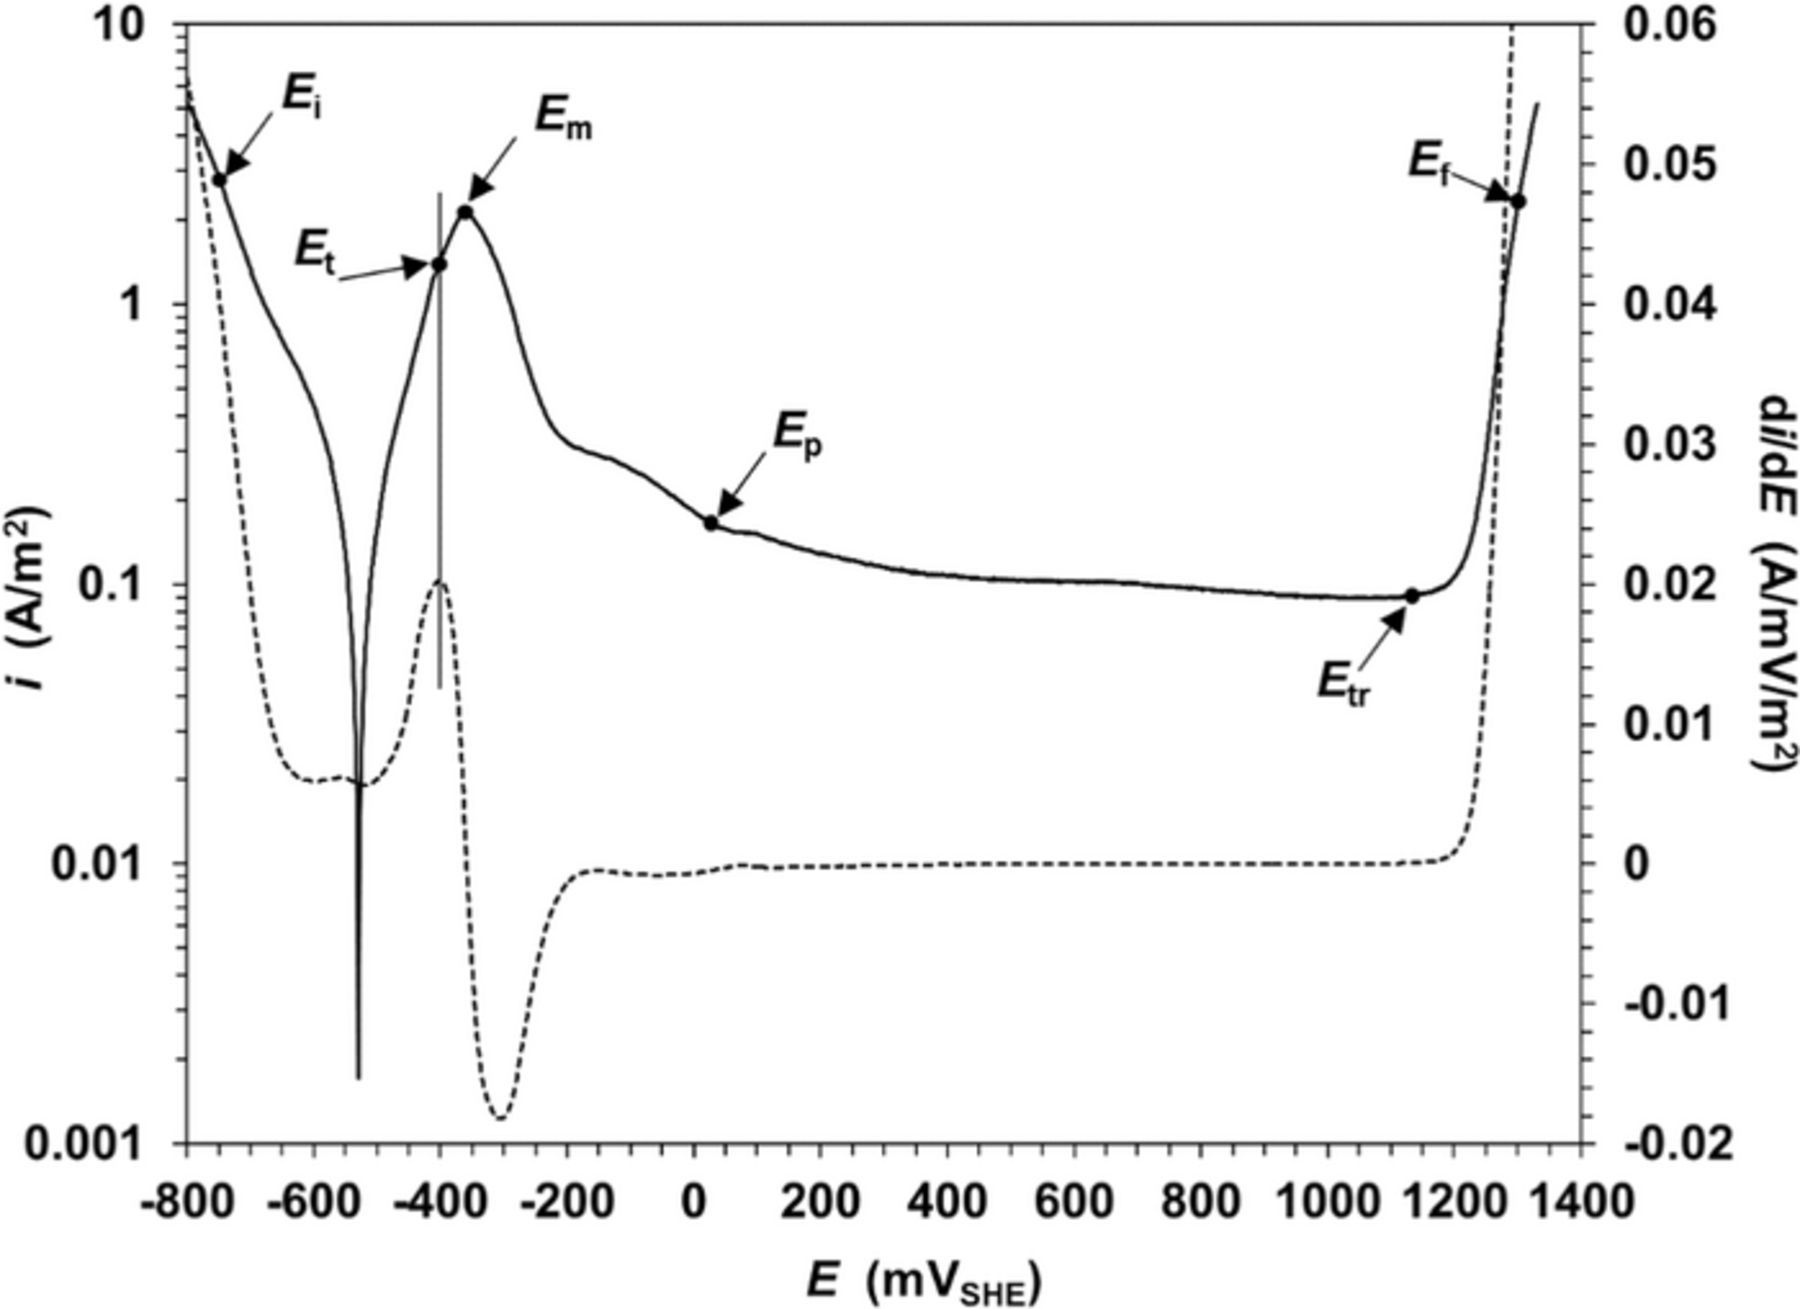
Figure 3. Typical polarization curve for carbon steel in buffer borate solution. Dashed line is the first derivative curve.
Active region:
![Equation ([1])](https://content.cld.iop.org/journals/1945-7111/163/5/C171/revision1/d0001.gif)
where, ia is the total current density in the active region delimited by Ei and Et potentials values shown in Fig. 3, and  and iFe are the partial current density for hydrogen evolution and iron oxidation, respectively. As shown in Fig. 3, the Et value in this modeling is the inflexion point of the polarization curve determined as a first derivative test for local minimum.
Assuming a charge transfer control mechanism for the kinetics expressions of iron oxidation and hydrogen evolution and neglecting the counterpart back reactions, Eq. 1 can be expressed as follows:16,17
![Equation ([2])](https://content.cld.iop.org/journals/1945-7111/163/5/C171/revision1/d0002.gif)
![Equation ([3])](https://content.cld.iop.org/journals/1945-7111/163/5/C171/revision1/d0003.gif)
where, i0Fe and  are exchange current densities, ηFe = E − EeqFe and
  are overpotentials, EeqFe and
  are equilibrium potentials and bFe and
  are Tafel slopes with subscripts designating of iron oxidation and hydrogen evolution, respectively. A ferrous iron concentration value of 1 × 10⁻⁶ mol/L at pH 8.4 and 25 ºC was assumed for the calculation of Nernstian equilibrium potential values of EeqFe and
  as −617 and −496 mVSHE, respectively.
Transition region:
The model for the transition zone is based on Flitt and Schweinsberg:17
![Equation ([4])](https://content.cld.iop.org/journals/1945-7111/163/5/C171/revision1/d0004.gif)
where, iτ is the transition current density that takes place in a potential range delimited between Et and Ep potential values (see Fig. 3), iu and if are the current density of unfilmed and filmed regions, respectively. S is equal to unity and zero at the lower and high limit potentials Et and Ep respectively. Since S can be considered as remnant portions of the active region, then iu is considered equivalent to ia. Similarly, if is considered equivalent to the passive current density ip.
The S term is a function of applied potential E:17
![Equation ([5])](https://content.cld.iop.org/journals/1945-7111/163/5/C171/revision1/d0005.gif)
where, p and A are the shape and width factors, respectively.
Passive and transpassive region:
The passive region is characterized by surface film formation that inhibits iron oxidation, and thus the current density ip must remain at low values until oxygen evolution occur at a high potential.18 In order to characterize the ip variability, the variable Qp was defined as the total charge measured during the voltammetric scan between −100 and 1200 mVSHE, according to:
![Equation ([6])](https://content.cld.iop.org/journals/1945-7111/163/5/C171/revision1/d0006.gif)
where v is equal to 2 mV/s.
The kinetic expression for both the passive and transpassive region is:
![Equation ([7])](https://content.cld.iop.org/journals/1945-7111/163/5/C171/revision1/d0007.gif)
where the electrochemical parameters for the transpassive reaction are: i0, tr the exchange current density, ηtr = E − EeqO2 the overpotential, Eeqtr the equilibrium potential and btr the Tafel slope. It was assumed that the Eeqtr value was equivalent to 680 mVSHE which corresponds to the Nernstian equilibrium potential for the oxygen evolution reaction at a dissolved oxygen concentration ( ) value of 0.01 mg/L, pH 8.4 and 25 ºC.19,20
The unknown parameters including all exchange current densities, Tafel slopes, A, and p values were determined by minimization of the total sum of the squared values as follows:
![Equation ([8])](https://content.cld.iop.org/journals/1945-7111/163/5/C171/revision1/d0008.gif)
where, n is the number of current-potential data, iexp is a steady-state current density measurement taken at a given applied potential E in the cell, and i is the theoretical expression for current density at the same potential.
And i is defined as follows:
![Equation ([9a])](https://content.cld.iop.org/journals/1945-7111/163/5/C171/revision1/d0009.gif)
![Equation ([9b])](https://content.cld.iop.org/journals/1945-7111/163/5/C171/revision1/d0010.gif)
![Equation ([9c])](https://content.cld.iop.org/journals/1945-7111/163/5/C171/revision1/d0011.gif)
![Equation ([9d])](https://content.cld.iop.org/journals/1945-7111/163/5/C171/revision1/d0012.gif)
The corrosion potential, Ecorr, and the corrosion current density, icorr, in the active region is determined from Eq. 2 when i = 0 A/m2.
Results and Discussion
Polarization curves comparison under flow cell and RDE electrodes
A preliminary remark is the degree of relevance of the residual dissolved oxygen concentration that is not been considered in the kinetic model for the corrosion behavior. Assuming that the residual dissolved oxygen concentration in the electrolyte is 0.01 mg/L, then, from the Levich equation and parameters reported in the literature,17,21 an estimated maximum value of 0.005 A/m2 in the active region would be expected for oxygen reduction current density. This value is significantly lower than the partial current density for hydrogen evolution calculated for the corrosion potential value, which is larger than 0.2 A/m2. Therefore the effect of the residual oxygen can be dismissed.
Figs. 4 and 5 shows polarization curves as continuous lines for carbon steel in solution C (0.15 mol/L H3BO3 + 0.0375 mol/L Na2B4O7.10H2O borate buffer) measured in a RDE at 1200 rpm (Re = 623) and in a flow cell at Re = 100, respectively. These curves have all the features shown in Fig. 3. The transition region is characterized by a large peak at −350 mVSHE which is coincident with that reported in prior investigations11,22 and also a small and diffuse peak between approximately 0 and 180 mVSHE. The first peak has been attributed to iron dissolution and Fe(OH)2 formation, leading to a rapid decrease in the current up to values close to zero as a consequence of the low solubility equilibrium constant.4,22 The second peak with a low current is attributed to the conversion of a part of the FeII to FeIII species.13

Figure 4. Experimental and modeled polarization curves for RDE electrode in solution C. Electrode rotation rate 1200 rpm (Re = 623); scan rate 2 mV/s.
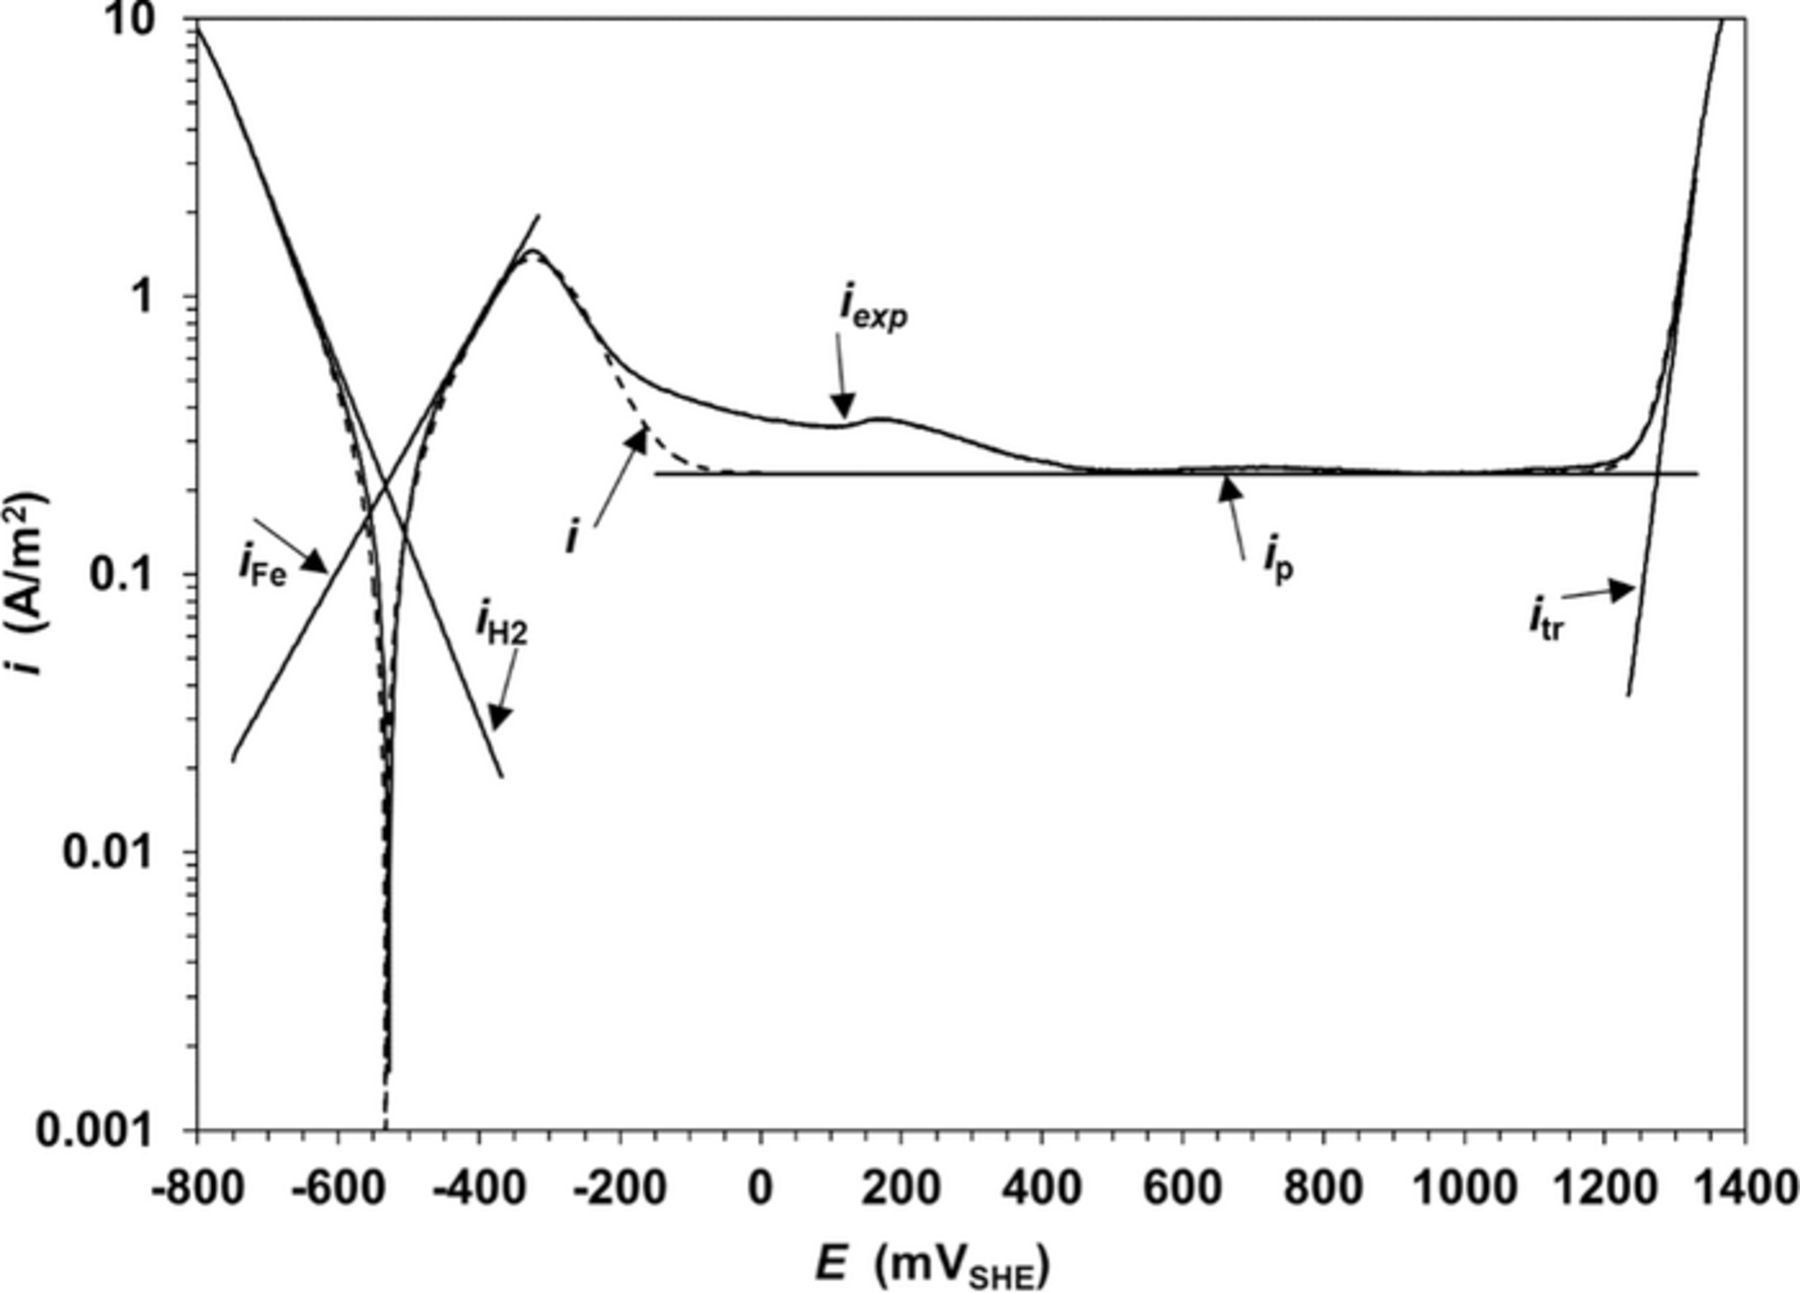
Figure 5. Experimental and modeled polarization curves for flow cell electrode in solution C. Re = 100; scan rate 2 mV/s.
Although polarization curves for RDE and flow cells have similar shape, which are typical for iron in borate solutions,11,22,23 many differences in the kinetics of the partial reactions are observed (Tables I–III): a).- For each buffer solution the  values for the flow cell are lower than those for the RDE cell, b).- Higher bFe values for the flow cell in comparison with those for RDE cell under any buffer solution, c).- Lower peak height in the transition zone for the flow cell in comparison with those for the RDE cell. This is a direct consequence of the differences observed in the Tafel slopes, and d).- Lower values and more uniform current densities in the passivation zone for flow cell in comparison with those for the RDE cell. This is corroborated by lower Qp and ip values for the flow cell.
Table I. Electrochemical parameters for replicated carbon steel polarization curves measured in a flow cell using solutions A, B and C, at Re = 100 and CE electrodes of different lengths.
| Sol. A (0.6 mol/L H3BO3 + | Sol. B (0.3 mol/L H3BO3 + | Sol. C (0.15 mol/L H3BO3 + | ||||||||||
|---|---|---|---|---|---|---|---|---|---|---|---|---|
| 0.15 mol/L Na2B4O7.10H2O) | Sol0.075 mol/L Na2B4O7.10H2O) | 0.0375 mol/L Na2B4O7.10H2O) | ||||||||||
| CE short | CE long | CE short | CE long | CE short | CE long | |||||||
| Parameter | Average | Error, % | Average | Error, % | Average | Error, % | Average | Error, % | Average | Error, % | Average | Error, % |
| Ei, mVSHE | −750 | −750 | −750 | −750 | −750 | −750 | ||||||
| Et++, mVSHE | −347 | 1.0 | −358 | 1.5 | −367 | 4.5 | −380 | 1.5 | −380 | 4.5 | −390 | 0.5 |
| Em++, mVSHE | −311 | 2.0 | −320 | 1.0 | −327 | 1.0 | −339 | 0.5 | −336 | 1.0 | −350 | 0.0 |
| Ep, mVSHE | −230 | −270 | −290 | −290 | −300 | −300 | ||||||
| Ef, mVSHE | 1360 | 1360 | 1340 | 1350 | 1340 | 1335 | ||||||
| i0H2, A/m2 | −0.31 | 9.6 | −0.13 | 13.6 | −0.11 | 0.6 | −0.08 | 10.2 | −0.12 | 0.6 | −0.08 | 2.6 |
| bH2, mVSHE | 201 | 6.1 | 169 | 2.9 | 146 | 0.3 | 148 | 1.6 | 147 | 0.3 | 152 | 0.0 |
| i0Fe, A/m2 | 0.25 | 3.5 | 0.13 | 6.2 | 0.08 | 8.8 | 0.11 | 4.7 | 0.08 | 8.8 | 0.13 | 3.1 |
| bFe, mVSHE | 288 | 1.2 | 240 | 3.1 | 230 | 2.0 | 229 | 0.5 | 229 | 2.0 | 281 | 0.0 |
| i0tr x1011, A/m2 | 0.1 | 23.6 | 0.003 | 58.4 | 0.002 | 10.7 | 4.6 | 98.8 | 0.1 | 10.7 | 0.1 | 58.5 |
| btr, mVSHE | 55 | 1.3 | 49 | 2.5 | 47 | 0.2 | 60 | 12.1 | 52 | 0.2 | 54 | 2.6 |
| Ax104 | 0.9 | 6.8 | 0.03 | 11.3 | 1.8 | 1.4 | 0.3 | 3.3 | 37.2 | 1.4 | 0.1 | 67.2 |
| h | 2.1 | 0.8 | 3.0 | 1.0 | 2.0 | 0.7 | 2.4 | 0.0 | 1.6 | 0.7 | 2.7 | 6.7 |
| ip, A/m2 | 0.22 | 12.0 | 0.22 | 12.9 | 0.15 | 2.2 | 0.19 | 0.6 | 0.16 | 2.2 | 0.17 | 1.3 |
| Ecorr++, mVSHE | −535 | 4.3 | −546 | 4.3 | −532 | 2.5 | −555 | 0.8 | −525 | 2.5 | −559 | 0.8 |
| icorr, A/m2 | 0.49 | 0.01 | 0.25 | 6.2 | 0.20 | 4.7 | 0.20 | 6.7 | 0.19 | 4.7 | 0.21 | 2.3 |
| im, A/m2 | 2.91 | 0.3 | 2.23 | 3.5 | 1.31 | 5.8 | 1.61 | 3.2 | 1.01 | 5.8 | 1.13 | 0.8 |
| it, A/m2 | 2.18 | 0.03 | 1.54 | 0.1 | 1.02 | 7.65 | 1.17 | 1.97 | 0.85 | 1.14 | 0.84 | 2.60 |
| Qp, C/m2 | 208.3 | 8.4 | 108.7 | 47.8 | 245.8 | 2.6 | 124.2 | 49.5 | 133.8 | 2.6 | 68.3 | 49.0 |
Table III. Electrochemical parameters for carbon steel polarization curves measured in a RDE cell using solutions A, B and C.
| Sol. A (0.6 mol/L H3BO3 + | Sol. B (0.3 mol/L H3BO3 + | Sol. C (0.15 mol/L H3BO3 + | ||||||||||||||||
|---|---|---|---|---|---|---|---|---|---|---|---|---|---|---|---|---|---|---|
| 0.15 mol/L Na2B4O7.10H2O) | 0.075 mol/L Na2B4O7.10H2O) | 0.0375 mol/L Na2B4O7.10H2O) | ||||||||||||||||
| 0 rpm | 1200 rpm | 2500 rpm | 0 rpm | 1200 rpm | 2500 rpm | 0 rpm | 1200 rpm | 2500 rpm | ||||||||||
| Parameter | Average | Error, % | Average | Error, % | Average | Error, % | Average | Error, % | Average | Error, % | Average | Error, % | Average | Error, % | Average | Error, % | Average | Error, % |
| Ei, mVSHE | −700 | −700 | −700 | −620 | −700 | −700 | −650 | −650 | −700 | |||||||||
| Et++, mVSHE | −388 | 1.5 | −379 | 2.50 | −381 | 0.0 | −407 | 9.5 | −377 | 0.5 | −376 | 1.5 | −439 | 6.5 | −395 | 4.5 | −387 | 0.5 |
| Em++, mVSHE | −342 | 1.0 | −326 | 1.00 | −327 | 1.5 | −356 | 6.5 | −328 | 1.0 | −332 | 1.0 | −388 | 0.5 | −341 | 4.0 | −341 | 3.0 |
| Ep, mVSHE | 50 | 100 | 100 | −170 | 50.0 | 50.0 | 50 | 50 | 50 | |||||||||
| Ef, mVSHE | 1400 | 1350 | 1350 | 1400 | 1350 | 1350 | 1340 | 1340 | 1340 | |||||||||
| i0H2, A/m2 | −0.21 | 25.7 | −0.23 | 6.9 | −0.2 | 17 | −0.21 | 18.9 | −0.16 | 9.9 | −0.15 | 5.2 | −0.16 | 42.2 | −0.12 | 21.6 | −0.11 | 10.8 |
| bH2, mVSHE | 212 | 3.3 | 185 | 2.0 | 186 | 3 | 257 | 24.0 | 177 | 3.6 | 173 | 0.4 | 289 | 18.1 | 185 | 9.4 | 178 | 2.6 |
| i0Fe, A/m2 | 0.18 | 16.3 | 0.15 | 17.4 | 0.1 | 9 | 0.2 | 23.2 | 0.1 | 5.4 | 0.1 | 1.7 | 0.2 | 0.5 | 0.08 | 59.8 | 0.12 | 11.9 |
| bFe, mVSHE | 209 | 6.3 | 178 | 5.8 | 156 | 2 | 277 | 5.7 | 184 | 2.5 | 190 | 2.5 | 404 | 0.0 | 166 | 17.4 | 195 | 4.4 |
| i0trx1011, A/m2 | 0.02 | 3.3 | 0.00001 | 29.1 | 0.0022 | 50 | 43.1 | 50 | 106.901 | 13.7 | 0.002 | 14.1 | 10.6 | 17.6 | 7.4 | 31.5 | 13.46 | 32.8 |
| btr, mVSHE | 56 | 0.2 | 41 | 1.3 | 44 | 9 | 66 | 6.5 | 69 | 0.4 | 46 | 0.7 | 63 | 1.1 | 60 | 1.3 | 61 | 1.1 |
| Ax104 | 4.4 | 5.3 | 8.9 | 31.7 | 15.0 | 15 | 3.1 | 40.6 | 20.5 | 46.4 | 12.1 | 19.1 | 0.2 | 45.2 | 31.5 | 14.9 | 18.0 | 10.0 |
| h | 1.82 | 1.3 | 1.63 | 2.5 | 1.5 | 2 | 1.9 | 9.7 | 1.5 | 5.0 | 1.58 | 2.8 | 2.5 | 9.4 | 1.4 | 0.6 | 1.51 | 2.0 |
| ip, A/m2 | 0.52 | 9.7 | 0.58 | 3.4 | 0.6 | 0.4 | 0.43 | 2.4 | 0.48 | 4.5 | 0.44 | 10.7 | 0.32 | 0.2 | 0.43 | 9.7 | 0.42 | 19.4 |
| Ecorr++, mVSHE | −550 | 3.9 | −541 | 8.2 | −537 | 4 | −538 | 5.2 | −549 | 1.8 | −551 | 2.4 | −566 | 15.5 | −541 | 17.3 | −560 | 0.0 |
| icorr, A/m2 | 0.38 | 15.1 | 0.40 | 4.3 | 0.38 | 12 | 0.31 | 12.9 | 0.31 | 4.5 | 0.32 | 2.7 | 0.28 | 12.1 | 0.21 | 0.6 | 0.24 | 9.3 |
| im, A/m2 | 3.3 | 0.3 | 5.4 | 1.4 | 6.1 | 3 | 1.4 | 0.7 | 3.9 | 4.5 | 4.0 | 2.8 | 0.72 | 2.5 | 2.42 | 2.1 | 2.7 | 0.8 |
| it, A/m2 | 2.23 | 0.89 | 3.28 | 0.93 | 3.73 | 4.18 | 0.95 | 1.67 | 2.67 | 1.48 | 2.67 | 3.62 | 0.57 | 4.04 | 1.63 | 0.99 | 1.85 | 1.48 |
| Qp, C/m2 | 364.9 | 9.7 | 405.7 | 3.4 | 430.5 | 0.4 | 300.3 | 2.5 | 334.1 | 4.1 | 310.1 | 13.7 | 227.3 | 0.2 | 298.3 | 12.0 | 293.1 | 50.0 |
All these differences are further explained in following sections.
Comparative examination of electrochemical parameters obtained using solution C
The order of magnitude of the electrochemical parameter values for the partial reactions determined by numerical method described in the Experimental section are in agreement with former reports for iron in aggressive aqueous solutions.18,24–27 The change of slope of the anodic polarization curve preceding the transition region at potential Et (Fig. 3) was reproducibly generated in all polarization tests. This was a key aspect for a successful numerical fitting of the proposed model in the transition region. Another important consideration is that the small peak between −100 and 180 mVSHE does not affect the passive and transpassive regions and therefore those data were excluded from the numerical fitting process.
Assuming that the potential corresponding to the point of zero current density in a polarization curve coincides approximately with the open circuit potential value,12 then the reliability of the predicted corrosion current density will depend of the quality of the modelled curve in the vicinity of that potential which can be referred as corrosion potential. The good quality of the fit nearby this point is an indication of the reliability of the predicted icorr values (Figs. 4 and 5).
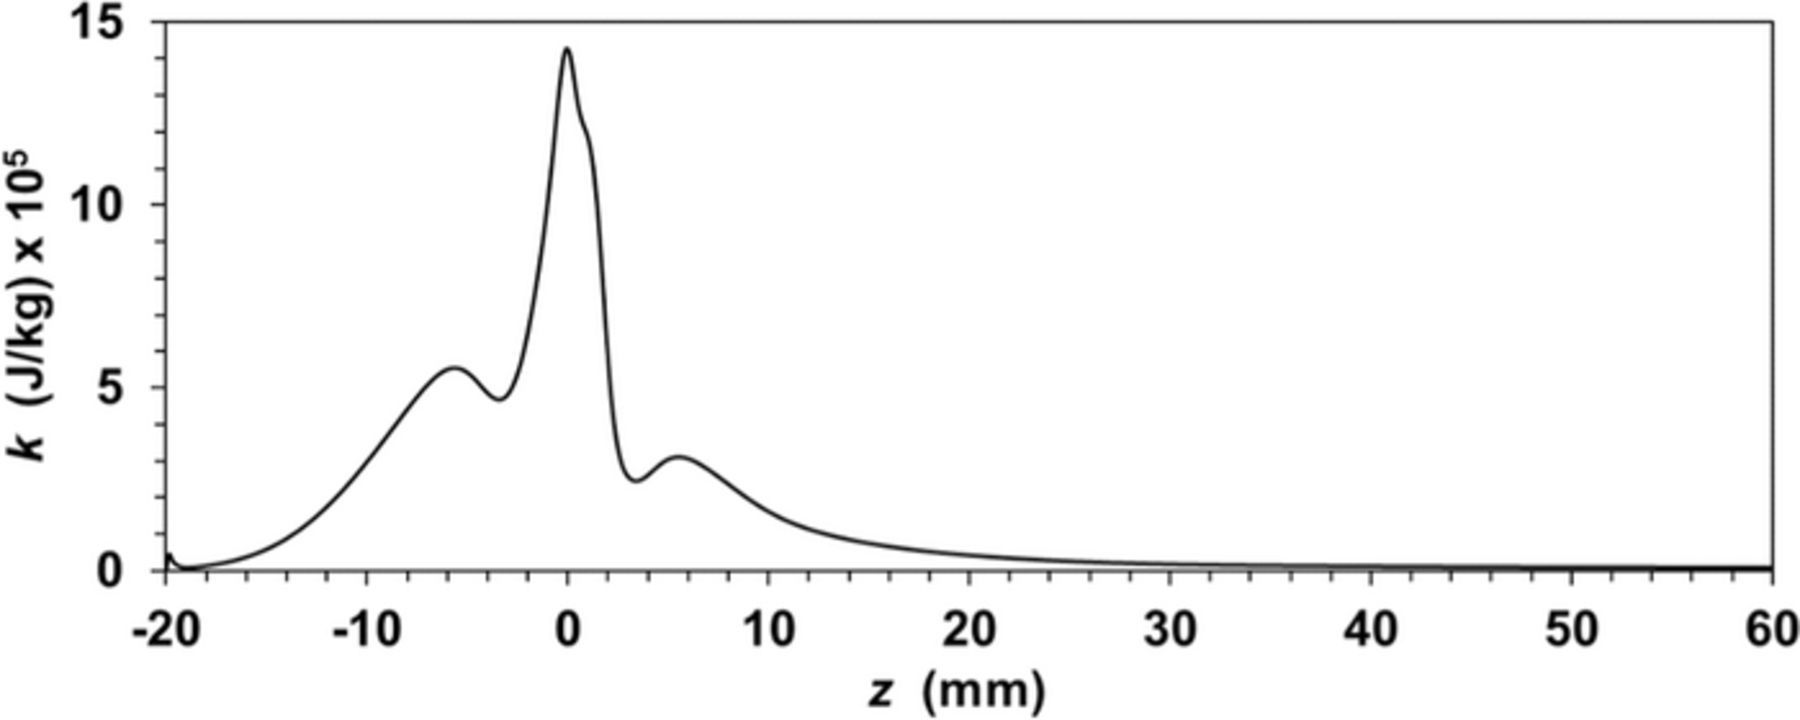
Figure A4. Turbulent kinetic energy along a central axial line in the annular fluid flow.
Despite the differences in Tafel slopes, no significant differences in icorr values are observed between flow and RDE cells. In the range of potential values lower than  estimated as −496 mVSHE, the larger
  values for RDE cells implies lower partial current density rates for hydrogen evolution. This may be attributed to larger rates of semiconducting oxide film formation on the carbon steel working electrode of the RDE in comparison with the flow cell than can either reduce prematurely the effective overpotential or change the predominant mechanism or rate determining step for the hydrogen evolution reaction. A multistep mechanism of hydrogen evolution involves the formation of an adsorbed hydrogen atom intermediate (Volmer reaction), the electrodic desorption of hydrogen into solution (Heyrovsky reaction), and/or a chemical desorption by the combination of two adatoms (Tafel reaction).28,29 It has been widely accepted that the value of
  gives an indication of the rate determining step.30 Under this criterion for the range of
  between 140–290 mV/dec the Volmer reaction would probably be the rate determining step.29 A mass transfer limitation condition is disregarded, because for the equilibrium established for the dissociation of water the water reduction reaction at neutral condition is identical to the proton reduction from the standpoint of thermodynamics. Besides, because the concentration of water molecules is high, no diffusion-limiting current should occur and very high current densities are possible.
For RDE experiments at a null rotation rate the larger  values in comparison with a rotation condition may be ascribed to a change in current distribution produced by the presence of bubbles on the WE surface.31 Bubbles attached to the electrode screen the surface and may yield a local non-uniform primary current density. From the experimental electrochemical parameters
  and
and  (see Tables I–III), the estimated hydrogen volume (at 101325 Pa) generated during a voltammetric sweep was between 1000 to 2000 L/m2. This significant gas volume should have the potential to precipitate as bubbles on the metal surface. The presence of hydrogen bubbles at potentials preceding the active region was visually confirmed in all RDE runs at a null rotation speed where a large growing volume was observed during the cathodic scan. A fraction of these bubbles remained attached to the surface even during the active zone potentials where the hydrogen release would be negligible. The shear forces originated by forced convection conditions in the RDE under rotating electrode should remove the hydrogen bubbles from the surface.
The lower bFe values for the RDE cell that, according to Eq. 2 implies higher partial iron oxidation rates in comparison to the flow cell, suggests the formation of a concentration boundary layer of ferrous species in the surface electrode of the flow cell that interacts with the hydrodynamic boundary layer. This interaction may trigger lateral diffusion of iron corrosion products that could retard the dissolution of iron in nearby sites. This is supported from experimental evidence reported by Wang et al.32 indicating that at potentials <−0.13 VSHE the presence of Fe2+(aq) in solution somewhat suppresses the dissolution of FeII, thus reducing the net rate of anodic oxidation.
As explained in the Experimental section, the transition zone starts at the Et potential value illustrated in the Fig. 3. It is hypothesized that at this point islands of filmed areas start to form on the metal surface and, as a result of this, the i − E curve gradually shows a decreasing slope. From the experimental results two interesting features are observed in this zone: a).- A low change in the im/it values observed for all experimental data (where im is the maximum value of the current density and it is the current density at Et potential value) in comparison with large variation in im. For instance the experimental range for im/it was between 1.2 and 1.5, in comparison with 6 fold change in im value, and b).- An apparent dependence of the Em potential value with Re number and borate concentration. In fact a slight Em shift in the positive direction is observed either at larger Re values (Table II) or at more concentrated borate solution (Table I). This evidence suggest that the rate of formation of filmed regions is proportional to the total current density in the unfilmed areas and that iron oxide concentration at the metal surface is an important factor that affects the film formation kinetics in the transition region.
Table II. Electrochemical parameters for carbon steel polarization curves measured in a flow cell using solution C and CE electrodes of different lengths, at Re values of 100 and 600.
| Electrode CE short | Electrode CE long | |||||||
|---|---|---|---|---|---|---|---|---|
| Re = 100 | Re = 600 | Re = 100 | Re = 600 | |||||
| Parameter | Average | Error, % | Average | Error, % | Average | Error, % | Average | Error, % |
| Ei, mVSHE | −750 | −750 | −750 | −750 | ||||
| Et++, mVSHE | −381 | 1.5 | −376 | 1.0 | −378 | 1.0 | −383 | 10.5 |
| Em++, mVSHE | −337 | 1.0 | −327 | 3.5 | −344 | 1.5 | −339 | 1.0 |
| Ep, mVSHE | −270 | −270 | −300 | −300 | ||||
| Ef, mVSHE | 1320 | 1320 | 1320 | 1320 | ||||
| i0H2, A/m2 | −0.12 | 15.2 | −0.10 | 2.3 | −0.04 | 6.8 | −0.05 | 3.6 |
| bH2, mVSHE | 147 | 3.7 | 196 | 8.1 | 147 | 2.3 | 150 | 0.7 |
| i0Fe, A/m2 | 0.08 | 35.6 | 0.06 | 9.4 | 0.10 | 3.5 | 0.07 | 5.2 |
| bFe, mVSHE | 172 | 32.7 | 181 | 0.4 | 228 | 0.0 | 192 | 1.2 |
| i0tr x1011, A/m2 | 0.03 | 40.6 | 0.91 | 19.0 | 8.4 | 49.6 | 0.10 | 46.3 |
| btr, mVSHE | 50 | 3.0 | 57 | 0.7 | 68 | 4.8 | 52 | 0.6 |
| Ax104 | 37.8 | 43.6 | 29.0 | 38.1 | 0.4 | 5.4 | 1.4 | 49.7 |
| h | 1.5 | 15.0 | 1.4 | 4.0 | 2.4 | 0.7 | 2.3 | 11.4 |
| ip, A/m2 | 0.16 | 5.1 | 0.24 | 2.7 | 0.16 | 4.0 | 0.14 | 2.5 |
| Ecorr++, mVSHE | −526 | 18.9 | −537 | 4.0 | −574 | 1.4 | −562 | 3.1 |
| icorr, A/m2 | 0.19 | 18.9 | 0.16 | 6.2 | 0.15 | 4.9 | 0.14 | 0.1 |
| im, A/m2 | 1.0 | 0.2 | 1.6 | 6.6 | 1.5 | 2.4 | 1.8 | 1.7 |
| it, A/m2 | 0.9 | 0.0 | 1.2 | 0.0 | 1.1 | 0.0 | 1.2 | 0.0 |
| Qp, C/m2 | 136.0 | 3.9 | 266.8 | 1.2 | 172.4 | 2.1 | 161.0 | 1.0 |
Diez-Perez et al.33 proposed a mechanism of ion Fe2+ dissolution and FeII hydroxide formation on the iron surface that begins at very low iron oxidation potentials followed by a nucleation when iron cation is over the saturation point at this pH, so FeII hydroxide is formed. It has been suggested that overall kinetics of the oxide precipitation may take place gradually in a framework of classical nucleation theory.34 It is reasonable to think then that the oxide precipitation kinetics is a diffusion controlled process and that can be start at equilibrium potentials for hydroxide formation (which are lower than Et) as nuclei formation with subsequent growth. Such growth, which becomes kinetically noticeable at potential Et approximately between −350 to −400 mVSHE (where the polarization curve present an inflexion point at Fig. 3), produces larger islands until a complete oxide layer is formed at the end of the transition region. Wang et al.32 provided experimental evidence for corrosion product deposits on an iron surface exposed to buffer borate pH 8.4 for 22 h: at −450 mVSHE, oxide deposits were randomly distributed, while at −250 mVSHE the surface was covered by an even compact oxide layer with a few patches of pearlite structure. These oxides will provide a large potential barrier that could reach a maximum intensity in the passive region. A requirement for the oxide evolution is that a transport of FeII through the oxide layer takes place and then oxidation of FeII to FeIII at the oxide/water interface resulting in a magnetite growing and many other reactions. The point defect model (PDM)35 provides microscopic description of the growth and dissolution of passive films, that depends at passive potentials mainly of the internal structure of the passive layer and consequently cannot explain the influence of hydrodynamic influence. Unfortunately, the PDM is limited only to the well formed passive films, and cannot be used for the initial period of passive film formation in a non-equilibrium process.36 Because of the slow kinetics for solvated to solid phase reactions, a concentration boundary layer of dissolved saturated FeII species can persist along the transition zone. This boundary layer in the active and early transition stages can be significantly altered by turbulent motion inducing higher mass transport rates of soluble FeII species and also affect the initial condition of the passive film. One experimental demonstration of the hydrodynamics effect is the significant increase of the current density in the active and transition zone observed in polarization curve of a CU electrode in comparison to that of the CE electrode at a same Re number in a flow cell. The CU electrode positioned a z = 0 mm that is exposed to an impacting fluid flow exhibits a significantly higher wall shear stress than the CE electrode positioned at z = 20 mm under a parallel laminar flow (Figs. A2, A3 of Appendix).
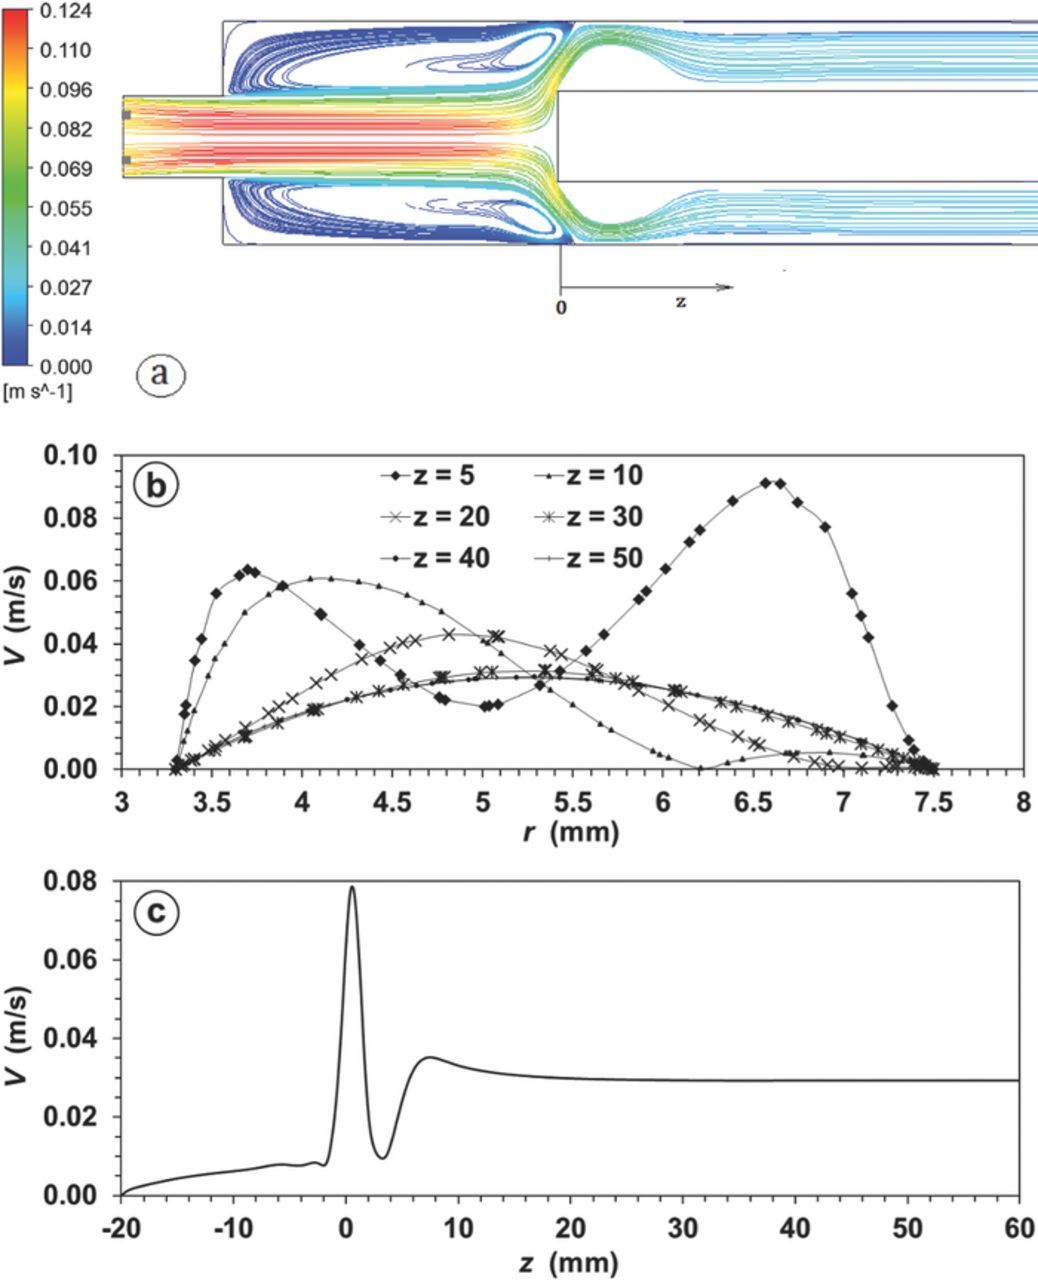
Figure A2. Velocity field simulation under laminar flow across an annular flow cell at Re = 100. a) Streamlines across a central axial plane, b) Velocity profiles along radial lines at different z values in mm, c) Velocity profile along an axial z line at r = (r2+r1)/2.
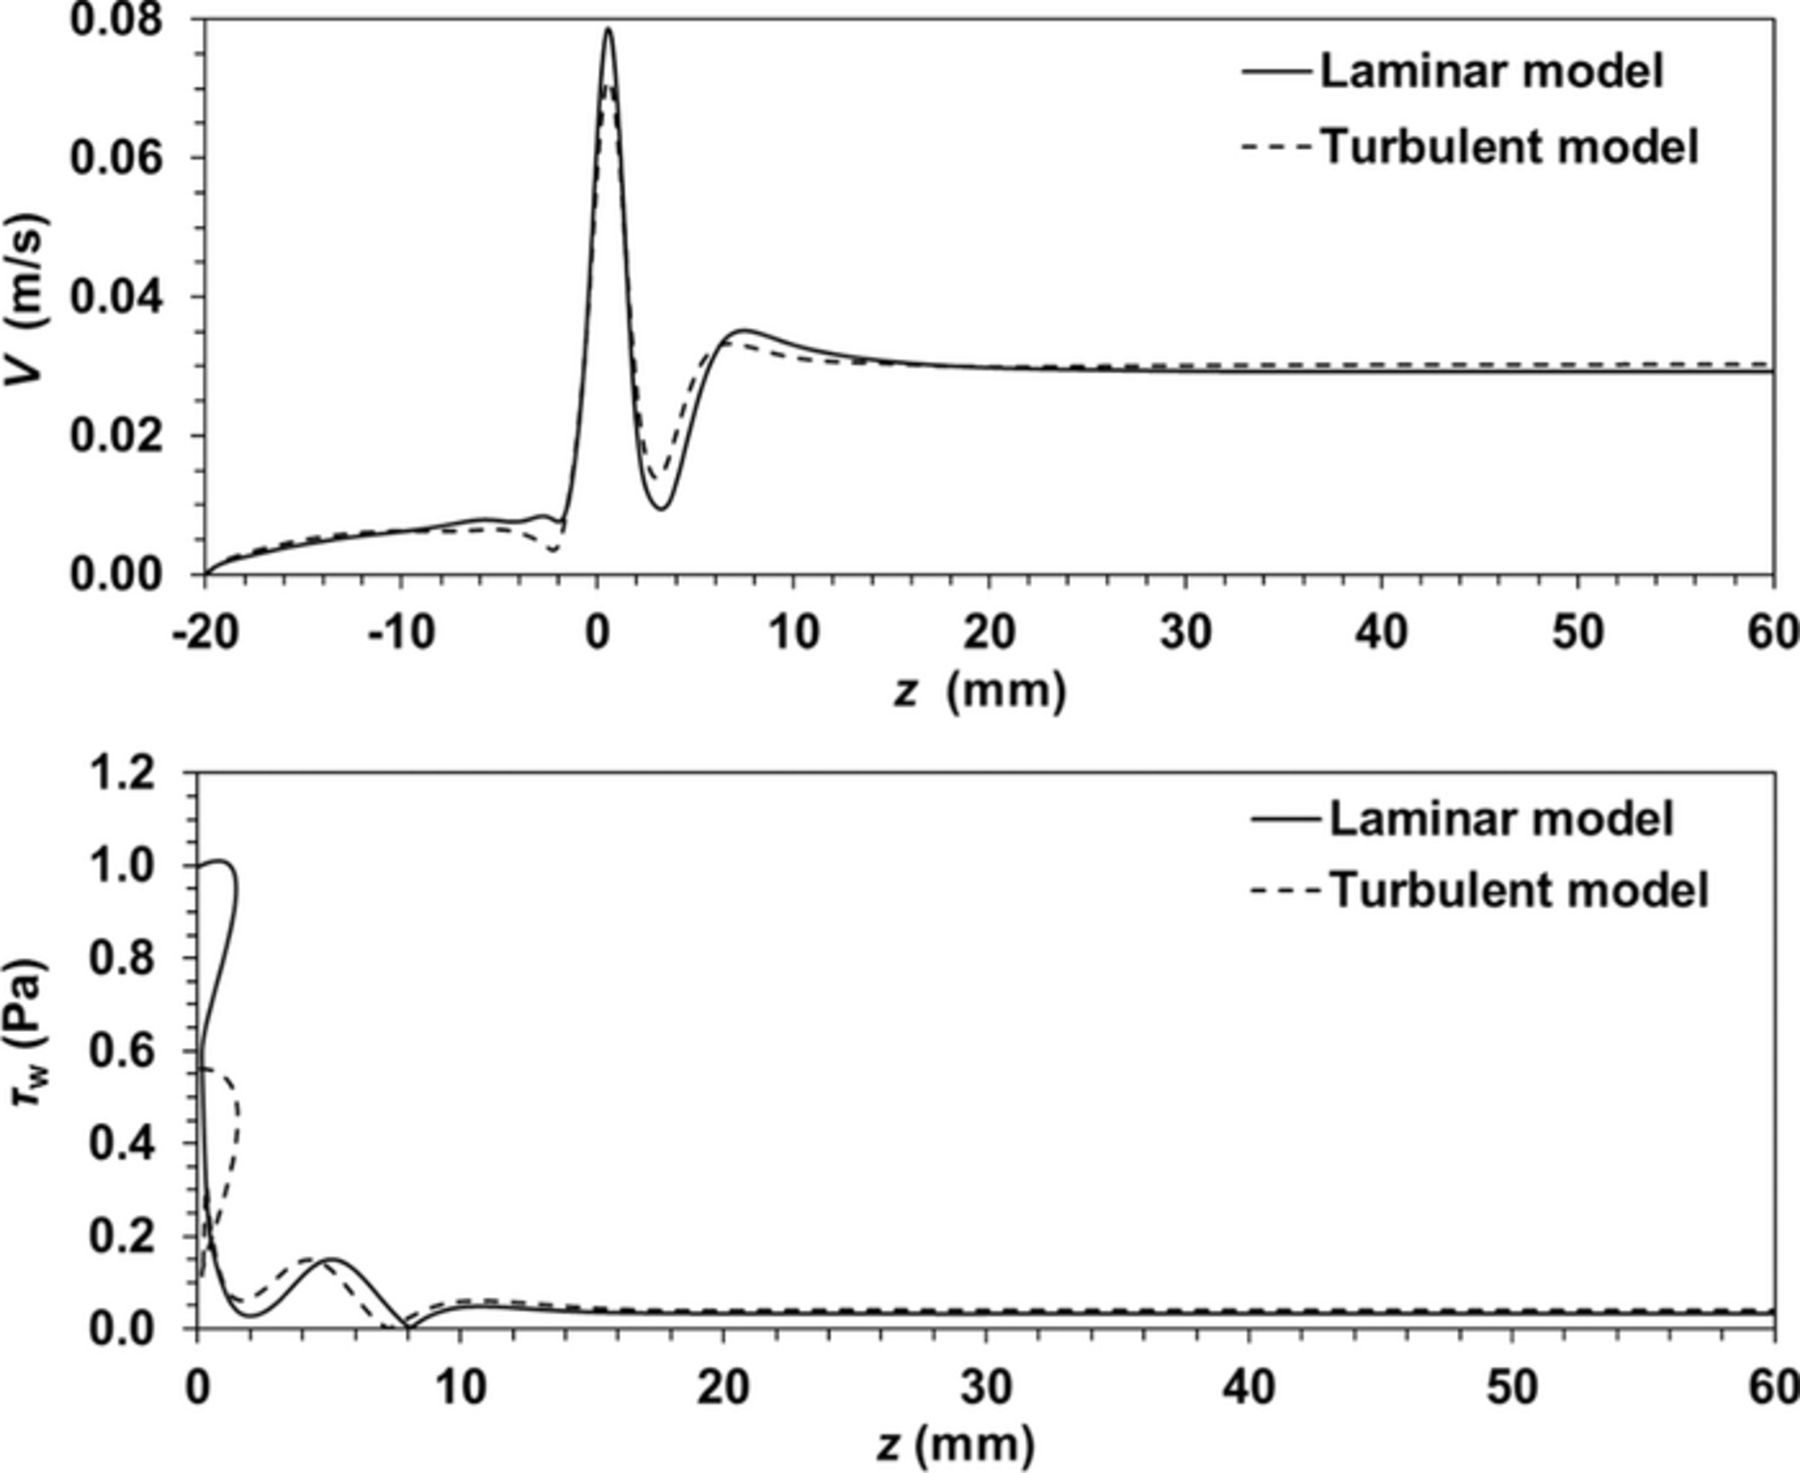
Figure A3. CFD simulation for the flow cell. Velocity along a central axial line (Up) and wall shear stress across the cylinder surface (Down).
Concerning the transpassive region, two relevant aspects are observed: a).- The range for the generated parameter values were between 1 × 10⁻¹²–1 × 10⁻⁹ A/m2 and 48–87 mV/dec for i0tr and btr, respectively. According to these values, this region can be associated with the oxygen evolution reaction,37 b).- Higher and more uneven current density values between a range of potentials of 0 and 1200 mVSHE for RDE cell in comparison with those for a flow cell. This is visually corroborated in Figs. 6 and 7 and also from the lower ip and Qp values for the flow cell (Tables I and III).

Figure 6. Experimental polarization curves in a flow cell using CE electrodes in different buffer borate solutions. ● Solution A, ■ Solution B, ▲ Solution C. Re = 100; scan rate 2 mV/s. Replicated curves are shown as dotted lines.

Figure 7. Experimental polarization curves in a RDE cell at different electrode rotation rates and buffer borate solutions. ● Solution A, ■ Solution B, ▲ Solution C. Scan rate 2 mV/s. Replicated curves are shown as dotted lines.
Polarization curve reproducibility
Reproducibility was tested by a repetition of the complete set of experiments for both RDE and flow cells.
Parameter variability was determined as the difference between two replicated values divided by the averaged value expressed as percentage. Because this definition is inadequate for potential-based parameters involving an arbitrary zero reference value, then the absolute difference for two replicated values was considered for Et and Em as variability indicator. An electrochemical parameter with a large variability can be considered as affected by a random process. Under this criterion, parameter variability for RDE cells present the largest values, in particular the i0tr with a variation up to 50%, followed in decreasing order by parameters i0Fe and A with 60 and 47%, respectively. In contrast for the flow cell, the largest parameter variability is 99% for i0tr followed by parameters bFe and i0Fe with 59 and 36%, respectively. It is very interesting to note that it and im associated with parameters Et and Em (Fig. 3) present the lowest variabilities and very well defined tendencies under all experimental conditions. For example, a).- All these parameters show consistently lower values at lower borate concentrations, b).- Potential Em measured for a CE long electrode in a flow cell is shifted to lower values with respect to that for a CE short electrode, and c).- Parameter Em measured at a null rotation rate in a RDE cell is shifted to lower values with respect to those measured at 1200 and 2500 rpm.
Concerning the passive region using the RDE cell, the lowest variability is observed for ip and Qp (Table III) under quiescent condition (0 rpm) for solution C; in this case both curves are visually superimposed. In contrast, an increasing variability with borate concentration for solution A and B is observed. It is very interesting to note that at 1200 and 2500 rpm the ip and Qp variability decreases with increasing borate concentration. This indicates a synergistic effect between rotation rate and borate concentration. At lower borate concentration the hydrous oxides would tend to form more uniformly distributed clusters because of a complex formation of boron with hydrous oxides of lower stability in comparison to those at higher borate concentration (see next section); this imply a lower reproducibility for larger cluster formation.
The influence of the borate buffer concentration
Experimental polarization curves measured in a flow cell at solutions A, B and C are shown in Fig. 6. From the family of curves there are several aspects of interest. First of all, a distinctly higher peak shifted to more positive potentials is observed for polarization curve in solution A, in comparison with peaks from solutions B and C. Additionally the CE electrodes of different lengths display significantly different peak height and passive current densities. This indicates a combined effect from the concentration of buffer solution and cylinder length.
The role of borate as an inhibitor for steel has been previously reported.38,39 Evidence from few studies found in the literature indicates that the chemical composition of the passive films does not depend on the concentration of borate solution.40 Guo et al.41 proposed that the influence of solution concentration is due to a decrease of the thickness of the diffusion layer on the metal/solution interface with increasing ion concentration. This will have a strong influence on ion mobility and particularly iron ions in the interfacial region where a Coulombic potential gradient exists. Assuming that the Fe2+ solubility chemical equilibrium (Eq. 10) is the governing step in the passive film formation, then a shift toward more positive potentials for the transition peak at higher boron concentration is unlikely to occur.42
![Equation ([10])](https://content.cld.iop.org/journals/1945-7111/163/5/C171/revision1/d0013.gif)
An increase in the transition peak height is obtained when EDTA is added to a borate solution pH 8.4, but contrary to what happen in borate solution A the peak shift is toward negative potentials.42 In this case, EDTA forms a complex with ferrous iron accelerating the iron oxidation rate while oxide precipitation rate would be remaining unaltered.
A possibility to explain this potential shift could be ascribed to a synergistic effect between larger ion mobility with boron speciation and interaction with iron oxides at different concentrations. Boric acid and borate both typically exist as monomers in solution at concentrations below 25 mmol/L, but at higher concentrations many poly-borate polymers are known to form.43 As a consequence of this behavior, differing interactions between iron oxides and boron species may take place. Theoretical and experimental research has concluded an optimum pH in the range pH 8 to 9 for maximum boron adsorption on iron oxides.44,45 Recent investigations have shown that trigonal (boric acid) and tetrahedral (borate) boron are complexed on hydrous ferric oxides surfaces with differing strengths, explaining why boric acid is more likely to leach downward in soils in response to water flow than more strongly bound boron complexes.43,44 Additionally, borate species were shown to cause a decrease of the isoelectric point of oxide particles attributed to the sorption of borate as a negative complex MOB(OH)3−.46 K = 0.62 has been reported for complexation reaction represented as:47
![Equation ([11])](https://content.cld.iop.org/journals/1945-7111/163/5/C171/revision1/d0014.gif)
If boron species in solution A are more strongly adsorbed to freshly formed iron oxides together with higher ion mobility compared to solutions B and C, then iron oxide particles would have more chance to group together to form oxide patches leaving behind exposed metal areas for corrosion. At one point this will increase the passivation rate. This is in agreement with the higher current density for hydrogen evolution and iron oxidation, a higher peak current density (im) and a peak shift to a more positive potential in the transition zone observed for carbon steel in solution A (Table I).
The higher current density observed at higher borate concentration in the passive region under anaerobic conditions could also be interpreted in terms of the passivation reaction proposed by Tyfield38 that is associated with the major anodic peak:
![Equation ([12])](https://content.cld.iop.org/journals/1945-7111/163/5/C171/revision1/d0015.gif)
where L represents hydroxide or borate anions.
Scharifker et al.48 confirmed the fundamental role of boron in stabilizing the passive film in these solutions. However, a recent experimental finding49 that indicates that very low boron concentration is present in passive film formed in borate buffer contradicts the reaction mechanism (Eq. 12), unless the adsorbed boron species on the surface is a temporal instance of many reactions.
Considerations about oxide film formation
Within the large amount of the published information concerning the passivity of iron, there are many aspects that can be used as arguments to explain the experimental hydrodynamic influence on the potentiodynamic behavior of carbon steel in borate solutions discussed in the prior sections. Perhaps the main aspect is the extent of ferrous iron release and its subsequent precipitation that change with increasing potentials. In this context a brief discussion about the evolution of the passive film at increasing potentials is presented.
It is generally agreed that in the active region the iron oxidation and hydrogen evolution partial reactions takes place at anodic and cathodic sites respectively with specific mechanisms and also the initial product of the iron + water reaction is (FeOH)ads.50–52 Throughout the active transition and pre-passive ranges it is supposed that (FeOH)ads+ dissolves from the surface and that in the transition range Fe(OH)2ads, forms and slows the dissolution of (FeOH) ads+. The presence of ferrous ions at the initial stage of potentiostatic passivation of iron was experimentally confirmed from ring-disk studies of iron in borate buffer pH 8.4 and 9.2.53,54 The subsequent step is the evolution of the hydrated iron ad-ions into a condensed phase of iron oxide layer. Unlike passive film formed in phosphate buffer solution where a substantial amount of phosphate compounds are present in the film, the film formed in borate buffer mainly consists of iron oxide.55 This suggests that borate does not directly participate in the initial steps of the passive layer formation. The fact that the ranges of corrosion kinetic parameter values for carbon steel in different aqueous solutions (for example NaCl20) are quite similar to those in borate solutions is another indication that the role of borate is mainly restricted as a complexing agent with iron oxides mentioned in the previous section of the borate buffer concentration influence.
The oxide phase transformation should occur at a certain potential when the interaction or bridge-formation energy between neighboring metal hydroxide ad-ions is greater than a threshold value.2 Potential Et ranging between −400 to −350 mVSHE and illustrated in Fig. 3, could be considered as the initial condition for the passive film formation, where an Fe2+-hydrous Fe(OH)2 layer may commence as patched (or filmed) areas that increase with time. In this regard a previous investigation on iron passivity in borate buffer pH 8.4 in the range of −550 to 700 mVSHE suggested that the initiation of oxide formation starts in the form of patches or clusters which fuse together with time forming a smooth layer on the metal surface;56 this suggestion was further confirmed from a direct evidence of oxide nucleation initiation at lower potentials around −600 mVSHE.42
In the above described process an array of reactions have been depicted and experimentally confirmed in many publications.42,57,58 Initial reactions for pH 8.4 are Fe2+ hydrolysis to produce a set of thermodynamically feasible FeII species, such as FeOH+, Fe(OH)3−, Fe(OH)42− and Fe(OH)2. Some of these reactions and equilibrium relations at pH 8.4 are:57
![Equation ([13])](https://content.cld.iop.org/journals/1945-7111/163/5/C171/revision1/d0016.gif)
![Equation ([14])](https://content.cld.iop.org/journals/1945-7111/163/5/C171/revision1/d0017.gif)
![Equation ([15])](https://content.cld.iop.org/journals/1945-7111/163/5/C171/revision1/d0018.gif)
Also the mixed FeII/FeIII oxide (magnetite) and FeIII species such as Fe3+, FeOH2+, Fe(OH)2+, Fe(OH)4−, and Fe(OH)3 are formed from electrochemical conversion of Fe(OH)2 or iron intermediates at the metal iron interphase. At the magnetite/water interface many hydrated ferric and ferrous species will be in acid base equilibrium and the charged species will quickly dissolve into the aqueous phase. The hydroxides γ-FeOOH and α-FeOOH can be formed through electrochemical conversion from iron hydroxides. In general FeIII are much less soluble than FeII species.
Nucleation of Fe(OH)2 on the bare iron surface, and the passive Fe3O4/Fe2O3 layer, formed on the top of the first one, were also confirmed using an in situ gravimetry method at 250 mVSHE.59
The Fe2+-hydrous Fe(OH)2 generated during the active-passive transition, can be oxidized and deposited as FeOOH or Fe(OH)3, which at higher potentials is transformed to γ-FeOOH (small peak between 0 and 180 mVSHE approximately). Sato et al.60 suggested a passive iron structure formed by two oxide layers, an outer hydrated and an inner anhydrous. It was demonstrated that the outer layer can be completely suppressed under a formation method consisting of galvanostatic cathodic reduction followed by a subsequent oxidation at 0.4 mVSHE; this implies that the thickness of the outer layer depends of the formation method. Later investigations about passive iron in borate buffer solutions found a structure formed by a bilayer film with an inner layer similar to Fe3O4 and/or γ-Fe2O3 and an outer layer of FeIII oxide/hydroxide whose structure is not yet known.7,8 Also the inner layer seems to have much higher conductivity and charge carrier density and therefore the outer layer would be largely responsible for the passive film's impedance.11 From the above considerations an outer hydrated layer will necessarily be present under the voltammetric scan of the present investigation.
The evolution of an iron passive film in a borate buffer solution (pH 8.4) that was studied using voltammetric and impedance techniques under specific conditions by Toledo61 suggest that the kinetic mechanism is a combination of charge transfer at interfaces, diffusion of point defects through the film and diffusion related to transfer of electroactive species in the electrolyte.
All this evidence indicates that iron oxidation and oxide film formation is a sequential continuous process that is initiated at potentials lower than Et and evolves at specific sites and propagates toward free metal sites while there is a global decrease of the amount of FeII species at increasing potentials. Thus, the true meaning of potential Et has to do with the time when iron oxidation kinetics becomes a surface limited process, or in other words when no more free (or unfilmed) sites for iron oxidation are available.
Additionally, because of the convective conditions, the outer hydrous oxide layer could evolve to the formation of a concentration boundary layer of iron oxidation products. Thus, the interaction of this layer with the convective boundary layer could induce a concentration increase of Fe+2 species in the flow direction with a subsequent change in the local EeqFe value that in turn affects the iron oxidation rate (Eq. 2). This effect, which is more evident around the small peak between −200 to 400 mVSHE, could be a manifestation of the significant differences observed between current density for short and long CE electrodes at any borate solutions (Fig. 6). In the transition region this effect is more pronounced in solution A and B, while for solution C this is unclear. This suggests that the early stage of the oxide nucleation process of filmed areas may be strongly affected as a result of boron-iron oxides interactions.
The lower values of partial iron oxidation rates observed for a long CE in comparison to a short electrode is only observed in solution A (see Table I). In solution B and C no significant effect is observed. This evidence suggests that only at certain degree of boron-iron oxide interactions (Solution A) the lateral diffusion of Fe2+ ions is significant enough to accelerate passive film formation in nearby sites and/or decrease anodic oxidation rates. In previous investigations32,50 concerning the effect of the presence of dissolved ferrous ion on the surface oxide film growth in carbon steel exposed to pH 8.4 borate solution (prepared using 0.01 mol/L sodium borate solution and pH adjustment with a 0.5 mol/L boric acid solution), it was concluded that at potentials lower than −0.2 VSHE the presence of Fe2+(aq) in solution somewhat suppresses the dissolution of FeII, thus reducing the net rate of anodic oxidation.
Referring to the hydrodynamic flow characterization over each WE surface described in the Appendix, significant differences in flow velocity and shear stress across the specimen surface between the RDE and flow cell are observed. That is, while the fluid velocity and wall shear stress values are nearly constant across the flow cell surface, a significant radial influence is for the RDE cell. For example, a constant wall shear stress of approximately 0.033 Pa (see Fig. A3) for the WE surface type C (see Fig. 2), in comparison with a linear increase from 0 to 2.2 Pa (Eq. A9) from the center to the external radius of the WE disk in the RDE cell.
Influence of rotation speed on the RDE polarization curve
A series of polarization curves and their corresponding electrochemical parameters for RDE electrodes at 3 rotation rates of 0, 1200 and 2500 rpm in buffer solutions A, B and C are shown in Fig. 7 and Table III, respectively. As can be observed in Fig. 7 and Table III at a null rotation speed, both partial reaction rates and Qp exhibited lowest values. In this case the electrode surface facing downward remained covered with visible bubbles during the voltammetric scan. This is an unexpected result because hydrogen is known to exacerbate the corrosion rate of iron, decrease the stability of passive films, and promote localized corrosion.62 In this regard it can be assumed that large bubbles that remain trapped on the metal surface (facing downward) significantly reduce the metal electrolyte contact with a subsequent decrease of the total current. These attached bubbles would be radially dispersed by the action of shear forces originated from the electrode rotation.
According to the Eq. A9 the wall shear stress (τw) at the disk surface of the RDE electrode exponentially increase with a power of 1.5 with respect to its angular rotation speed combined with a radial profile from a null value at the center up to a maximum in the outer radius of the disk specimen. The effect of the wall shear rate on the surface kinetic process will depend on the type of predominant electrochemical reaction. At negative potentials, where hydrogen evolution and a subsequent dispersion to the bulk electrolyte take place, the bubble formation process is affected by the hydrodynamic conditions. In general, with increasing wall shear stress values across the working electrode surface, the hydrogen bubbles, once formed, will tend to be smaller in size and remain attached to the surface for a shorter time (thus decreasing the local hydrogen concentration).63 Another effect of bubble formation would be an increase of the electrical resistance of the solution with a subsequent negative potential shift of the hydrogen evolution polarization curve section at lower rotation speed of the RDE electrode. This potential shift is confirmed in all Et and Em values at null rotation rate experiments (Table III).
As can be observed in Fig. 7 and Table III, the effect of the RDE rotation speed from 1200 to 2500 rpm on the kinetics of hydrogen evolution at different buffer borate concentrations is not significant. This can be interpreted as a combination of two effects: a).- A low hydrogen gas concentration at the surface to sustain the formation of large bubble size distribution as a result of a fast bubble removal by convection. In a previous investigation64 hydrogen bubbles were detected in an electrolytic cell under current density values between 1 to 30 A/m2 which are in the range of the measured values of the present research. Thus the absence of large hydrogen bubbles on the metal surface can be associated with the fact that under the hydrodynamics condition of the RDE they are efficiently dispersed into the bulk solution. Therefore under a condition of absence of bubbles no significant change is expected to take place in the kinetics of hydrogen evolution as a result of a further increase in RDE rotation. b).- A well-defined rate limiting step for the hydrogen evolution reaction. The cathodic Tafel slope values (Table III) are between 160 and 200 mV/dec, which are very close to the reported value of 150 mV/dec in acidic solutions.20
Influence of the hydrodynamic regime in the flow cell polarization curve
As shown in Figs. A2 and A3, the CE and CU electrodes are exposed to significantly different velocity and shear stress profiles (Appendix). While the CE long electrode is exposed to a nearly laminar steady profile (z > 20 mm), large velocity variations with recirculation flow are present for the CU electrode (0 < z < 10 mm). The sharp rise of the cathodic CU curve (Fig. 8) in comparison with the CE curve is a result of a faster kinetic reaction, mainly for iron oxidation, which is corroborated by the corresponding set of kinetic parameters i0Fe and bFe shown in Table IV. This situation, which takes place despite the fact that the CE curve has the highest current at low potential, is similar to the situation observed between the RDE and the flow cell described in prior section (Comparative examination of electrochemical parameters obtained using solution C). Thus, an interesting general observation for a situation under high fluid turbulence in comparison with a situation under low fluid turbulence, is a combination of a larger current density for iron oxidation with lower current density for hydrogen evolution, for the first case. This can be attributed to larger amount of oxides produced at high fluid turbulence that can either reduce prematurely the effective over potential for hydrogen evolution or change the edominant mechanism or rate determining step for the hydrogen evolution reaction.

Figure 8. Experimental and polarization curves for flow cell CE and CU electrodes in solution C; scan rate 2 mV/s.
Table IV. Electrochemical parameters for carbon steel polarization curves measured in a flow cell using solution C and electrodes CE and CU.
| Electrode (Re) | ||||||
|---|---|---|---|---|---|---|
| CE long (100) | CU (100) | CU (600) | ||||
| Parameter | Average | Error, % | Average | Error, % | Average | Error, % |
| Ei, mVSHE | −750 | −750 | −750 | |||
| Et++, mVSHE | −378 | 0.0 | −395 | 0.0 | −378 | 0.0 |
| Em++, mVSHE | −344 | 1.0 | −347 | 3.5 | −336 | 3.5 |
| Ep, mVSHE | −300 | −300 | −300 | |||
| Ef, mVSHE | 1320 | 1320 | 1320 | |||
| i0H2, A/m2 | −0.04 | 6.8 | −0.04 | 15.7 | −0.06 | 15.5 |
| bH2, mVSHE | 147 | 2.3 | 169 | 7.4 | 164 | 0.4 |
| i0Fe, A/m2 | 0.10 | 3.5 | 0.14 | 5.9 | 0.14 | 11.1 |
| bFe, mVSHE | 228 | 0.0 | 237 | 4.4 | 211 | 0.0 |
| i0tr x1011, A/m2 | 8.44 | 49.6 | 11945.8 | 232.7 | 2855.3 | 5.6 |
| btr, mVSHE | 68 | 4.8 | 87 | 4.5 | 80 | 0.5 |
| Ax104 | 0.4 | 4.9 | 7.1 | 25.0 | 3.8 | 1.7 |
| h | 2.4 | 0.7 | 1.7 | 4.0 | 1.9 | 0.3 |
| ip, A/m2 | 0.16 | 4.4 | 0.21 | 1.8 | 0.21 | 0.0 |
| Ecorr++, mVSHE | −574 | 1.4 | −593 | 0.2 | −584 | 0.0 |
| icorr, A/m2 | 0.15 | 4.9 | 0.17 | 6.3 | 0.21 | 13.0 |
| im, A/m2 | 1.5 | 2.4 | 1.5 | 4.7 | 2.5 | 7.3 |
| it, A/m2 | 1.1 | 0.4 | 1.4 | 3.1 | 1.6 | 1.1 |
| Qp, C/m2 | 172.4 | 2.1 | 220.7 | 4.0 | 208.6 | 0.7 |
Conclusions
A superposition model was applied to a linear voltammetric measurements of carbon steel AISI 1020 in different concentrations of borate buffer solutions at pH 8.4, using two electrochemical three-electrode cells, a batch cell with a RDE electrode and a flow cell with an annular band electrode. While the flow regime through the metal surface in the flow cell is approximately laminar and homogeneous, the flow through the RDE electrode presents a significant radial dependence.
The observed evidence indicates that the partial reactions of hydrogen evolution and iron oxidation are affected by both, the hydrodynamic conditions and the concentration of borate buffer solution. Starting from the potential limit Et, the transition zone kinetic model, which is based on a competition mechanism between growing passive oxide islands with diminishing active zone areas, exhibits a good fit to experimental data. Because of significant interactions between iron oxide and borate ions, this zone is more affected by borate concentration than by hydrodynamic conditions. In the passive region the experimental evidence suggests that the passive film is affected by non-uniform shear stress and borate concentration through specific effects in the early stage of oxide passive layer formation. All experimental runs with RDE and flow cells suggest that the transport of soluble ferrous is the key factor that affects the potentiodynamic behavior of carbon steel in borate buffer solutions. Supporting bibliographical facts with experimental interpretation are presented to justify forced convection diffusion of soluble FeII species.
Acknowledgments
This research was supported by FONDECYT project 1090733 and CICITEM, Centro de Investigación Científico y Tecnológico para la Minería. We thank our colleague Ricardo Marquez from the Departamento de Ingeniería Eléctrica of Universidad de Antofagasta who provided insight and expertise that greatly assisted this research.
: Appendix
Appendix. Hydrodynamic flow characterization around the RDE and annular cell
The Navier-Stokes system of equations for both the RDE and annular cell can be simplified to a set of two-dimensional equations under the assumptions of steady-state, axial symmetry, and incompressible Newtonian fluid.
Continuity equation
![Equation ([A1])](https://content.cld.iop.org/journals/1945-7111/163/5/C171/revision1/d0019.gif)
r component
![Equation ([A2])](https://content.cld.iop.org/journals/1945-7111/163/5/C171/revision1/d0020.gif)
θ component
![Equation ([A3])](https://content.cld.iop.org/journals/1945-7111/163/5/C171/revision1/d0021.gif)
z component
![Equation ([A4])](https://content.cld.iop.org/journals/1945-7111/163/5/C171/revision1/d0022.gif)
where, vr, vz, vθ are the radial, axial and angular velocity components, respectively, p is the pressure, ρ is the density of the fluid, and μ is the viscosity of the fluid.
Rotating disk electrode:
For a rotating disk electrode a treatment by von Karman and Cochran65 yielded values of the velocities in the form of infinite series considering at the disk surface (z = 0 m), vz = 0, vr = 0, and vθ = rw. The solution near the electrode is:
![Equation ([A5])](https://content.cld.iop.org/journals/1945-7111/163/5/C171/revision1/d0023.gif)
![Equation ([A6])](https://content.cld.iop.org/journals/1945-7111/163/5/C171/revision1/d0024.gif)
![Equation ([A7])](https://content.cld.iop.org/journals/1945-7111/163/5/C171/revision1/d0025.gif)
where, w is the angular velocity in rad/s, ε = z(ω/ϑ)0.5, ϑ is the kinematic viscosity, a = 0.51 and b = −0.62.21
From the stress tensor terms, τrθ = τθr = 0, τrz = τzr and τθz = τzθ, the wall shear stress (τw) at the disk surface is:
![Equation ([A8])](https://content.cld.iop.org/journals/1945-7111/163/5/C171/revision1/d0026.gif)
with,  and
and  , respectively.66
Inserting ρ and ϑ values as 1000 kg/m3 and 1.004 × 10⁻⁶ m2/s in Eqs. A5 to A7, the Eq. A8 can be expressed as:
![Equation ([A9])](https://content.cld.iop.org/journals/1945-7111/163/5/C171/revision1/d0027.gif)
Recent investigations67,68 has shown that the series expansion solution above described agrees with numerical solution for the 2D model in a finite geometry when the rotating speed is 900 rpm or higher, or a more general restrictive condition ε > 1
Annular flow cell:
The fluid flow geometry through the annular cell illustrated in Fig. A1, has a symmetry condition, vθ = 0, which imply that Eq. A3 becomes null. Complementary assumptions are a non-slip condition that applies to all internal boundaries, and constant pressure drop along z axis with negligible ∂p/∂r values.

Figure A1. Schematic domains for solving Navier-Stokes equations for RDE (Left) and flow cell electrodes (Right).
Recent experimental observations69,70 demonstrated that a transition from laminar to turbulent in an annular duct occurs in the Reynolds number range from 800 to 3000. The higher limiting Reynolds values correspond to narrow annular ducts as is the case of the present flow cell. In order to assess the significance of a possible turbulence in the entrance of the flow cell the laminar model simulation was compared with that obtained from the viscous Reynolds stress turbulent model at the same inflow conditions. In this model, the turbulence is characterized in terms of the turbulent kinetic energy k (m2/s2), the turbulence eddy dissipation ε (m2/s3) and a number of predetermined parameters. The underlying conceptual framework for the turbulent model and its equation and variables are described in detail elsewhere.71
The numerical simulation for uncompressible flow through the flow cell was achieved by using the commercial Computational Fluid Dynamic software Ansys Fluent. Given the axial symmetry of this problem, the geometry for modeling was an axial plane passing through the annular axis. For this geometry a mesh system consisting of 318216 nodes with 315387 elements was built. In the general section of the solution module the following options were selected: a pressure-based solver, absolute velocity formulation, steady axisymmetric solution, and a gravitational acceleration value of −9.8 m/s2 along the z-axis. The boundary conditions were a mass flow inlet of 0.0027778 kg/s with a normal to boundary direction, stationary walls and a non-slip condition. For this set of conditions a laminar and a turbulent Reynolds Stress model were considered.
For the laminar model the selected solution method was a Simplec scheme with default spatial discretization option. The laminar flow field along a central axial plane is illustrated in Fig. A2. In the entrance region delimited between −10 < z < 10 mm, the swirl formation is rapidly attenuated as the fluid enters the annular space (see Fig. A2a). Inside the annular duct the flow recirculation is restricted to positions between 0 < z < 10 mm (see Fig. A2b) as is evidenced by a local minimum in the absolute velocity profiles along of radial lines at different z values. At larger z values the flow velocity profiles converge toward the analytical solution of Eq. A4 under a condition, vr = 0, termed as fully developed laminar flow regime defined as:66
![Equation ([A10])](https://content.cld.iop.org/journals/1945-7111/163/5/C171/revision1/d0028.gif)
where:
![Equation ([A11])](https://content.cld.iop.org/journals/1945-7111/163/5/C171/revision1/d0029.gif)
![Equation ([A12])](https://content.cld.iop.org/journals/1945-7111/163/5/C171/revision1/d0030.gif)
where, G is the volumetric flow rate through the flow cell.
Similarly, τw at the entrance region converge toward a constant value equivalent to:
![Equation ([A13])](https://content.cld.iop.org/journals/1945-7111/163/5/C171/revision1/d0031.gif)
The vz, max and  values calculated from Eq. A10 and Eq. A13 are 0.0294 m/s and 0.033 Pa, respectively. These values match with those obtained from Fig. A2 and Fig. A3 3at z larger than 10 mm.
A numerical simulation using the turbulent Reynolds Stress model were used with the default parameters, Cmu = 0.09, C1-Epsilon = 1.44, C2-Epsilon = 1.92, C1-PS = 1.8, C2-PS = 0.6, C1'-PS = 0.5, C2'PS = 0.3, TKE Prandtl Number = 1, and TDR Prandtl Number = 1.3, with linear pressure strain for the Reynolds stress model. This model produced almost identical velocity field and wall shear stress at the cylindrical electrode (see Fig. A3).
Also the kinetic energy axial profile (see Fig. A4) shows that turbulence produced at the entrance is rapidly attenuated up to negligible small values. In conclusion all the evidence above indicated suggests that the flow regime at z-coordinate larger than 20 mm can be considered as fully developed laminar flow.