Abstract
The non-isothermal, two-phase membrane electrodes assembly numerical model previously developed in Part I [J. Electrochem. Soc., 164, 6, F530 (2017)] is validated by comparing to experimentally measured electrochemical performance data under various operating conditions. Water accumulation in catalyst layer (CL) and gas diffusion layer (GDL) are also compared to the neutron and X-ray imaging data and shown to be in agreement. Water fluxes at cathode and anode boundaries and phase change induced flow are analyzed and compared to experimental data. Simulation results indicate that when liquid water is present, reactant transport in the catalyst layer is the key factor limiting fuel cell performance. The model shows that at high relative humidity, 80°C is the optimal operating temperature in order to delay water accumulation without degrading performance due to oxygen dilution by water vapor. The impact of CL and GDL hydrophilic volume fraction, hydrophobic contact angle and pore size distribution on performance are also studied. Results suggest that when liquid water is present, GDL parameters have minimal effect on performance and a CL should have a large hydrophobic contact angle, a low hydrophilic volume fraction, and large pore radius.
Export citation and abstract BibTeX RIS

This is an open access article distributed under the terms of the Creative Commons Attribution 4.0 License (CC BY, http://creativecommons.org/licenses/by/4.0/), which permits unrestricted reuse of the work in any medium, provided the original work is properly cited.
Improving water management in polymer electrolyte fuel cell (PEFCs) is critical to achieving higher efficiency and power density, which are crucial for increasing range and reducing stack size, cost and weight in automobile applications. In order to understand water transport in PEFCs, develop improved water and heat management strategies, and design advanced gas diffusion layer (GDL), micro-porous layer (MPL) and catalyst layer (CL) micro-structures, advanced numerical models are required both at the macro-2 and micro-scales.3
Several two-phase, non-isothermal membrane electrode assembly (MEA) models have been developed over the past decades.4–8 A promising approach to include micro-structural details in MEA models has been the recent development of pore size distribution (PSD) based mathematical models for analyzing two-phase flow in porous electrodes models.1,9–12 In all previous work however, the PSD model was either not integrated in a complete membrane electrode assembly (MEA) model9,11,12 or was integrated only in a one-dimensional model.10,13 As a result, detailed validation of the numerical models has seldom been performed, and it has been mainly based on its capability to reproduce polarization curves4,6,10 A two-dimensional model is required in order to study the validity of the water distribution in channel and land regions.
In Reference 1, the authors introduced a mixed wettability pore size distribution based mathematical model for analyzing two-phase flow in porous electrodes. The pore size distribution and membrane electrode assembly models were validated by comparison to experimental polarization curves from literature data. The model however was not validated in terms of its ability to accurately estimate cell performance and cell resistance under both hot/dry and cold/wet conditions, two-dimensional water distributions, and liquid and water vapor fluxes. The goal of this article is to further validate and analyze the results of the developed model for varying operating conditions, and GDL and CL structures.
The MPL can significantly improve the performance of a fuel cell and therefore its role should also be studied in detail. The exact physical process by which the MPL improves performance is still under debate, e.g., Weber and Newman14 attributed the improved performance to increased back-diffusion from cathode to anode once the MPL is introduced; Thomas et al.15 showed that by inserting an MPL between CL and GDL, the temperature in the electrodes increased by at least 1°C at high current density which results in a higher evaporation; the numerical model implemented by Pasaogullari and Wang16 suggested that the MPL alleviates the liquid water accumulation in the CL due to its small pore size. The present model is likely to be able to improve our understanding of the MPL. However, in order to reduce number of parameters and sources of uncertainty during validation, the authors have decided to focus on fuel cell operation without MPLs. Future work will use the present model to study the role of the MPL.
In this paper, the model in Reference 1 is used to study hot and dry, hot and wet, and cold and wet conditions. Results show that under dry conditions the model is equivalent to a single phase model and all water leaves the MEA in vapor form. Under wet conditions, the model is capable of predicting the regions of water accumulation which has been observed experimentally by many researchers.17–20 Model validation is performed by comparing the model predictions to experimental polarization curves and membrane resistance values for different GDLs operating at various conditions in our laboratory. The numerically predicted water distributions are compared with neutron and X-ray radiography data in the literature.19,20
This article is organized as follows. The Experimental section outlines the methods used for fabrication of catalyst coated membranes (CCMs), and the fuel cell hardware and testing configurations under various operating conditions. The results of the two-phase model are then compared to experimental data and single-phase model predictions under hot and dry, hot and wet, and cold and wet conditions in Results and discussion section. Water fluxes as well as the amount of water evaporated and condensed in the MEA are reported to analyze the water management in the fuel cell. Lastly, the parametric studies on CL and GDL hydrophobic contact angle, hydrophilic volume fraction and pore radius are performed by utilizing the model to highlight possible opportunities for improved structural design of porous media.
Experimental
Fuel cell fabrication and testing
CCMs were prepared in-house using the doctor blade method. The catalyst ink was prepared with  Pt on carbon (Tanaka, TEC10EA50E), and equal amounts of propylene glycol (PG) (Sigma Aldrich) and cooled isopropyl alcohol (IPA) (Sigma Aldrich) by weight. After bath sonicating the ink for 30 minutes at 30°C, Nafion solution (Ion Power LQ1105 1100EW
  ) was added in order to achieve a Nafion loading of 30{wt. Sonication continued for another 30 minutes, followed by probe sonication for 15 minutes, and bath sonication for a final 30 minutes.
The ink was deposited on a PTFE substrate using a pipette. A doctor blade at a height of 6 mil was then drawn across the substrate at approximately 25.4 mm/s using an automatic film applicator (BYK Gardner 2121). Once the layer was dry, it was decal-transferred onto a NRE-211 membrane by applying a temperature of 120°C and a pressure of 1.92 MPa for 5 minutes. Platinum loading was determined by weighing the Teflon sheet before and after decaling.
All tests were performed with a Scribner 850e test station with the conditions listed in Table I. After conditioning the cell, the platinum active area was determined using cyclic voltammetry (CV) at 30°C. Fuel cell testing hardware with parallel channel plates and a test area of 5 cm2 was used. Three MEAs were tested for each GDL type to ensure the results were repeatable. In hot/dry and hot/wet cases, each data in the polarization curve was obtained at a flow rate of 0.2 slpm and 0.4 slpm in anode and cathode, respectively while operating the cell at a constant current density in steps of 0.02 A/cm2 for one minute.
Table I. Experimental validation parameters.
| Parameters | Hot/dry | Hot/wet | Cold/wet |
|---|---|---|---|
| GDL type | SGL 34BA/Toray 090 | SGL 34BA/Toray 090 | SGL 34BA/Toray 090 |
| CL fabrication method | doctor blade | doctor blade | doctor blade |
| Anode flow rate (slpm) | 0.20 | 0.20 | 1.00 |
| Cathode flow rate (slpm) | 0.40 | 0.40 | 3.00 |
| Temperature (K) | 353.15K | 353.15K | 333.15K |
| Channel type | Parallel | Parallel | Parallel |
| RH both cathode and anode (%) | 50 | 90 | 90 |
| Anode and cathode pressure (atm) | ambient | ambient | ambient |
| Active area (m2Pt/gPt) | 35.19 ± 5.02 | 35.19 ± 5.02 | 35.19 ± 5.02 |
| Platinum loading (mgPt/cm2) | 0.2 ± 0.05 | 0.2 ± 0.05 | 0.2 ± 0.05 |
For the cold/wet case, high fluctuations in cell voltage over time were observed at low flow rates and high current densities as shown in Figure 1. In the figure, the variation of cell voltage vs. time for three different MEAs is plotted by holding the current density at 0.5 A/cm2 (near limiting current) for one hour and varying the cathode flow rate from 4 slpm to 0.4 slpm. The high fluctuations in Figure 1 at a flow rate of 0.4 slpm are likely due to water accumulation in the gas channel. With increasing in flow rate, the cell voltage and its stability increase. As the flow rate continues to grow, the reason for the variability in performance may be due to water accumulation in the MEA since the variability disappears once an MPL is introduced as observed in our experiments (not shown) as well as by Atiyeh et al.21 The cathode channel flow rate used for the cold/wet case is therefore set to 3 slpm because the cell voltage is more stable. The anode flow rate is set to 1 slpm. In order to make sure the cell is operating at steady-state, the current was recorded after a 20 minutes hold.
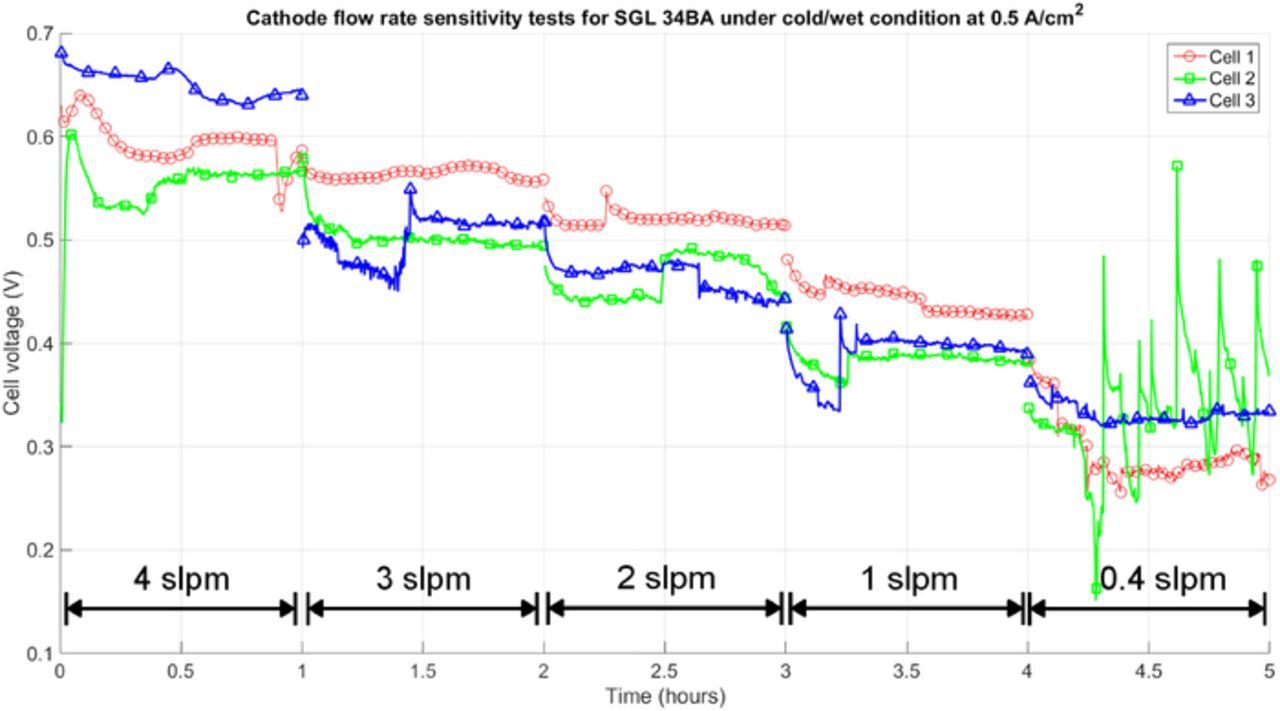
Figure 1. The variations of cell voltage vs. time at various the cathode channel flow rate for three MEAs at a constant current density 0.5 A/cm2 under 60°C and 90RH.
Results and Discussion
Two phase model validation
Experimental data and numerical model predictions are compared for the MEA with the doctor blade CCM and the SGL 34BA at a variety of operating conditions (see Table I). Figures 2a, 2c and 2e show the polarization curves for SGL 34BA obtained from simulations and experiments. The corresponding cell resistances are shown in (b), (d) and (f). The cell resistances are computed experimentally by current interrupt22 and numerically by calculating the electronic heat loss in GDLs and the protonic heat dissipation in the membrane as discussed in Ref. 23. The error bars represent the standard deviation of the averaged forward sweep of three different cells. Figure 2e shows the polarization curves for the three cells obtained experimentally by holding each data point for 20 minutes. Experimental and numerical results are in reasonable agreement at all conditions.
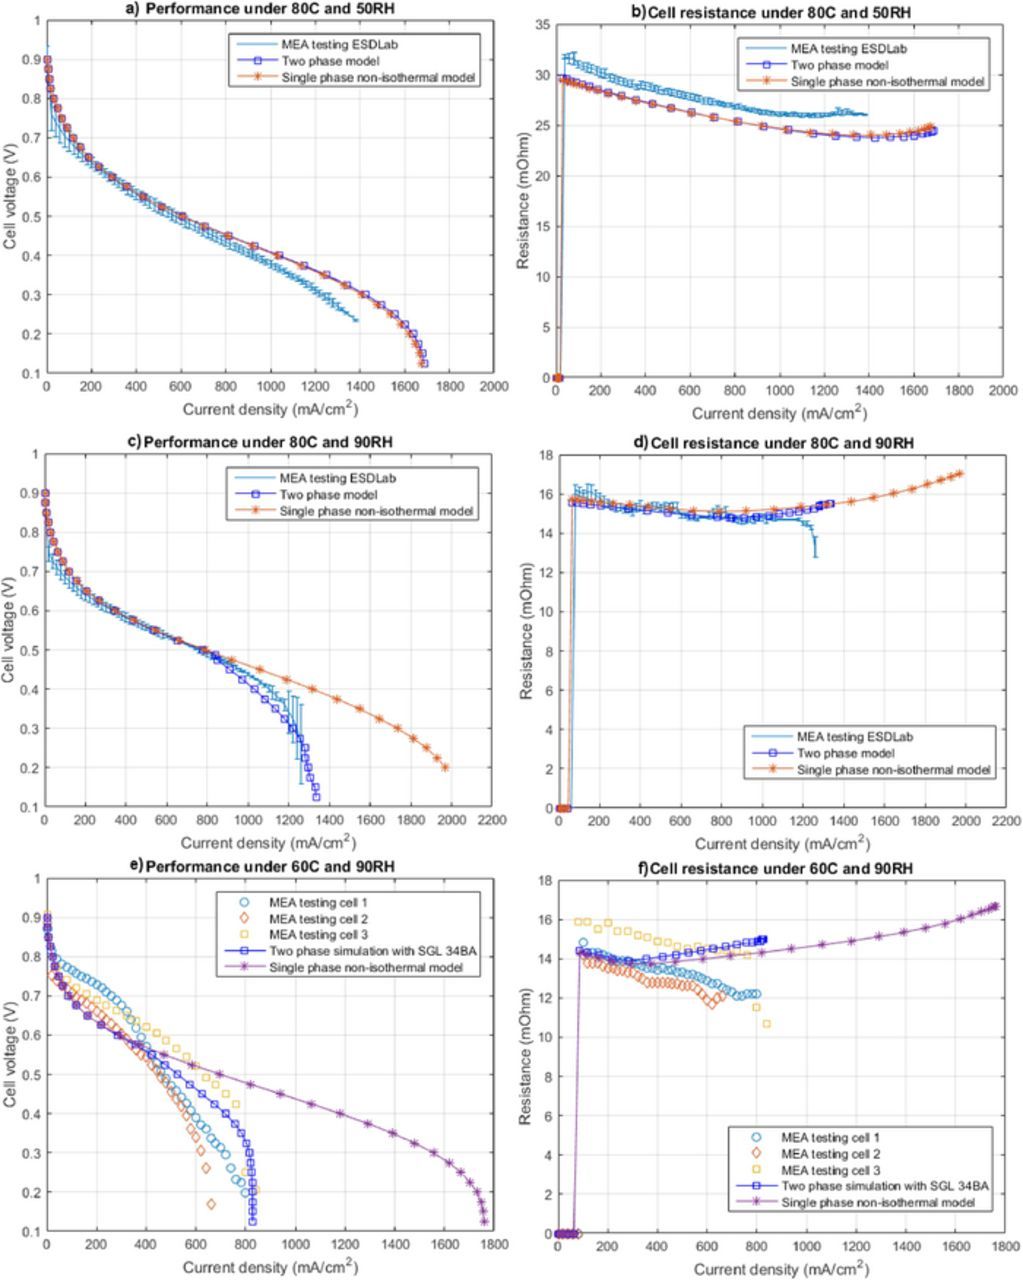
Figure 2. Experimental validation of polarization curves using two-phase model at: (a) 80°C and 50%RH, (c) 80°C and 90%RH, and (e) 60°C and 90%RH for SGL 34BA, and the corresponding cell resistance at: (b) 80°C and 50%RH, (d) 80°C and 90%RH, and (f) 60°C and 90%RH.
In order to understand the importance of water movement in determining the water distribution, both water vapor and liquid water fluxes at the anode and cathode boundaries, and the water transported by the membrane due to electro-osmotic drag, back diffusion and thermal-osmosis are studied. The PCI flow in the cathode CL and GDL is also examined quantitatively. All the water fluxes and PCI flow in the MEA are shown in Figure 3. The normalized water flux reported in the plots is defined as,
![Equation ([1])](https://content.cld.iop.org/journals/1945-7111/164/6/F540/revision1/d0001.gif)
where NH2O is the water flux evaluated at the boundary in g/(cm2 · s), F is Faraday's constant, j is the current density and MH2O is the water molar mass. The positive values in Figure 3a represent a flux leaving the MEA. In Figure 3b, a positive value represents that the water evaporates. The boundary condition guarantees liquid water will not enter the MEA. A negative liquid water flux is only observed in one occasion because of the instability of the change in the boundary condition when the capillary pressure reaches the breakthrough pressure. As the temperature decreases, the majority of water leaving the cathode boundary changes from vapor to liquid phase.
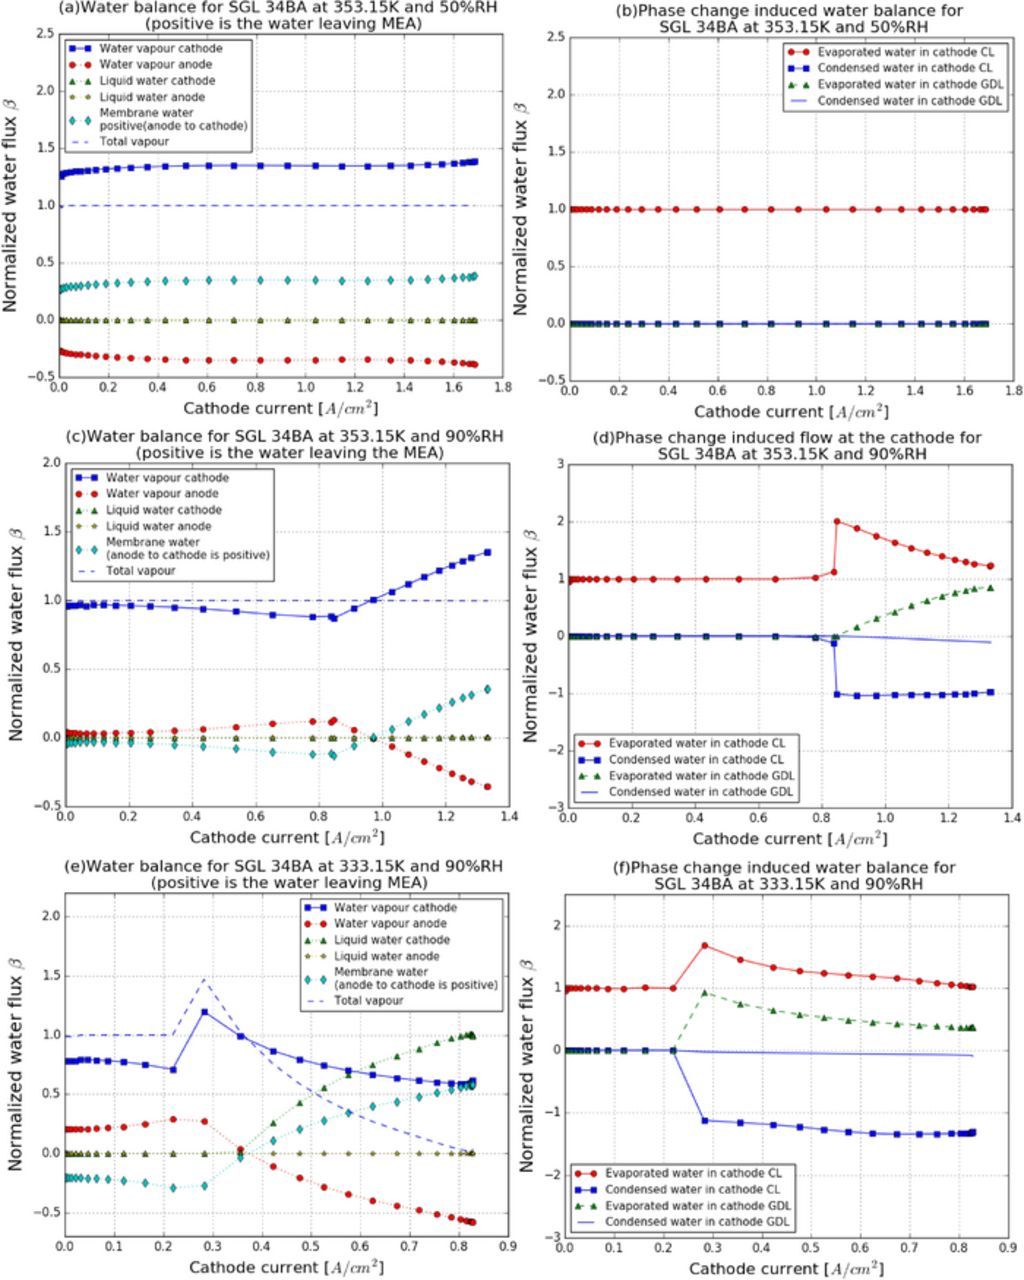
Figure 3. Water flux plots for SGL 34BA at: (a) 80°C and 50%RH, (c) 80°C and 90%RH, (e) 60°C and 90%RH, phase change induced water plots for SGL 34BA at: (b) 80°C and 50%RH, (d) 80°C and 90%RH, (f) 60°C and 90%RH at the cathode.
Hot/dry case
In the hot/dry case, Figure 2a shows single-phase and two-phase models exhibit the same polarization curves. The distributions of saturation in the MEA and the cathode CL at current density 1.5 A/cm2 are shown in Figures 4a and 4b. Zero saturation is observed everywhere except at the cathode CL. In this case, the existence of a hydrophilic network in the CL is of importance in order to provide a minimal liquid-gas interface required for vaporization. Vaporization is possible because the gas in the cathode CL is not saturated as shown in Figure 4c. The saturation distribution explains why single-phase and two-phase flow model show similar results in Figure 2a.
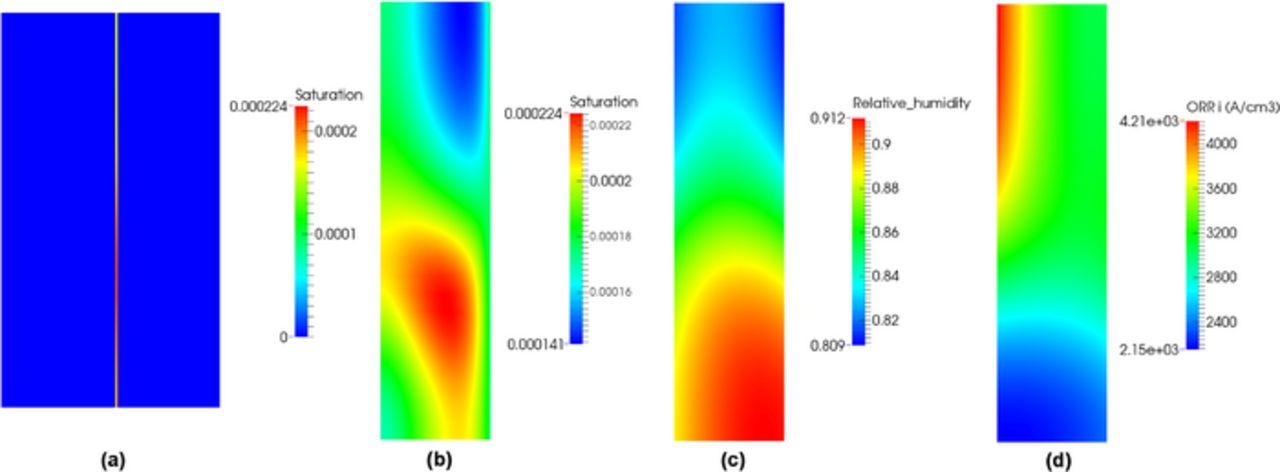
Figure 4. Distribution of saturation: (a) in the MEA, (b) the cathode CL, (c) the relative humidity distribution in the cathode CL, and (d) the volumetric ORR distribution in the cathode CL for SGL 34BA under hot/dry condition at 1.5 A/cm2.
The water fluxes and the amount of PCI flow in the cathode are shown in Figures 3a and 3b. Figure 3a shows that the amount of water produced by the electrochemical reaction plus the water entering the anode is equal to the total water vapor flux leaving the system, and the flux of liquid water is found to be zero at all current densities. At low relative humidity and high temperature therefore, complete evaporation takes place inside the cathode CL as shown in Figure 3b and liquid water movement is prevented due to the low liquid relative permeability at low saturation. Comparing anode and cathode water vapor flow rates in Figure 3a, the movement of water from anode to cathode is shown to be governed by the electro-osmotic drag, and the water vapor is evacuated, together with all water produced at the cathode.
Hot/wet case
In the hot/wet case, the difference in performance between the single-phase and two-phase models is significant at high current density because of water accumulation. Figure 5 shows the saturation distribution in the MEA and the saturation, volumetric reaction rate and membrane water content distributions in the cathode CL at 1.0 A/cm2 where the performance is limited by the blockage of liquid water. In the MEA, the majority of liquid water is observed in the cathode CL and a discontinuity in water saturation is clearly observed at the CL/GDL interface. The discontinuous saturation between the cathode CL and GDL is a result of the different wettabilities. As compared to the hot/dry case (see Figure 4d), the rate of the reaction is more concentrated close to the cathode CL/GDL interface due to the additional diffusive transport losses caused by the presence of liquid water. The increased water saturation can be explained by the volumetric evaporated/condensed water in the CL.
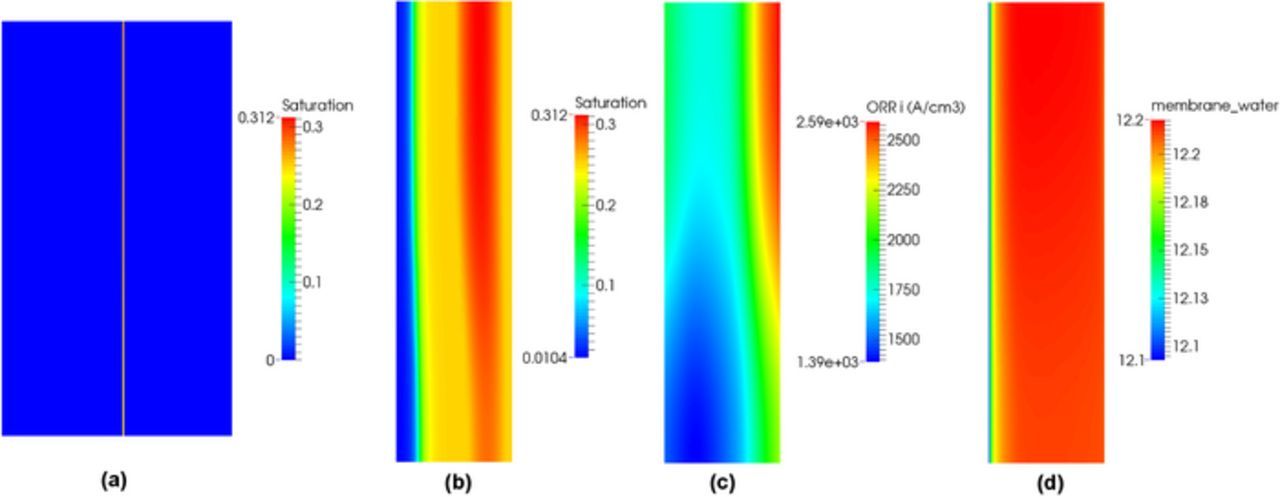
Figure 5. (a) Distribution of saturation in the MEA and (b) Distribution of saturation, (c) volumetric ORR and (d) membrane water content in the cathode CL, at current density 1.0 A/cm2 under hot/wet condition.
The distributions of relative humidity, volumetric evaporation and condensation, and interfacial surface area in the cathode CL are shown in Figure 6 at the same current density. The majority of the CL is oversaturated as shown in Figure 6a indicating that the movement of liquid water in the CL is governed by capillary flow. Sorbed water in the ionomer moves from the inner CL to the CL/GDL interface due to increased electro-osmotic drag at 1.0 A/cm2 (see Figure 5c). Since the middle of the CL is oversaturated (see Figure 6a), the membrane water near the GDL/CL interface is desorbed into vapor and then condensed as shown in Figure 6c. The condensed water at CL/GDL interface is then transported back to the inner CL due to a liquid pressure gradient (see Figure 6b). At the PEM/CL interface, water is evaporated and the water vapor is sorbed back into the ionomer. The end result is a circulation loop with membrane water moving from PEM/CL to GDL/CL interface and liquid water moving back from GDL/CL interface to the PEM/CL interface. Due to the Kelvin effect, the relative humidity required for water vapor to condense in hydrophobic pores is higher than 100%. This results in a relatively small volumetric condensation distribution in the CL as shown in Figure 6c. The high evaporation rate observed in Figure 6b at the cathode GDL/CL interface is due to the fast diffusive water transport at GDL side and the high interfacial surface area available for phase change, see Figure 6d.
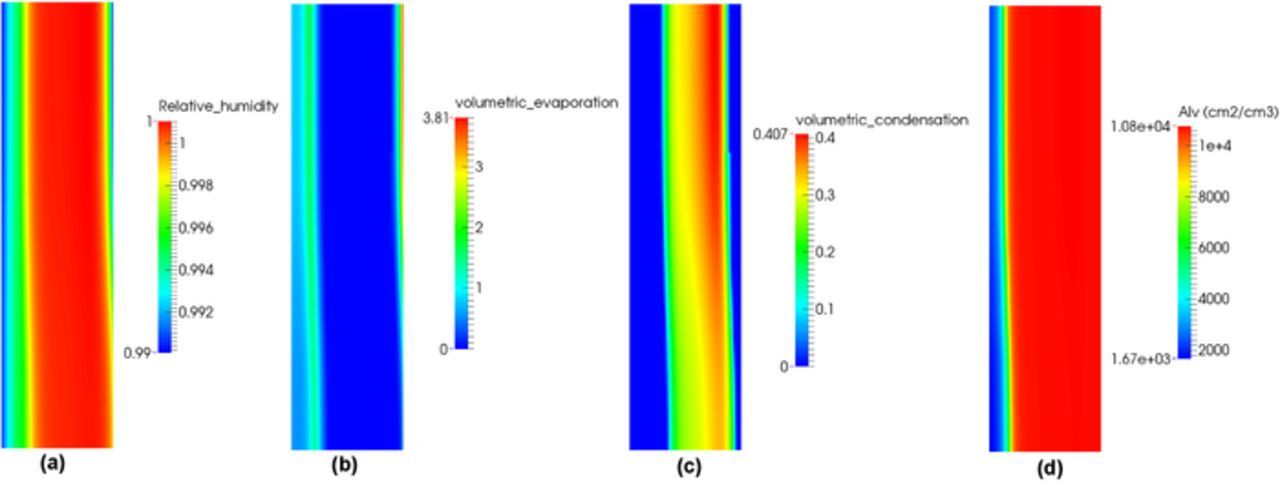
Figure 6. (a) Distribution of relative humidity, (b) volumetric evaporation, (c) volumetric condensation, and (d) interfacial surface area in the cathode CL at current density 1.0 A/cm2 under hot/wet condition.
Figures 3c and 3d show the water movement in the MEA and the amount of PCI flow at the cathode. As compared to the hot/dry case, the saturation increases greatly in the cathode CL at high current densities (see Figure 5a and Figure 4b), whereas the liquid water flux is still zero at all current densities. The zero flux of liquid water can be explained by the evaporation zone observed at the GDL/CL interface (see Figure 6b) which changes all water from liquid to vapor form. The water vapor flux from cathode to anode observed in Figure 3c suggests that the water transport in the membrane is governed by back diffusion at low current densities. This can be explained by the relative humidity gradient between the anode and cathode. With the increase in current density, the relative humidity in the cathode continues to grow creating a larger driving force for back diffusion until the cathode electrode is fully saturated at about 1.0 A/cm2. Back diffusion then reaches its maximum while water transport due to the electro-osmosis drag continues to grow resulting in water movement from anode to cathode (see Figure 3c). As the majority of the cathode CL is oversaturated at high current densities (see Figure 6a), the water transported by the membrane is first evaporated for the ionomer, then condensed in the middle region of CL and finally evaporated at the GDL/CL interface.
Cold/wet case
The difference in performances between single-phase and two-phase models is substantial when the temperature is reduced from 80°C to 60°C as shown in Figure 2e. In this case, liquid water accumulation is clearly limiting the MEA performance. Figure 7 shows the saturation distribution in the MEA and CL, volumetric oxygen reduction reaction (ORR) and membrane water content in the cathode CL at current density 0.7 A/cm2 where the performance of the fuel cell has severely decreased in comparison to the single-phase model prediction. The overall liquid water saturation increases in both cathode CL and GDL as compared to the hot/wet case (see Figure 5a) with water accumulation clearly visible in the GDL. This can be explained by both reduced evaporation rate and saturated vapor pressure with decreasing the temperature leading to more condensation in the cathode (see Figure 3f). As a result of the higher saturation, the majority of the electrochemical reaction is concentrated at the GDL/CL interface highlighting that the transport of reactant has been severely obstructed by liquid water in the cathode CL. At the CL/membrane side, the cathode CL is less active. The membrane water content is uniform in the cathode CL and it is lower than in the hot/wet case due to the dependence of the sorption isotherm on temperature.
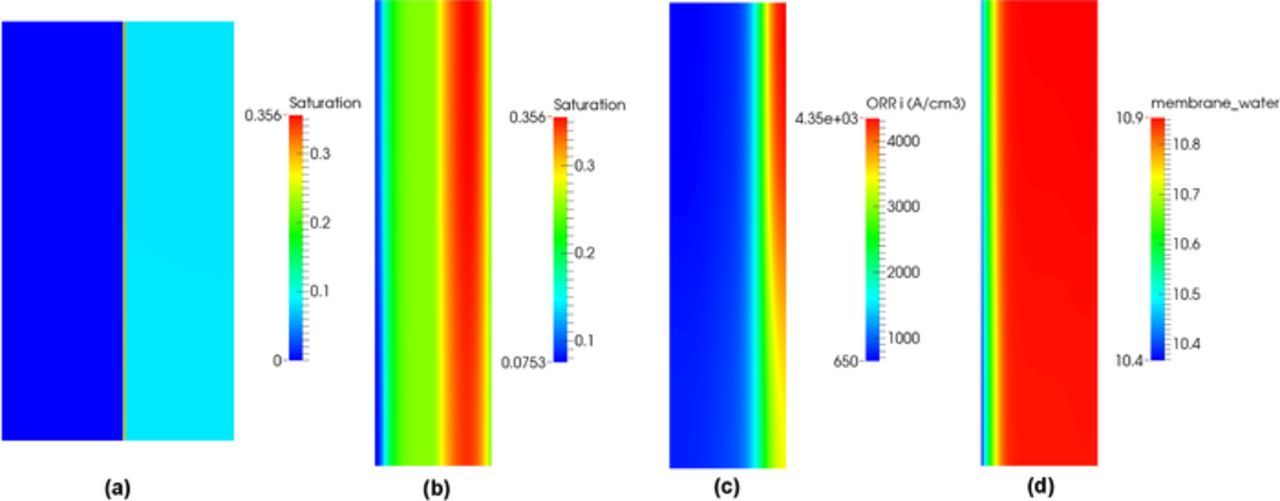
Figure 7. (a) Distribution of saturation in the MEA, (b) distribution of saturation, (c) volumetric ORR and (d) membrane water content in the cathode CL at current density 0.7 A/cm2 under cold/wet condition.
The water movement under wet/cold condition is studied by plotting the water fluxes in the MEA and the amount of evaporated/condensed water at the cathode, see Figures 3e and 3f. At low temperature and high current densities, the majority of water transported to the cathode boundary is in liquid form, because most of the cathode CL is oversaturated and the liquid water evaporation is insignificant. As compared to the hot/wet case, where the cathode water vapor increases with the current density, the cathode vapor flux shows a gradual decrease once the liquid water starts to leave at the cathode boundary. Figure 3f shows that the evaporated water in the cathode CL decreases with the increasing current density whereas the condensed water remains approximately constant at moderate current densities. The amount of water evaporated in CL decreases at high current densities is due to the increase in membrane water transport from anode to cathode (see Figures 3e and 3f). Figures 3e and 3f show that, when the current density is over 0.3 A/cm2, the water vapor leaving the cathode boundary is close to the liquid water evaporated in the cathode GDL. This highlights that, even when the cathode CL is fully saturated, water can still be evacuated via GDL-channel boundary in the vapor form due to the evaporation in the GDL.
Validation with imaging data
In situ liquid water visualization measurements without MPL have been reported by Deevanhxay et al.19 and Lee et al.20 for fuel cells operating at 28°C, 60% RH and a flow rate of 0.1 slpm, and 60°C, 100% RH and a flow rate of 1 slpm, respectively. The data reported by Deevanhxay et al.19 has a spatial resolution of 1.5 μm, and the data reported by Lee et al.20 a pixel resolution of 4.7 μm. In order to compare the water distribution between the two-phase model predictions and imaging data, simulations are run with the same reported configurations in the experiments.19,20
A CL with a loading of Pt 0.22 mg cm− 2, a thickness of 22 μm, a porosity of 0.52, and an active area of 0.1 cm2 (0.8 mm × 12 mm) is used to compare against the data reported by Deevanhxay et al.19 The width of channel and rib used is 0.1 mm. The membrane (NRE-211) and the GDL (SGL 34BA) properties in the simulation are modified to correspond to the configurations in the experiment, i.e., thickness of membrane has been adjusted to 50 μm and the GDL thickness and porosity are 190 μm and 0.8, respectively. The rest of the parameters remained the same. The operating conditions are 28°C, 60% RH and one atmosphere. The numerical saturation distribution in the cathode and the cathode CL are shown in Figures 8a and 8b at current density 0.5 A/cm2. It can be seen that the majority of the liquid water is concentrated at the CL/GDL interface, and the cathode CL saturation decreases from the GDL to membrane side. These agree with the experimental observations.19 Figure 8c shows the saturation distributions in the cathode CL under the rib, channel and rib/channel interface predicted by the numerical model and the imaging data taken at 480 and 600 seconds after operating the cell. The liquid water concentration (cm3/g · carbon) reported by Deevanhxay et al.19 is converted to liquid water saturation by first subtracting the OCV water concentration (0.22 cm3/g · carbon), multiplying the result by the carbon density (1.9 g/cm3) reported in Ref. 24 and finally multiplying by the ratio between solid phase (the carbon black only) and void phase. The soft X-ray data19 in Figure 8b shows a continuous decrease of water saturation from the GDL to the membrane side, whereas a slight increase in saturation is observed near the GDL side from the numerical prediction. The reason for this discrepancy might be due to the compression at the GDL/CL interface during the cell assembly which the model does not account for.
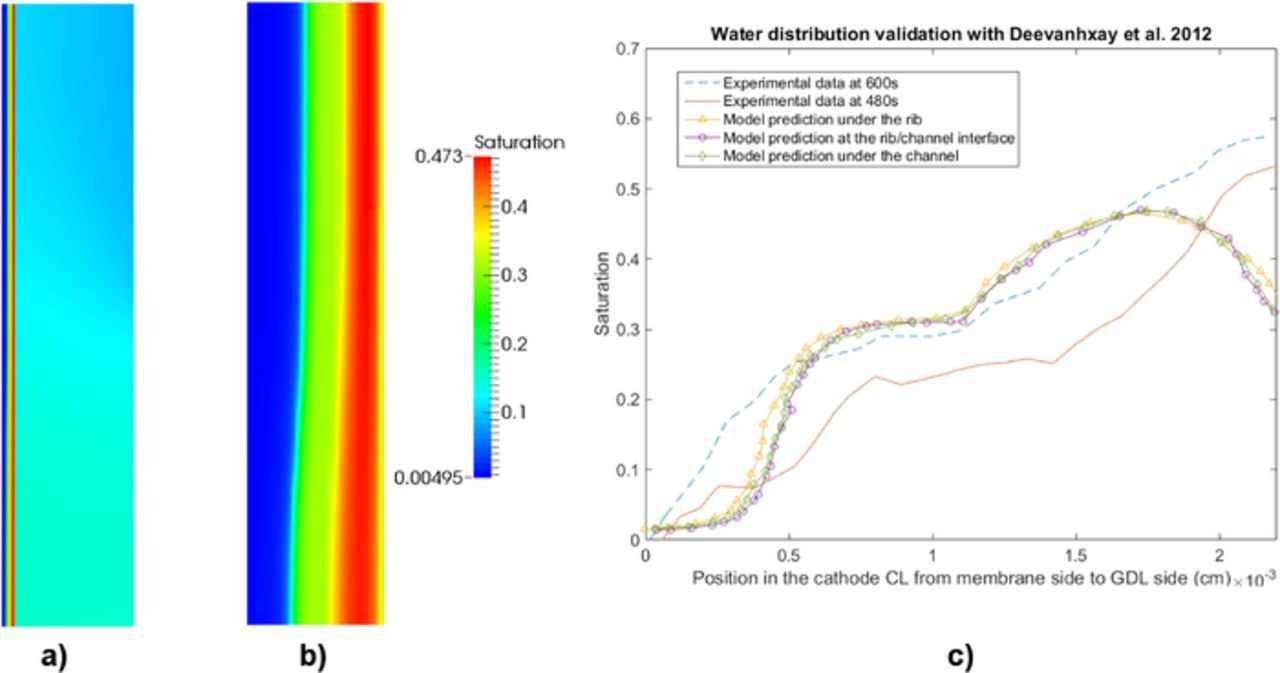
Figure 8. Validation of water profile with soft X-ray radiography data reported by Deevanhxay et al.,19 saturation distributions (a) in cathode and (b) in cathode CL, and (c) through plane saturation plots in cathode CL under the rib at current density 0.5 A/cm2.
With the CL parameters (0.35 mg/cm2 Pt loading) reported by Lee et al.,20 a simulation is run with a channel and rib width of 0.2 mm. A TGP-H-060 GDL with a thickness of 130 μm and the same PSD configuration as the Toray 090 reported in this paper is used in the simulation. To compensate the microstructural changes in the GDL due to the 85% compression reported by Lee et al.,20 both the porosity and the pore radius are reduced by 15% in the simulation accordingly. The operating conditions used are 60°C, 100% RH and one atmosphere, the rest of the parameters remain the same as in the previous validation section. Figure 9a shows the saturation distribution in the cathode at current density 0.5 A/cm2. Liquid water accumulation is observed at the region close to the cathode CL/GDL interface in agreement with the experimental observation.20 Figure 9b shows the comparison of the water content at through-plane direction between experimental data and numerical predictions. The water thickness (cm) reported by Lee et al.20 is converted to liquid water saturation by dividing by the length of active area along the beam path (0.8 cm) and porosity (0.7) of the GDL. An increase of water saturation from the channel side to the GDL/CL interface is observed both experimentally and numerically. The proposed two-phase model predicts a lower saturation value in the CL and a sharper saturation gradient in the region close to GDL/CL interface. The experimentally observed gradient in Ref. 20 was much smoother than the numerical prediction (see Figure 9b). The difference in saturation plots between model prediction and experimental observation can be attributed to inaccurate CL input parameters in the model due to a lack of CL information in Ref. 20, e.g., thickness, ionomer loading, active area and porosity, and the compression in the GDL which potentially changes the microstructure of the porous media among many other reasons.
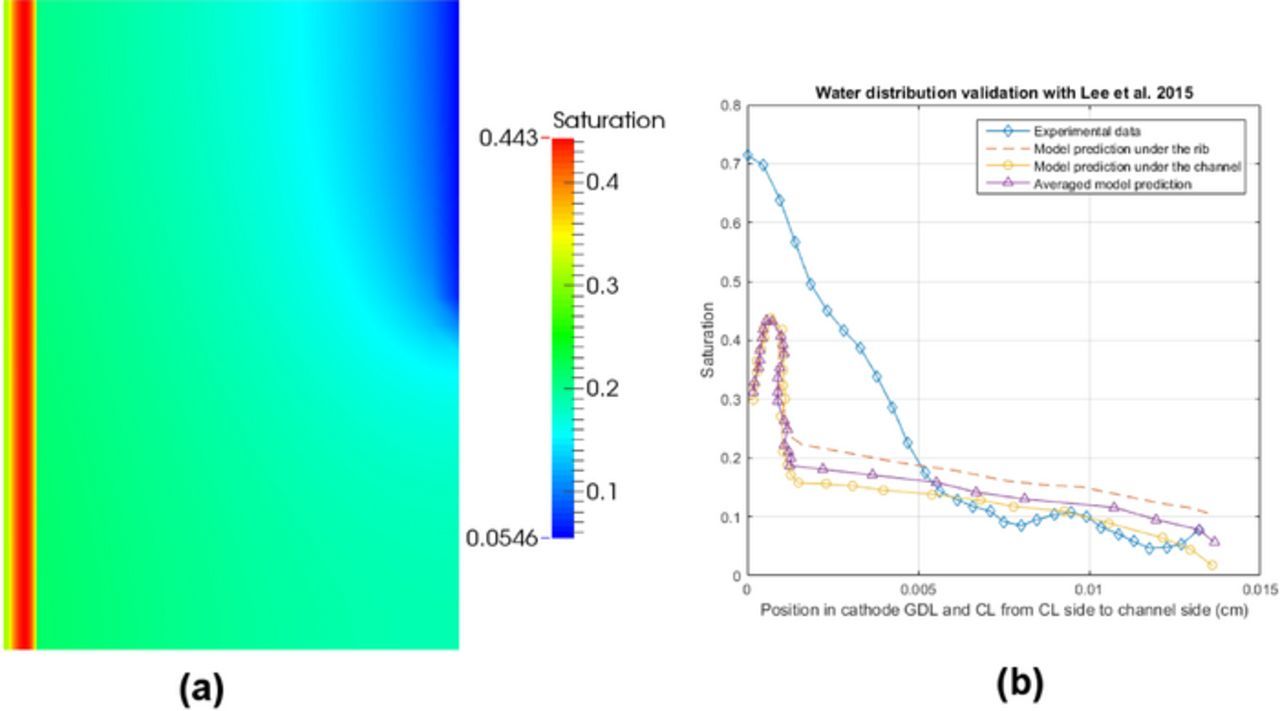
Figure 9. Comparison of water profile with synchrotron radiographic imaging data reported by Lee et al.,20 (a) saturation distribution of the cathode and (b) the cathode CL, and (c) through plane saturation distribution of numerical data vs. imaging data at current density 0.5 A/cm2.
Analysis of different GDLs
Figure 10 shows the experimental and numerical iR-free polarization curves for a fuel cell with the same MEA as in previous results but with a Toray 090 (20% PTFE) GDL. The contact resistance in the cells using Toray 090 were found to be high compared to the cell mode with the SGL 34BA. GDL conductivity is high for both and the same MEA is used in both cases, so it is assumed contact resistances are responsible for the discrepancy which the model does not account for. iR-free curves are thus used in this section. The experimental results agree with the two-phase model predictions at all conditions highlighting that the two-phase model is able to predict the change in the MEA performance with different types of GDLs. SGL 34BA numerical results are also shown to highlight differences between the two GDLs.
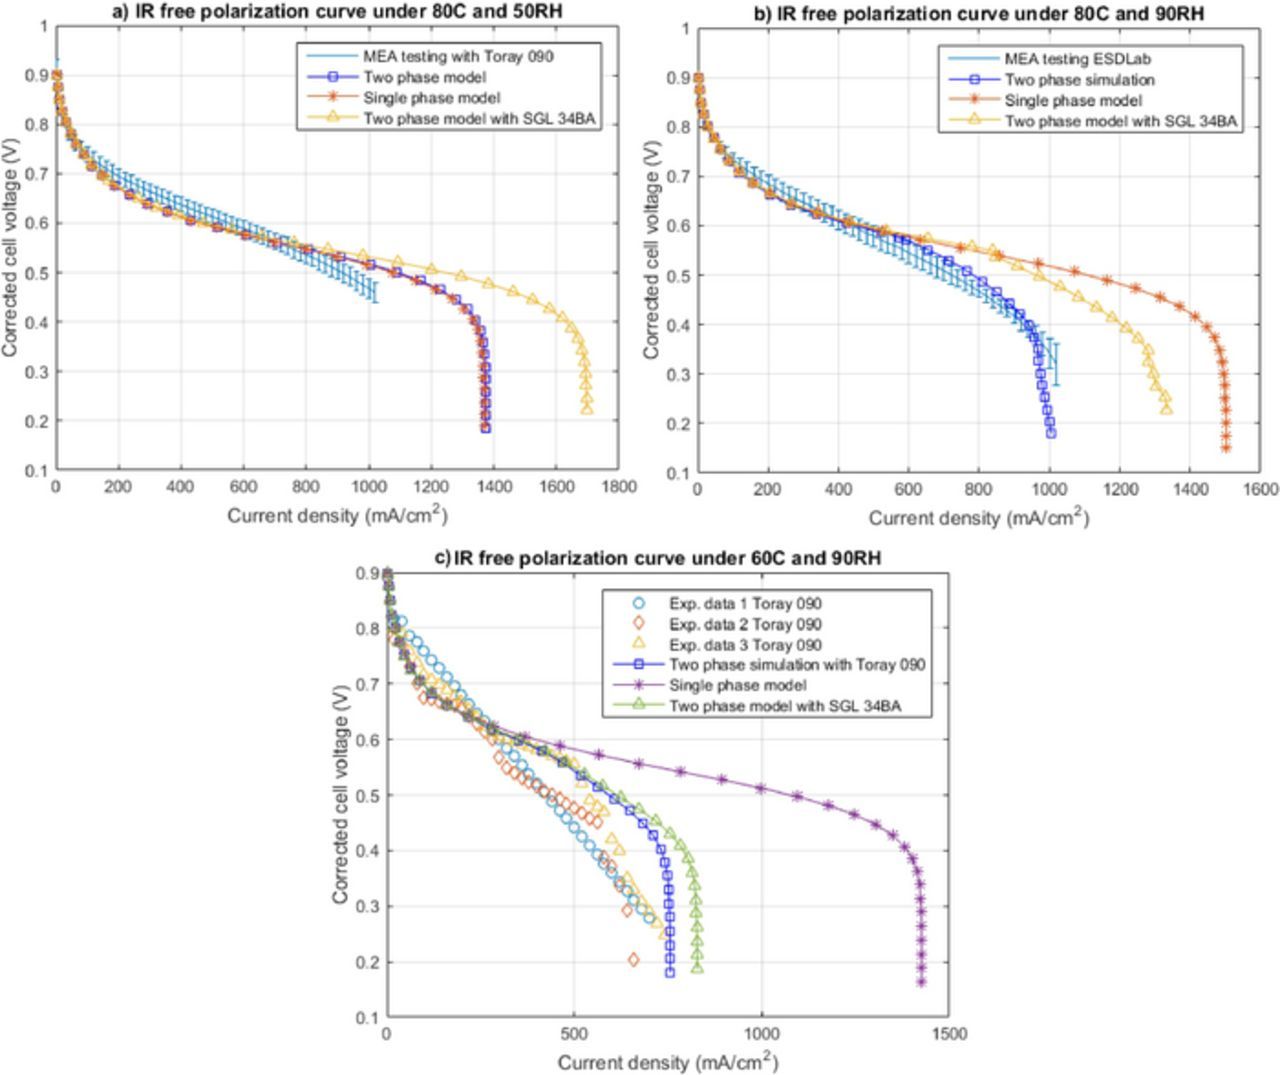
Figure 10. Experimental validation of iR free polarization curves using two-phase model at: (a) 80°C and 50%RH, (b) 80°C and 90%RH, and (c) 60°C and 90%RH for Toray 090 20% PTFE.
Cell performance decreases for the Toray 090 (20% PTFE) as compared to the SGL 34BA, especially in the mass transport region at high temperature. Figure 11 shows the comparison of the oxygen molar fraction distributions between SGL 34BA and Toray 090 in the cathode CL in the single-phase and two-phase region, respectively. The reduced MEA performance for Toray 090 in the single-phase region is due to the lower porosity, which results in a lower reactant concentration in the CLs as shown in Figures 11a and 11b. The difference in the overall performance between the two GDLs decreases in the two-phase region, especially in the cold/wet case (see Figure 10c). This can be attributed to water accumulation in the cathode CL which blocks the reactant transport (see Figures 11c and 11d) and deactivates the ORR reaction at the inner region. The difference in limiting current density between two GDLs in the cold/wet case can be explained by the GDL water management.
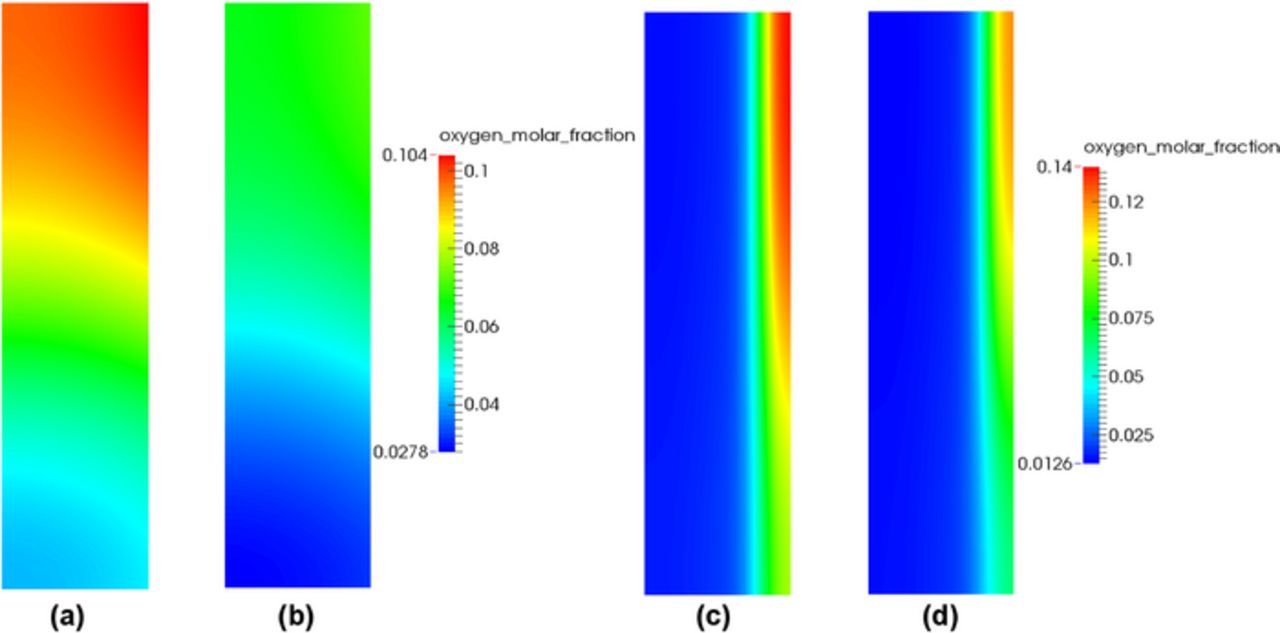
Figure 11. Distributions of oxygen molar fraction in the cathode CL for: (a) SGL 34BA and (b) Toray 090 in the hot/dry case at 1.3 A/cm2, (c) SGL 34BA and (d) Toray 090 in the cold/wet case at 0.6 A/cm2.
Figures 12a and 12b show the capillary pressure profiles in the cathode GDLs for SGL 34BA and Toray 090 (20% PTFE), under cold/wet conditions at current density 0.6 A/cm2, where the performance is severely limited due to water accumulation. The capillary pressure distributions are significantly different for the two GDLs. As SGL 34BA has a wider PSD1 than Toray 090, the pore centered at 34.0 μm results in a higher effective liquid permeability as shown in Figure 12c which can be used to explain the previous capillary pressure distributions. An increase in effective liquid permeability is clearly observed in SGL 34BA when the capillary pressure is greater than zero. Whereas in the Toray 090, only when the capillary pressure is above 2000 Pa, the growth of the effective liquid permeability starts to be visible. Therefore, the capillary pressure required to transport the same amount of liquid water in the SGL 34BA is less than in the Toray 090 which leads to the decrease in capillary pressure. As a result of the 14.2 μm pores in SGL 34BA, a higher interfacial surface area at low saturation range is observed as compared to the Toray 090, see Figure 12d. Therefore, the amount of liquid water evaporated in SGL 34BA is higher than Toray 090 (see Figures 3f and 12e), which further reduces the capillary pressure in the cathode GDL.
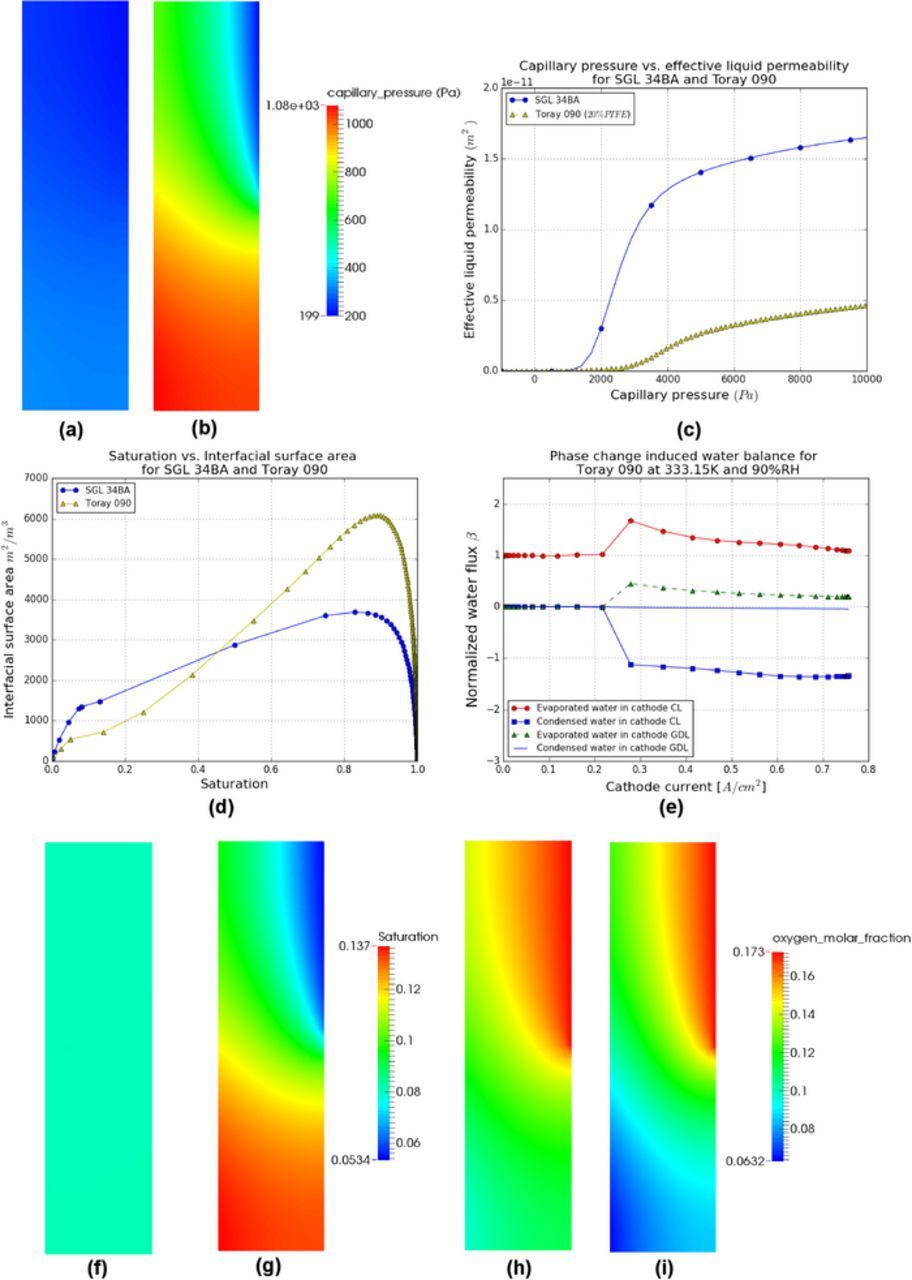
Figure 12. Distributions of capillary pressure for (a) SGL 34BA and (b) Toray 090, (c) capillary pressure-effective liquid permeability relationships and (d) saturation-interfacial surface area relationships for two GDLs, (e) PCI flow for Toray 090 in the cathode, distributions of saturation for (f) SGL 34BA and (g) Toray 090, and oxygen molar fraction for (h) SGL 34BA and (i) Toray 090 in the cathode GDLs under the cold/wet condition at 0.6 A/cm2.
The distribution of saturation for SGL 34BA and Toray 090 shown in Figures 12f and 12g are the result of the capillary pressure distributions and the relationships between capillary pressure and saturation.1 Due to the more anisotropic capillary pressure distribution in Toray 090, a greater change in saturation between the channel and the rib regions is observed in Figure 12g as compared to the SGL 34BA. The oxygen molar fraction distributions for two GDLs are plotted in Figures 12h and 12i. As compared to the SGL 34BA, a decrease in oxygen molar fraction under the rib is clearly observed in Toray 090 (see Figure 12i) due to the more anisotropic saturation distribution.
Analysis of membrane water transport
In situ water flux measurements have been reported by Thomas et al.,15 Atiyeh et al.,21 and Adachi et al.25 In order to compare the water flux measured by Thomas et al.,15 a simulation is configured with the same parameters reported by Thomas et al.,15 i.e., a 30 μm thick membrane, a 0.2 mgPt cm− 2 anode and a 0.6 mgPt cm− 2 cathode, each 10 μm thick, and a SGL 25BA GDL. The RH used in all cases is 100% and three sets of operating temperatures, i.e., 57.5°C cathode and 62.5°C anode, 62.5°C cathode and 57.5°C anode, and 60.0°C at both sides, are used in the simulations to explore the effect of temperature on membrane water transport.
To understand the effect of the membrane diffusion coefficient on water transport, three set of the diffusion coefficient expressions, i.e., Motupally et al.,26 Fuller27 and Nguyen et al.28 are studied. Figure 14a shows the comparisons between three diffusion coefficients and the experimental data of Thomas et al.15 with no additional temperature gradient imposed between anode and cathode. A good agreement is observed between Fuller's27 prediction and the experimental data,15 whereas both Motupally et al.'s26 and Nguyen et al.'s28 predict a higher water flux leaving the cathode. Both Motupally et al.26 and Nguyen28 estimated a lower diffusion coefficient. By performing a parametric study on EOD, 1.0, which has been used in all cases, shows a better agreement with the experimental data (see Figure 14a) and Adachi et al.25 also reported a EOD coefficient between 0.5 and 1.0.
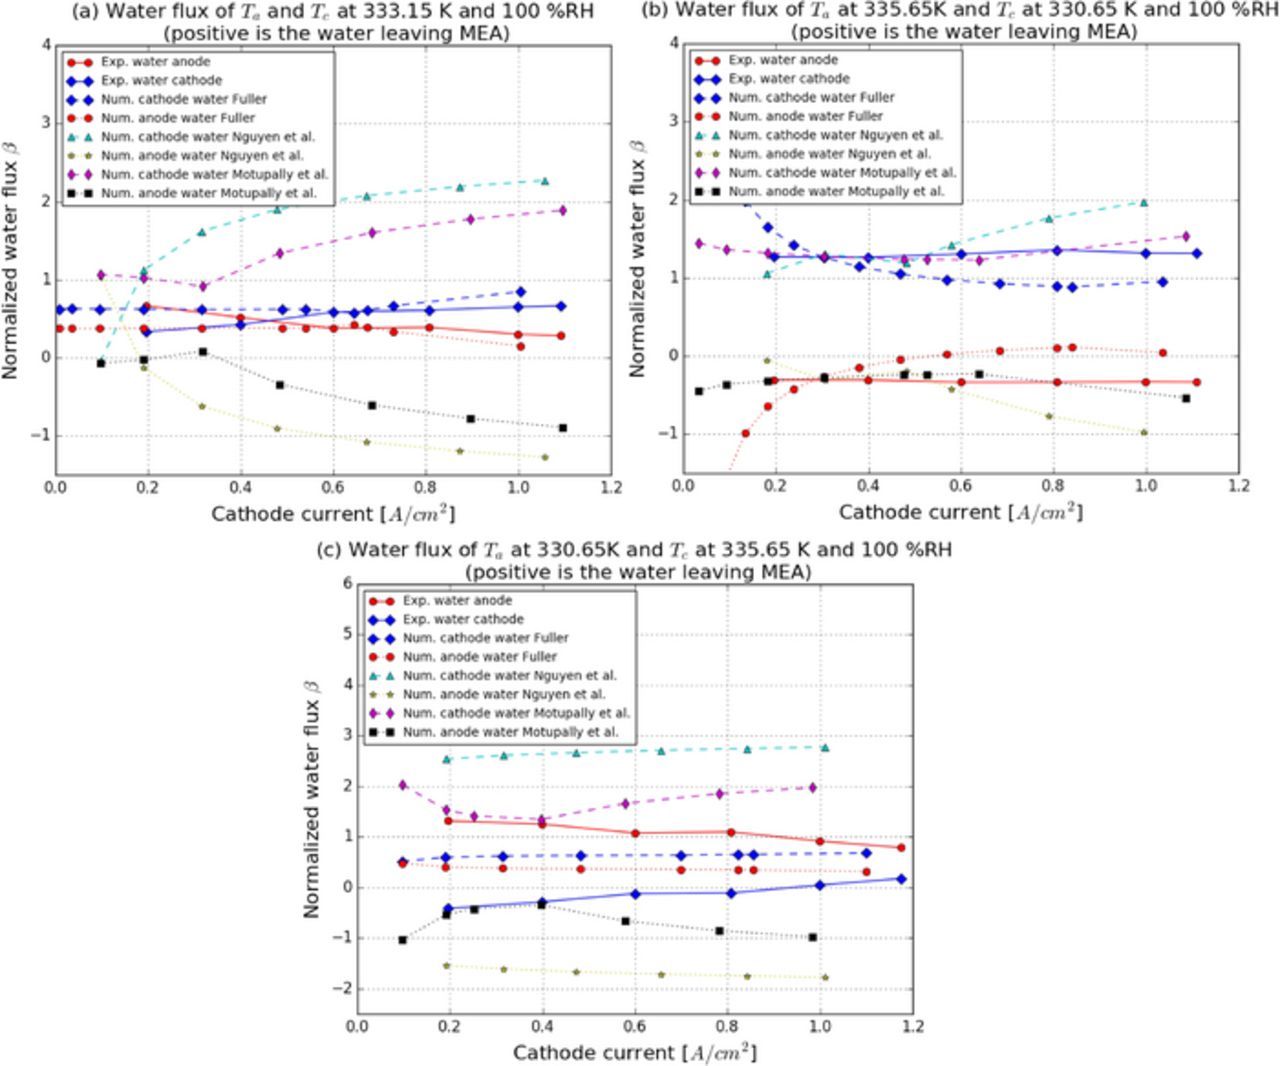
Figure 14. Membrane water transport analysis at 100%RH: (a)60°C at both sides, (b) 57.5°C cathode and 62.5°C anode and (c) 62.5°C cathode and 57.5°C anode.
With a higher temperature at the anode, all three diffusion coefficient expressions agree with the experimental measurements15 (see Figure 14b). In the opposite case, i.e., hotter cathode, in Figure 14c, the experimental data shows water entering the cathode, whereas all numerical results predict a positive water flux being evacuated from the cathode. The discrepancies on water flux might be due to several reasons: (i) water diffusion, electro-osmotic drag, and thermo-osmosis transport coefficients might not be appropriate for the type of membrane used in the study by Thomas et al. 15 (membrane type not reported), and (ii) liquid water permeation and its thermal behavior in the membrane are not accounted in the model.
Analysis of cell temperature
The effect of the temperature on water management at 90% RH was carried out by examining the electrochemical performance and liquid water flux at the cathode boundary as shown in Figure 13. The oxygen and water vapor partial pressure at the cathode boundary are shown in Table II. The cell performance shows a gradual improvement with temperature until the temperature reaches 90°C. This is in agreement with experimental observation in Ref. 29. As shown in Figure 13b, there is no liquid water evacuated at the cathode boundary in both 80°C and 90°C cases. Thus, improvement in performance from 50°C to 80°C is due to improved water rejection while the reduced performance at 90°C is due to oxygen dilution due to the high water partial pressure.
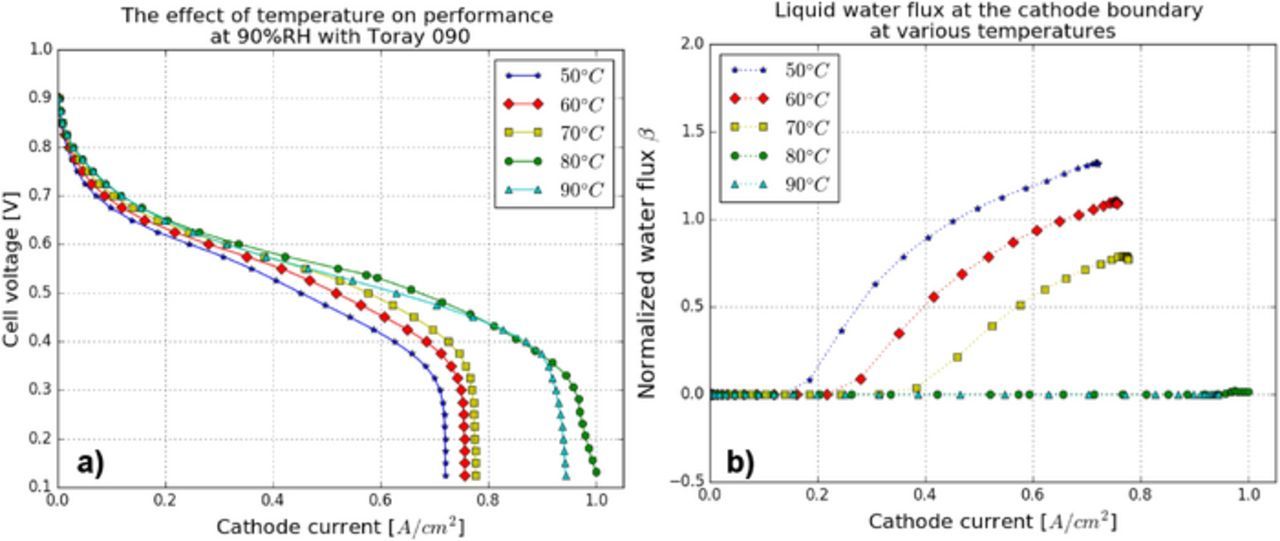
Figure 13. Temperature analysis: (a) MEA performance and (b) liquid water flux at the cathode boundary.
Table II. Partial pressure of oxygen and water vapor at the cathode boundary and saturated vapor pressure with varying cell temperature.
| Parameters | 50°C | 60°C | 70°C | 80°C | 90°C |
|---|---|---|---|---|---|
| Oxygen (Pa) | 18948 | 17529 | 15300 | 12260 | 8410 |
| Water vapor pressure (Pa) | 10956 | 17401 | 27430 | 41975 | 62523 |
CL hydrophobic contact angle, hydrophilic volume fraction and pore size distribution
In order to study the impact of CL hydrophobic contact angle, percentage of hydrophilic pores and PSD on performance, the two-phase model with Toray 090 above is used as a base case for performing the parametric studies. Since the two-phase flow effects are highest at 60°C and 90%RH, these operating conditions are used.
Performance study of CL hydrophobic contact angle
CL wettability is difficult to measure experimentally and is a major source of uncertainty in the model. The impact of CL contact angle is, therefore, assessed by performing a parametric study with various hydrophobic contact angles, i.e., 92°, baseline case (93°), 96°, 100°, and 110°. Figure 15a shows the performance variation with the above CL contact angles. An increase in the MEA performance at high current densities is observed with an increase in CL contact angle. The change in performance can be attributed to the variations of the capillary pressure-saturation relationships for the above CL contact angles (see Figure 15b).
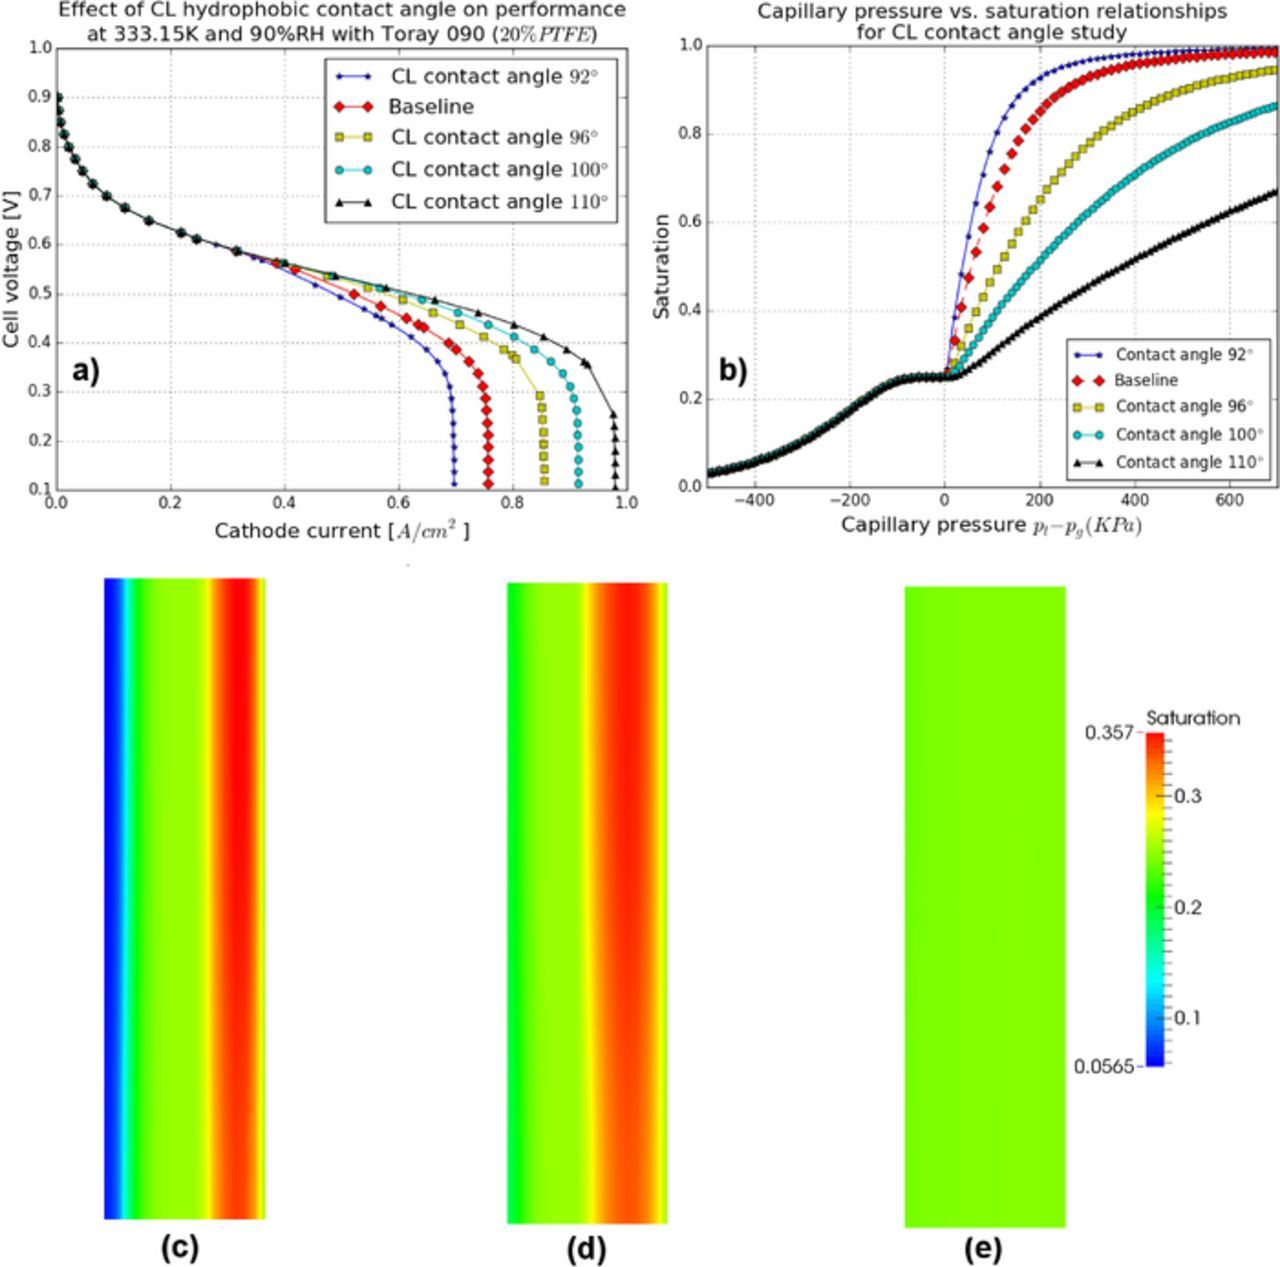
Figure 15. CL contact angle study: (a) the MEA performance, (b) capillary pressure-saturation relationships, distributions of saturation in the cathode CL at contact angle: (c) 92°, (d) baseline, and (e) 110° at 0.6 A/cm2.
Based on the Young-Laplace equation, an increase of the contact angle will result in a higher capillary pressure required to invade the same pore as shown in Figure 15b. The distributions of saturation with three contact angles, 92°, 93° and 110° in the cathode CL at current density 0.6 A/cm2 are shown in Figures 15c, 15d and 15e. With a higher contact angle, a lower saturation distribution is observed. A lower contact angle in the CL allows the layer to retain more liquid water and therefore, an increase in contact angle is beneficial.
Performance study of CL hydrophilic volume fraction
In order to assess the impact of CL hydrophilic volume fraction, simulations are performed by varying the CL hydrophilic volume fraction, i.e., 0.10, 0.20, 0.25 (baseline), and 0.35, while the other parameters in the PSD model are kept the same. The value of 0.35 corresponds to the case where the volume fraction of hydrophobic pores is near the necessary volume fraction for percolation. Figure 16a shows the cell performance for all cases. The CL with a hydrophilic volume fraction of 20% shows the highest performance.
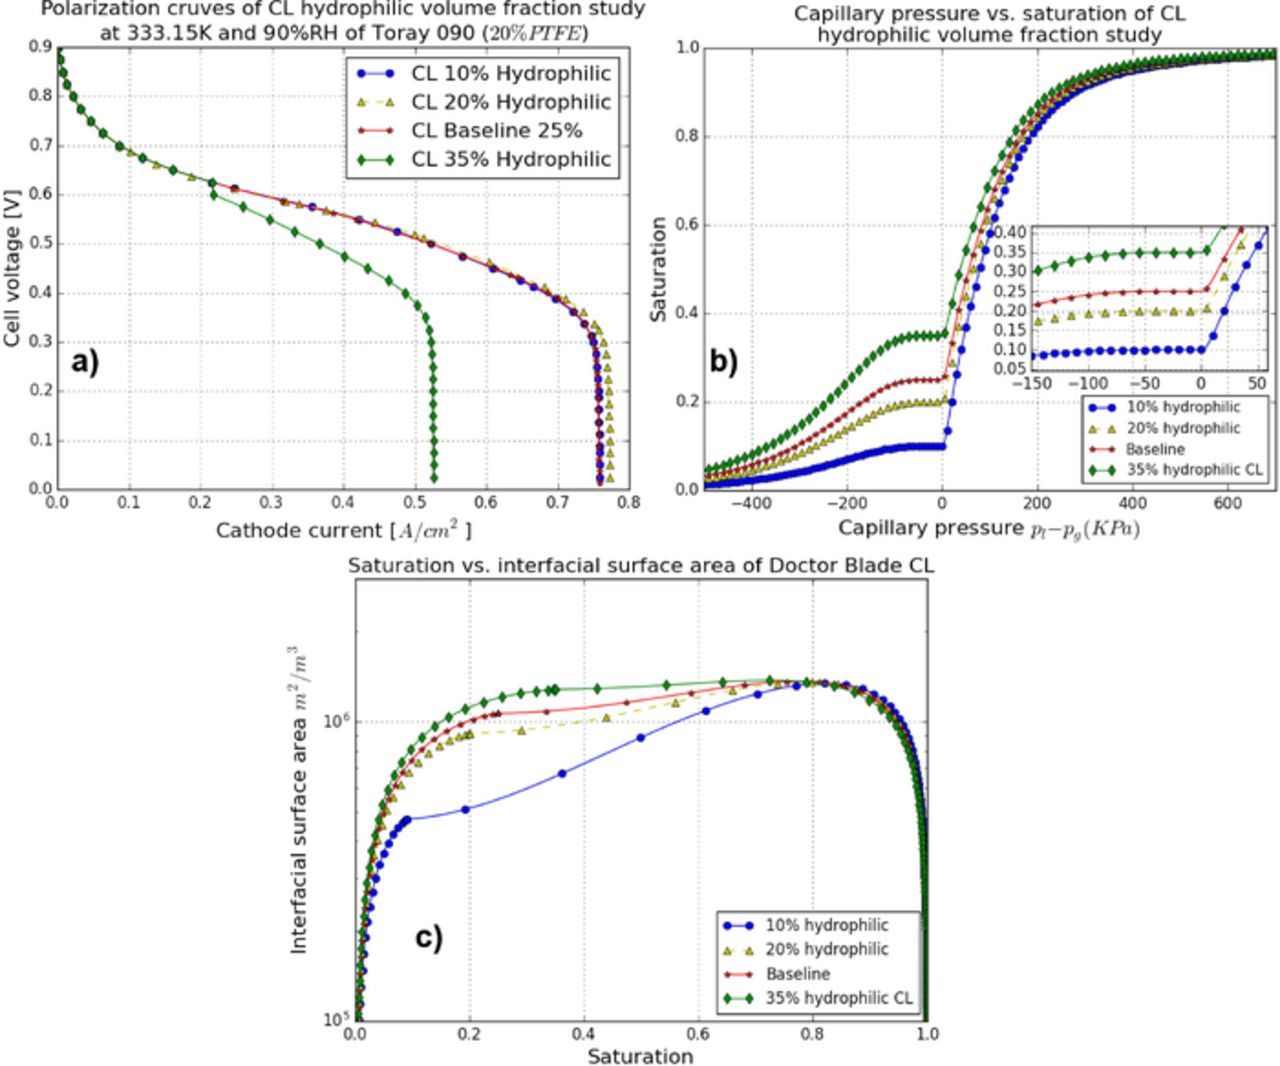
Figure 16. CL hydrophilic percentage study: (a) the MEA performance, (b) capillary pressure-saturation relationships, and (c) saturation-interfacial surface area relationships.
Figure 17 shows saturation and volumetric electrochemical rate distributions in the cathode CL for the various CL hydrophilic percentages presented above at 0.5 A/cm2. The highest saturation region is near the GDL/CL interface for all cases. The lowest liquid water accumulation in the CL/membrane region is observed for the 20% hydrophilic percentage CL. CLs with hydrophilic volume fractions higher than 20% result in increased liquid water accumulation because less capillary pressure is required to invade the pores as highlighted by the capillary pressure-saturation curve in Figure 16b. On the other hand, the CL with less than 20% hydrophilic volume fraction has a lower interfacial surface area (see Figure 16) which results in higher liquid water accumulation in order to exhaust the same amount of water in vapor phase.
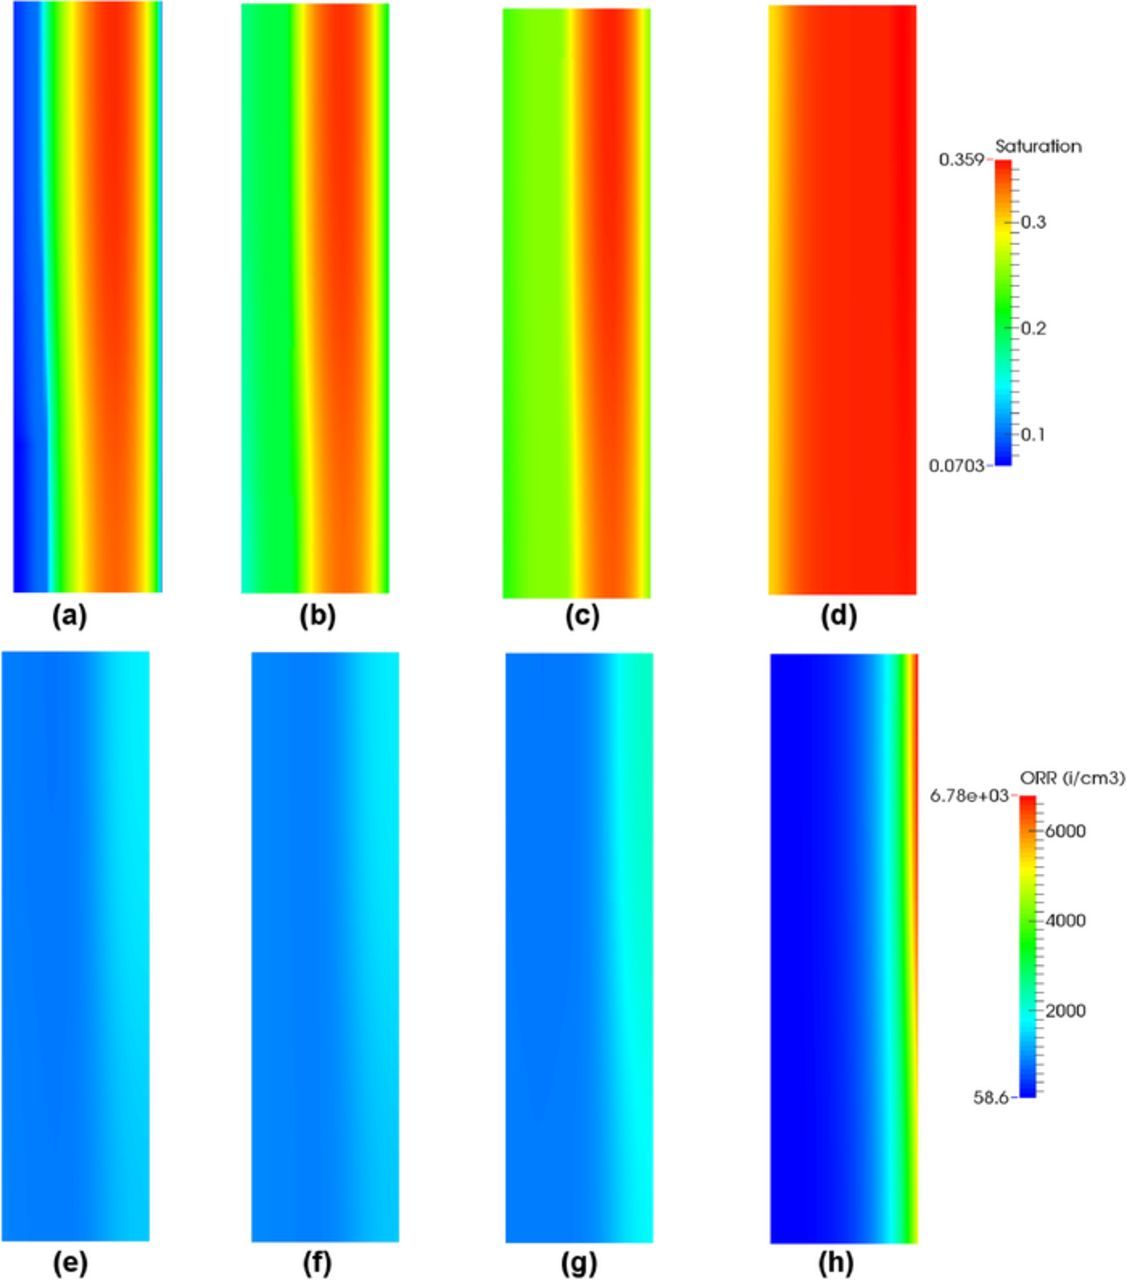
Figure 17. CL hydrophilic percentage study: distribution of saturation in the cathode CL, (a) 10% hydrophilic, (b) 20% hydrophilic, (c) baseline 25% hydrophilic, and (d) 35% hydrophilic, and distribution of volumectric ORR, (e) 10% hydrophilic, (f) 20% hydrophilic, (g) baseline 25% hydrophilic, and (h) 35% hydrophilic at current density 0.5 A/cm2.
Performance study of CL pore size distribution
In order to evaluate the impact of the CL pore size distribution on overall performance, a parametric study is performed by varying the CL PSD as follows: i) increase the overall pore size in the CL by 50%; ii) reduce the pore size by 20%; and iii) increase the pore size by 50% and assign the bigger PSD mode to the hydrophilic phase. The PSDs and the effects of CL PSD on performance are shown in Figures 18a and 18b. The results in Figure 18b indicate that a CL with larger pores will exhibit better performance. Also, it is preferred that the hydrophilic phase contains the smaller pores.
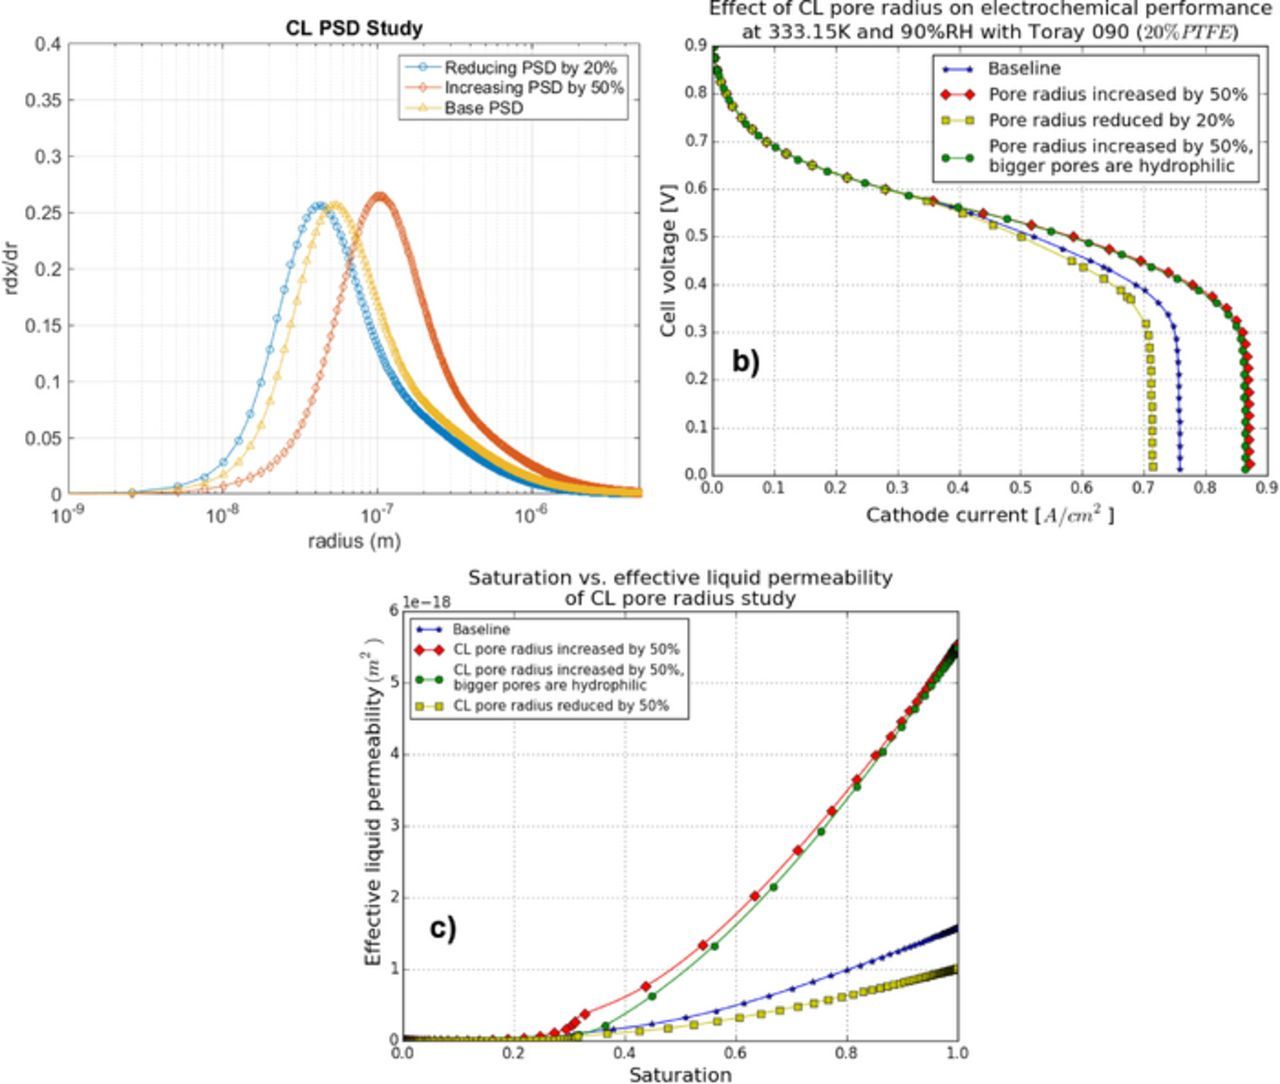
Figure 18. CL pore size distribution study: (a) the PSDs, (b) the MEA performance, and (c) saturation vs. effective liquid permeability.
The reason for the increased performance can be explained by the saturation-effective liquid permeability plot in Figure 18c. To mitigate the flooding, a larger CL PSD is required as it increases the effective liquid permeability which leads to a better liquid water rejection. With the same CL PSDs, the hydrophilic phase with smaller PSD mode shows an improvement in performance, because it requires less capillary pressure to be invaded.
GDL hydrophobic contact angle, hydrophilic volume fraction and pore size distribution
The effects of GDL contact angle, percentage of hydrophilic pores and PSD for Toray 090 are studied using the two-phase model. The cold/wet case is considered to have the highest two-phase flow impact, thus the simulations are run under this condition.
Performance study of GDL hydrophobic contact angle
In order to understand the impacts of GDL hydrophobic contact angle on the MEA performance, simulations are run at various hydrophobic contact angles, i.e., 95°, 110°, 120° and baseline (130°). Figure 19a shows the MEA performance with the above GDL contact angles. As compared to the CL contact angle study, GDL contact angles do not have a major influence on MEA performance.
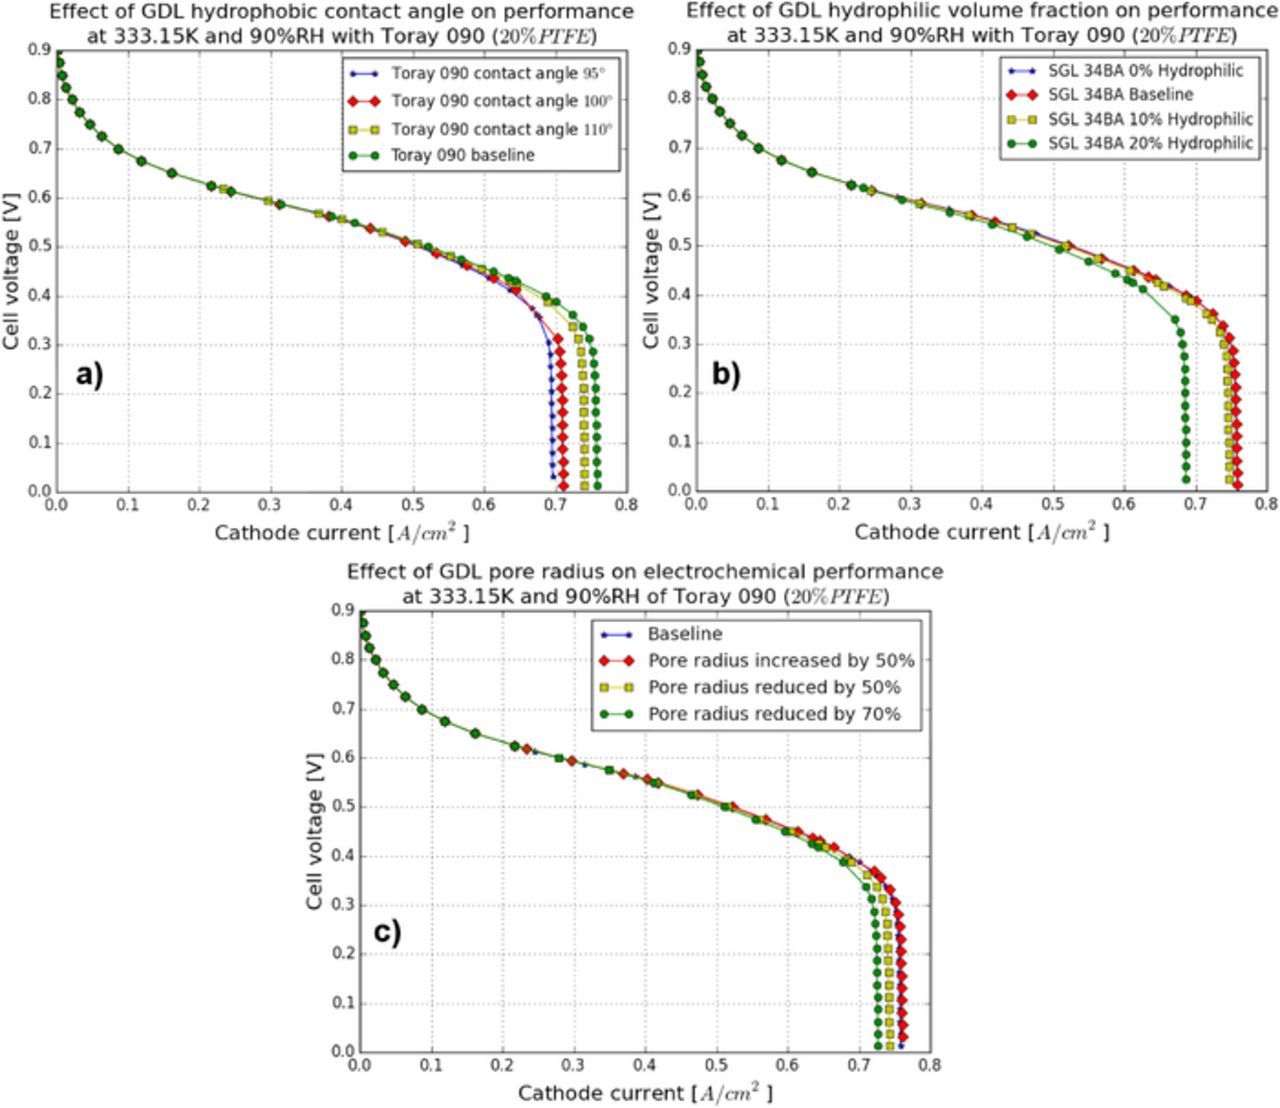
Figure 19. Polarization curves: (a) GDL contact angle study, (b) GDL hydrophilic volume fraction study, and (c) GDL pore radius study.
Performance study of GDL hydrophilic volume fraction
To study GDL hydrophilic volume fraction, simulations are performed by varying the GDL hydrophilic percentages, i.e., 0%, baseline (5%), 10% and 20%. The performances with the above GDL hydrophilic volume fractions are shown in Figure 19b. In comparison to the CL hydrophilic volume fraction study, the impact of GDL hydrophilic volume fraction on MEA performance is again small. No major difference in performance is observed among 0%, baseline case, and 10% GDL hydrophilic percentage. A reduction in performance is only observed at high current densities for 20% GDL hydrophilic percentage.
Performance study of GDL pore size distribution
To study how the GDL PSD affects performance, simulations are run for four cases: i) the baseline case; ii) the pore size increased by 50%; iii) the pore size reduced by 50%; and, iv) the pore size reduced by 70%. Again, the sensitivity of this model to this parameter is small. Only a small decrease in performance with reduced GDL pore radius is observed in Figure 19c. Further, there is no significant increase in performance with increasing GDL pore radius.
Conclusions
A multi-dimensional, non-isothermal, two-phase flow model developed in the open-source fuel cell simulation package OpenFCST30 is validated by comparing numerical predictions against experimental data under various operating conditions, imaging data at low temperatures and water fluxes.
Under hot/dry condition, two-phase model predictions coincide with single-phase model results because the MEA contains minimal amounts of water. In the hot/wet case, reduced performance at high current densities is observed due to water accumulation in the cathode CL even though the liquid water flux at the cathode boundary is zero at all current densities, highlighting that water is ejected in vapor form at the temperature of 80°C. In the cold/wet case, the performance decreases due to the partial flooding of the GDL and the formation of a thin water film in the cathode CL, which prevents oxygen from penetrating into the CL. The liquid water is also shown to leave the cathode boundary as evaporation is not enough to remove all water produced due to the reduced temperature.
Simulation results were compared to literature X-ray and water flux observations. The model saturation profiles in GDL and CL are in agreement with experiments. Water fluxes are also in agreement when the diffusion coefficient proposed by Fuller et al.27 and an EOD of one is used except for the case where cathode temperature is higher than anode. These results give us confidence in the proposed model.
Simulation at varying temperature are preformed. Results suggests that operating at high temperatures helps to mitigate flooding at high relative humidity. However, by increasing the temperature, the inlet reactant concentration decreases which prevents further improvement in performance at 90°C. Thus, at atmospheric pressure, 80°C appears to be the optimal temperature to effectively evaporate all liquid water in the MEA and provide sufficient reactant to improve the fuel cell performance.
The PSD-based MEA model is used to study the effect of micro-structural changes in porous media, such as changes in PSD, hydrophilic volume fraction and contact angle, on fuel cell performance. Two GDLs, i.e., SGL 34BA and Toray 090 (20% PTFE), with different PSDs, contact angles and hydrophilic volume fractions are studied using the two-phase model. The model predictions are in agreement with experimental results with SGL 34BA showing better performance than Toray 090 for all cases. The improved performance is due to larger porosity, permeability (bigger pores), contact angle and interfacial surface area (smaller pores in hydrophilic phase) for the SGL 34BA.
Parametric studies to analyze fuel cell performance sensitivity to changes in CL and GDL hydrophilic volume fraction, hydrophobic contact angle and PSD showed that the MEA performance is more sensitive to changes in CL microstructure than GDL. An electrode microstructure with a large hydrophobic contact angle, relative low hydrophilic volume fraction, and larger pore radius appears to give optimal results.
Acknowledgments
The authors thank Mark Dumontier for measuring the PSD of the Toray 090 and SGL 34BA GDLs. The authors thank the Natural Sciences and Engineering Research Council of Canada (NSERC), the NSERC/APC Catalyst Research for Polymer Electrolyte Fuel Cells (CaRPE-FC) network, and the Canadian Foundation for Innovation (CFI) for their financial assistance.