Abstract
La1-x-ySrxAgyMnO3-δ was synthesized via modified Pechini method. Silver (Ag) was incorporated into La1-x-ySrxAgyMnO3-δ cathode material for solid oxide fuel cells as a catalyst precursor for oxygen reduction reaction. The La1-x-ySrxAgyMnO3-δ perovskite single phase formed at 800°C, and the solubility of Ag in the crystal lattice of the perovskite was up to 5 mol%. The single-phase materials revealed thermal stability in different oxidizing atmospheres up to sintering temperature of the cathode at 1050°C. The exsolution of the metallic Ag nanoparticles was performed at 350–600°C in reducing atmosphere. Scanning electron and scanning transmission electron microcopy revealed a good mechanical contact of the Ag nanoparticles to the surface of the perovskite after reducing conditions. The electrochemical tests of the materials showed a good electrocatalytic effect of nanosized Ag toward oxygen reduction reaction. The electrochemical performance of the cathodes revealed the dependence on electrolyte material and exsolution time.
Export citation and abstract BibTeX RIS

This is an open access article distributed under the terms of the Creative Commons Attribution 4.0 License (CC BY, http://creativecommons.org/licenses/by/4.0/), which permits unrestricted reuse of the work in any medium, provided the original work is properly cited.
Solid oxide fuel cells (SOFCs) have attracted much attention as a potential alternative to conventional combustion-power plants for electrical power generation due to their high efficiency together with low emission and excellent fuel flexibility.1,2 Decreasing the operating temperature to the intermediate range (500−800°C) is an important step toward the widespread commercialization of SOFCs technology, while the lack of stable cathode material with sufficiently high activity for oxygen reduction reaction (ORR) has become the main obstacle.3,4 Recently, much effort has emerged toward the development of alternative cathode materials with enhanced ORR activity at intermediate temperatures to compromise between cost, performance, and durability.3,4 An important direction in SOFC research is the development of high-performance cobalt-free perovskite oxides as alternative electrode materials for operation at intermediate temperatures.3,4 Iron-based perovskites have received particular attention because of high abundance, low cost, and favorable stability of iron oxide.5–9 Unfortunately, the electrocatalytic activity of most iron-based perovskite electrode materials for ORR is still not high enough at intermediate temperatures.
The formation of composite electrodes10,11 and the design of unique electrode architectures12–16 have widely emerged as alternative strategies for improving the electrode performance and stability.17 Infiltration has been the most applied technique for introducing the nanoparticles onto electrode surfaces.18–22 The modification of selected electrodes with some precious metals (Ag, Pd, and Pt),23–26 or perovskite oxide-based nanoparticles,12–14 has been reported as significantly enhancing the catalytic activity of the electrodes toward ORR. Some potential drawbacks of the infiltration method may include non-uniform distribution of the as-prepared nanoparticles, reduced porosity of the electrode, and complicated processing procedures.27 Coarsening of nanoparticles at elevated temperatures is also a serious concern for most nanoparticle-modified electrodes.28 On the other hand, exsolution enables a novel approach to nanodesign the electrodes increasing the effective surface area and enhancing the catalytic activity of the materials for various electrochemical applications.17,23,29–36
Silver (Ag) is known to improve the oxygen exchange reaction activity.23 Ag-containing electrodes have shown high activity toward ORR making Ag as an efficient and promising component for SOFC cathodes.37–39 Attempts were made to either mix or impregnate SOFC cathodes (e.g. LaxSryMnO3-δ, LSM) with Ag.40–42 Problems can arise during impregnation due to low adhesion forces between the Ag precursor solutions and the ceramic cathode material.27 On the other hand, mechanical mixing of metals and ceramics always comprise the ductility of the metal, what makes the particles rolled to irregular flat bands destroying the microstructure of the cathode.43 Attempts were made to apply La0.65Sr0.3MnO3-δ as a SOFC cathode materials synthesized by the Pechini method with small amounts of very finely and homogeneously distributed Ag.40 The solubility of Ag in the La0.65Sr0.3MnO3-δ perovskite was lower than 1 wt%, while higher amounts of Ag segregated as solid metal. The SOFC cathode produced a moderate current density due to the low sintering temperature to avoid melting of Ag.40 Recent study has shown that Ag-modified LSM can be introduced as a novel precursor for nanosized silver decorated LSM electrode under cathodic polarization with improved stability and in situ electrochemical regeneration capability with the electrochemical intercalation/de-intercalation of Ag metal, however not fully understood and sufficiently supported in the article.41 Application of exsoluted Ag has recently arisen as a novel heterostructured cathode based on Sr0.95Ag0.05Nb0.1Co0.9O3‑δ (SANC) with the exsoluted Ag nanoparticles on an active perovskite backbone.23 The cathode had low ASR value (∼0.214 Ω cm2 at 500°C) and the peak power density of ∼1.116 W cm−2 at 500°C. Thus, the design concept may open up a brand new approach to the fabrication of stable and high performance cathodes for the SOFCs.
Here we report on an alternative method for the synthesis of Ag-doped LaxSryMnO3-δ-based materials (LSAM), which is suitable for producing Ag-doped single phase LSM-based perovskite oxides. A very homogeneous distribution of Ag on the surface of A-site deficient perovskite was determined after ex situ performed exsolution in reducing atmosphere. The cathode materials were characterized by X-ray powder diffraction (XRD), surface area [according to Brunauer, Emmett and Teller (BET)], temperature programmed reduction (TPR), scanning electron (SEM) and scanning transmission electron (STEM) microscopies. The influence of exsolution of Ag on the electrochemical performance of the cathode material was evaluated by symmetric cell tests on 8% yttria-stabilized zirconia (YSZ8) and 10% gadolinia-doped ceria (CGO10).
Experimental
Synthesis of the materials
The ceramic cathode materials with the nominal composition La1-x-ySrxAgyMnO3-δ (LSAM), where x = 0.15 and 0.3; y = 0–0.05 were prepared by a modified citrate complexation method (modified Pechini method) and is summarized in Figure 1. The appropriate amount of EDTA was dissolved in diluted NH3 solution followed by the addition of AgNO3. The solution with pH∼12 was mixed for a while and citric acid was added until completely dissolved. The amount ratio of total metal ions, EDTA and citric acid was optimized to be 1:2:3. The pH of the solution was adjusted to 7–8. La(NO3)3·6H2O, Sr(NO3)2 and Mn(CH3COO)2·4H2O (Sigma Aldrich and Merck, Germany; quality: >99.9% analytical pure) were dissolved separately in de-ionized water and slowly added to the main solution to avoid any precipitation. The solution was stirred at ambient temperature for 1 h with the following temperature increase to 90°C for the solvent to evaporate until the gelation started. The gel was precalcined at 250°C for 5 h and afterwards fired at 800°C for 15 h to combust all organic compounds, to decompose the nitrate ions and to obtain the main phase of the cathode materials. The residue was a fine dark black powder, which was further grinded on an agate mortar.
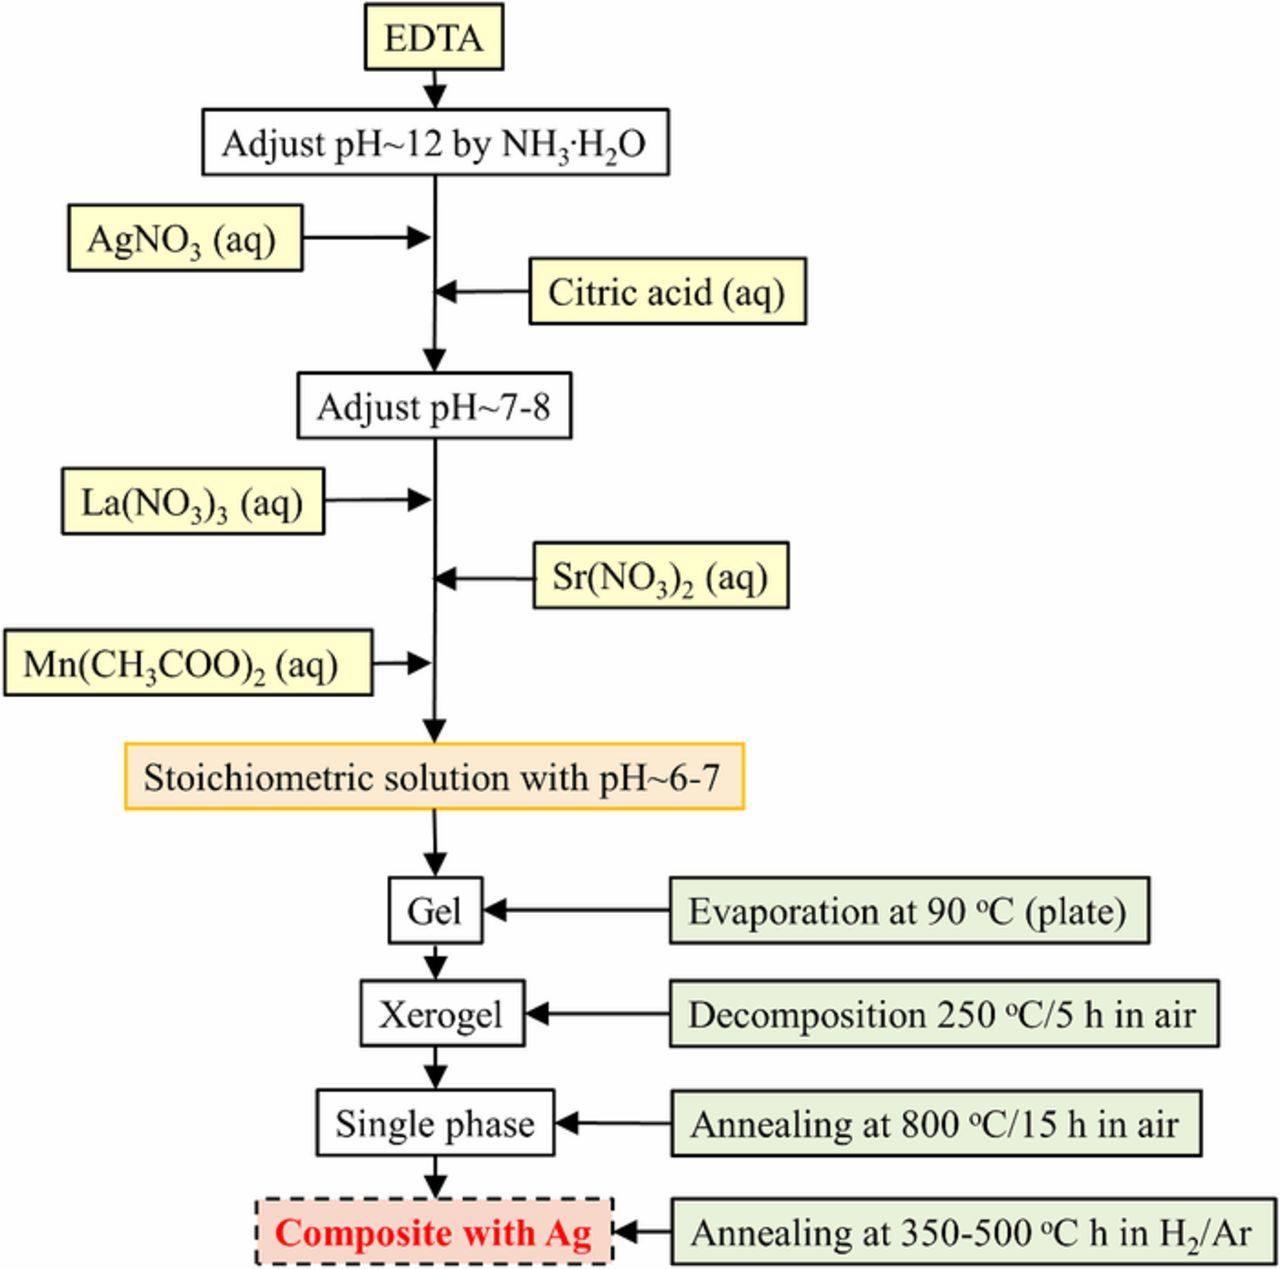
Figure 1. The schematic of the synthesis method for the LSAM materials. The ex situ exsolution conditions are included.
The pure La1-xSrxMnO3-δ (LSM, x = 0.15 and 0.3) without Ag used as a reference were powders synthesized by the modified Pechini method.
The ex situ exsolution of Ag nanoparticles was performed in a tube furnace at 350–600°C for 2–15 h in a 50 ml/min flow of 5% H2/Ar.
Materials characterization
Phase purity of the powders was confirmed by powder XRD using a Bruker D8 diffractometer (USA) with filtered CuKα1 irradiation at 40 kV and 44 mA. The diffraction patterns were collected at room temperature by step scanning in the range of 15 ≤ 2θ ≤ 90° with a scan rate of 0.6–2° min−1. The sample was equilibrated for 5 min at each temperature. The Rietveld refinement was performed with Winpow software (DTU, Denmark) using an orthorhombic structure model Pbnm (No. 62) for the perovskite and a cubic structure model  (No.221) for Ag. Initially, refinements were performed varying global parameters such as lattice parameters, peak shape parameters, background, phase fractions and sample displacement correction. Finally, fitting of the fractional occupancy and isotropic atomic displacement factors (ADFs) was also done. The surface area was determined by means of BET using Quantachrome iQ Autosorb Automated Gas Sorption System (USA). SEM imaging was carried out with TM3000 and Carl Zeiss Merlin field emission (Germany) scanning electron microscopes in secondary electron (SE) and back-scattered electron (BSE) modes. The InLens, HE-S2 and AsB detectors were used in the Zeiss Merlin electron microscope. Scanning transmission electron microscopy was performed with JEOL 3000F microscope.
The oxygen nonstoichiometry and the average oxidation state of Mn in LSAM and LSM oxides were measured by iodometric titration.44 Approximately 30–35 mg of sample was dissolved in a round-necked vessel in HCl solution. The residue of AgCl2 was filtered away, washed and weighed in order to determine the amount of Ag in the materials. An excess of potassium iodide (KI) and ca. 10–20 ml distilled degassed water were added. Then the vessel was closed and slightly heated in order to fully dissolve the sample. Iodometric titration of the rest of the solution was performed using 0.01 M thiosulfate (S2O32–) solution. Starch was used as an indicator.
The synthesized powders were further ball milled for 24 h in isopropanol and mixed with 10% gadolinia-doped ceria (CGO10) or 8% yttria-stabilized zirconia (YSZ8, Tosoh, Japan) in order to obtain the inks for electrochemical cells with LSAM-based cathodes. The dry powder mixture was combined with Disperbyk180 dispersant in dipropylene glycol (DPG). Further, the appropriate amounts of graphite and Santicizer 261 were added as a poreformer and a plasticizer, respectively. Poly(methyl methacrylate) (PMMA) was used as an additive and polyvinylpyrrolidone (PVPK90) was used as a binder. All the constituents were mixed with ZrO2 balls for 72 h to form a paste, which was then screen-printed on top of an 8 mol% yttria-stabilized zirconia (8YSZ) and 10% gadolinia-doped ceria (CGO10) electrolytes of about 300 μm in thickness. A 'functional layer' of 15–20 μm in thickness consisting of a mixture of 60% 8YSZ or CGO10 and 40% LSAM was deposited. The sintering of the electrodes was carried out at 1050°C for 2 h in air.
Electrochemical measurements
The electrochemical cell tests were performed on 6 × 6 mm2 symmetric cells with platinum coating as a current collector. The measurements were done in an alumina housing in 20% O2/Ar. The electrical contact was made by means of a fine gold mesh and the samples were mounted in a setup with gold meshes kept in contact with the cells with alumina bar load. Before mounting the samples, Pt-paste (Engelhard) was added on top of the cells and sintered in situ at 850°C. The electrochemical impedance spectroscopy (EIS) was performed using a Gamry Reference 600 potensiostat/galvanostat impedance analyzer. The setup used for the measurements has been described elsewhere.45 The EIS was recorded on the samples as follows. The frequency window spanned was 1 MHz to 0.05 Hz. Six points were measured at each decade. An amplitude of 24 mV was used throughout. The measurements were done at temperatures of 800, 700, 600°C and 500°C in the above order. The in situ exsolution was performed in 5% H2/Ar before the measurements in 20% O2/Ar. All measurements were done on four identical symmetrical cells. The fitting of the data was done using the Elchemea Analytical (DTU Energy)46 with the circuit Rs(R1Q1)(R2Q2)(R3Q3), where R is a resistance and Q is a constant phase element with the admittance
![Equation ([1])](https://content.cld.iop.org/journals/1945-7111/166/2/F79/revision1/d0001.gif)
where Y0 and n are found from the fitting. ω is the cyclic frequency. In the fitting, the n values were at first allowed to vary freely. After fitting, all the data and the averages of the n values were found. The data were then fitted again using the averages of the n values using equations as follows47
![Equation ([2])](https://content.cld.iop.org/journals/1945-7111/166/2/F79/revision1/d0002.gif)
![Equation ([3])](https://content.cld.iop.org/journals/1945-7111/166/2/F79/revision1/d0003.gif)
Results
The procedure of the optimized wet chemical synthesis route for La1-x-ySrxAgyMnO3-δ (LSAM) and exsolution of Ag nanoparticles is shown in Fig. 1. Fig. 2 summarizes the XRD results of heat-treatment conditions of LSAM materials in air. The phase pure orthorhombic Ag-doped LSAM perovskite is obtained after firing at 800°C for 15 h in air. The lower the calcination temperature, the more amount of metallic Ag is detected. The shift of peak positions of the orthorhombic LSAM phase are highlighted in Fig. 3. Upon increase of the Ag doping level in LSAM, the cell volume of the perovskite increase (Fig. 3 and Table II). The XRD results in Table II indicate that the exsolution process in reducing atmosphere induces expansion of the lattice according to the increase in cell parameters and cell volume, respectively. The lattice parameter of the cubic Ag structure was ∼4.08 Å. The weight percent of Ag in the composites are summarized in Table II showing close proximity of experimental values to the theoretical results.
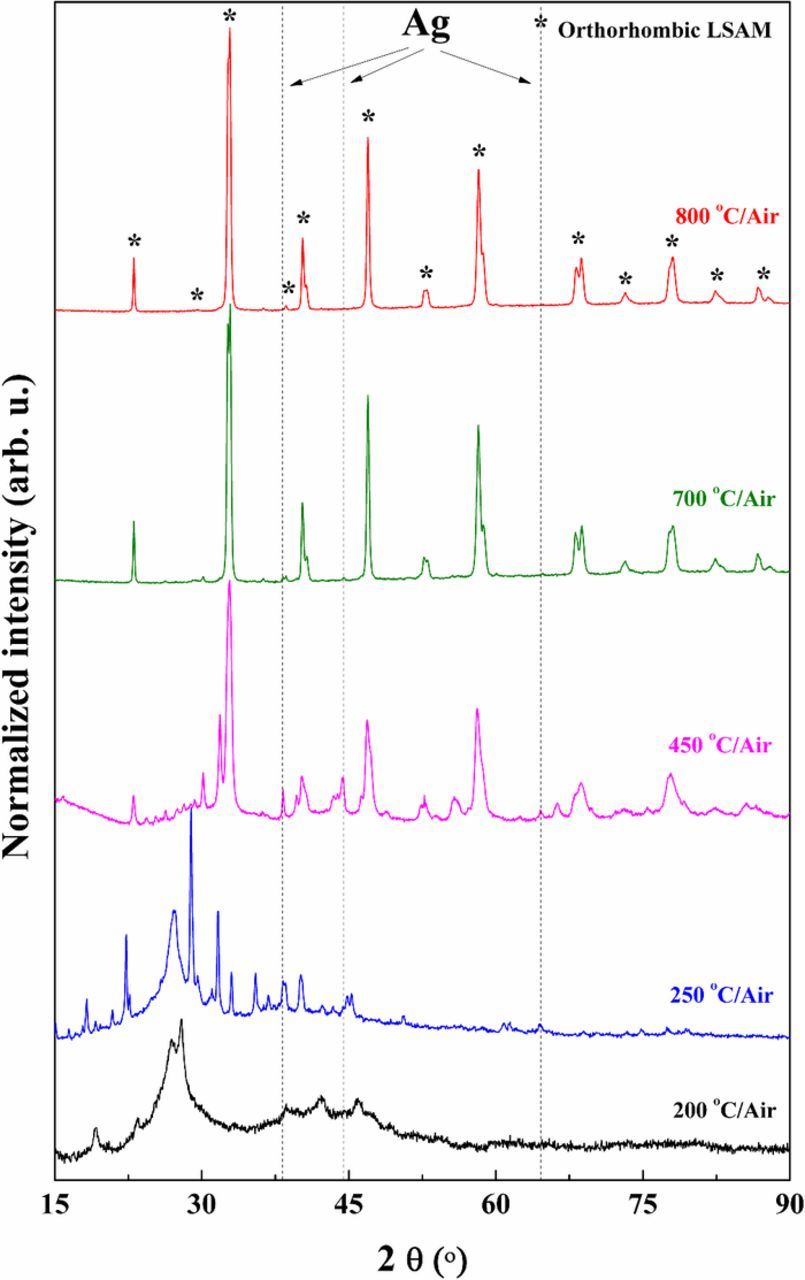
Figure 2. XRD results for the powders synthesized at different temperature for 15 h in air. The main peak positions of the cubic Ag phase are marked with the dashed lines.
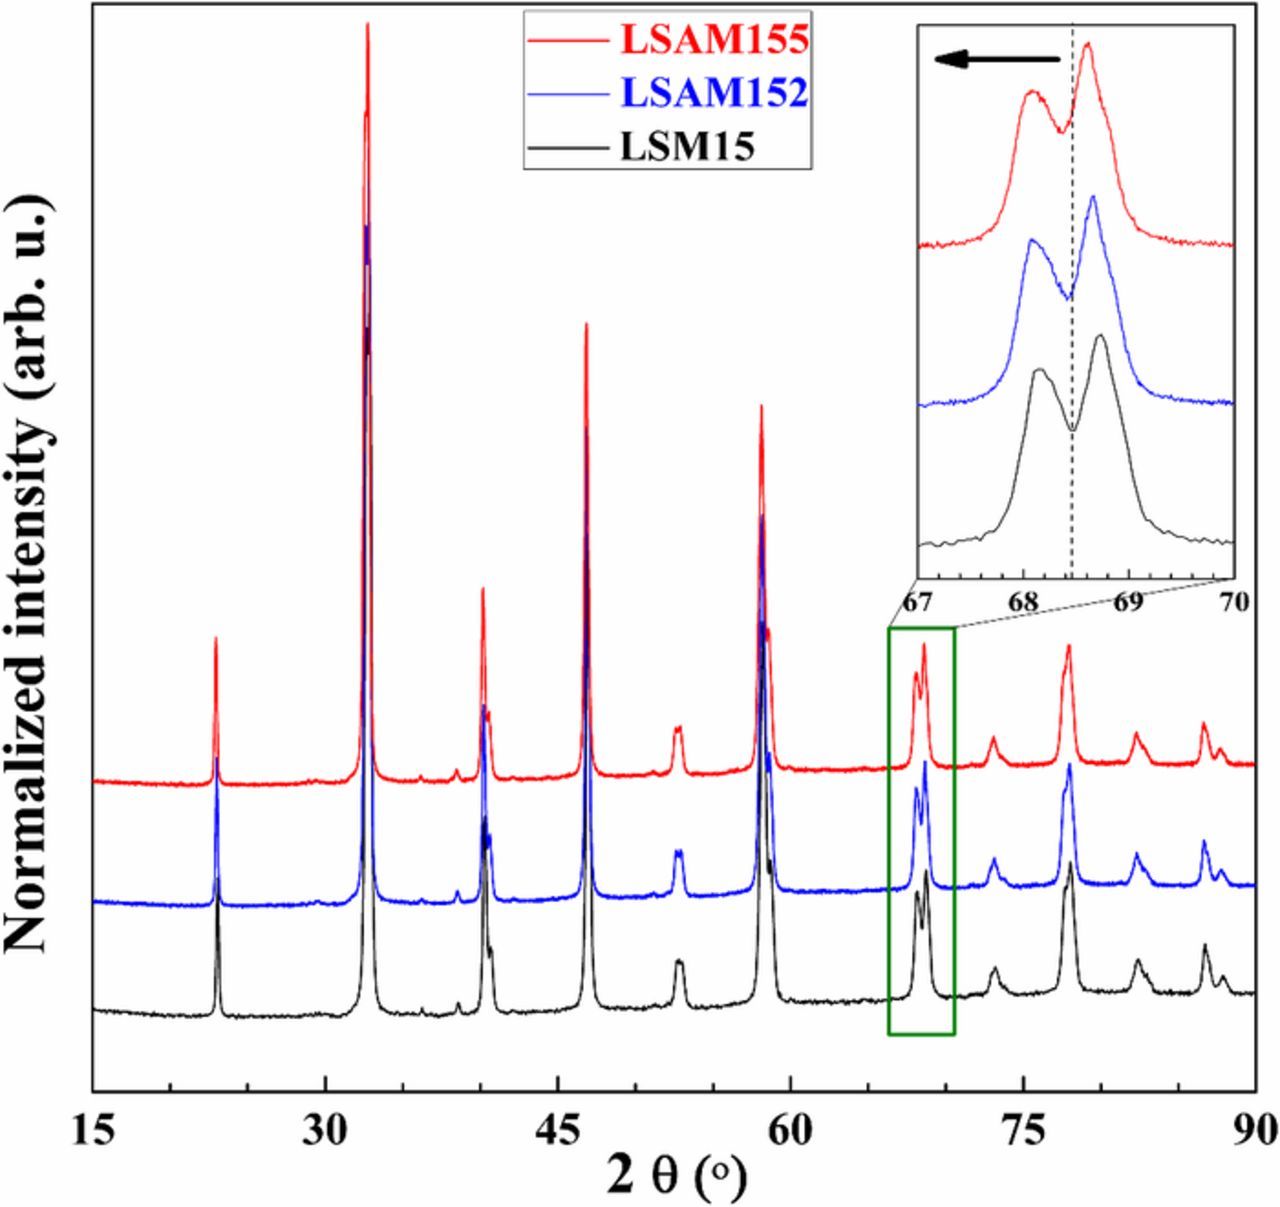
Figure 3. XRD of the single-phase LSAM materials without Ag (black), with 2 mol% (blue) and 5 mol% (red) of Ag.
Table II. The results of powder sample characterization. Exsolution was performed at 350°C for 2 h.
| Cell parameters (Å) | ||||||||||
|---|---|---|---|---|---|---|---|---|---|---|
| Perovskite (orthorhombic) | Ag (cubic) | |||||||||
| Volume, | Density, | Volume, | Density, | Wt%* | BET surface | |||||
| Material | a | b | c | Å3 | g·cm−3 | a | Å3 | g·cm−3 | (Theo wt%) | area (m2/g) |
| LSAM152 | 5.517 ± 0.001 | 5.461 ± 0.001 | 7.754 ± 0.002 | 233.63 ± 0.09 | 6.638 | - | - | - | - | 3.112 |
| LSAM152ex | 5.543 ± 0.001 | 5.508 ± 0.001 | 7.830 ± 0.001 | 239.06 ± 0.08 | 6.487 | 3.975 ± 0.001 | 62.82 ± 0.04 | 11.40 | 0.9 (0.9) | 3.155 |
| LSAM155 | 5.517 ± 0.001 | 5.464 ± 0.001 | 7.753 ± 0.001 | 233.75 ± 0.05 | 6.608 | - | - | - | - | 2.933 |
| LSAM155ex | 5.531 ± 0.001 | 5.508 ± 0.001 | 7.852 ± 0.002 | 239.24 ± 0.06 | 6.307 | 4.077 ± 0.001 | 67.77 ± 0.03 | 10.57 | 1.5 (2.3) | 3.326 |
| LSM15 | 5.516 ± 0.001 | 5.459 ± 0.001 | 7.747 ± 0.002 | 233.28 ± 0.09 | 6.666 | - | - | - | - | 2.014 |
| LSM30 | 5.503 ± 0.001 | 5.436 ± 0.001 | 7.716 ± 0.002 | 230.83 ± 0.06 | 6.726 | - | - | - | - | 2.077 |
The oxygen nonstoichiometry and the mean valence of Mn of the LSM15 (15 mol% Sr), LSAM152 (15 mol% Sr and 2 mol% Ag) and LSAM155 (15 mol% Sr and 5 mol% Ag) powders were evaluated by iodometry (Table I). LSAM shows slightly higher average valences of Mn ions and reduced oxygen vacancy concentration as compared with LSM15. The amount of Mn4+ increases with the increase of Ag doping level in LSAM. This supports doping of Ag into the A-site of the perovskite lattice as targeted. Table II shows the results of the structural XRD analysis and the BET surface area for the La1-x-ySrxAgyMnO3-δ cathode materials calcined at 800–1100°C including Ag-free LSM materials. The BET surface area was around 3 m2/g for all samples, which is larger than for the Ag-free powders (2 m2/g), and the influence of Ag on the BET surface area can be seen. The difference in the BET surface area for the samples before and after exsolution can be determined.
Table I. The results for iodometric titration of the La0.85-xSr0.15AgxMnσ+O3-δ materials.
| Parameters | ||||||
|---|---|---|---|---|---|---|
| Material | Synthesis temperature (°C) | x (theor.) | x (exper.) | δ | σ | Mn4+ (%) |
| LSM15 | 800 | 0 | - | 0.013 | 3.124 | 12.4 |
| LSAM152 | 0.02 | 0.0192 | 0.0292 | 3.131 | 13.1 | |
| LSAM155 | 0.05 | 0.0489 | 0.0041 | 3.168 | 16.8 | |
Fig. 4 shows the XRD results for the exsolution of Ag nanoparticles from LSAM155 perovskite material. It can be seen that the main peaks of cubic Ag are visible after heat-treatment of LSAM materials at 450°C for 5 h in 5% H2/Ar. The exsolution conditions were investigated experimentally at 350–600°C. The exsolution at 350°C is very slow and was chosen first to avoid decomposition of LSM phase which decomposes at >550°C into different oxides. The reduction of the LSAM material induces the shift of the XRD peak positions to lower 2θ angles (Fig. 4).
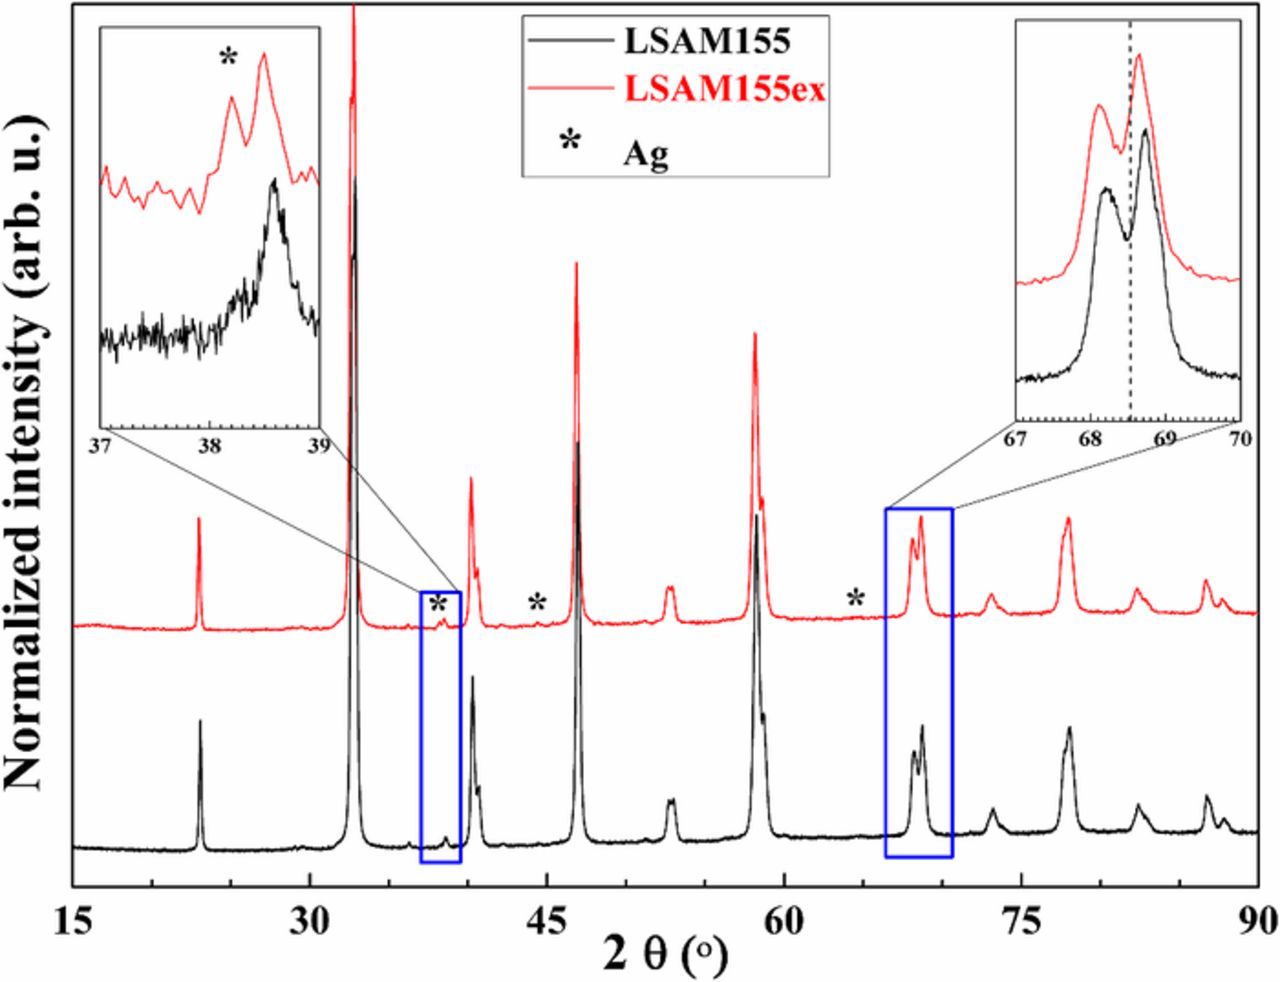
Figure 4. XRD results for the LSAM155 material before (black) and after (red) exsolution of the Ag nanoparticles at 350°C for 2 h in the flow of 5% H2/Ar.
The microstructure of LSAM155 before and after exsolution measured by SEM is shown in Fig. 5. The particle size of the materials after firing at 800°C for 15 h in air was found below 200 nm by linear intercept method (Fig. 5a). The particles are round-shaped. The microstructure of LSAM155ex material after exsolution of Ag nanoparticles is shown in Fig. 5b. Small Ag nanoparticles with different size are formed on the surface of the perovskite. Fig. 5c shows SEM micrograph in secondary electron mode (SE) with the Ag nanoparticles on the surface of the LSAM155ex perovskite. The round-shaped Ag nanoparticle size was determined below 20 nm. The same part of the microstructure of LSAM155ex material is represented in back-scattered electron mode (BSE) in Fig. 5d. The differences in the microstructure of the LSAM155ex perovskite and Ag metal nanoparticles can be observed. The microstructure of LSAM152 containing less Ag (2 mol%) is shown in Fig. 5e. Smaller amount of Ag in the LSAM materials results in smaller concentration of exsoluted Ag nanoparticles on the surface of the cathode. Fig. 5f shows STEM image of Ag nanoparticles and Fig. 5g EDS mapping results from STEM. The distinct nanosized Ag-rich regions can be seen on the surface of the materials.
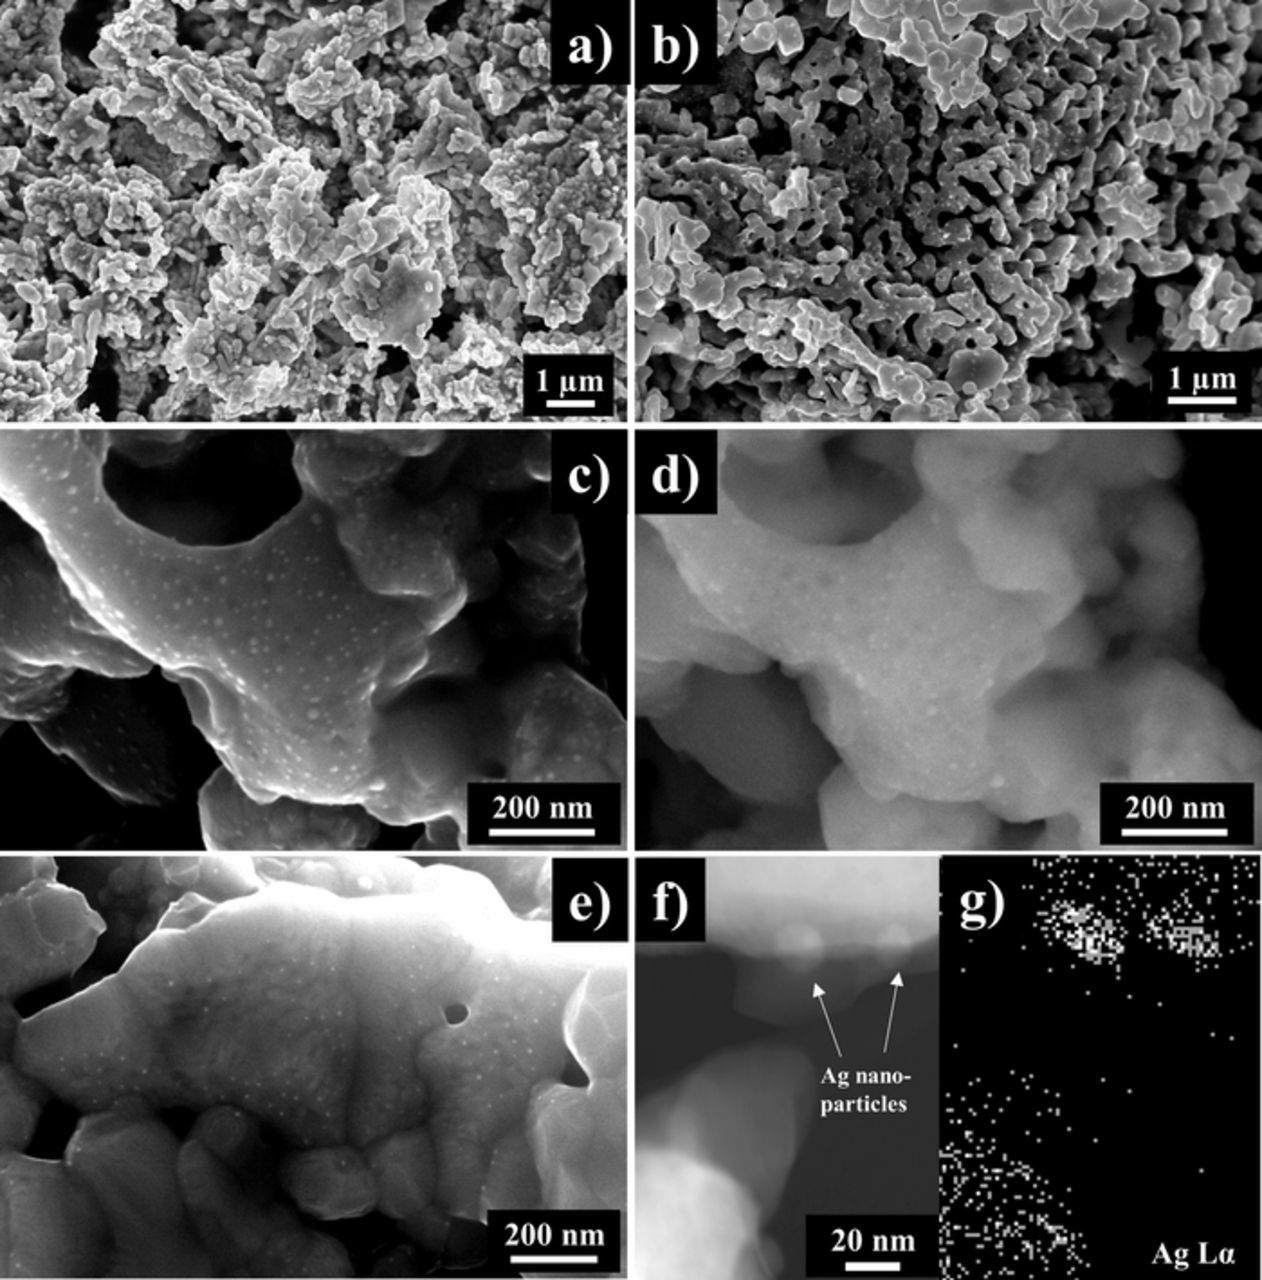
Figure 5. The images of the microstructure of (a) LSAM155 as-synthesized powder; (b) after heat-treatment at 450°C for 2 h in 5% H2/Ar; (c) LSAM155 with Ag nanoparticles after exsolution in SE mode and (d) BSE mode; (e) SEM image of LSAM152 after exsolution; (f) STEM image of LSAM155 and (g) STEM EDS mapping results of Ag nanoparticles.
The temperature dependence of the impedance data is illustrated in Fig. 6. The area specific resistance (ASR) is seen to decrease with increasing temperature. Fig. 7 gives an example of an impedance spectrum of a symmetrical cell, together with the results of the fitting. The data presented in Fig. 8 were recorded on a symmetrical cell in 20% O2/Ar at 600°C. It can be seen that the spectrum consists of three arcs (Figs. 7 and 8). In general, all the results from the EIS measurements at different temperatures could be fitted with an equivalent circuit with three (RQ) elements in series, together with a series resistance Rs. The results of the fitting, in terms of R values of the individual arcs, are given in Tables III together with Fmax and Cω. The variation in the data is based on measurements and fittings on four symmetrical cells. It is seen that all the arcs are temperature and exsolution time dependent. The exsolution time dependence is largest for the medium and low frequency arcs (Fig. 8). The n values vary between 0.5–0.85 for the high frequency arc, 0.68–0.85 for the medium frequency arc, and 0.38–0.53 for the low frequency arc. The near-equivalent capacities for all three arcs are smallest for the cells after 12 h of exsolution. The summit frequencies of the three arcs all depend on the exsolution time. The summit frequencies for the high frequency arc are largest for the cells before exsolution. The summit frequencies for the medium frequency arc are almost unaffected by exsolution time. The summit frequencies for the low frequency arc are largest for the cells before exsolution, and the effect is considerable.
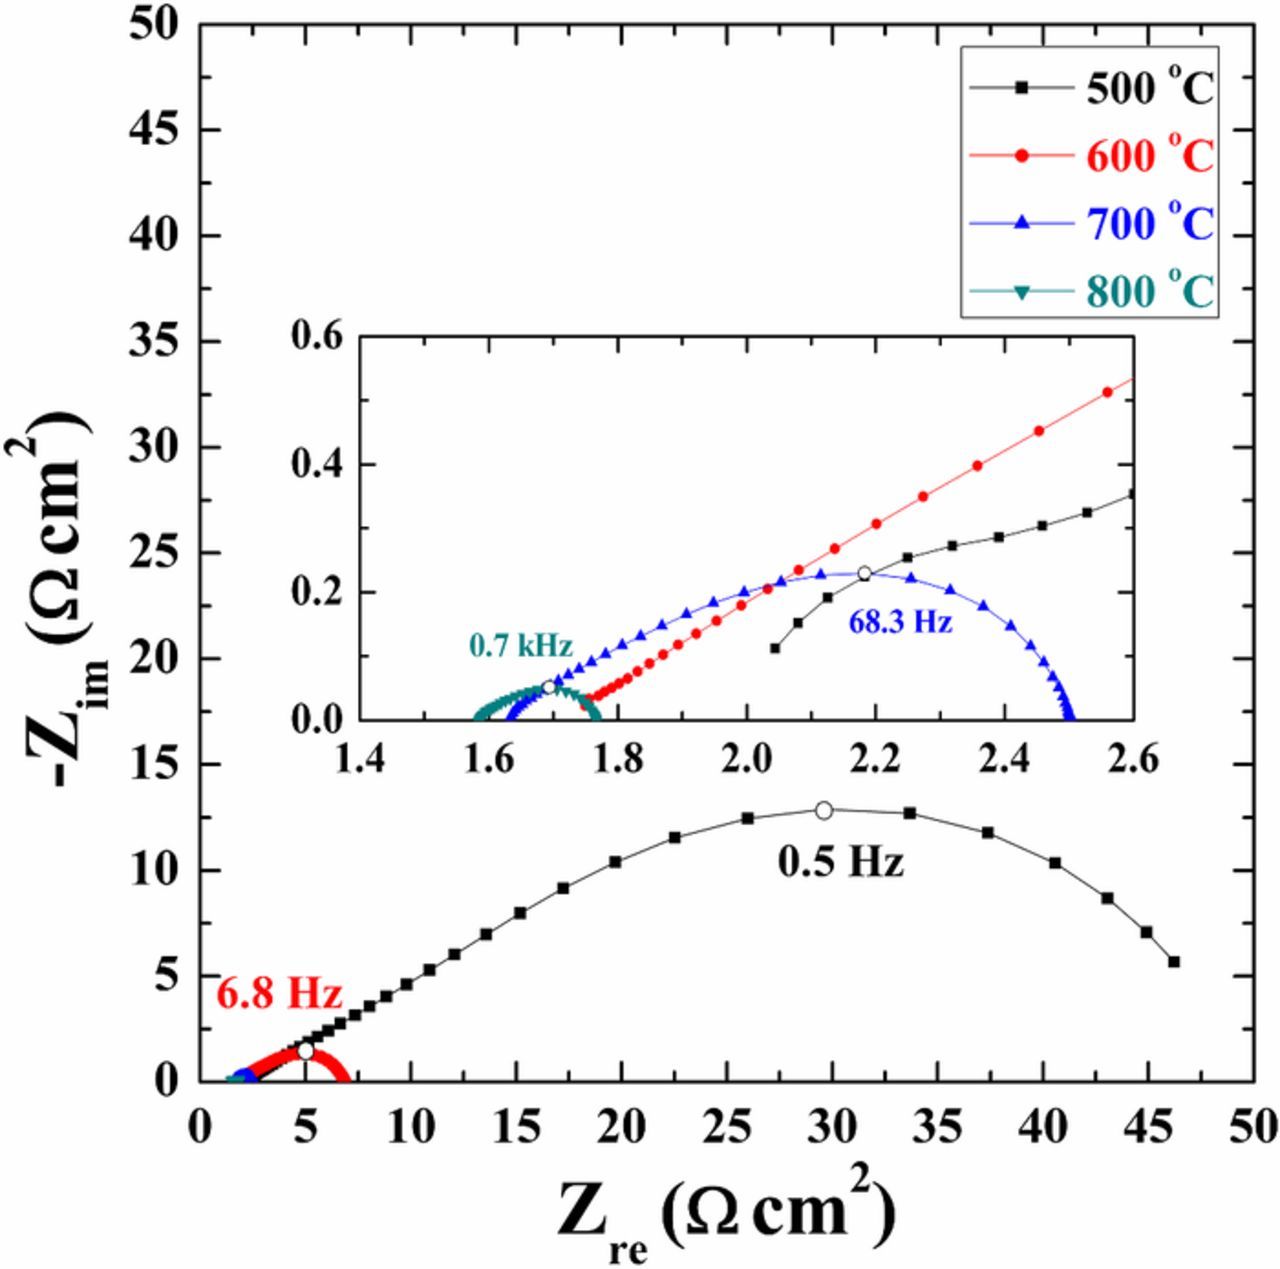
Figure 6. Electrochemical impedance spectra of a symmetrical cell with LSAM/CGO electrode recorded at 500, 600, 700, and 800°C in 20% O2 in Ar. The solid lines are fitted data; dots are measured data.
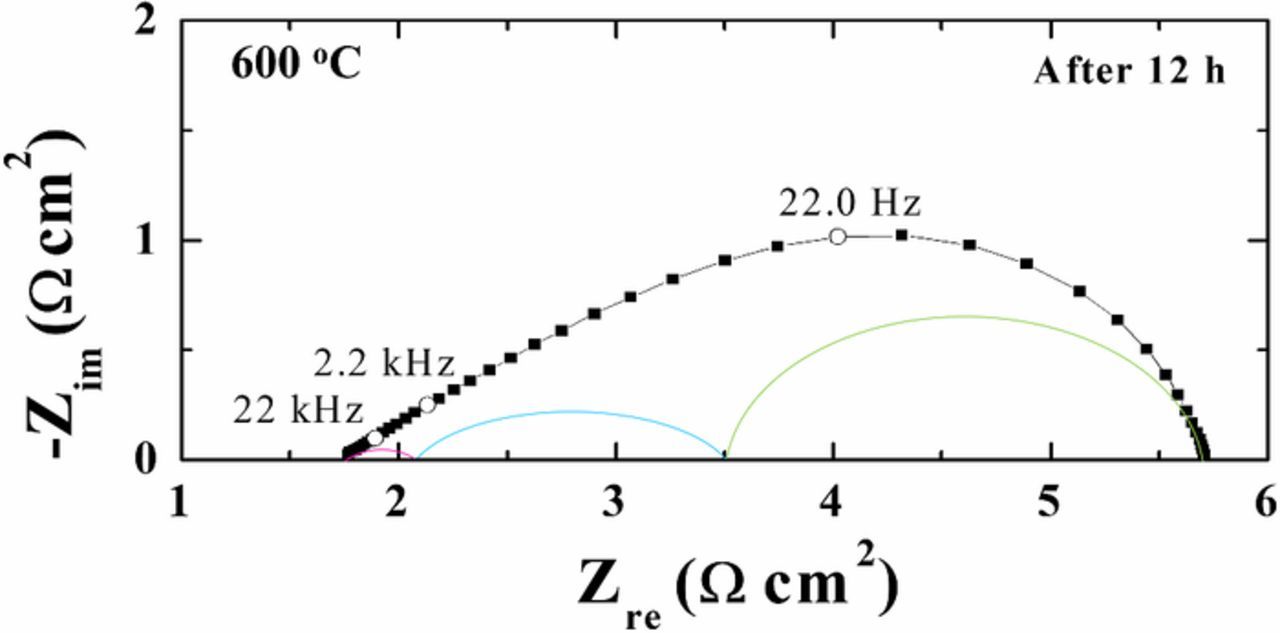
Figure 7. EIS spectrum of a symmetrical cell (porous LSAM/CGO/dense CGO/porous LSAM/CGO) in 20% O2 in Ar at 600°C, i.e., the response is from two electrodes in series with the electrolyte resistance. The colored lines are deconvolution of the data; the solid black line is the full fit.
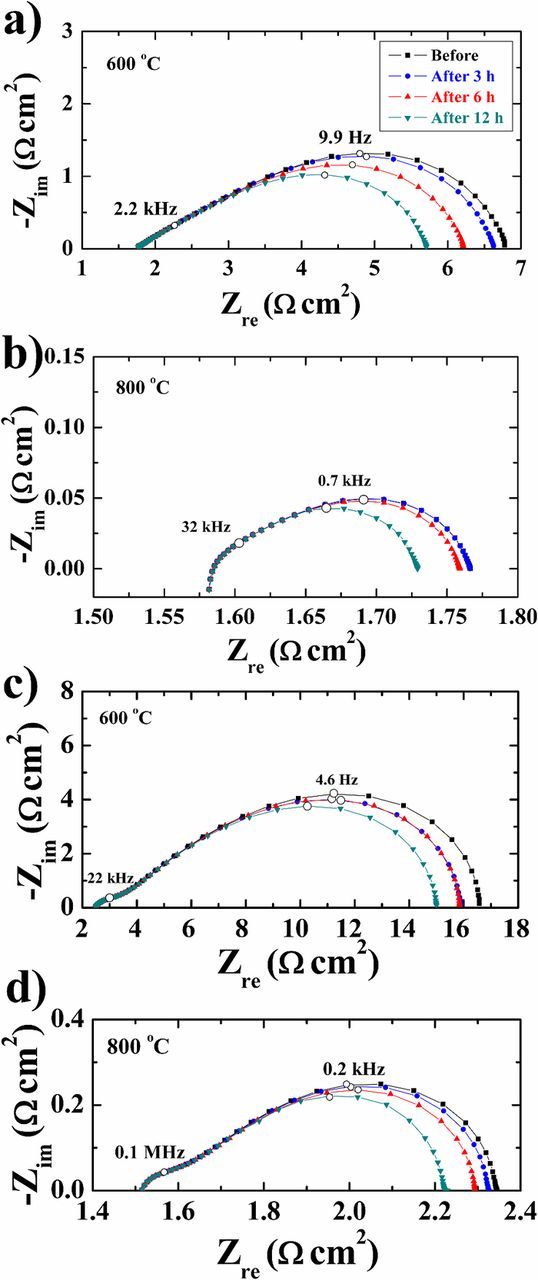
Figure 8. EIS spectra of a symmetrical cell with a (a)-(b) CGO and (c)-(d) YSZ recorded at 600 and 800°C in 20% O2 in Ar after 0–12 h of in situ exsolution in 5% H2 in Ar. The solid lines are fitted data; dots are measured data.
Table III. The R, Cω, and Fmax values of the individual arcs for symmetrical cells with a CGO and YSZ electrolytes in 20% O2 in Ar. R is given in Ω cm2, Cω is in μF cm−2, and Fmax is in Hz.
| High frequency | Medium frequency | Low frequency | ||||||||
|---|---|---|---|---|---|---|---|---|---|---|
| T, °C | Exs. time | R1, Ω cm2 | C1, μF cm−2 | F1, Hz | R2, Ω cm2 | C2, μF cm−2 | F2, Hz | R3, Ω cm2 | C3, μF cm−2 | F3, Hz |
| CGO | ||||||||||
| 500 | Before | 0.60 ± 0.01 | 0.05 | 1.96 | 23.70 ± 0.07 | 0.60 | 253 | 26.46 ± 0.08 | 21.20 | 0.4 |
| 600 | 0.28 ± 0.06 | 0.02 | 5.38 | 2.95 ± 0.05 | 0.14 | 608 | 1.83 ± 0.11 | 2.61 | 53.2 | |
| 700 | 0.09 ± 0.08 | 15.60 | 3060 | 0.22 ± 0.07 | 0.16 | 2280 | 0.46 ± 0.19 | 16.90 | 38.3 | |
| 800 | 0.06 ± 0.02 | 11.20 | 245000 | 0.04 ± 0.04 | 0.24 | 22300 | 0.08 ± 0.21 | 916 | 392 | |
| YSZ | ||||||||||
| 500 | Before | 5.47 ± 0.02 | 0.02 | 2160 | 51.56 ± 0.01 | 5.12 | 1.5 | 41.79 ± 0.08 | 276 | 0.3 |
| 600 | 1.04 ± 0.04 | 0.04 | 11700 | 6.01 ± 0.02 | 4.38 | 23.3 | 7.33 ± 0.07 | 137 | 3.8 | |
| 700 | 0.25 ± 0.10 | 0.10 | 48200 | 1.11 ± 0.09 | 2.38 | 226 | 1.97 ± 0.03 | 68.00 | 27.1 | |
| 800 | 0.04 ± 0.05 | 0.78 | 184000 | 0.06 ± 0.03 | 0.66 | 22200 | 0.28 ± 0.11 | 28.80 | 399 | |
| CGO | ||||||||||
| 500 | 3h | 0.57 ± 0.06 | 9.22 | 317 | 21.44 ± 0.10 | 0.28 | 2 | 24.42 ± 0.05 | 223 | 0.4 |
| 600 | 0.27 ± 0.07 | 13.90 | 781 | 2.81 ± 0.11 | 0.15 | 6.4 | 1.84 ± 0.02 | 2.38 | 50.3 | |
| 700 | 0.24 ± 0.03 | 0.01 | 2780 | 0.20 ± 0.15 | 0.13 | 3740 | 0.41 ± 0.13 | 142 | 62 | |
| 800 | 0.06 ± 0.05 | 0.05 | 272000 | 0.04 ± 0.03 | 0.62 | 22200 | 0.08 ± 0.17 | 78.30 | 455 | |
| YSZ | ||||||||||
| 500 | 3h | 5.55 ± 0.11 | 0.02 | 2080 | 45.40 ± 0.03 | 5.10 | 1.9 | 39.2 ± 0.05 | 242 | 0.42 |
| 600 | 1.02 ± 0.12 | 0.04 | 12100 | 5.22 ± 0.09 | 2.81 | 7.8 | 7.08 ± 0.04 | 124 | 4.4 | |
| 700 | 0.24 ± 0.09 | 0.11 | 51100 | 0.90 ± 0.15 | 1.94 | 3310 | 1.916 ± 0.12 | 63.30 | 29.5 | |
| 800 | 0.04 ± 0.08 | 0.77 | 187000 | 0.04 ± 0.17 | 0.51 | 50300 | 0.25 ± 0.18 | 27.20 | 478 | |
| CGO | ||||||||||
| 500 | 6h | 0.34 ± 0.08 | 0.0408 | 326 | 18.12 ± 0.12 | 0.48 | 3.6 | 21.06 ± 0.03 | 167 | 0.6 |
| 600 | 0.28 ± 0.07 | 0.645 | 458 | 2.66 ± 0.25 | 0.10 | 8.3 | 1.83 ± 0.16 | 1.22 | 91.1 | |
| 700 | 0.26 ± 0.10 | 13.8 | 5030 | 0.20 ± 0.13 | 0.14 | 3950 | 0.41 ± 0.11 | 1.44 | 50.3 | |
| 800 | 0.08 ± 0.02 | 80.4 | 239000 | 0.04 ± 0. | 0.23 | 29600 | 0.06 ± 0.17 | 9.70 | 2700 | |
| YSZ | ||||||||||
| 500 | 6h | 5.80 ± 0.06 | 0.02 | 2120 | 36.12 ± 0.09 | 210 | 0.5 | 43.89 ± 0.12 | 4.79 | 2.2 |
| 600 | 1.02 ± 0.07 | 0.04 | 13000 | 4.58 ± 0.17 | 3.44 | 40.4 | 6.90 ± 0.03 | 98.50 | 5.6 | |
| 700 | 0.25 ± 0.02 | 0.10 | 52800 | 0.80 ± 0.11 | 1.68 | 448 | 1.90 ± 0.07 | 57.20 | 33.5 | |
| 800 | 0.04 ± 0.13 | 0.77 | 185000 | 0.03 ± 0.10 | 4.57 | 75800 | 0.24 ± 0.07 | 25.20 | 542 | |
| CGO | ||||||||||
| 500 | 12h | 0.30 ± 0.08 | 0.04 | 402 | 17.03 ± 0.08 | 0.45 | 4.3 | 20.45 ± 0.11 | 146 | 0.7 |
| 600 | 0.42 ± 0.07 | 0.01 | 2420 | 2.20 ± 0.07 | 92.10 | 10.8 | 1.42 ± 0.24 | 1.93 | 111 | |
| 700 | 0.25 ± 0.05 | 11.90 | 12300 | 0.19 ± 0.16 | 0.14 | 4880 | 0.39 ± 0.26 | 118 | 63.3 | |
| 800 | 0.04 ± 0.08 | 3.05 | 234000 | 0.03 ± 0.11 | 0.04 | 140000 | 0.07 ± 0.13 | 41.80 | 841 | |
| YSZ | ||||||||||
| 500 | 12h | 5.75 ± 0.07 | 0.02 | 2150 | 30.66 ± 0.06 | 179 | 0.7 | 38.71 ± 0.21 | 4.61 | 2.8 |
| 600 | 0.96 ± 0.03 | 0.04 | 14900 | 4.06 ± 0.07 | 3.35 | 49.8 | 6.56 ± 0.08 | 98.10 | 6 | |
| 700 | 0.24 ± 0.08 | 0.11 | 54700 | 0.60 ± 0.03 | 1.36 | 739 | 1.83 ± 0.03 | 54.30 | 36.5 | |
| 800 | 0.04 ± 0.04 | 0.78 | 189000 | 0.02 ± 0.12 | 4.05 | 115000 | 0.21 ± 0.13 | 24.10 | 674 | |
The Arrhenius plots for the total ASR with CGO and YSZ electrolytes are given in Fig. 9. The total ASR decreases with increasing temperature and exsolution time. The activation energies for the two types of cells and individual arcs are given in Tables IV and V, respectively. The slightly scattered activation energies do not show a clear dependence on the type of the electrolyte and on the exsolution time. The activation energies are almost constant with increasing exsolution time. The series resistance also depends on the CGO or YSZ electrolyte, however not on exsolution time. In a pure CGO electrolyte, the series resistance is around 1.3 Ω cm2 at 600°C, whereas it is around 2.2 Ω cm2 at 600°C when YSZ electrolyte is present.
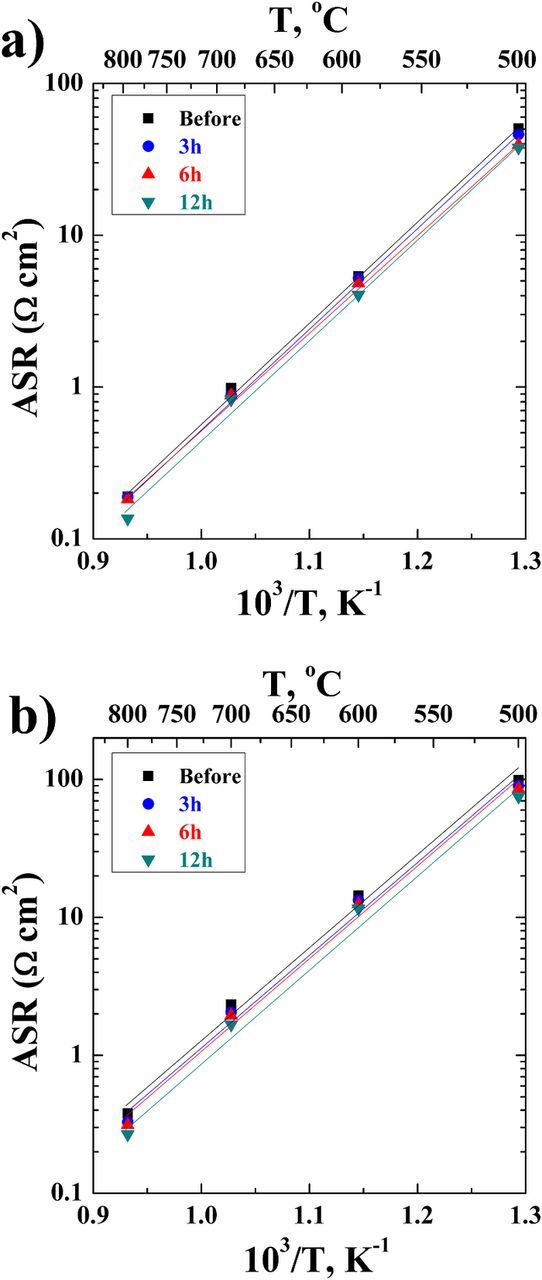
Figure 9. Arrhenius plots of the total ASR as a function of temperature and in situ exsolution time in 5% H2 in Ar for the cells with a (a) CGO and (b) YSZ electrolyte. The total ASR decreases with increasing exsolution time.
Table IV. Activation energies (eV) of the two types of cells in 20% O2 in Ar before and after exsolution in 5% H2 in Ar.
| Exsolution time | ||||
|---|---|---|---|---|
| Electrolyte | 0 h | 3 h | 6 h | 12 h |
| CGO | 1.32 ± 0.03 | 1.31 ± 0.02 | 1.27 ± 0.03 | 1.32 ± 0.06 |
| YSZ | 1.32 ± 0.08 | 1.33 ± 0.08 | 1.33 ± 0.08 | 1.34 ± 0.09 |
Table V. Activation energies (eV) of different arcs for the two types of cells in 20% O2 in Ar before and after in situ exsolution in 5% H2 in Ar.
| Exsolution time | |||||
|---|---|---|---|---|---|
| Electrolyte | R | 0 h | 3 h | 6 h | 12 h |
| CGO | R1 | 1.28 ± 0.16 | 1.28 ± 0.14 | 1.30 ± 0.14 | 1.29 ± 0.22 |
| R2 | 1.55 ± 0.10 | 1.53 ± 0.11 | 1.49 ± 0.11 | 1.53 ± 0.10 | |
| R3 | 1.17 ± 0.09 | 1.32 ± 0.06 | 1.37 ± 0.08 | 1.32 ± 0.09 | |
| YSZ | R1 | 1.17 ± 0.12 | 1.17 ± 0.11 | 1.17 ± 0.09 | 1.17 ± 0.10 |
| R2 | 1.55 ± 0.21 | 1.61 ± 0.23 | 1.62 ± 0.26 | 1.68 ± 0.28 | |
| R3 | 1.28 ± 0.04 | 1.16 ± 0.13 | 1.20 ± 0.12 | 1.20 ± 0.14 | |
Discussion
The performance of the electrodes, as reflected by the ASR values, is the best for LSAM/CGO composite cathodes with CGO electrolyte. A screen printed symmetrical cell containing Ag-decorated LSAM reveals improved electrochemical performance of the electrode after exsolution. The exsoluted Ag nanoparticles have enhanced activity of the electrodes, which is improving with exsolution time what could be attributed to the concentration of exsoluted Ag nanoparticles. On the other hand, the effect in general can be explained by Fig. 10. When the electrode material is subjected to reducing atmosphere (H2), the exsolution of Ag nanoparticles occurs. If the electrode material is a mixed ionic electronic conductor, almost all the exsoluted Ag nanoparticles are efficient toward ORR (Fig. 10, I) and the effect on the electrochemical performance of the electrodes would be considerable. If the cathode material is only electronic conductor, not all the exsoluted Ag nanoparticles would be efficient toward ORR (Fig. 10, II), and only those on triple phase boundaries (TPBs) between electrode, electrolyte and gas phases. Consequently, the effect on electrochemical performance will be gentle. All these processes are very dependent on LSAM and electrolyte composite processing, since LSAM is a good electronic conductor and composites with the electrolyte material increase ionic conductivity of the cathode and the length of TPBs. Including the fact that all the arcs in EIS (Table III) are dependent on the exsolution of Ag nanoparticles and exsolution time, it could be indicated that most of the processes occur close to the electrode–electrolyte–gas interface. The performance of the cells with YSZ is worse due to less contact points between the LSM/YSZ/Ag cathode and the YSZ electrolyte compared to the probable amount of contact points between the LSM/CGO/Ag cathodes and the CGO electrolyte. The conductivity of the electrolyte material plays an important role.
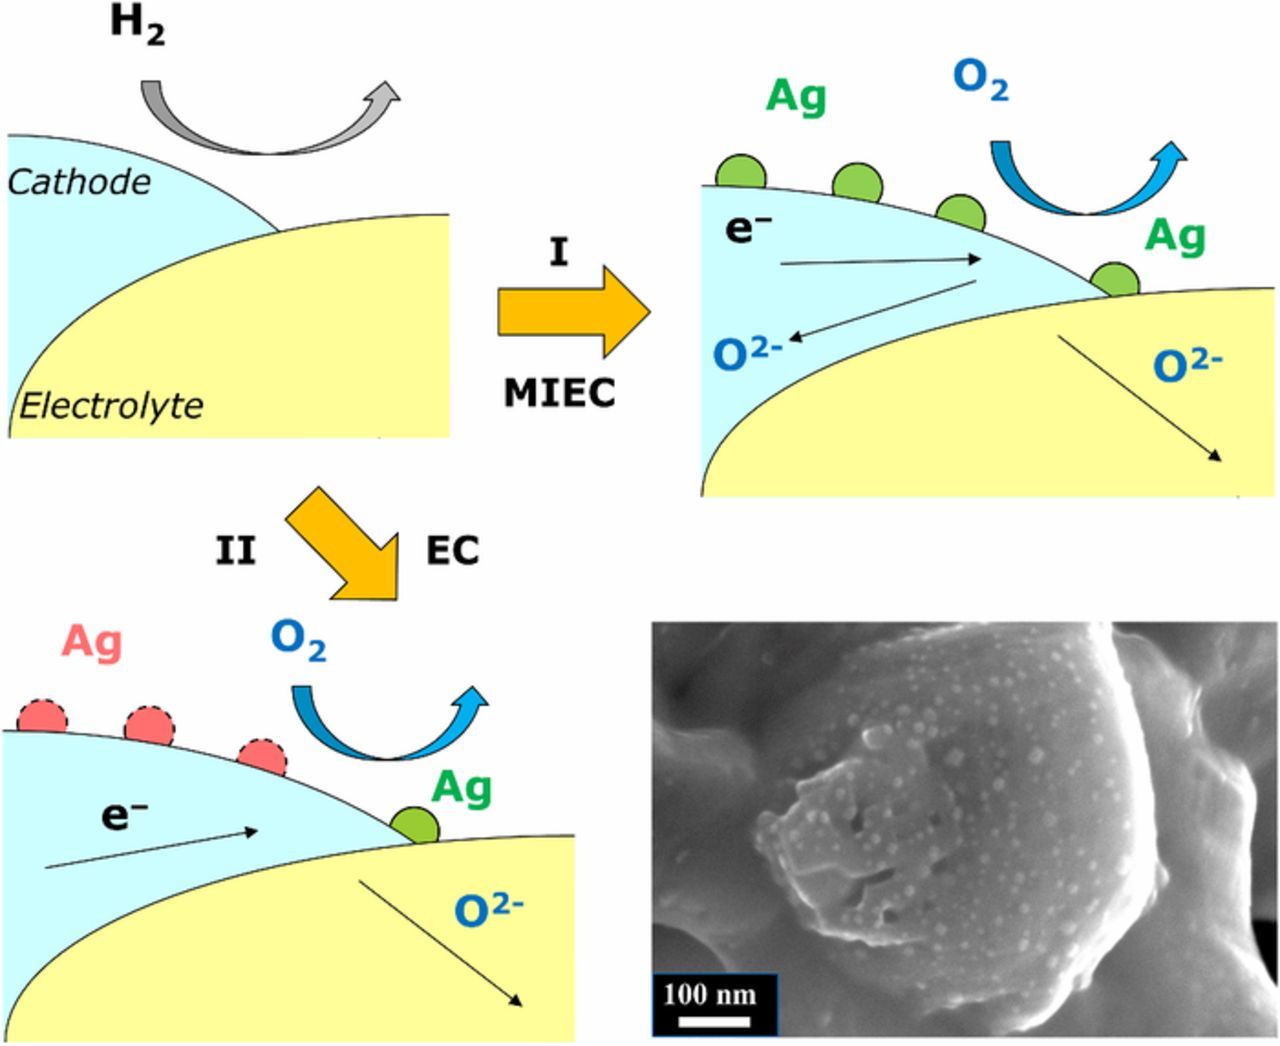
Figure 10. Possible mechanisms of exsoluted Ag nanoparticles toward ORR.
As can be seen in Figs. 8 and 9 and Table III, the magnitude of all three arcs is decreased when Ag is exsoluted from the single phase LSAM and is dependent on the exsolution time. The low frequency arc is the one that decreases the most and according to the literature is normally attributed to a slow redox oxygen-exchange reaction at the surface of the electrode (Eq. 4).45,47,48
![Equation ([4])](https://content.cld.iop.org/journals/1945-7111/166/2/F79/revision1/d0004.gif)
where Oads is adsorbed oxygen species, e− is an electron, v••O is an oxygen vacancy and OxO is oxygen on the oxygen site. This arc is minimized due to a larger surface area of the cathode with small metal nanoparticles formed as a result of the exsolution in LSAM and good catalytic properties of Ag, see Fig. 5. It could be expected two scenarios enhancing the electrochemical performance of the cells.49 If the surface reaction represented by the low frequency arc in EIS would be diffusion controlled or due to the roughness, there would be no changes in the activation energy before and after exsolution, but only a change in ASR.49 However, this is not the case in the current work represented by Table V as R3. It can be seen that the activation energy changes before and after exsolution what implicates that it is a change in mechanism, and the performance of the electrodes is surface reaction enhanced by the catalytic activity of Ag nanoparticles. The different changes in the activation energies before and after exsolution observed for CGO and YSZ could be explained by ionic conductivity differences first. The YSZ material has a slight decrease in the activation energy after exsolution what could be due to lower ionic conductivity of YSZ in the composite and a fast surface exchange reaction. The process is not surface but diffusion limited. However, in the case of CGO an increase in activation energy can be seen which can be attributed to the thermal activation of the surface limited reaction.49
The low frequency arc is dependent on the electrolyte material and is smaller when the CGO electrolyte is present. The partial pressures of oxygen (pO2) dependence of this arc is around 1/4,47 as predicted for a charge-transfer Reaction 4.50 The calculated near-equivalent capacitance of this arc is also in the range predicted for a chemical capacitance.48 The exsolution and its time affect the medium frequency arc. According to literature, this arc could be a diffusion of oxide anions through the bulk or the surface of the electrode.45,47,51 It could be speculated that if surface diffusion is the case, the medium frequency arc would depend on the presence of a metal nanoparticles when the process occurs close to the electrode–electrolyte interface. The pO2 dependence of this arc is around 1/4.47 The high frequency arc (see Fig. 6), referring to the literature, is known to be due to transport and transfer of oxide ions or oxygen intermediates across the LSAM cathode and electrolyte interface and through the electrolyte material of the composite.45,47,48,51 The exsolution of Ag nanoparticles from the perovskite slightly affects the high frequency arc, and the near-equivalent capacity calculated using Eq. 2 is around 0.1–5 μF/cm2 implying a double layer capacitance.47,48,52 The magnitude of this arc is much larger for the cells with YSZ electrolyte than for the cells with CGO meaning that the better conductivity of CGO electrolyte improves the electrode–electrolyte exchange reaction. The near-equivalent capacity is higher for the cells with CGO electrolyte, what according to the literature, indicates that there are more contact points between the composite cathode and the electrolyte.47 The pO2 dependence of the high frequency arc is small, approximately 1/1647 indicating that the process involves oxide anions and not oxygen. It is noteworthy that the absolute ASR values of the LSM/CGO cathodes are lower compared to the LSM/YSZ cathodes (Fig. 9) implicating that the backbone material is important in order to achieve highly active electrodes and showing that the exsoluted Ag from LSAM enhances the slow oxygen-exchange reaction at the surface of the electrode. The catalytic properties of the exsoluted Ag from LSAM are maintained even when the screen-printed electrodes are heated to 800°C, revealing that no coarsening of the exsoluted Ag nanoparticles is occurring. From Tables IV and V it can be seen that the apparent activation energy is almost unaffected by the exsolution time what suggests that the mechanism of ORR is not much affected by the exsolution of the Ag nanoparticles, however the rate of ORR is changed.
In general, the doping of LSM with Ag can be described as follows in Reaction 5,
![Equation ([5])](https://content.cld.iop.org/journals/1945-7111/166/2/F79/revision1/d0005.gif)
This reaction is supplemented by the Reaction 6,
![Equation ([6])](https://content.cld.iop.org/journals/1945-7111/166/2/F79/revision1/d0006.gif)
At low temperature oxidized Ag is stable in the perovskite lattice due to Ag2O in this lattice. The decomposition of Ag2O will depend on pO2 at different temperatures, and Ag2O would decompose at slightly higher than 200°C temperature in 0.2 atm pO2. Further, the materials are subjected to reducing atmosphere from room temperature where oxidized Ag is in the perovskite lattice. The exsolution of metallic Ag in reducing atmosphere is performed at elevated temperature due to kinetics and would be possible at room temperature in prolonged time. It is assumed that on cooling from the operation or exsolution temperature, part of Ag would be in the form of Ag2O. However, ordinary XRD measurements did not reveal Ag2O but instead metallic Ag (Figs. 2–4). The synthesis is started by complexing oxidized Ag into carbon and oxygen based materials, correspondingly increasing the stability of oxidized Ag. However, the sol-gel chemistry of Ag-based materials is quite challenging to interpret.
The XRD, thermal analysis and iodometric titration results imply that introduction of the oxygen vacancies and the concentration of Mn4+ induce distortion of the orthorhombic phase and slight contraction of the lattice volume at low pO2. However, Ag+ is considerably bigger than La3+ and induces overall lattice expansion. The A-site doping of LSM perovskite and exsolution of the Ag nanoparticles out from the crystal structure would induce more changes of the oxidation state for Mn together with slight reduction of the lattice. The defect equilibria of the exsolution could look as follows
![Equation ([7])](https://content.cld.iop.org/journals/1945-7111/166/2/F79/revision1/d0007.gif)
![Equation ([8])](https://content.cld.iop.org/journals/1945-7111/166/2/F79/revision1/d0008.gif)
According to the XRD results in Table II and Figs. 3 and 4, the exsolution process in reducing atmosphere induces slight expansion of the lattice what can be seen in the increase in cell parameters and cell volume. These results can be attributed only to the dominated reduction of Mn4+ to Mn3+ and Mn3+ to Mn2+. Referring to Fig. 4, which shows the XRD results for the exsolution of Ag nanoparticles from LSAM155 perovskite, one can conclude that the cubic Ag forms after heat-treatment of LSAM materials at 350°C for 2 h in H2/Ar. However, the exsolution process is rather slow (Figs. 8 and 9) and the detection of exsoluted Ag nanoparticles is difficult by regular XRD due to very small size of the particles. One must be aware on choosing the exsolution conditions. The constant lattice parameter of the cubic Ag structure indicates that there is no strain effect between the perovskite and nanosized Ag particles. The weight percent of Ag in the composites summarized in Table II show very good agreement and close proximity of experimental values to the theoretical results. The BET surface area was around 3 m2/g for the pristine samples, which is larger than Ag-free LSM powders (Table II). The difference in the BET surface area for the samples before and after exsolution imply that the exsolution increases the total surface area of the materials and therefore the length of the TPBs so necessary for the ORR. The BET measurements were performed on the powder samples at specific conditions (see Table II). It would be expected that increasing the exsolution time as for the electrochemical cells investigated in this work, larger differences in the BET surface area would be determined. The TGA results implicate that the phase pure LSAM perovskite is stable up to 1100°C in air (results not shown) what enables sintering of LSAM materials at high temperature in order to get good attachment to the electrolyte. LSAM155 loses almost 5 wt% below 1100°C in general and ∼2.5 wt% at 800–1100°C what is in a good agreement with the theoretical amount of Ag by weight (Table II). This loss of 2.5 wt% could be attributed to the evaporation of Ag at high temperatures (>Tmp (Ag) = 961°C).
With respect to the XRD patterns (Figs. 2–4) it can be concluded that all the materials crystallized in a perovskite structure irrespective of the addition of Ag or exsolution. The successful optimized wet chemical synthesis route for LSAM and exsolution of Ag nanoparticles is shown in Fig. 1. The method is called modified Pechini method because instead of ethylene glycol we used EDTA as both complexing and polycondensation agent. Fig. 2 summarizes the heat-treatment conditions of LSAM materials in air. The phase pure orthorhombic LSAM perovskite is obtained after firing at 800°C for 15 h in air. The shifts of the peak positions and thus descent variations in the lattice parameters due to incorporation of Ag as Ag+ ions on the A-site position of ABO3 perovskite lattice could be detected. The increasing doping level of Ag slightly increases the cell parameters and cell volume of the materials (see Fig. 3 and Table II). This is in a good agreement with the doping of LaMnO3 perovskite by small amounts of Sr.53 According to Shannon, the size of six-coordinated Ag+ and Sr2+ is similar54 and this induces the expansion of the LaMnO3 perovskite lattice. It is noteworthy that Ag did not form any compounds as secondary phases, and only metallic Ag was detected in all the XRD patterns after exsolution of LSAM materials. The most important aspects of this procedure are the pH of each step, temperature, time of mixing and the ratio between the overall amount of cations, EDTA and citric acid. The materials in separate solutions were added dropwise in such a way that no precipitation was observed at all. The AgNO3 is added in the very beginning due to the intended complexation with NH3 and possible stabilization of Ag+ in the aqueous solution. The gelation of the mixture is slow and has to be performed on the hot plate as much as possible in order to avoid extensive degassing in the furnace. The increase in the temperature must be slow especially up to 600°C, where all the organic materials are decomposed. The method proposed in this work introduces the way to dope LSM-based materials with Ag up to 5 mol% (2.3 wt%) in contrary to the authors from Ref. 40 who stated impossibility to Ag-dope LSM more than 1 wt%. On the other hand, attempts to reproduce the procedure given in Ref. 41 was unsuccessful, since the results, methodology and support on the phase purity of the materials in the manuscript were scarce.
The SEM and STEM micrographs of the microstructure of LSAM155 before and after exsolution are shown in Fig. 5. The particle size of the materials after firing at 800°C for 15 h in air was below 200 nm (see Fig. 5a) by linear intercept method and the particles were round-shaped. The microstructure of LSAM155ex material after exsolution of Ag nanoparticles (Fig. 5b) suggests that small and stable Ag nanoparticles are formed with good adhesion on the surface of the perovskite. This is an advantage of the exsolution compared to impregnation. When compared SEM micrographs in secondary electron mode (SE) (Fig. 5c) and back-scattered electron mode (BSE) (Fig. 5d), the round-shaped Ag nanoparticles on the surface of the LSAM perovskite were determined and the size of Ag was below 20 nm. The differences in the microstructure of the LSAM155ex perovskite and Ag metal nanoparticles can be observed which are confirmed by STEM EDS analysis (Figs. 5f–5g). It is important to note that the amount of exsoluted Ag nanoparticles on the surface of LSAM perovskites was proportional to the Ag doping level (see Fig. 5). Attempts were made to observe the discrete exsoluted Ag nanoparticles by transmission electron microscopy (TEM). However, the Ag nanoparticles were difficult to distinguish in terms of mass thickness contrast due to similar density with the LSM. Also, high-resolution TEM images were mainly dominated by lattice fringes from the LSM.
Conclusions
La1-x-ySrxAgyMnO3-δ (LSAM, y = 0–0.05) were synthesized by the modified Pechini method. The materials were applied in composites with CGO and YSZ as symmetric cells at 500–800°C for the electrochemical oxygen reduction reaction. The solubility of Ag in the La1-x-ySrxAgyMnO3-δ perovskite reveled to be up to 5 mol% with the good stability of the single phase materials in air and argon. The increased doping of the perovskite oxide induced expansion of the lattice volume. SEM images and XRD measurements showed the formation of around 20 nm very finely and homogeneously distributed Ag nanoparticles on the LSAM surface after a reductive heat-treatment at 350–600°C in 5% H2/Ar, with the Ag nanoparticle concentration influenced by the reduction temperature and Ag-doping level in LSM. The specific surface area of the materials increased after exsolution, and the lattice expansion was observed. LSAM was used as a cathode for SOFC, and exhibited lower ASR than other previously reported LSM-based cathodes. Exsolution of Ag nanoparticles was found to be a slow process and the electrochemical performance improved with increasing exsolution time. Our results indicate that Ag-nanodecorated LSAM/CGO10 and LSAM/YSZ8 composites may be efficient SOFC cathode materials for the oxygen reduction reaction.
Acknowledgments
The author Rokas Sažinas (RS) acknowledge financial support from Villum Foundation for the research activities performed at DTU Energy. RS would also like to acknowledge DTU Energy technicians and employees Jens Quitzau Adolphsen, Ebtisam Abdellahi, Annelise Mikkelsen, Ole Hansen, Lene Knudsen, Carsten Gynther Sørensen for the qualified technical support during the experiments.
ORCID
Rokas Sažinas 0000-0002-4422-890X
Kent Kammer Hansen 0000-0002-1349-958X