Abstract
A two-dimensional, transient state model was developed by the dynamic behavior of the porous cathode, which was determined by a numerical solution of the combined continuity, transport, and kinetics equations. The effects of ultra-thin air electrode on the distribution of the oxygen concentration, Li2O2 volume fraction, porosity, and local oxygen reduction reaction rate on the properties of non-aqueous Li-air battery during discharge were investigated. The time dependence of the battery system and the mass transport along the depth of the air electrode were considered and analyzed. The model was validated against the voltage-capacity data measured at different discharging current densities. The optimal ultra-thin thickness of the air electrode was achieved. The results revealed that employing ultra-thin air electrode leaded to the smooth oxygen diffusion, uniform porosity and Li2O2 deposition and remarkable specific capacity of Li-air battery. The discharge current density had significant effects on the property of Li-air battery based on ultra-thin air electrode due to the great increasing of ohm polarization and serious air electrode passivation. The influence of the initial oxygen concentration on the battery performance was relatively small caused by the high oxygen saturation in the ultra-thin air electrode. The detailed results provided a deeper understanding of producing more efficient Li-air batteries as potential power sources to expand the range of electric vehicles.
Export citation and abstract BibTeX RIS

This is an open access article distributed under the terms of the Creative Commons Attribution 4.0 License (CC BY, http://creativecommons.org/licenses/by/4.0/), which permits unrestricted reuse of the work in any medium, provided the original work is properly cited.
Depletion of fossil fuels and the increasing environmental pollution have resulted in an enhanced demand for the electric and hybrid electric vehicles. Electric vehicles containing of the Li-ion batteries can provide more than 140 km miles of range on a single charge, however, this range is still lower than that of the fossil-fuel powered vehicles.1 Li-air batteries are considered as an emerging energy source for electric cars, its theoretical specific energy is around 11,400Wh/kg, which is comparable to the theoretical energy levels produced by gasoline of around 13,000Wh/kg.2 It can potentially deliver 3–10 times greater energy density than current new energy batteries such as Zn-air batteries and Li-ion batteries.3–5 Actually, the concept of using Li-air batteries for the energy storage of automotive applications was introduced by Lockheed as early as 1970s, however, the instability and corrosion of the lithium metal as the anode material caused safety and reliability issues.6 The rechargeable Li-air battery containing a non-aqueous polymer electrolyte was developed by Abraham and Jiang in 1996, which improved the severe safety hurdles.7 After their promising rechargeable ability was demonstrated by Bruce in 2006,8 the graphene was applied into the air electrode of Li-air battery by the researchers from the university Cambridge, which extended the service life of the battery in 2015. As the "ultimate battery", Li-air batteries have received a great deal of research attention in recent years. Electrolyte materials and air electrodes are a central issue in Li-air battery development.9–11
Li-air batteries that employ non-aqueous electrolyte (organic electrolyte Li-air battery) usually consist of a lithium metal anode, liquid organic electrolyte, and a porous air electrode (porous carbon cathode) as shown in Fig. 1. Li+ ions in non-aqueous electrolyte Li-air batteries pass through the electrolyte to the air electrode where they react to form a Li2O2 precipitate, resulting in the pores of the air electrode densely filled with Li2O2 when discharge occurs. This deposition process can eventually prevent the oxygen reduction reaction from occurring, because O2 no more pass through the blocked pores to reach the carbon electrode. In addition, the presence of Li2O2 can also affect the volumetric and specific energy densities of the cathodic reaction, whose voltage drop is responsible for delivering most of the batteries energy. Consequently, it is necessary to enhance the performance of air electrode to ensure that Li-air battery is capable for producing good energy levels.
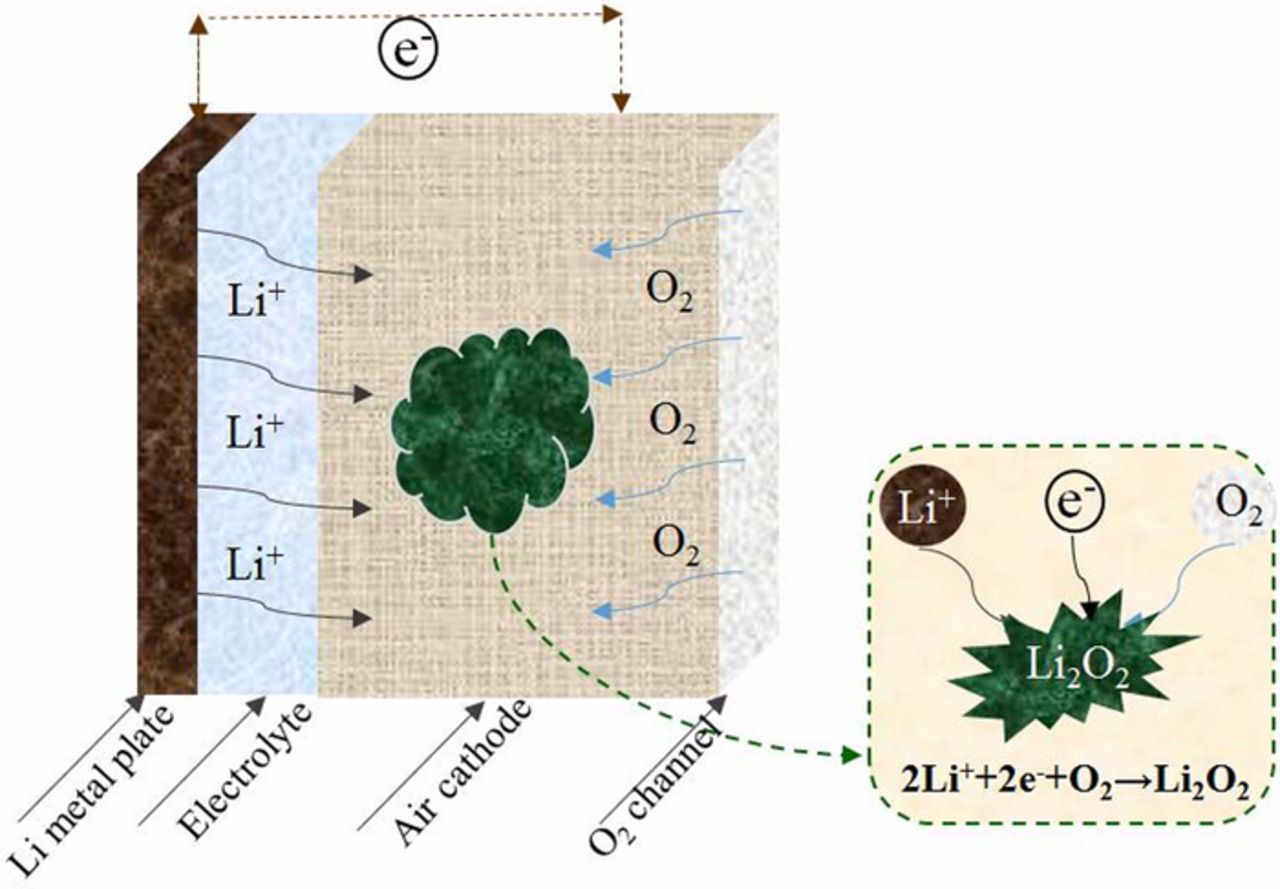
Figure 1. Schematic of a Li-air battery and its discharge operation that produces Li2O2.
Several researchers have carried out the structure of air electrode and physicochemical properties, including measuring the diffusion of oxygen, examining structure, porosity and pore size distributions of air electrodes, and characterizing reaction products and their morphology.12–14 The battery performance based on the structure of porous cathodes was measured by Albertus,15 which indicated that the dominant capacity-limiting mechanism of battery was caused by discharge products resistive and electrode passivation. Mirzaeian and Hall16 used porous activated carbons as cathode active materials, they investigated the effect of pore volume, pore size and surface area. The results indicated that a large pore volume and wide pore size might yield better performance. The prolonged cycle life with large capability using a nano porous three dimensional gas diffusion electrode was reported by Cheng and Scott.17 It was worth mentioning that a number of published works showed that the scanning electron microscopy (SEM) images of the air electrode surface on the air feed side of the fully discharged cell were almost filled in the space by solid lithium oxides deposition,18–20 but this behavior did not appear on the separator side. This can be attributed to both the slow diffusion of oxygen dissolved in non-aqueous electrolyte and the long residence time moving through the thicker electrode, which influenced the performance in term of specific capacity.
The modeling studies of Li-air batteries can be a great help to understand the transport phenomena within the battery, study the effect of parameters, and improve the battery design. Nevertheless, only limited numbers of models have been developed to investigate the transport phenomena in Li-air batteries. J. Read21 conducted a simple analysis to capture the dimensionless oxygen concentration along the carbon electrode depth after the steady-state condition was reached. Their results clearly showed that the oxygen concentration decreased with the increase of the depth to which oxygen penetrated the electrode. The decrease of oxygen was faster at a higher discharge current. Andrei22 developed a isothermal model to simulate oxygen and lithium ion concentrations and porosity distributions along the cathode carbon electrode. Based on this model, they proposed several approaches to optimize the structure of the cathode electrode: increasing the oxygen diffusivity and solubility; increasing the catalyst activity; using catalysts with non-uniform activity along the electrode; and applying partly wetted cathode electrode. An ORR mechanistic model that accounts for reaction products deactivating the catalytic sites was proposed by Ren.23 Sahapatsombut31 proposed a model to predict electrolyte degradation and cycling behaviors, which assumed that Li2O2 is the final discharge products. The numerical analysis was considered as the major method to predict the performance and structure such as thickness of air electrode, with various models particularly useful for trouble-shooting potential roadblocks.24–29 Sandhu30 developed a one-dimensional, isothermal model to calculate the dimensionless oxygen concentration along the cathode carbon electrode. Results showed that the specific capacity decreased with both the increase of discharge current and the increase of electrode thickness. Yang and Xia indicated that the thinner air electrode can provide the high battery performance thorough the specific capacity comparison between electrode thickness 750μm and 1500μm.31 The effects of different air electrode designs on voltage evolution during discharge was presented by Gwak and Ju.32 The voltage drop was successfully mitigated by modifying the air electrode design into a thinner electrode of 375μm, indicating that the design changes effectively reduce the oxygen transport resistance through the air electrode. Li and Faghri33 published that the volume fraction of Li2O2 was only 9.5% when the electrode thickness was 800μm. The discharge capacity of a Li-air battery could be remarkably increased by utilizing the pores deep in the carbon electrode more efficiently. The oxygen channel depth of air electrode was decreased from 800μm to 80μm due to it added a considerable volume to the battery and hence reduced its specific energy.34 The prediction indicated almost uniform oxygen in the channel, so the supply was sufficient. Thus, the channel dimension can be further reduced without sacrificing oxygen supply. Above all, the thickness of the air electrode plays an important role in the electrochemical performance. However, in those previous studies, authors only obtained the phenomena of the relationship between air thickness and performance. The optimal thickness, detail properties, and influence factors were not deep analyzed.
In this study, we proposed a transient two dimensional model for the non-aqueous Li-air battery to predict the effects of ultra-thin air electrode on the battery properties, which considered the conservation of mass and current, species transport and reaction kinetics both throughout the electrode and at the separator. The model enabled the investigation of reaction mechanisms that were dependent on the products accumulating and blocking, which would be validated against experimental data measured at different discharging current densities. Firstly, using the validated model, the influence of electrode thickness on the battery specific capacity was studied to determine the ultra-thin thickness of air electrode. Additionally, the detail properties were compared between ultra-thin battery and common battery to analysis the effects of ultra-thin electrode on the distribution of oxygen, porosity, Li2O2 volume fraction and local ORR reaction rate at various discharged states. Finally, the influence factors of Li-air battery based on ultra-thin electrode were studied. As a consequence, it should be possible to produce more efficient Li-air batteries as potential power sources to expand the range of electric vehicles.
Model Development
Geometric model
The 2-D geometry of the mesh configuration used to model a non-aqueous electrolyte Li-air battery is shown in Figure 2, which is based on a conventional design containing a Li anode, a separator, a porous air electrode or air electrode and an oxygen intake system. Battery discharge occurs due the anode electrochemical potential, which results in the lithium anode donating Li cations and electrons to the electrolyte, which enables oxygen to be reduced at a porous air electrode through reception of electrons from an external circuit. Oxygen is supplied to the Li-air battery from the atmospheric air, with an internal short-circuit being prevented by a separator or membrane (LISICON) that separates the anode from the air electrode.35–37
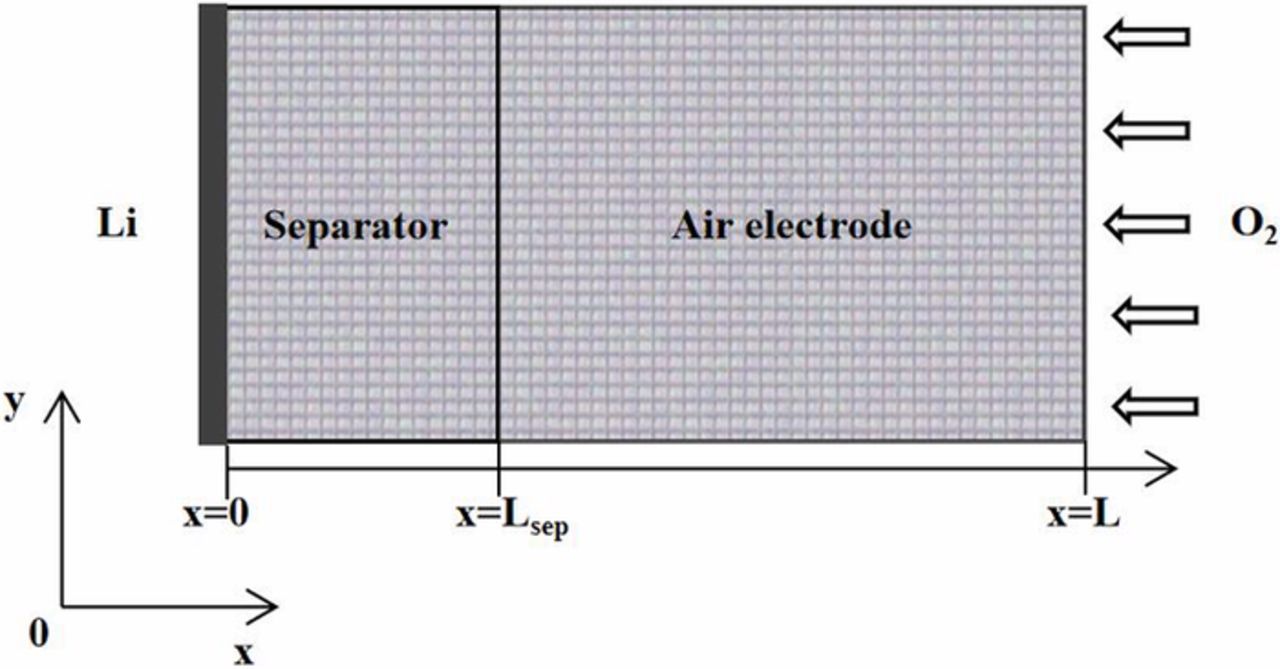
Figure 2. Schematic diagram computation domain of a Li-air battery during discharge.
Assumptions
The assumptions that were employed in this model are as follows:
- (1)The main discharge product is Li2O2, which forms and accumulates on the active surface of the porous air electrode. The possible products of Li2O and Li2CO3 are ignored in this study.
- (2)An adequate supply of O2, Li+ and electrolyte are present throughout the electrochemical process.
- (3)The battery operates with non-temperature impact.
- (4)The over-potential of the anode reaction is negligible.38
Governing equations
Electrochemical reaction model
The porous electrodes are the main site of electrochemical reaction. During the discharge process, oxygen from surrounding air dissolves in the electrolyte, enabling it to react with Li-ions at the porous electrode. The main reaction at the cathode is given by Equation 1:
![Equation ([1])](https://content.cld.iop.org/journals/1945-7111/166/15/A3606/revision1/d0001.gif)
Lithium peroxide Li2O2 cannot dissolve in the organic electrolyte (because its concentration is greater than its maximal solubility), so it is deposited on the surface of the cathode. The kinetic process at this electrode reaction can be described using Equation 2:
![Equation ([2])](https://content.cld.iop.org/journals/1945-7111/166/15/A3606/revision1/d0002.gif)
where, iloc is the local current density, n is the number of electrons transferred, η is the over potential, ka is the cathode transfer coefficient, kc is the air electrode transfer coefficient, ci is the concentration of species i at the active site, F is Faraday's constant, R is the molar gas constant and T is the temperature.
Calculation of the over potential η was carried out using Equation 3:
![Equation ([3])](https://content.cld.iop.org/journals/1945-7111/166/15/A3606/revision1/d0003.gif)
where, ϕs is the potential, ϕl is the electrolyte potential, Δϕfilm is the voltage drop caused by separator resistance and Eeq is the equilibrium potential.
Δφfilm could be calculated using Equation 4:
![Equation ([4])](https://content.cld.iop.org/journals/1945-7111/166/15/A3606/revision1/d0004.gif)
where, Rfilm is the resistivity of Li2O2 on the diaphragm and ɛLi2O2 is the volume fraction of solid Li2O2. The main reaction for ionization of lithium at the air electrode is then given by Equation 5:
![Equation ([5])](https://content.cld.iop.org/journals/1945-7111/166/15/A3606/revision1/d0005.gif)
The solid deposition reaction model operating in the lithium batteries was defined by Equation 6
![Equation ([6])](https://content.cld.iop.org/journals/1945-7111/166/15/A3606/revision1/d0006.gif)
where ɛ is the porosity of the cathode, a is the active specific surface area of the cathode, cmax, Li2O2 is the maximal solubility of Li2O2 in the electrolyte, and ɛ is the initial porosity value until Li2O2 solubility reaches a limiting value.
When the solubility of Li2O2 reaches its maximum value, it is deposited on the surface of the cathode, resulting in a change in porosity of the cathode that can be described using Equation 7:
![Equation ([7])](https://content.cld.iop.org/journals/1945-7111/166/15/A3606/revision1/d0007.gif)
where, MWLi2O2 and ρLi2O2 are the weight and density of solid Li2O2, respectively.
Deposition of solid Li2O2 results in a reduction in the active specific surface area of the cathode, with its efficient surface of unit volume given by Equation 8:
![Equation ([8])](https://content.cld.iop.org/journals/1945-7111/166/15/A3606/revision1/d0008.gif)
where, ɛ0 is the initial porosity and a0 is the initial active specific surface area of the cathode.
The volume fraction of solid Li2O2 is given by Equation 9:
![Equation ([9])](https://content.cld.iop.org/journals/1945-7111/166/15/A3606/revision1/d0009.gif)
where, ɛs,0 is the initial volume fraction of the cathode.
The film thickness of the Li2O2 may then be calculated from the volume fraction of solid that was discharged, using Equation 10:
![Equation ([10])](https://content.cld.iop.org/journals/1945-7111/166/15/A3606/revision1/d0010.gif)
where, r0 is the initial granularity of the cathode.
Boundary conditions and parameter settings
COMSOL finite element analysis software is used to construct a two-dimensional model for the transient numerical simulation of Li-air batteries at the constant temperature. The left-hand side of the battery is modeled under zero potential grounding conditions. The right-hand side of the porous electrode is constructed using charging and discharging current density boundaries, with stop conditions occurring when its boundary potential is reduced to 2.5V. Detailed cell operating conditions, kinetics and transport parameters that are used for these Li-air battery simulations are listed in Table I.
Table I. Model parameters and operating conditions.
| Parameter | Value | Symbol |
|---|---|---|
| Thickness of separator (m)40 | 5 × 10⁻⁵ | Lsep |
| Thickness of air electrode (μm) | 40–960 | L |
| Initial porosity of air electrode (-)25 | 0.85 | ɛ1, 0 |
| Porosity of separator (-)42 | 0.87 | ɛ2 |
| Film resistance across Li2O2 film (Ohm/m2)25 | 50 | Rfilm |
| Initial concentration of Li+ in the electrolyte (mol/m3)31 | 1000 | cLi,0 |
| Battery temperature (K)31 | 300 | T |
| Initial diffusion coefficient of Li-ion (m2/s)25 | 2.11 × 10⁻⁹ | DLi |
| Initial diffusion coefficient of Oxygen (m2/s)25 | 7 × 10⁻¹⁰ | DO2 |
| Equilibrium potential for Oxygen reaction (V)36 | 2.96 | Eeq |
| Solubility factor of oxygen in the electrolyte (-)25 | 0.4 | SolO2 |
| External oxygen concentration in air at 1atm (mol/m3)36 | 9.46 | cO2ext |
| Particle radius in the positive electrode(m)25 | 2.5 × 10⁻⁸ | R |
| Density of Li2O2(kg/m3)25 | 2140 | ρ |
| Conductivity of Li+ in electrolyte(S/m)36 | 1.085 | kappaLi |
| Solubility limit of Li2O2 dissolved in electrolyte(mol/m3)42 | 0.09 | cmaxLi2O2 |
| Reaction rate coefficient air electrode current(m/s)42 | 1.11 × 10⁻¹⁵ | ka |
| Reaction rate coefficient Li metal(m/s)42 | 1 × 10⁻⁵ | kLi |
Numerical method
A finite element method is used to describe the performance of the anode and cathode in the Li-ion battery module using combined equations for electrode reaction kinetics, mass transfer and charge conservation. Oxygen diffusion is considered as a porous media mass transfer process, with arithmetic progression used to divide the region into 1788 element meshes, with a relative repair tolerance level set at 1 × 10⁻⁴.
Results and Discussion
Model validation
Simulated voltage curves are in good agreement with measured voltage curves31,42 at discharging current densities of 0.1 and 0.2 mAcm−2 as shown in Fig. 3. These results indicate that voltage decline due to cumulative discharge of Li2O2 at the air electrode are correctly simulated using this model. Battery voltages gradually decrease because insoluble Li2O2 is continuously deposited into the air electrode, with voltage decline rates accelerating as the battery voltage fell below 2.75V due to Li2O2 accumulation in the pores of the air electrode and limiting oxygen transport. The rate of Li2O2 accumulation in the air electrode is greater for faster discharging rates, which led to severe oxygen transport limitations and larger voltage losses. Higher current densities of 0.2 mAcm−2 result in shorter discharging capacities.
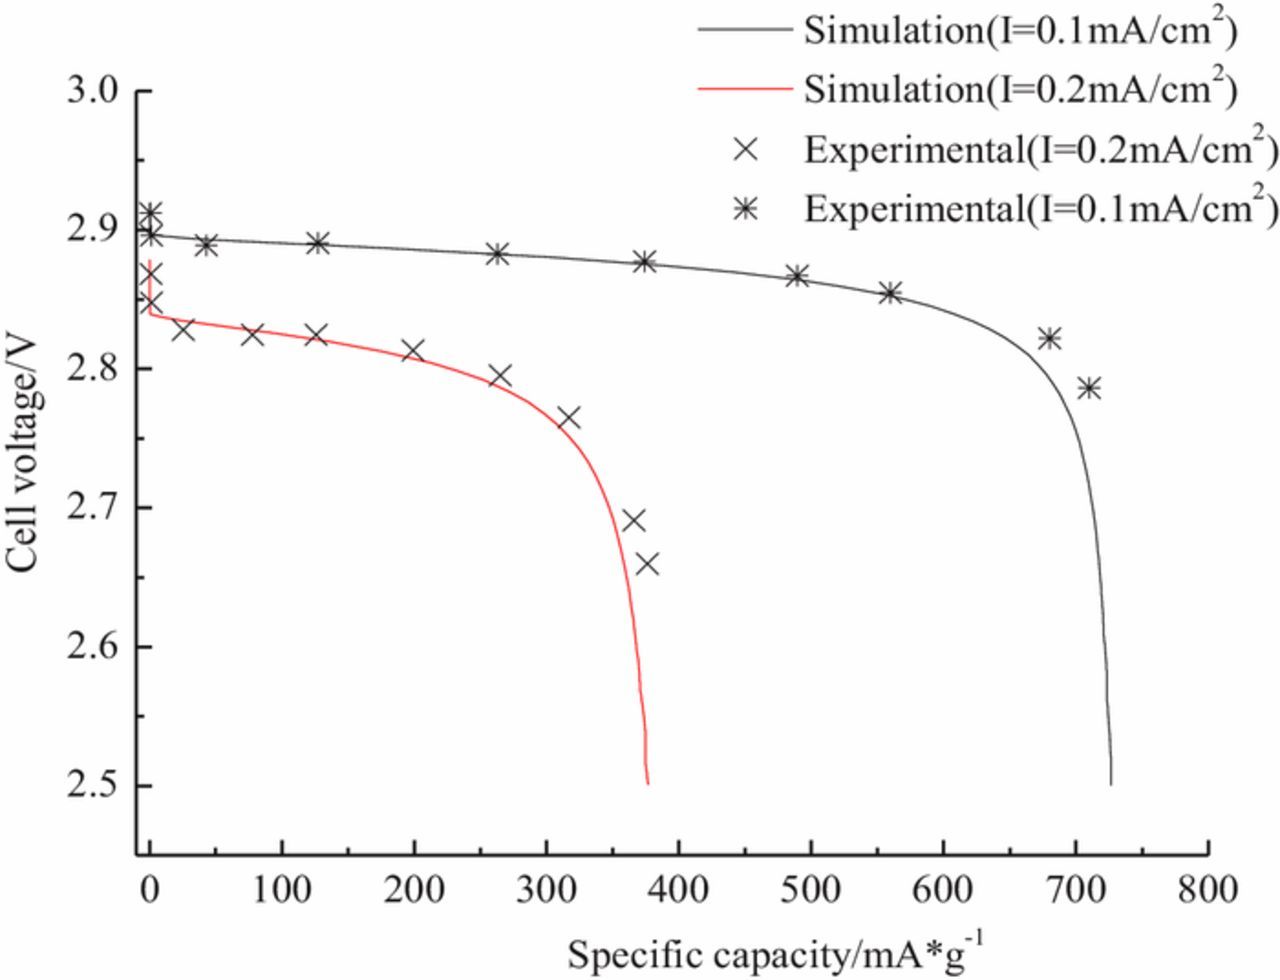
Figure 3. Comparison of simulated (lines) and measured (symbols) discharge curves at different current densities of 0.1 and 0.2 mAcm−2, respectively.
Determining the ultra-thin thickness of air electrode with battery specific capacity
The trend of the battery specific capacity as air electrode thickness is presented at current density 0.1 mAcm−2 and initial porosity 0.85 in Fig. 4. The result indicates, with the increase of the air electrode thickness, the specific capacity increases, reaches maximum value at the air electrode thickness of 80μm, and then decreases after 80μm. The possible reasons are that too low air electrode thickness cannot supply enough electrochemical reaction active sites, which makes low battery performance; while too thick air electrode increases reactants transfer path, which makes more transfer resistance of the reactants. It is shows that when the air electrode thickness is about 80μm, the specific capacity reaches maximum value, and this battery performs best performance. Therefore, the optimum ultra-thin air electrode thickness is 80μm for Li-air battery.
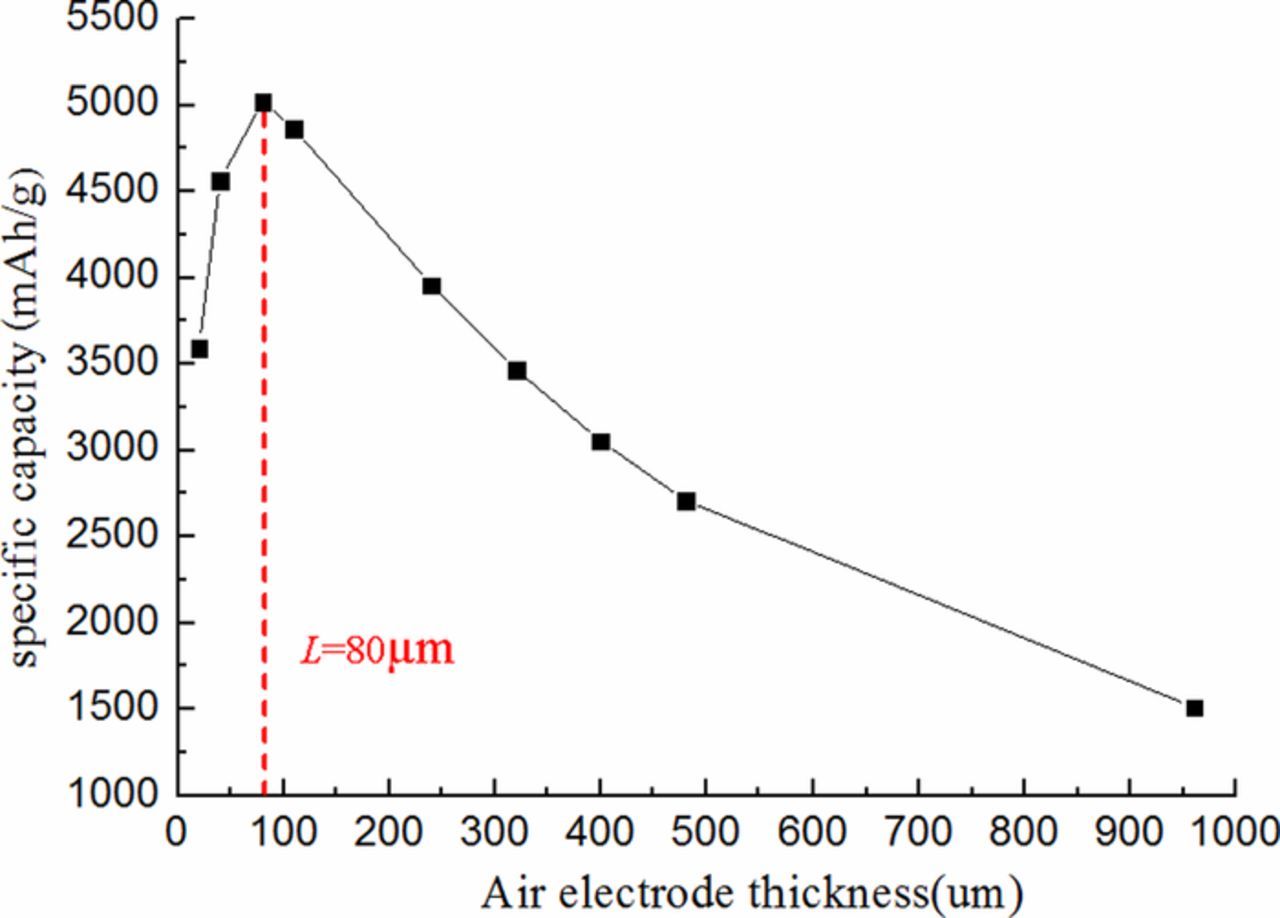
Figure 4. Effect of air electrode thicknesses on battery specific capacity at 0.1 mAcm−2.
As discussed above, the specific capacity is determined by mass transfer limitation, so the ultra-thin air electrode thickness is the important design parameter to achieve high specific capacity. It is necessary to clarify the effects on the detail properties such as oxygen concentration, Li2O2 concentration, porosity, and Local ORR reaction rate between ultra-thin electrode (80μm) and common electrode (400μm) at different discharged states in the following studies.
Effect of ultra-thin air electrode on Li-air battery properties during discharge
Effect of ultra-thin air electrode on oxygen concentration
The distributions of oxygen concentration in the air electrodes with ultra-thin thickness and common thickness at four various discharging states are shown in Fig. 5. It is clear that the utilization of the air electrode is greatly improved as the thickness of the air electrode is reduced fivefold from 400μm to 80μm. Unlike Figs. 5e–5h for the case of the common electrodes (400μm) where the oxygen concentrations inside air electrode are mainly concentrated near the outer electrode region at each discharging stage, however, the oxygen of the ultra-thin electrodes (80μm) spreads out along the electrode thickness from oxygen feed side to separator side as shown in Figs. 5a–5d. It indicates that scarce oxygen near the separator side of the thicker electrode, this can be attributed to both the slow diffusion of oxygen dissolved in non-aqueous electrolyte and the long residence time moving. The oxygen cannot diffuse further inside the electrode because of the continuous growth of Li2O2 on the active surface of the porous carbon in the thicker air electrode. The electrode surfaces both outer side and separator side are well utilized for the oxygen reduction reaction if the air electrode thickness is enough thin as 80μm. The thicker electrode contribute toward restrictions in oxygen transportation rates that severely limit the air electrode batteries overall capacity. It also indicates that the diffusion coefficient of oxygen is low compared to Li+ species in the thicker battery.
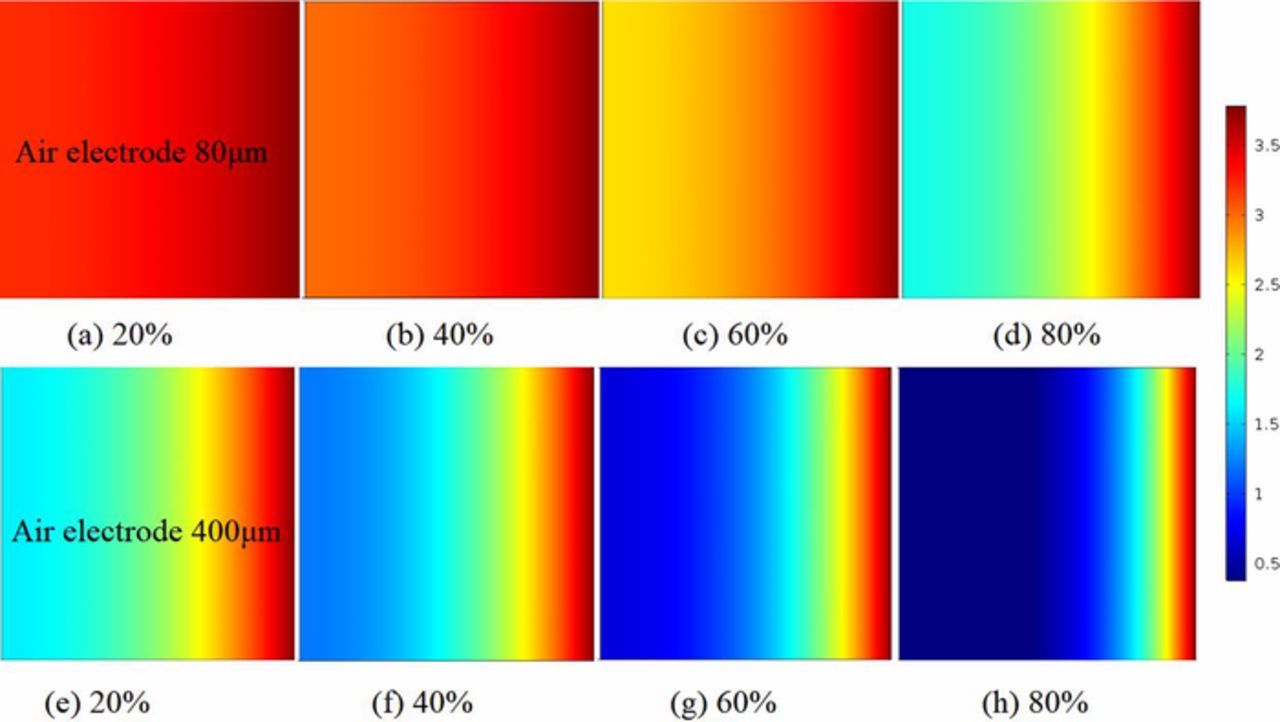
Figure 5. Concentrations comparison of oxygen (mol/m3) between various air electrode thicknesses at different discharge states. (a)–(d) are presented for air electrode thickness L = 80μm. (e)–(h) are presented for air electrode thickness L = 400μm. 20% = battery is near beginning of discharge. 80% = battery is near fully discharged. Current densities is 0.1 mAcm−2. Initial porosity is 0.85.
Effect of ultra-thin air electrode on Li2O2 volume fraction
As can be seen from Fig. 6, the volume fractions of Li2O2 with various air electrode thicknesses are plotted when the discharge state is 20%, 40%, 60%, and 80%, respectively. The results clearly show that the volume fractions of Li2O2 present uniform distribution along the ultra-thin air electrodes at arbitrary varying discharge state. The accumulation of Li2O2 is close to the air feed side near fully discharged, and the non-uniform Li2O2 distribution is more severe when the electrode is thicker. The reason is that most of the thicker air electrode space is not fully used due to the blockage of oxygen by the faster Li2O2 accumulation at the interface of air electrode. Meanwhile, the impedance of air electrodes will be increased by the poor conductivity of Li2O2, which also leads to a significant decline in battery performance. To make better use of all the pores throughout the porous air electrode, it is preferable to design a ultra-thin Li-air battery which thickness is selected as 80μm.
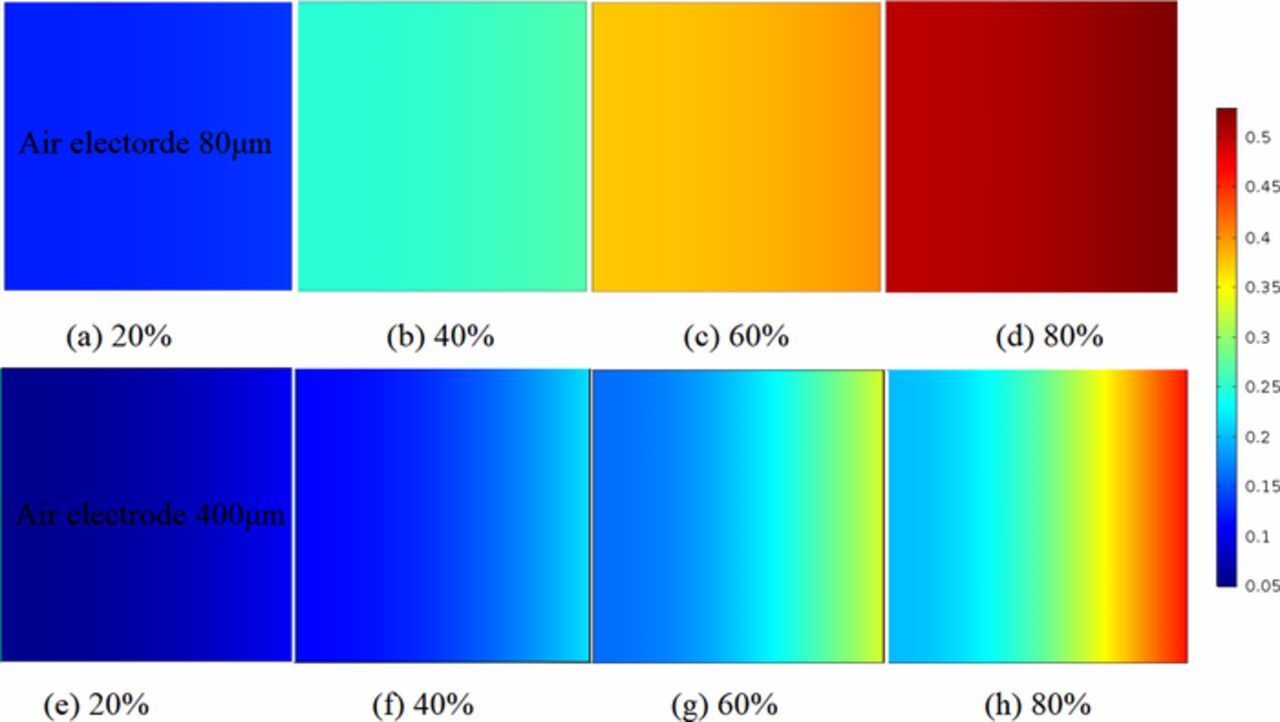
Figure 6. Concentrations comparison of Li2O2 volume fraction between various air electrode thicknesses at different discharge states. (a)–(d) are presented for air electrode thickness L = 80μm. (e)–(h) are presented for air electrode thickness L = 400μm. 20% = battery is near beginning of discharge. 80% = battery is near fully discharged. Current densities is 0.1 mAcm−2. Initial porosity is 0.85.
Effect of ultra-thin air electrode on porosity
The porosity contents of various air electrode thicknesses with different discharge states is carried out, whose trend is contrary to the distribution of Li2O2 ideally as shown in Fig. 6. The porosity of the ultra-thin air electrode reduces steadily as shown in Figs. 7a–7d. It is also found that the porosity is reduced rapidly near oxygen feed side with the thicker electrodes as 400μm during the latter part of discharge process such as over discharge 60% as shown in Figs. 6g and 6h. The mainly reason is that using of ultra-thin air electrodes result in a more uniform porosity being maintained at each discharge state, it is better to facilitate the supply and diffusion of oxygen into the porous air electrode channels. Moreover, it indicates that the almost entire space of air electrode can be effectively used to accommodate electrode discharge products.
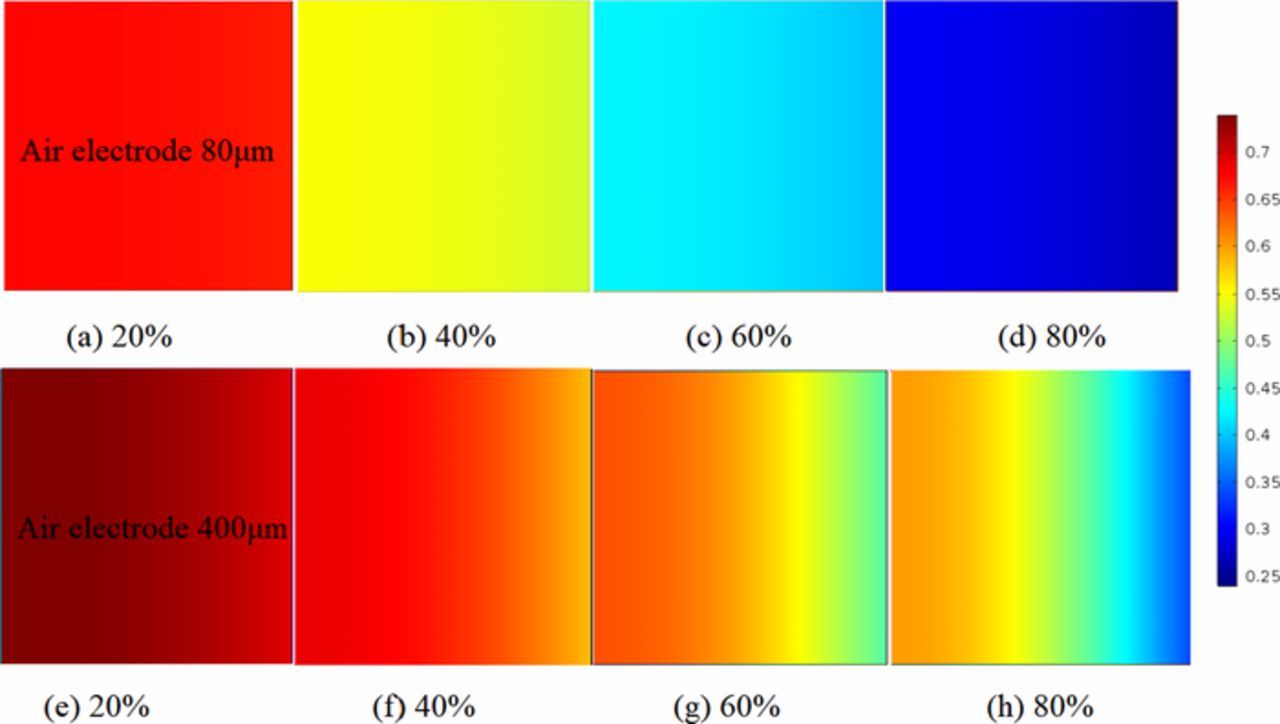
Figure 7. Contours of porosity inside the air electrode during discharge at different discharge states. (a)–(d) are presented for air electrode thickness L = 80μm. (e)–(h) are presented for air electrode thickness L = 400μm. 20% = battery is near beginning of discharge. 80% = battery is near fully discharged. Current densities is 0.1 mAcm−2. Initial porosity is 0.85.
Effect of ultra-thin air electrode on local ORR reaction rate (oxygen consumption rate)
The local ORR reaction rate within the various air electrodes under 0.1mA/cm2 is shown in Figs. 8a–8h. The ORR reaction range changes slightly from 0.0635 to 0.067 in the ultra-thin air electrode. It is clear that the reaction variation is greater for the thicker air electrode from 0.006 to 0.022. However, as near fully discharged 80%, the ORR reaction rate appears a clear gradient develops both for ultra-thin and thicker electrodes as shown in Figs. 8d and 8h. The maximum ORR reaction rate occurs at the air electrode's side of the oxygen feeding region, where oxygen in the porous channel easily accesses. In the early stages, the air electrode inner portion is inactive in the ORR reaction due to lack of oxygen access. It is clear that the oxygen resistance is a major limiting factor for local ORR reaction rate. As a result, due to the limitation of oxygen diffusion, the reaction rates in the air electrode are nonuniform, with higher reaction rates close to the air feed interface of electrode and lower reaction rates close to the separator interface. To improve ORR reaction rate, one can use electrolytes with a large oxygen diffusivity or pressurized oxygen for the common battery with thicker air electrode.
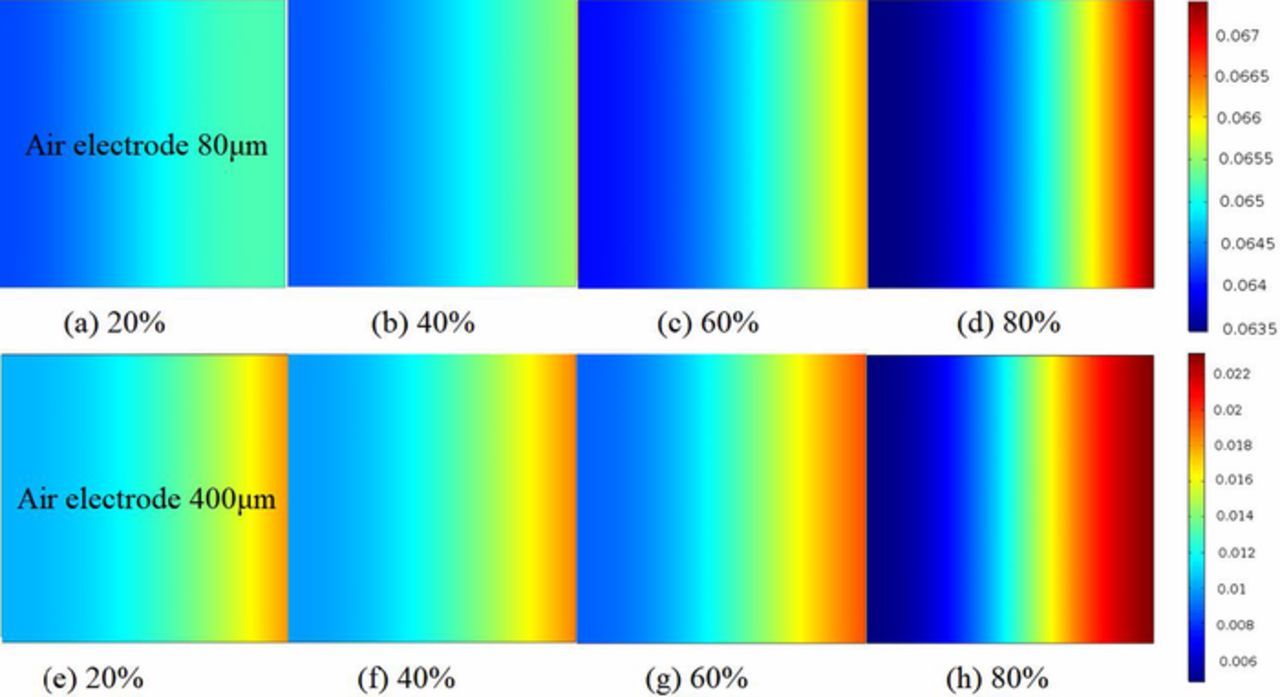
Figure 8. Local ORR reaction rate (oxygen consumption rate) between various air electrode thicknesses at different discharge states. (a)–(d) are presented for air electrode thickness L = 80μm. (e)–(h) are presented for air electrode thickness L = 400μm. 20% = battery is near beginning of discharge. 80% = battery is near fully discharged. Current densities is 0.1 mAcm−2. Initial porosity is 0.85.
Effects of discharge current density on battery properties based on ultra-thin air electrode during discharge
Figures 9a–9h present oxygen content contours of ultra-thin air electrode in the Li-air battery with different current densities. Under 0.05mA/cm2, initially the oxygen content appears the maximum value as homogeneous distribution along the air electrode as shown in Fig. 9a. At the latter stage, e.g. Fig. 9d, the oxygen content decreases to about 70% in the inner air electrode near the separator, thus is inactive in the ORR reaction. The observed oxygen starvation occurs as a result of precipitate accumulation in porous channels of air electrode. In Fig. 9e, it shows that the initial stage under 0.5mA/cm2 exhibits lower oxygen content than under 0.05mA/cm2 due to the larger oxygen consumption rate. Meanwhile, the oxygen content decreases to below 50% near separator under 0.5mA/cm2 at the initial stage, showing that local oxygen starvation occurs earlier. Figure 9h shows that the oxygen content is almost zero in the inner air electrode near separator even at the full discharge stage under 0.5mA/cm2. Oxygen can only penetrate a very short distance into the air electrode surface to sustain the applied electric current. As the discharging proceeds toward the final stage, more inner region is inaccessible to oxygen.
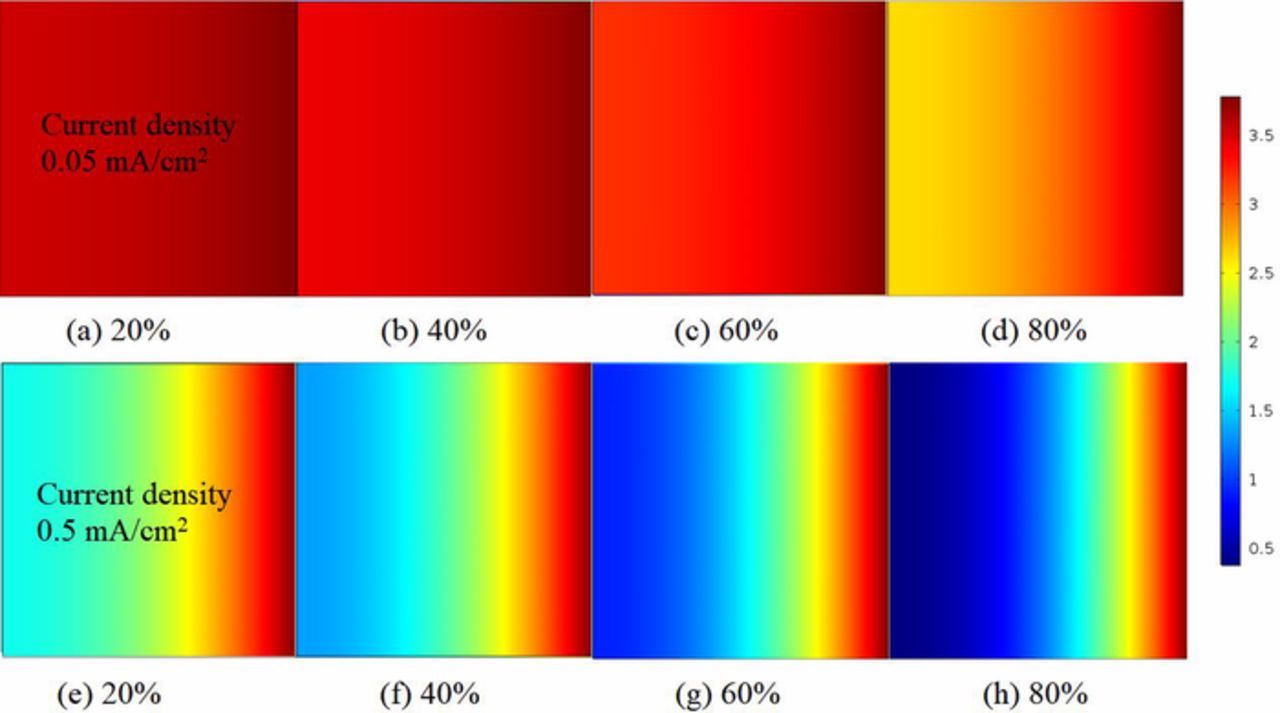
Figure 9. Concentrations comparison of oxygen (mol/m3) between various discharge current densities at different discharge states. (a)–(d) are presented for discharge current density = 0.05mA/cm2. (e)–(h) are presented for discharge current density = 0.5mA/cm2. Air electrode thickness is 80μm.
The discharge product Li2O2 volume fraction of ultra-thin Li-air battery at different discharging states is stated in Figs. 10a–10h. Figure 10a shows that there is a small amount of precipitate, almost evenly distributed across the air electrode under 0.05mA/cm2 initially. As discharging proceeds, precipitate accumulates in the porous channel space of electrode, and shows a small scale growth at the stage (b) and (c). The Li2O2 volume fraction enlarges as discharging further proceeds as a result of specially varying reaction rate. In the stage Fig. 10d which is near fully discharged, the volume fraction of insoluble products Li2O2 is 5 times larger than that of the initial state. Figs. 10e–10h displays the gradient of Li2O2 volume fraction enlarges as discharging proceeds under 0.5mA/cm2. Comparing with 0.05mA/cm2, the gradient variation is larger under the same discharging state. Fig. 10e displays the contours under 0.5mA/cm2, showing discernable gradients even at the initial stage. At the state (f), the volume fraction of precipitate at outer and inner air electrode is almost equal to 0.2 and 0.1, respectively. At the state (g), over 35% volume space of pores and channels is occupied by precipitates in the outer electrode, while about 10% in the inner one. It is clear that under higher currents the gradient is larger, thus more electrode pore space is unavailable for storing Li2O2. As a result, the specific capacity suffers.
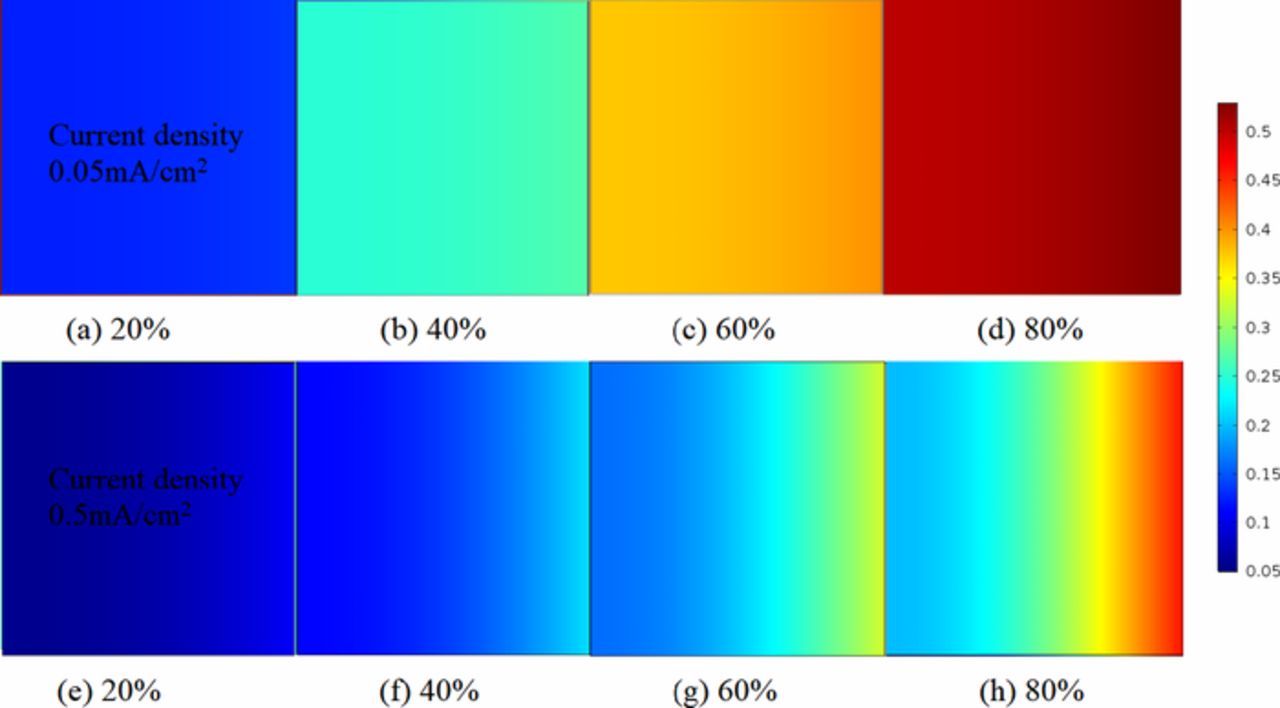
Figure 10. Concentrations comparison of Li2O2 volume fraction between various discharge current densities at different discharge states. (a)–(d) are presented for discharge current density = 0.05mA/cm2. (e)–(h) are presented for discharge current density = 0.5mA/cm2. Air electrode thickness is 80μm. Initial porosity is 0.85.
The over potential distribution of the ultra-thin air electrode under different discharge current densities is presented in Fig. 11a. It indicates that the over potential curve is relatively stable when the current density is 0.05mA /cm2. The over potential of oxygen region and electrolyte region is roughly the same in the early and middle stages, and it increases rapidly at the end of discharge. The internal resistance increases caused by the consumption of active substances in the ultra-thin battery near fully discharged.
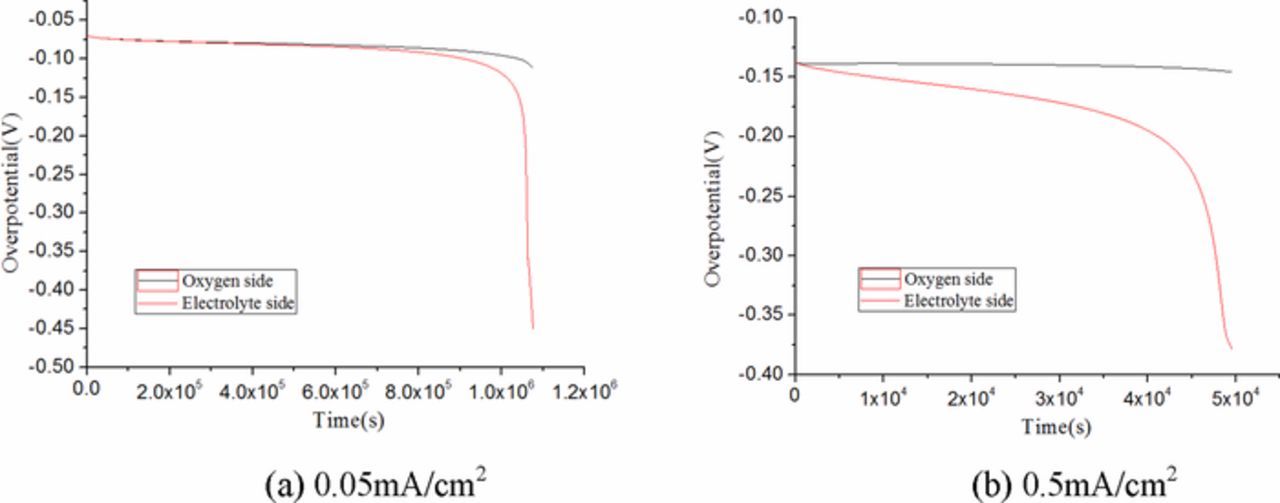
Figure 11. Comparison of over potential between various discharge current densities at full discharged. Air electrode ultra-thin thickness is 80μm. Initial porosity is 0.85.
The voltage drop on the oxygen side remains basically unchanged, however, the over potential of electrolyte side continues to increase and reached 0.38v at the last moment as a large current of 0.5mA/cm2 as shown in Fig. 11b, which hinders the overall capacity of ultra-thin Li-air battery seriously. It can be explained that the consumption of active substances is quite large when the ORR reaction rate is rapid at the early state of discharge, the internal resistance rises sharply.
Effects of initial oxygen concentration on battery properties based on ultra-thin air electrode during discharge
Both of the specific capacity and the cell voltage rise as the oxygen concentration increases shown in Fig. 12. Nonetheless, when the external oxygen concentration increases from 4.73mol/m3 to 18.92mol/m3, the battery capacity increases from 380mAh/g to 1300mAh/g, an increase of nearly 3.4 times with the thicker air electrode as shown in Fig. 12b.39 This is because a large amount of Li2O2 are formed by combining Li+ with oxygen in the thicker air electrode as the increase of oxygen concentration. The battery capacity improves greatly before the oxygen concentration saturates. However, there has less influence on specific capacity and the cell voltage when the oxygen concentration is over 9.46mol/m3 with the ultra-thin air electrode. The variations of capacity and voltage have no significant change while the oxygen concentration is larger than 14.19mol/m3. The explanation is that the saturation state is easy to be achieved when the oxygen concentration is enough high with ultra-thin thickness of air electrode.
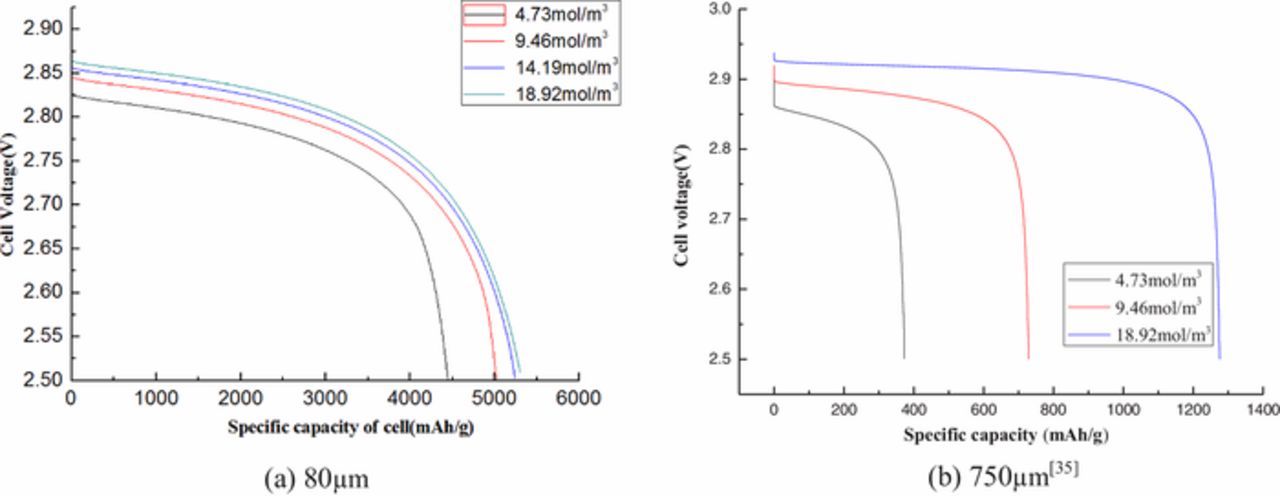
Figure 12. Discharge curves at different initial oxygen concentrations of 4.73, 9.46, 14.19 and 18.92 mAcm−2, respectively.
The comparison of Li2O2 volume fraction between various initial oxygen concentrations at different discharge states is presented in Fig. 13. The volume fraction of Li2O2 is larger when it is close to the oxygen feed side of the air electrode near full discharge, and smaller when it is far away from the side near state stage of discharge, which is pointed on both ultra-thin battery and common battery as shown in Fig. 6. Moreover, the volume fraction decreases with the increase of oxygen concentration at each state. The reason is that a heavy oxygen concentration difference is formed during the discharge when the oxygen concentration is large, as shown in Figs. 13e–13f. Under this difference, oxygen diffuses rapidly to the inside of the battery near the separator. It reacts in the direction of oxygen diffusion gradually, generating Li2O2 products with a certain thickness. The ORR reaction occurs near oxygen supply side due to the small concentration gradient is formed when the oxygen concentration is low, as shown in Figs. 13a–13d. Li2O2 blocks the oxygen entrances into the porous channel, and then the porosity of the air electrode reduces, which results in less oxygen diffusion into the battery.
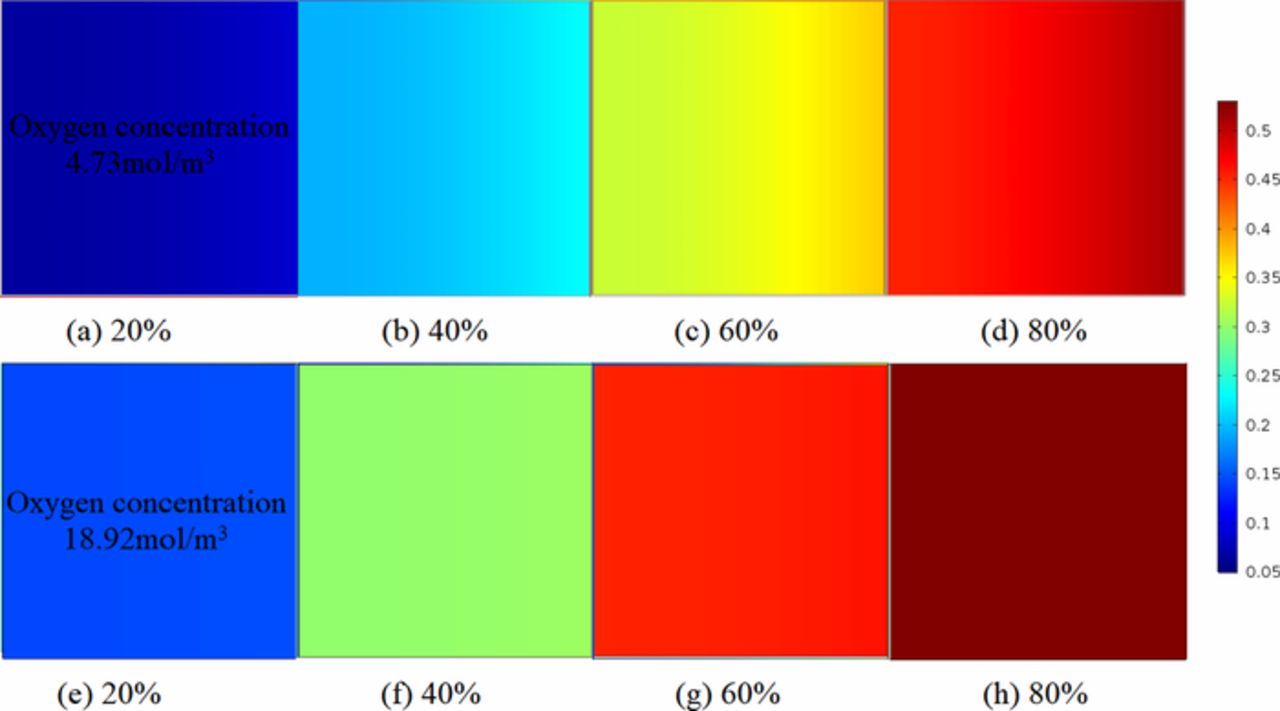
Figure 13. Concentrations comparison of Li2O2 volume fraction between various initial oxygen concentrations at different discharge states. (a)–(d) are presented for oxygen concentration = 4.73mol/m3. (e)–(h) are presented for oxygen concentration = 18.92mol/m3. Air electrode thickness is 80μm. Initial porosity is 0.85.
Conclusions
A 2-D transient Li-air battery model was developed by combination the mass transfer equations and electrochemical equations to investigate the effects of the ultra-thin air electrode on the distributions of oxygen, Li2O2 volume fraction, porosity and local ORR reaction rate of battery during discharge. The simulation results agreed well with the experimental data wherein the model accurately captured voltage decline behaviors due to accumulated Li2O2 in the air electrode. A major focus was on accurate predictions of the effects of ultra-thin air electrode on the performance of Li-air battery. The model developed in this study has been run at various scenarios to make the following conclusions:
- (1)The thickness of air electrode affects the property of Li-air battery severely. It attributes to both the scarcity of electrochemical reaction active sites in the thinner air electrode and the increasing of the transfer resistance in the thicker air electrode. The optimal thickness of ultra-thin air electrode is determined as 80μm, which provides the high-specific capacity of Li-air battery.
- (2)The effects of ultra-thin electrode are reflected in the properties of Li-air battery such as distribution of oxygen concentration, Li2O2 volume fraction, porosity, and local ORR reaction rate. The volume fraction of Li2O2 and porosity present uniform distribution along the ultra-thin air electrodes from air feed side to separator side at arbitrary varying discharge state. Therefore, the oxygen is sufficiently supplied and diffused in the porous channel of ultra-thin electrode, which enhances the reaction rate of ORR and make a promotion on the battery performance.
- (3)The discharge current density significantly influenced the property of ultra-thin Li-air battery. The low discharge current density with ultra-thin electrode thickness leads to a larger specific capacity and homogeneous oxygen distribution. The discernable gradients of Li2O2 volume fraction and over potential were caused by the ohm polarization great increasing and serious air electrode passivation as the discharge current increased.
- (4)The increased initial oxygen concentration enhanced the Li2O2 volume fraction, but never affected the specific capacity and the cell voltage obviously of ultra-thin Li-air battery when the oxygen concentration is over 9.46mol/m3. The reason can be concluded that the saturation is really easy to be achieved when the oxygen concentration is high enough in the ultra-thin air electrode.
Acknowledgment
This research was supported by the National Natural Science Foundation of China (51776131, 51906166), Liaoning Revitalization Talents Program (XLYC1802045) and the Natural Science Foundation of Liaoning Province (20170540746).