Abstract
An approach to increase the autonomy of batteries developed for transportation applications, without changing currently-used positive and negative active materials, is to increase the battery energy density by increasing the active material loading (mg.cm−²) of the electrodes. A direct consequence of a higher loading is the increase of mass transport-related issues across the electrode porosity. Therefore, the optimization of the porous electrode structure is mandatory to facilitate the access of lithium ions to the whole electrode volume. In this regard, pore tortuosity is a key parameter whose determination is not so straightforward. Although tomography techniques and corresponding analyses are promising methods to acquire precise geometrical information about porous electrode, they hardly can be used as a routine technique. In this work, a transmission-line-model analysis of the electrochemical impedance diagram of symmetric cells containing porous electrodes in blocking condition, i.e. without any charge transfer reaction, is proposed in order to readily derive pore tortuosity. The method is applied to a set of graphite electrodes composed of anisotropic particles.
Export citation and abstract BibTeX RIS

This is an open access article distributed under the terms of the Creative Commons Attribution Non-Commercial No Derivatives 4.0 License (CC BY-NC-ND, http://creativecommons.org/licenses/by-nc-nd/4.0/), which permits non-commercial reuse, distribution, and reproduction in any medium, provided the original work is not changed in any way and is properly cited. For permission for commercial reuse, please email: oa@electrochem.org.
Lithium-ion technology is the leading contender for transportation applications such as plug-in, hybrid, and electric vehicles.1,2 It offers the highest energy density among the different existing battery technologies such as nickel metal hydride (NiMH), nickel cadmium (NiCd), and lead acid.3 Additionally, Li-ion batteries exhibit good electrochemical and thermal stability,4,5 long life, low self-discharge rate and good charge/discharge rate capability.6–10 Nevertheless, today's electric vehicle performance still need improvement in terms of autonomy, recharge time, and cost, in order to approach internal-combustion-engine-vehicle capabilities.9,11 Increasing electrode loading is one of the most straightforward way to increase energy density and thereby the vehicle range. However, high-loading electrodes will suffer larger power limitations, which might be a problem, in particular during fast charging of the battery pack. Power limitations will mostly arise because of lithium-ion transport limitations across the electrode porosity and are known to increase with the electrode thickness or with a decrease of the porosity.
To predict power limitations of an actual electrode design, accurate modeling of mass transport is desired. Nowadays, the most popular and efficient battery model is the so-called Newman's model that relies on the porous electrode theory.12 The porous electrode is described as the superposition of the liquid and solid phases that are defined by their respective volume fraction and interfacial surface area. Electrode properties are averaged over volume elements which are small compared to the overall dimension of the system but large compared to the pore details. Therefore, the pore detail is neglected and the electrode geometry is fully described by its thickness, the interfacial area per unit volume of electrode, and volume fractions and tortuosities of liquid and solid phases. An accurate estimation of such parameters will condition model prediction capability. It is customary that pore tortuosity is estimated from the electrode porosity using Bruggeman relation.13–15 Though it was validated in the case of a bed of spherical particles,16,17 tortuosity was shown to strongly deviate from this relation in the case of anisotropic particles.18–20 For instance, graphite negative electrodes often consist of platelet-shaped or potato-shaped particles that tend to align parallel to the copper current collector.21 Hence, through-plane pore tortuosity is expected to lie well above the value estimated from Bruggeman relation. Two groups of methods to determine electrode tortuosity are reported in the literature: one derives from an analysis of electrode tomography data and another one relies on electrochemistry. According to the first group of methods, Wood et al. determined the tortuosity of graphite negative electrodes.20 They solved numerical diffusion equations in a 3D-reconstructed graphite-electrode volume originating from imaging data acquired using X-ray tomography experiments. They obtained through-plane tortuosity values of about 6 at 40% porosity for a platelet-shaped graphite. The second method, based on electrochemistry, was implemented by Wheeler and coworkers22,23 and consisted of restricted-diffusion experiments on a Li/Li symmetric cell. The porous electrode to be analyzed was first delaminated from the current collector and was placed in between two pieces of separator; this assembly was then placed in between two Li foils. From a model analysis of restricted diffusion data, they reported through-plane tortuosity values of 7.5 at 35% porosity for an SFG-type graphite.
Another electrochemical method is reported herein that is based on Electrochemical Impedance Spectroscopy (EIS) experiments on a symmetric cell made up of the porous electrodes from which the tortuosity is sought. In the literature, impedance diagram of symmetric cells were analyzed with transmission line models (TLM) to derive information about charge transfer and ionic resistances.24–26 However, to the best of the authors' knowledge, no tortuosity value was extracted from the TLM analysis. Herein, a TLM is also used in order to analyze impedance data obtained on the symmetric cells, and circuit elements of the TLM are expressed as a function of physical and geometrical parameters, by analogy with Newman's model [referred to as pseudo 2-dimensional model (P2D) hereafter]. After the model is introduced in the Model development section, it is used to analyze EIS data of symmetric cells based on a set of graphite electrodes with different loadings and porosities. Through-plane tortuosity values obtained for each electrode design are then compared and discussed.
Materials and Methods
A set of industry-grade graphite electrodes is analyzed in this work. The composition of the electrodes is 97% wt of graphite, 1% wt of carboxy-methyl cellulose (CMC), 1% wt of styrene-butadiene (SBR), and 1% wt of conductive carbon. The graphite particle size distribution (PaSD) is determined by laser diffraction. The d50 value of the distribution is 19.5 μm. Electrode thickness is measured on cross-section images obtained by optical-microscopy observations of prepared electrode samples. The electrode samples are impregnated with a low viscosity epoxy-resin solution and the dried molds side is polished to clean the observed surface. Mean electrode porosity is evaluated from weight and composition. A total of sixteen electrodes is investigated that is comprised of four separate loadings (4.8-8.8-11.9-15.7 mg.cm−2) and four different porosities, between 10 and 40%.
All EIS measurements are performed on pristine-graphite electrodes assembled into symmetric coin cells inside an argon-filled glove box. Electrodes of a same cell consist of 14-mm disks that are punched from the same batch. Celgard 2500 is used as the separator, and has a thickness of 25 μm. The electrolyte is EC:DEC (1:1 wt%) with 1 M LiPF6 (LP40), which is conveniently selected because its transport properties were reported in different publications.27,28 Impedance diagrams are recorded at open circuit potential between 1 MHz and 1 mHz with a perturbation amplitude of 5 mV using a VMP3 (Bio-logic, France). Impedance data are repeatable for all electrode designs. This is an advantage of using a symmetric cell for studying impedance, thereby circumventing the use of a reference electrode, which size and positioning possibly lead to distortion of impedance diagrams.29,30
The fit of the measured impedance spectra using the TLM presented in the next section is automatized using a Matlab script. lsqnonlin is used as the non-linear fitting function so as to minimize the following objective function
![Equation ([1])](https://content.cld.iop.org/journals/1945-7111/164/11/E3329/revision1/d0001.gif)
where  and
and  are the real and imaginary parts of the experimentally-measured impedance, respectively,
  and
and  are the real and imaginary parts of the simulated impedance, respectively. f represents the experimental frequency domain.
Model Development
The TLM presented hereafter is developed in the case of the impedance study of symmetric cells made out of blocking electrodes, i.e., Li insertion/de-insertion does not occur. The TLM is based on effective conductivities of liquid and solid phases, as well as capacitive charging/discharging at the interface between liquid and solid (Fig 1). Because electrodes are in blocking condition, liquid-phase diffusion is neglected. The validity of this assumption is assessed in the Results and discussion section, using a comparison between the TLM and Newman's P2D model solved in the frequency domain.31–34 The TLM consists of an equation system deriving from Kirchhoff's laws. There are 3n variables to solve for, among which n normalized currents  ,
,  and
and  at each node k of the porous electrode, which stand for the electronic current in the solid phase, the ionic current in the liquid phase, and the capacitive current at the interface between the two phases, respectively. Normalization is with respect to the total current
  across the electrode and therefore all currents are dimensionless quantities in the following set of equations. The 3n equations that are needed to solve for currents are
![Equation ([2])](https://content.cld.iop.org/journals/1945-7111/164/11/E3329/revision1/d0002.gif)
![Equation ([3])](https://content.cld.iop.org/journals/1945-7111/164/11/E3329/revision1/d0003.gif)
![Equation ([4])](https://content.cld.iop.org/journals/1945-7111/164/11/E3329/revision1/d0004.gif)
with the boundary conditions
![Equation ([5])](https://content.cld.iop.org/journals/1945-7111/164/11/E3329/revision1/d0005.gif)
![Equation ([6])](https://content.cld.iop.org/journals/1945-7111/164/11/E3329/revision1/d0006.gif)
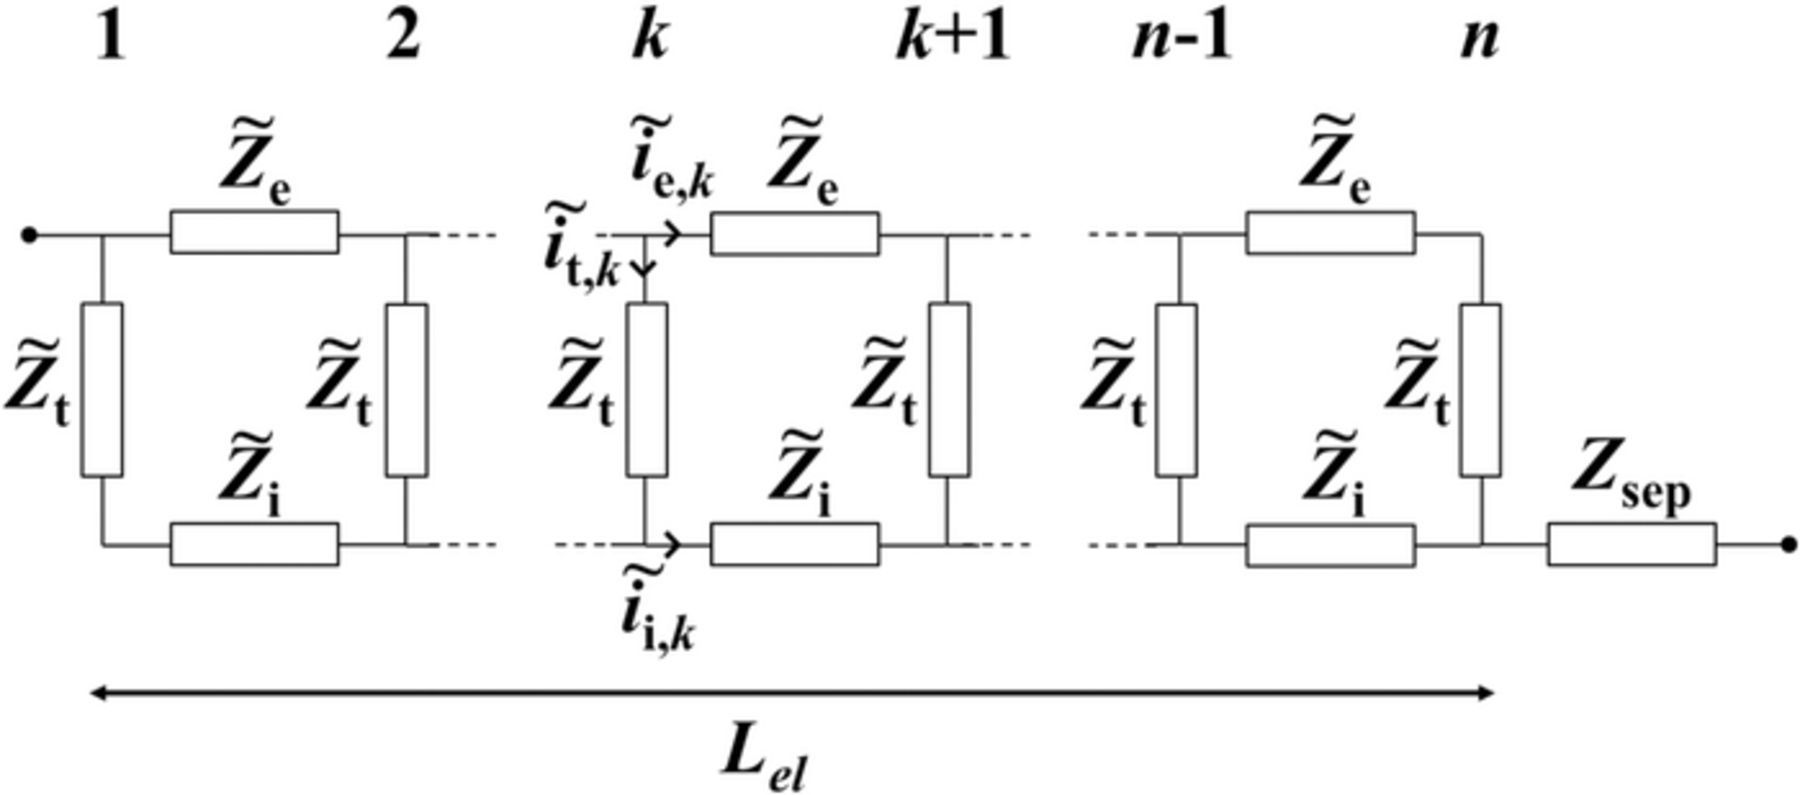
Figure 1. Transmission line representing the equivalent electric circuit of a porous electrode. The top-line stands for the solid phase electronic path while the bottom-line stands for the liquid phase ionic path.
Terms  ,
,  , and
, and  are expressed by identification to Ohm's laws at one node, ensuring consistency with the porous electrode theory,12 i.e.
![Equation ([7])](https://content.cld.iop.org/journals/1945-7111/164/11/E3329/revision1/d0007.gif)
![Equation ([8])](https://content.cld.iop.org/journals/1945-7111/164/11/E3329/revision1/d0008.gif)
![Equation ([9])](https://content.cld.iop.org/journals/1945-7111/164/11/E3329/revision1/d0009.gif)
where Lel is the electrode thickness (m), σ is the electronic conductivity of the electrode matrix (S.m−1), ɛ1 is the solid-phase volume fraction, τ1 is the solid-phase tortuosity, κ is the electrolyte conductivity (S.m−1), ɛ2 is the electrolyte volume fraction, τ2 is the electrolyte tortuosity,  , ω is the angular frequency (rad.s−1), a is the specific interfacial area between the solid and liquid phases expressed as the ratio of the porous electrode active surface area (ASA) per electrode volume (m2ASA.m−3), Q0 is the interfacial pseudo-capacitance (F.m−2ASA.s−(1-α)), α is the exponent in the constant-phase element (CPE) and accounts for the deviation of the CPE from a pure capacitor, Q is a pseudo-capacitance expressed per surface area of the electrode (SA) (F.m−2SA.s−(1-α)).34–36 Further discussion about the use of a CPE rather than a pure capacitor is deferred to the Results and discussion section.
The above system of equations is implemented in a Matlab script and all normalized current variables are readily solved for by matrix inversion. Then the porous electrode impedance  is computed using, e.g.,
![Equation ([10])](https://content.cld.iop.org/journals/1945-7111/164/11/E3329/revision1/d0010.gif)
Alternately, an analytic solution developed by Tröltzsch and Kanoun37 for the transmission line of Fig. 1 offers a straightforward way to compute the electrode impedance. The porous electrode impedance  is then expressed as,
![Equation ([11])](https://content.cld.iop.org/journals/1945-7111/164/11/E3329/revision1/d0011.gif)
where 


Finally, the impedance of the symmetric cell  is calculated as
![Equation ([12])](https://content.cld.iop.org/journals/1945-7111/164/11/E3329/revision1/d0012.gif)
where Lsep is the separator thickness, ɛsep is the pore volume fraction of the separator and τsep is the separator tortuosity.
Results and Discussion
Symmetric cell impedance of porous electrodes
The Nyquist impedance diagram of a symmetric cell based on blocking porous electrodes features three distinct domains (Fig. 2):38,39 (I) a high-frequency contribution combining an inductive contribution of cables, the electrolyte resistance, and ohmic contacts, (II) a mid-frequency contribution showing up as a ∼45° slope that relates to the distributed resistance in the electrode porosity, and (III) a capacitive contribution linked to the double layer charging at the graphite surface with a theoretical slope of 90°. The second domain is sensitive to the electrolyte conductivity as well as to the electrode parameters such as the thickness, the pore tortuosity and the electrolyte volume fraction, which are linked to microstructural parameters such as the pore length and radius. The extent of the second domain relates to the penetration depth of the AC signal in the pores, which depends upon the frequency and the pore size. For a same frequency, the signal will penetrate further in large pores than in small ones. As the frequency keeps decreasing, the impedance response of smaller pores adds up to that of the larger ones.40 As an example, the impedance diagrams of three symmetric cells containing three different electrode designs are presented in Fig. 3. A larger thickness and/or a lower porosity of the electrodes result in a larger extent of the second domain. In practice, both slopes of the second and third domains are lower than what is predicted by De Levie's and Newman's porous electrode models.41,42 Deviation from 45° toward smaller angles in the second domain is mainly ascribed to the pore shape. Using an adapted De Levie model, Keiser et al. demonstrated that this behavior results from bottle-neck pores,43 and Itagaki et al. confirmed this conclusion using a fractal De Levie model with three pore-size scales.42 The deviation of the third region toward smaller angles is essentially ascribed to the non-uniformity of electrode properties,44,45 which can be the result of, e.g., particle surface roughness or the way particles are stacked in the electrode. Note that both of these will have an effect on the pore shape and pore size distribution (PoSD).40,46 Song et al. managed to fit the third domain by introducing a PoSD in the De Levie's TLM.40 Another option, which is that we have selected herein, is to lump all deviation sources of the third region into a CPE rather than a pure capacitance. To ensure consistency between Newman's physics-based model and the TLM, the CPE α exponent should not depart too much from unity. An α exponent that strongly deviates from one would suggest that the physics-based model is not appropriate to analyze the experimental data.
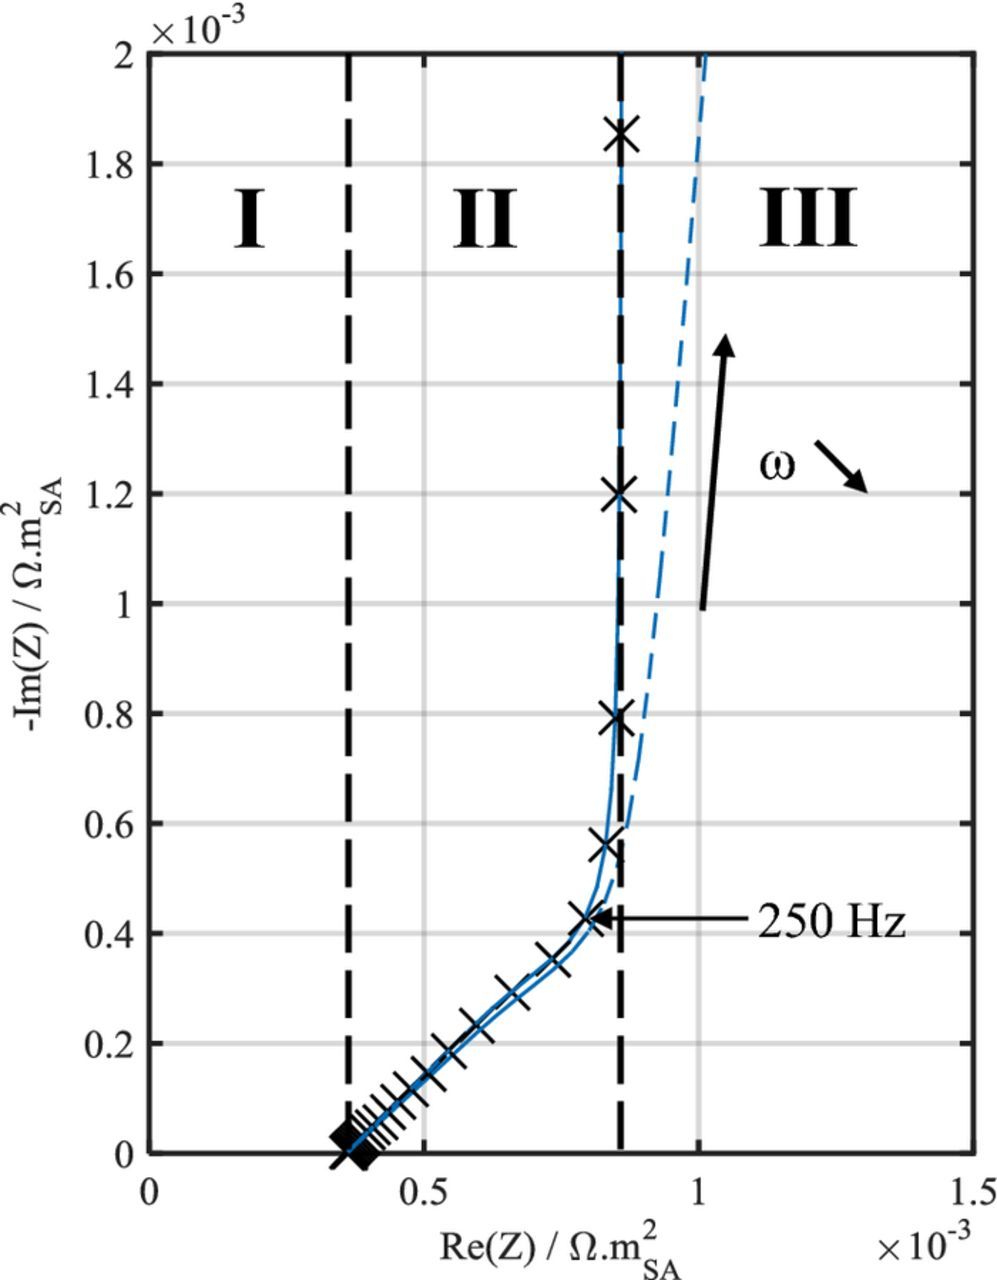
Figure 2. Nyquist plot representation of model simulations using identical parameters for the P2D model (black cross) and TLM with α = 1 (blue line) and α = 0.95 (blue dotted-line). The three domains dividing the Nyquist plot diagram are indicated, to support discussion in text.
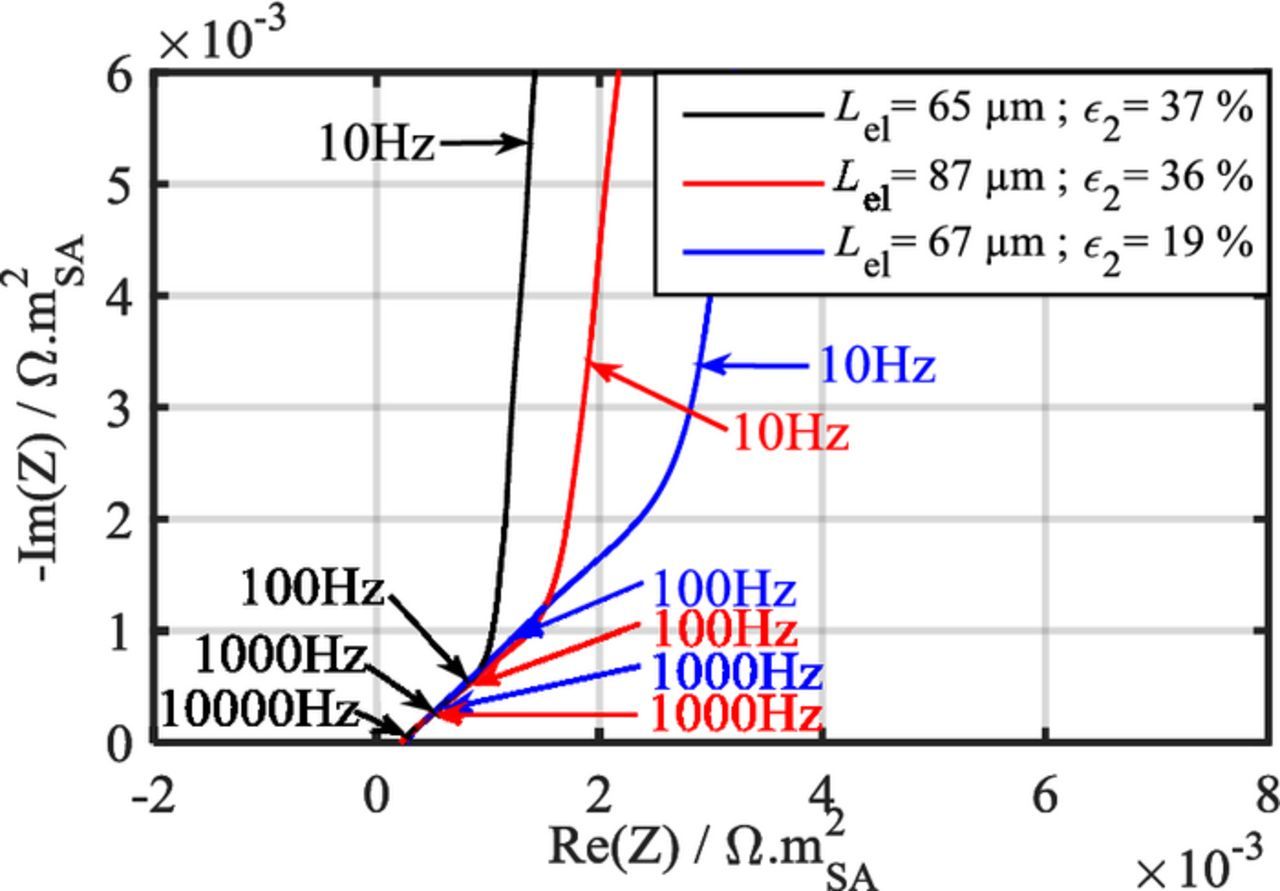
Figure 3. Impact of the electrode geometry on the impedance diagrams of graphite symmetric coin cells.
TLM fitting
Prior to analyze data with the TLM model, it is validated against Newman's P2D model for the limiting case where the CPE exponent α is 1, see Fig. 2. This result also confirms that electrolyte diffusion can be safely neglected with the present experimental setup (blocking electrodes).
Impedance diagrams acquired on all sixteen different graphite electrode designs are fitted using the TLM. Two examples of the TLM fitting of the impedance data of electrodes with different designs are presented in Fig. 4. The list of model parameters provided in Table I is used for the simulations. Only three parameters, namely the pseudo double-layer capacitance Q0, the CPE α exponent, and the pore tortuosity across the electrode τ2, are fitted to the cell impedance diagrams. From model/experiment comparison, the pore tortuosity affects the impedance extent of the second domain while the capacitance only produces a shift of the characteristic frequencies. No influence of the solid phase conductivity on this domain is observed in the typical range of electronic conductivity reported for graphite electrodes (2000 S.m−1 or more47).
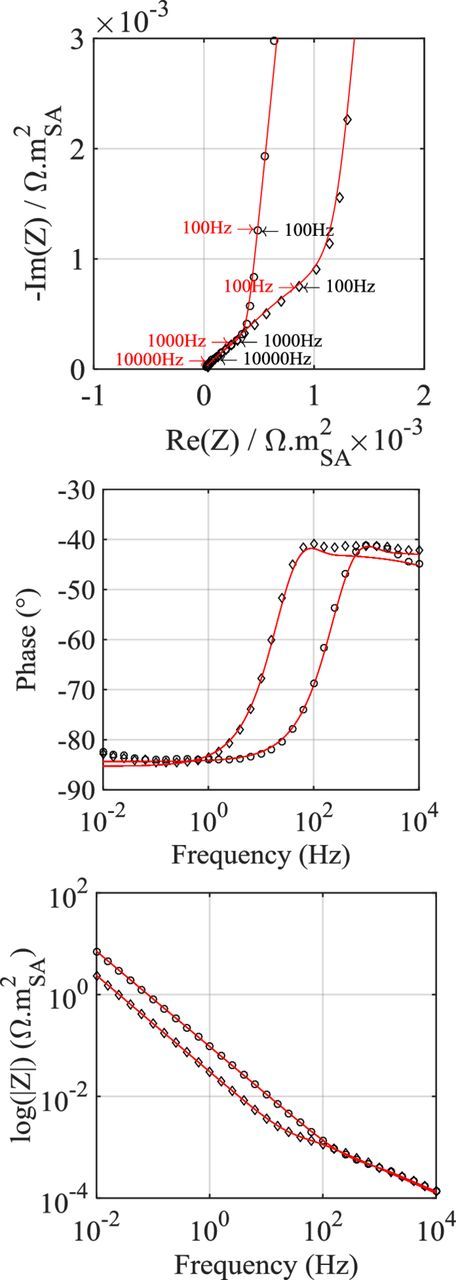
Figure 4. TLM fit examples of a thin (4.8 mg.cm−²) (circles) and a thick (15.7 mg.cm−²) (diamonds) electrodes with similar porosity values (∼40%).
Table I. List of the model parameters used for graphite symmetric cell simulations at 25°C (a: assumed, m: measured, s: set, dj: Djian et al.,51 e: Ender et al.,47 lu: Lundgren et al.28).
| Parameter | Value |
|---|---|
| Separator thickness (m) | 25 × 10−6m |
| Separator porosity | 0.55dj |
| Separator tortuosity | 6.25dj |
| Initial salt concentration (mol m−3) | 1000s |
| Solid phase conductivity (S m−1) | 2203.8e |
| Mean graphite particle radius (m) | 9.7 × 10⁻⁶m |
| Li+ conductivity (S m−1) | 0.792lu |
| Li+ molar diffusion coefficient (m² s−1) (P2D model only) | 2.68 × 10⁻¹⁰lu |
| Li+ transference number (P2D model only) | 0.162lu |
| Thermodynamic factor (P2D model only) | 1.63lu |
| Initial state of charge (P2D model only) | 0s |
The fitted pseudo-capacitance value depends upon the specific interfacial area a. If a spherical shape is assumed for the graphite particles, a can be expressed using the following equation:
![Equation ([13])](https://content.cld.iop.org/journals/1945-7111/164/11/E3329/revision1/d0013.gif)
where ɛAM is the active material volume fraction and ⟨R⟩ is the mean radius of the graphite particles. Note that the above expression is the same as that used for intercalation, and thus it bears the assumption that there is no double-layer charging/discharging taking place on the carbon additive.
The fitted interfacial pseudo-capacitance value Q0, averaged over the full set of electrodes is 0.93 F.m−²ASA.s−(1-α)., which is in agreement with values reported in the literature for HOPG edge planes (0.6-1.5 F.m−2ASA48,49). The method used here to determine the pseudo-capacitance does not allow to separate out contributions from graphite edge and basal planes. Fitted interfacial pseudo-capacitance values Q0 are found to increase with a decrease in electrode porosity for each of the four loadings (Figure 5). This could be explained by an underestimation of the calculated specific interfacial area a for the electrodes with the lowest porosity. Without confronting the results to another method, no proper conclusion can be drawn and pseudo-capacitance and specific interfacial area cannot be determined unequivocally. The CPE α exponent has a mean value of 0.95, which validates the use of a CPE in the TLM to analyze these data.

Figure 5. Variation of the interfacial pseudo-capacitance Q0 as a function of the active material fraction ɛ1 for the whole set of graphite electrodes.
The fitted pore tortuosities are plotted against electrode porosity for each four loadings in Fig. 6. Tortuosity ranges from 5.5 to about 9. These values lie well above those predicted by the Bruggeman equation.17 As mentioned in the introduction, such high tortuosity values were reported in a number of publications for different designs of electrodes containing anisotropic particles.18,50 A power-law with a pre-exponential term can be fitted to the data as it was introduced by Thorat et al.23 The power-law equations fitted to the tortuosity data are indicated in Figure 6 legends. Loadings 4.8, 11.9 and 15.7 mg.cm−² have similar coefficient values for the power law fit while loading 8.8 mg.cm−² has a different porosity exponent value. This observation could be explained by the fact that the power law fit is more sensitive to the lowest porosity value data point. Indeed, the second loading has an electrode design with the lowest porosity value among all loadings. Unlike for the other electrode designs, the fitted tortuosity values for this data point are highly dispersed which could be explained by a bad electrolyte wetting and/or large heterogeneities of local porosity among the disk-punched electrodes. Again, a mean porosity value is used for all fit of the same electrode design. As the porosity reaches values below 15%, the model becomes more sensitive to the input porosity value. Variation of 1% of porosity can lead to fitted pore tortuosity variation of about 0.75. Excluding the second loading from the analysis, the pre-exponential coefficient varies between 3 and 4 while the porosity exponent is around 0.46. It appears like a translated Bruggeman relation which would account for a peculiar electrode microstructure resulting from the anisotropic shape of graphite particles. Wheeler et al. reported values in the same range (4.8 ɛ−0.53) for another type of graphite. The fitted exponent value (<0.5) suggests a moderate influence of the electrode porosity on the tortuosity value, whereas the somewhat large pre-exponential term relates to the active-material geometry. The high scaling factor value may be due to the shape, distribution of sizes and orientations of the graphite particles. It has been showed in a previous study21 of the same graphite electrode batch that the amount of particles oriented in directions nearly parallel to the current collector represents from 30% to 60% of the total electrode graphite particles depending on the applied calendering pressure. The tortuosity values increase as the amount of graphite particles parallel to the current collector increases. Mass transport limitations in such designed graphite electrodes will rise at a lower C-rate threshold value than in less tortuous electrode.
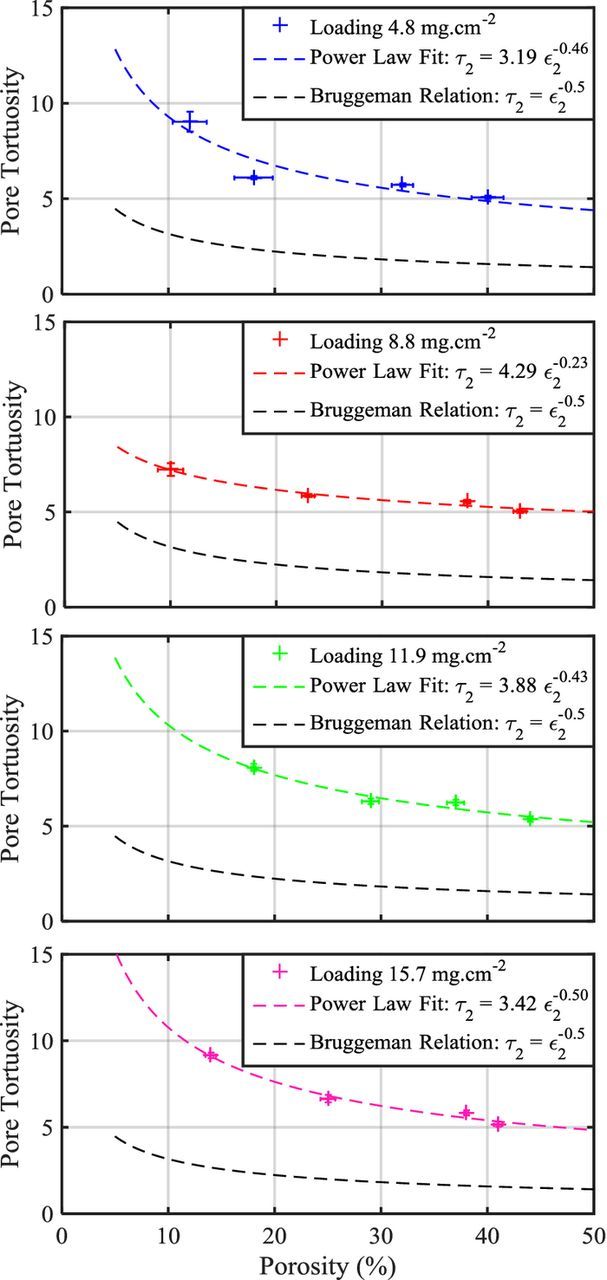
Figure 6. Fitted pore tortuosity using the TLM model, represented against porosity for four different electrode loadings; Bruggeman relation (black-dotted line) in comparison with a power law fit (dotted line) of each electrode loading.
Tortuosity of electrodes containing identical graphite particles should be independent of the electrode loading. The dispersion of tortuosity values for the four loadings can be explained by two factors. The first one is the error made on the determination of the electrode thickness and porosity, which is not taken into account in the vertical error bars of Fig. 6. Especially, a mean porosity value calculated for each electrode design is used in the model analysis although porosity may vary slightly from an electrode to the other within a same batch due to small variations in electrode thickness. The error made on calculating porosity decreases when electrode loading increases, hence tortuosity results of high-loading electrodes are likely more reliable. Finally, the local heterogeneities that are prone to occur in actual electrode and which are not described within the model constitute the second factor.
Conclusions
In the present study, a transmission line model developed to analyze the impedance diagram of a symmetric-cell model experiment is introduced. The TLM is validated against Newman's P2D model ensuring that diffusion phenomena can be neglected in the experiment. This model version corresponds to the case of blocking electrodes, i.e. without any charge transfer, considering only the double-layer charging/discharging. Most of the model parameters can be estimated through other techniques, which left us with three fitting parameters that can be extracted from impedance data fitting: a double-layer pseudo-capacitance Q0, the corresponding constant-phase-element α exponent and the pore tortuosity τ2 of the electrode. The model analysis is applied to a set of graphite electrodes of different thicknesses and porosities. The electrodes are composed of platelet-shaped particles that tend to align parallel to the copper current collector.21 It is shown that pore tortuosity values lie between 5 and 9 for porosities ranging from 45 to 10%. Similar tortuosities have already been reported in the literature as mentioned in the introduction. Ionic transport across such electrodes with high pore tortuosity value is anticipated as a power-limiting factor. Ongoing and future work focuses on ensuring the method reliability by comparing with other techniques such as that presented by Wheeler et al., as well as studying a wealth of electrode design, with different particle shapes. The method will also be extended to lithiated electrodes (positive electrode materials).
Acknowledgments
S. Malifarge is grateful to ANRT for partially supporting the funding of this research work. ZEON Corporation is acknowledged for support in this work. B. Fleutot (LRCS) is acknowledged for his help with some EIS measurements and helpful discussion. D. Gruet is also acknowledged for the electrode thickness measurements.