
Abstract
Au and Pt based nanomaterials have shown great promise for non-enzymatic based electrochemical glucose sensing, however obtaining a balance between good selectivity and high sensitivity is still an ongoing challenge. In this work we have developed glucose sensors that take advantage of the properties of both metals through the formation of bi-metallic Au-Pt alloy honeycomb-like structures with controlled Pt content during electrodeposition. The honeycomb-like structures were formed by employing hydrogen gas bubbles developed in-situ as a dynamic template. The developed films were found to possess large surface areas with a homogeneous spread of Au and Pt throughout the surface, enabling both high sensitivity and selectivity when compared to monometallic metal nanostructures. The sensitivity and experimental detection limit of the developed glucose sensor was determined to be 109.3 μA·mM−1·cm−2 (after a 10 s stabilization period) and 20 μM, respectively. Selectivity studies showed minimal to no interference in the presence of Acetic Acid (AA) and Uric Acid (UA), which we have attributed to the Au component of the electrodeposited nanostructures allowing detection at a lower potential, overcoming the lack of selectivity typically experienced by Pt.
Export citation and abstract BibTeX RIS
Diabetes is a chronic health condition affecting 387 million people worldwide and rising,1 casusing a lack in blood glucose concentration (Hypoglycemia) or an increase in blood glucose concentration (Hyperglycemia). The normal human blood glucose concentration is between 4.4–6.6 mM,2 however a person with hypoglycemia experiences blood glucose levels between 2.8–3.3 mM3 whilst a person with hyperglycemia has a blood glucose concentration between 7–11.1 mM.4 Due to this wide range in possible blood glucose concentrations which are exhibited, the need for more sensitive and accurate glucose sensors is becoming increasingly important. This rise in diabetic population has propagated research into the development of glucose sensors, with the number of papers reporting new developments increasing exponentially in recent years.5 Enzyme based glucose sensors initially reported by Clark and Lyons6 in 1962 were the first type of electrochemical based sensors developed, based around modified electrodes employing enzymes as the active component. Metal-based non-enzymatic glucose sensors were later shown to have greater promise due to their improved stability in varying pH media, high reproducibility and exclusion of the need for an oxygen source, as was the case to enzyme-based counterparts.7
As such, non-enzymatic glucose sensors have become the main focus of research and are usually based on noble-metals such as Au,8 Pt9 and Pd10 because they are simple to synthesize and are able to form nanostructures with high surface areas.11 In general, metals that are chosen for the sensor need to provide low on-set potentials for glucose oxidation, high sensitivities, low detection limits and/or good selectivity when interacting with common physiological contaminants.12 However, many pure metals display poor sensitivity for glucose in the presence of interfering contaminants and can be easily poisoned by adsorbed intermediates, affecting surface selectivity for the glucose electrooxidation. Of the aforementioned noble-metals, Au and Pt show the greatest promise12,13 with Au displaying low on-set potentials, good stability against physiological species and high activity in both neutral and alkali electrolytes.14,15 On the other hand, Pt displays very high sensitivities and excellent electrocatalytic activity toward glucose, however has poor selectivity, being easily hindered by physiological contaminants16 and a rapid loss in activity due to the accumulation of chemisorbed intermediates blocking the electrode surface.17 Each metal thus has their own advantages, where higher sensitivities are reported for Pt electrodes, but Au displays better electroactivity toward glucose oxidation than Pt.12 Therefore the use of bimetallic alloy materials is becoming more popular, as the secondary metal can further enhance the electrochemical glucose sensing performance of the substrate (or primary) by combining the individual properties of each metal. Previous research using alloy-based non-enzymatic glucose sensors which have proved such approach to be successful include Au-Pt,17,18 Ni-Co,19,20 Pt-Ni,21,22 Ni-Cu23 and Pt-Pb.24
From the numerous studies reported thus far, it has been shown that generally materials with large surface areas have relatively better glucose sensing performance. Furthermore, the alloying of Pt with Au is known to enhance the overall performance (sensitivity and selectivity) of electrochemical sensors toward glucose.24,25 Therefore it is proposed that by combining these two aspects of large surface area and control of the metal content while alloying, a synergistic enhancement of the surface toward non-enzymatic electrochemical sensing of glucose may be obtained, while overcoming the drawbacks of each metal. We tested our hypothesis by employing the recently developed dynamic hydrogen bubble template method26 to electrochemically deposit large honeycomb-like porous Au-Pt alloy films whilst controlling the metal content in the material produced. Au was chosen as the main component of the electrolyte due to its higher electroactivity toward glucose compared to Pt and the high level of reproducibility for Au-based electrodeposition methods. The cohesive (interconnected) growth of the Au-Pt alloys displayed excellent glucose sensing performance. It is envisaged that the alloy formation method and performance enhancement concepts presented in this study could potentially be used in other chemical and biochemical sensing applications.
Experimental
All chemicals used in this work were purchased from Sigma-Aldrich and used as received. Au films deposited on Si substrates were prepared using E-beam evaporation with an adhesion layer of 10 nm Ti on a Si wafer followed by application of a 100 nm Au layer. The wafer was diced to dimensions of 8 mm × 18 mm and masked in order to expose a consistent circular surface with an area of 0.238 cm2 having been used ((ø) of 5.5 mm) for each experiment. The electrodeposition experiments were performed using a CH instruments (CHI760C) electrochemical workstation attached to a model 680 amp booster. The electrochemical cell consisted of the working electrode (Au substrate), an auxiliary electrode (graphite rod) and a reference electrode (Ag/AgCl 3 M KCl, +0.197 V vs SHE). The Au substrate was pre-treated by electrochemically cycling between the potentials of 0 V and +1.4 V in 0.5 M sulfuric acid (H2SO4) at a scan rate of 100 mV·s−1. The electrodeposition of the Au-Pt alloy honeycomb films were performed at a constant potential of −4 V for 300s similar to the technique employed by Cherevko et al.27 The electrodeposition solution consisted of 10 mM HAuCl4 in 2 M H2SO4 with varying K2PtCl4 concentrations (0, 0.5, 1, 2.5 and 5 mM). The electrolyte salt concentration for each prepared sample of the honeycomb-like films is listed in Table I.
Table I. Electrodeposition variables for Au-Pt alloy honeycombs and the Au:Pt ratio of contributing percentages on the materials surface.
| Sample | HAuCl4 | K2PtCl4 | Au:Pt XPS composition |
|---|---|---|---|
| Name | conc. (mM) | conc. (mM) | (atom %) |
| Au | 0 | 0 | 100: 0 |
| Au10 | 10 | 0 | 100: 0 |
| Au10Pt0.5 | 10 | 0.5 | 92.3: 7.7 |
| Au10Pt1 | 10 | 1 | 86.9: 13.1 |
| Au10Pt2.5 | 10 | 2.5 | 69.2: 30.8 |
| Au10Pt5 | 10 | 5 | 44.9: 55.1 |
Surface characterization of the Au-Pt honeycomb substrates was performed using scanning electron microscopy (SEM) with high resolution (Verios 460L), energy dispersive X-ray spectroscopy (EDX) at an operating potential of 15 kV, X-ray diffraction (XRD, Bruker D8 Discover micro diffraction system with a general area diffraction detector system) which had a Cu-Kα radiation source with an operating voltage of 40 kV and a current of 40 mA and X-ray photoelectron spectroscopy (XPS, Thermo K-alpha, Al Kα) which operated at less than 10−9 Torr (data shifted according to C1 BE of 285 eV). Electrochemical surface area was determined using cyclic voltammetry in 10 mM K3Fe(CN)6 and 0.2 mM KCl at a scan rate of 50 mVs−1 employing a 3-electrode set-up, implementing the Au-Pt honeycomb as the working electrode, a Ag/AgCl reference electrode and a graphite rod as the counter electrode.
Glucose sensing was undertaken using cyclic voltammetry at a scan rate of 20 mV·s−1 in a solution of 0.5 M KOH and 10 mM glucose. Although the normal human glucose concentration range is between 4.4 and 6.6 mM,2 comparison analysis (CV and chronoamperometry at various applied potentials) was performed at 10 mM which allowed for relatively better response comparisons between the synthesized sensors over a lower glucose concentration. Chronoamperometric additions analysis of the optimal synthesized sensor was performed in a solution of 0.5 M KOH with various glucose concentrations ranging between 20 μM and 10 mM. This range covers concentrations of glucose in normal people (4.4–6.6 mM) and those with hyperglycaemia (7–11.1 mM). The concentrations lower than 4.4 mM were tested in order to show the relevance of our developed sensors for other applications such as food analysis.
Results and Discussion
The characterization of the electrochemically deposited Au-Pt honeycomb structures and their employment as electrode substrates for non-enzymatic electrochemical sensing application is presented in this section.
Au-Pt alloy honeycomb characterization
The deposition of Au-Pt honeycomb-like structures was performed at a potential of −4 V in electrolytes containing different Au and Pt concentrations to form alloys with varying Pt contents, as detailed in Table I. The extreme negative potential was used in order to generate hydrogen gas bubbles at the working electrode in-situ during the deposition process, which acts as a dynamic template for the porous honeycomb structures. The morphological changes that occur in the Au-Pt honeycomb structure as a result of increasing Pt concentration in the electrolyte are shown in Figure 1. The preparation of these honeycomb-like structures proved to be fast (within 300 seconds) and reproducible (similar images observed when surfaces were made on several occasions). Figure 1a shows an unmodified Au substrate which was used as the control substrate (Au-Ctrl) upon which electrodeposition was performed. Figure 1b displays the pure Au honeycomb (Au10) formed on the Au-Ctrl through the electrodeposition process. Large pores are seen across the surface of the film with an average diameter (ø) of 31.8 μm. The finer particles forming the overall structure are observed to have sizes in the range of ∼75 nm. The introduction of 0.5 mM Pt in the electrolyte (Au10Pt0.5) also leads to the formation of honeycomb-like structures with large pores (average ø of 22.9 μm) as shown in Figure 1c, however the finer features were observed to resemble thin leaf-like shapes branching off into large structures. This change in the finer structure morphology demonstrates how the introduction of Pt into the electrolyte solution significantly changes the fine structure of the honeycomb films formed. Increasing the Pt concentration in the electrolyte to 1 mM (Au10Pt1) was found to have an influence on the pore size (an average ø of only 22.3 μm) of the honeycomb structures and to a lesser extent, on the leaf-like shapes making up the structures as shown in Figure 1d. We attributed the evenly dispersed pore size across the surfaces resulting from relatively low Pt concentration to the occurrence of relatively low turbulent hydrogen evolution. The SEM images of the surfaces formed by further increasing the amount of Pt present in the electrolyte to 2.5 mM (Au10Pt2.5) and 5 mM (Au10Pt5) are shown in Figure 1e and Figure 1f, respectively. It can be seen that cracks appear to form across the surface of the substrate, which is postulated to be due to the increased Pt concentration resulting in a vigorous evolution of smaller hydrogen bubbles thereby giving rise to an alternative macro structure.28 As a result the average pore diameters have drastically reduced to 18.9 and 14.8 μm for Au10Pt2.5 and Au10Pt5, respectively. Similar to Au10, the finer structures making up the honeycombs are observed to be clumps of nanoparticles, which are thought to have reduced the active site density relative to lower Pt contents, which will be confirmed in the characterization results discussed further on. The thickness of the electrodeposited Au-Pt films were determined to be ∼90 μm from the SEM image taken at a 90° angle and presented in Figure S1 in SI. The porous nature of the developed Au-Pt films can also be observed from the higher magnification SEM image presented in Figure S2 in SI. The larger pores observed are a result of the hydrogen bubble template that was employed during electrodeposition process. Furthermore, the mechanical adhesion of bimetallic surfaces formed by electrodeposition is a common motivation26 of employing this technique to produce robust sensitive layers. The developed structures in this study were observed to maintain on the substrate throughout the characterization and experimental procedures thus demonstrating their strong adherence and robustness.
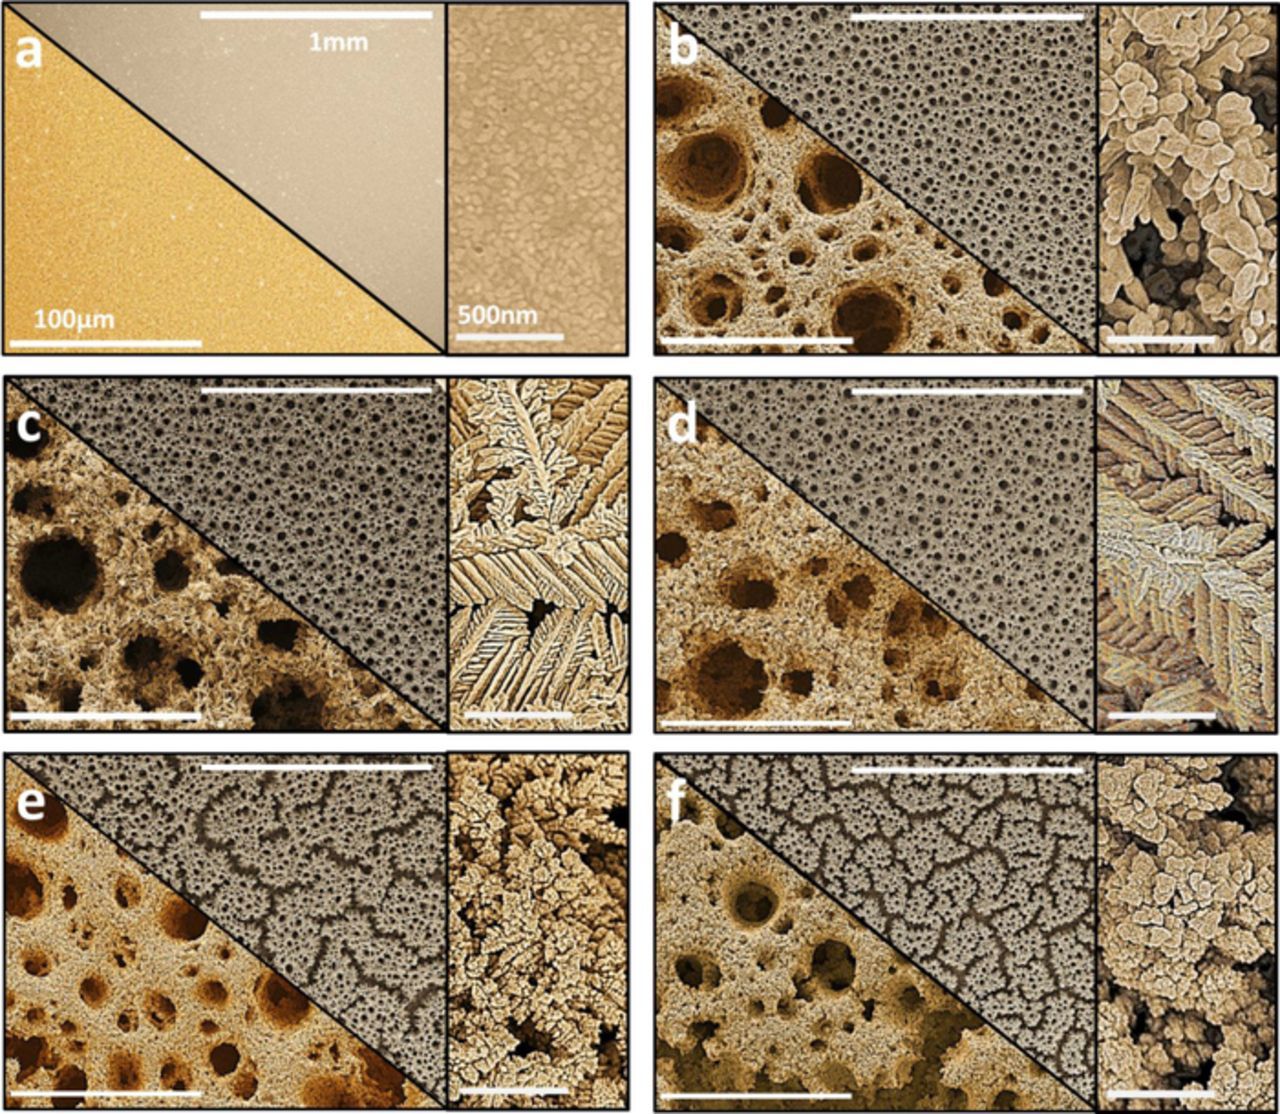
Figure 1. Low (top panel), high (bottom panel) and higher (right panel) magnification SEM images of Au-Pt honeycomb (a) Au substrate (b) Au10 (c) Au10Pt0.5 (d) Au10Pt1 (e) Au10Pt2.5 and (f) Au10Pt5.
XRD analysis was performed in order to determine the crystalline nature of the structures formed, the results of which are shown in Figure 2a. The XRD patterns showed peaks in 5 major locations where Au and Pt should appear for each substrate analyzed. A pure Pt substrate was used as a reference to demonstrate the shifting in 2θ values with changing Pt concentrations. There are 4 peaks that can be assigned to both Au and Pt face-center cubic (FCC) arrangements for the (111), (200), (220) and (331) reflections25,29 and are labelled accordingly in the figure. The peak relating to Pt (222) is not present for the samples formed in electrolytes with relatively lower Pt contents however starts to appear for the Au10Pt5 sample, along the Au (222) reflection. This is attributed to the dominant presence of Au in most of the Au-Pt honeycomb structures. The peaks observed in the XRD spectra have increased in 2θ values with increasing amounts of Pt in the solution (see Figure 2b and Table S1 in Supporting Information (SI)) which is a clear indication that Au-Pt alloy is being formed with an increasing Pt content in the electrodeposited surfaces.30
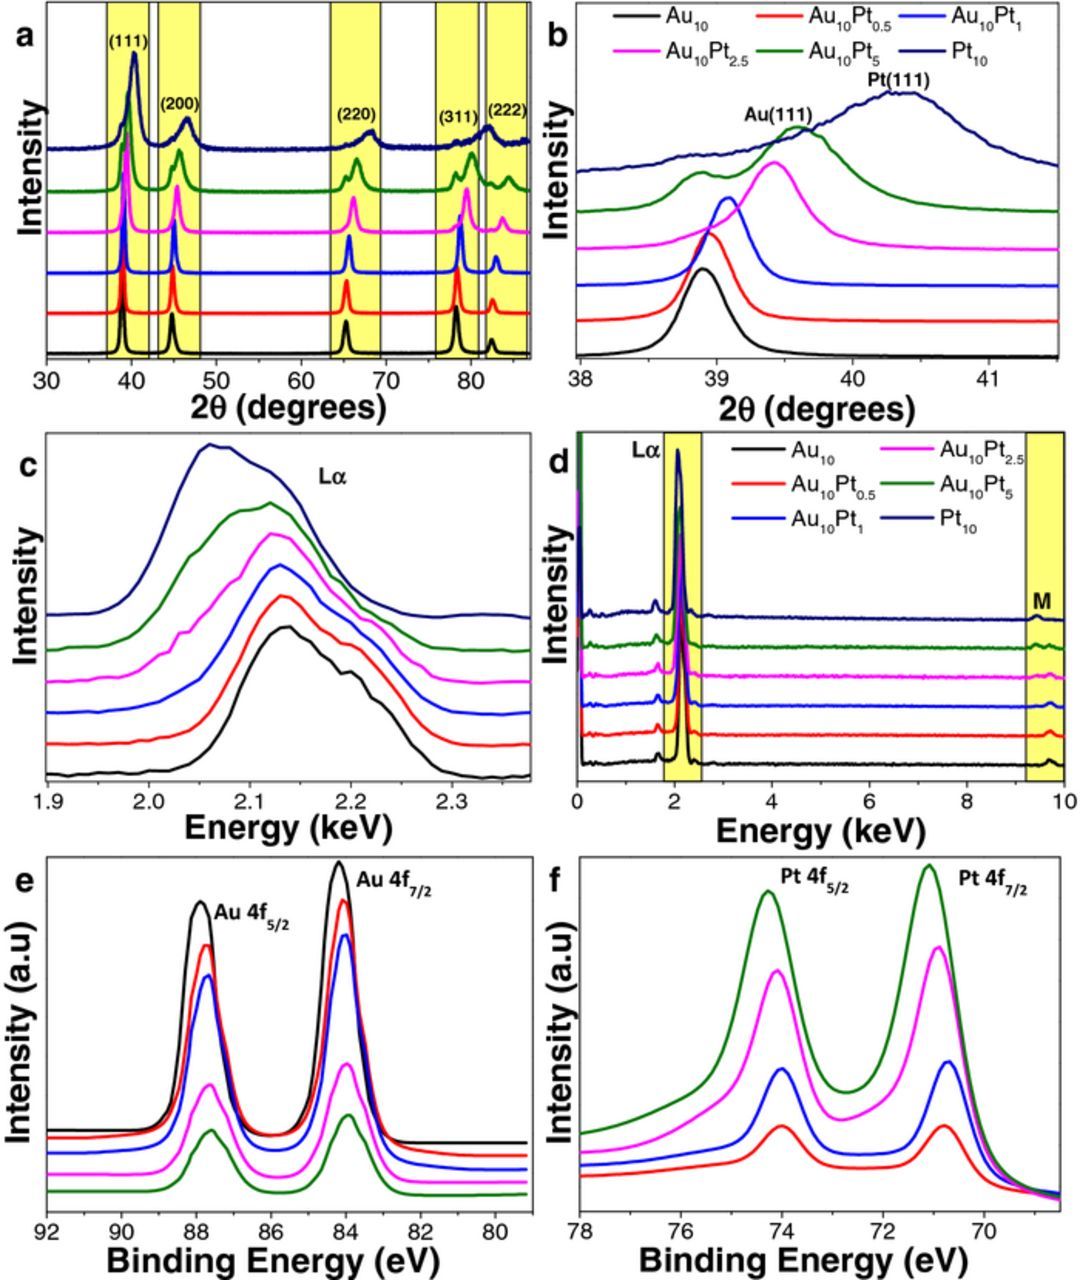
Figure 2. Characterization of Au-Pt honeycomb-like substrates (a) XRD analysis (b) magnified (111) peak of XRD pattern (c) EDX spectra (d) magnified Lα peak at 2.15 keV of EDX spectra (e) XPS analysis of Au 4f and (f) XPS analysis of Pt 4f core levels. (Labels in XRD and EDX analysis (Figure 2a and 2c) are consistent for XPS characterization graphs).
The increase in the Pt in the films is also evidenced from the EDX spectra presented in Figure 2c. A reduction in energy for the Lα peak from 2.14 keV for Au10 to 2.11 keV for Au10Pt5 was observed. Furthermore, each modified alloy shifted closer toward the pure Pt Lα peak (Figure 2d) which lies at 2.05 keV. These results confirm that increased Pt content in the electrolyte forms Au-Pt alloy surfaces. Significantly our EDX mapping, presented in Figure S3 in SI showed that both Au and Pt are spread evenly on the surfaces. This is advantageous from an application point of view (i.e. sensing or catalysis) where the surface property of each material formed will be homogeneous across the surface. Furthermore, the evenness of the metal content throughout the surface also confirms the alloy nature of the deposited material.
In order to confirm that both Au and Pt are present on the surface, high resolution XPS analysis was performed. The separated spectra for Au 4f and Pt 4f are shown in Figure 2e and Figure 2f, respectively. The 4f7/2 core level spectrum of these samples for Au was observed to have a shift to a lower binding energy as the Pt content was increased. In contrast, the Pt 4f7/2 core level spectrum showed an increase in the binding energy as the amount of Pt increases in the electrolyte solution. These binding energy shifts are evidence of electron shifts occurring between Au and Pt due to a bi-metallic (Au-Pt) electronic interaction between the atomic orbitals of the 2 alloy components. A summary of all XPS peak assignments are presented in Table S2 in SI. The EDX and XPS data confirm that the Au-Pt alloy is formed both in the bulk and on the surface and that the alloy is spread uniformly throughout the surface of the deposited materials.
Although there is not a precise method for accurate determination of the electrochemical surface areas (ECSA) of Au-Pt alloys, cyclic voltammetry (CV) of a ferricyanide system (Randle-Sevcik method)31 has been previously used to estimate the ECSA of Au-Pt structures and was thus employed in this study. In Figure 3 it can be seen that there is a dramatic increase in the ECSA of the alloy surfaces when compared to the unmodified Au substrate. Given that the peak heights (Ip) in the CV are directly proportional to ECSA at constant scan rate, the Ip (obtained at a scan rate 100 mV·s−1) values were used to compare the surface areas between the electrodeposited surfaces. It was found that Au10Pt1 and Au10Pt0.5 exhibited the largest ECSA, with Au10Pt2.5 and Au10Pt5 having a comparatively smaller ECSA. The ECSA differences are due to the finer surface morphological and structural size differences that are observed in the SEM images in Figure 1. The Au10Pt1 and Au10Pt0.5 surfaces show branching, dendritic structures, with well-defined branches with sharp edges, leading to a higher surface area than Au10Pt2.5 and Au10Pt5, where the branching fine structure is not observed.
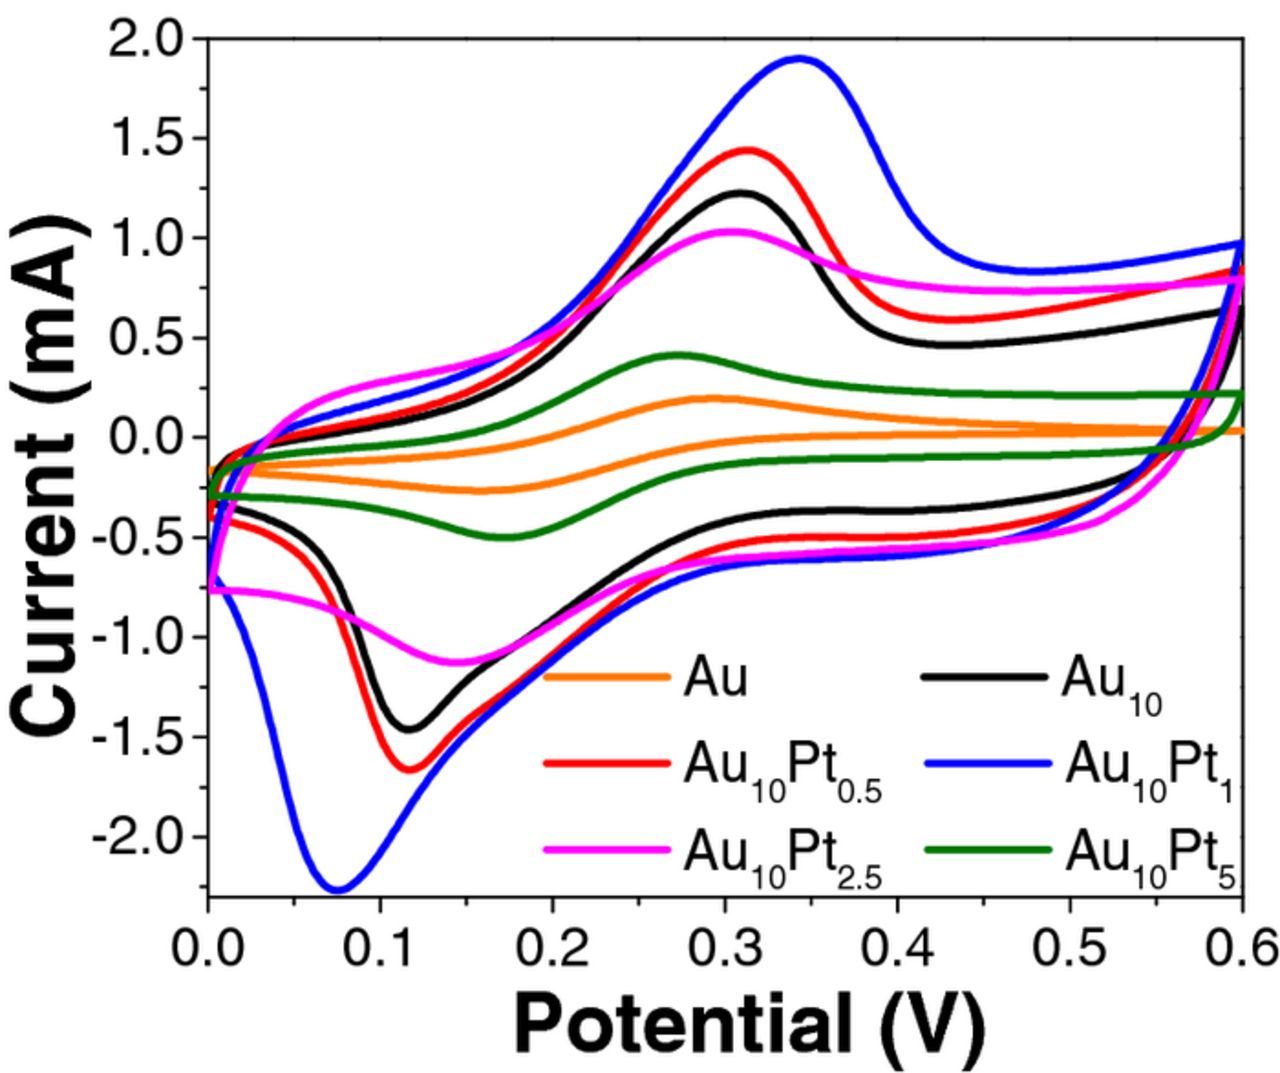
Figure 3. Cyclic voltammetry of all Au-Pt substrates in 10 mM K3Fe(CN)6 and 0.2 mM KCl at a scan rate of 50 mVs−1.
Electrochemical sensing of glucose
Cyclic Voltammetry in the presence of glucose
The developed materials were characterized electrochemically in order to determine the Au-Pt alloy honeycomb substrate that was most active toward glucose sensing. Due to the presence of Pt in the honeycomb surfaces, KOH was employed to increase the pH of the solution, which would be easy to undertake in real-world analysis. An alkaline solution is necessary for Pt based materials as the metal can easily be poisoned by intermediate species that form during electro-oxidation of glucose, and Pt can also generate products during electrochemical analysis in neutral solutions which suppresses activity.32 The reaction mechanism between Pt and glucose involves the initial chemisorption of glucose (referred to as the 'dehydration' step) which is quickly followed by adsorbed dehydrate intermediates oxidizing on the surface and forming weakly adsorbed gluconate. At higher potentials these adsorbed intermediates weaken in strength allowing for the dehydrogenated intermediates to oxidize to glucono-δ-lactone. As the glucono-δ-lactone slowly desorbs, gluconate is formed as the result of hydrolysis.33 Au readily forms gold hydroxide in alkaline solutions due to the chemisorption of OH− ions on the Au surface (Au + OH(1−λ) + λe−)34,35 which occurs in the pre-monolayer oxidation region of the gold surface.12 Figure 4a shows the CVs of modified Au (Au10) and Au-Pt honeycomb (Au10Pt0.5) in a solution of 0.5 M KOH and 10 mM glucose. The CV profiles are used to determine the difference in oxidation and reduction peaks between plain Au and the Au-Pt alloy honeycomb structure. Furthermore, the potentials at different stages of glucose electrooxidation on the Au-Pt alloy surface (i.e. formation of intermediate species) can be observed. The CV profiles in a 0.5 M KOH and 10 mM glucose solution for each alloy substrate developed are presented in Figure S4 in SI. It can be observed that the current maxima on the CV profiles are dependent on the amount of Pt that was used in the electrolyte while depositing the alloy structures. The Au-OH reduction peak at 0.15 V is visible for Pt concentrations of 0, 0.5, 1 and 2.5 mM however the CV for the surface prepared in the 5 mM Pt electrolyte no longer displays the Au-OH reduction peak due to the high Pt content. That is, Pt forms multiple glucose related intermediate species on the surface of the alloy which is thought to inhibit glucose from reaching the gold and undergoing surface oxide adsorption.18,36 Figure S5 in SI shows the CV sweep rate analysis of the optimal Au-Pt alloy (Au10Pt1) substrate where an increase in peak maximum was observed as the sweep rate increased. This relationship between peak height and scan rate shows that the reaction occurring between the Au-Pt alloy and glucose is a surface-controlled electrochemical process.25
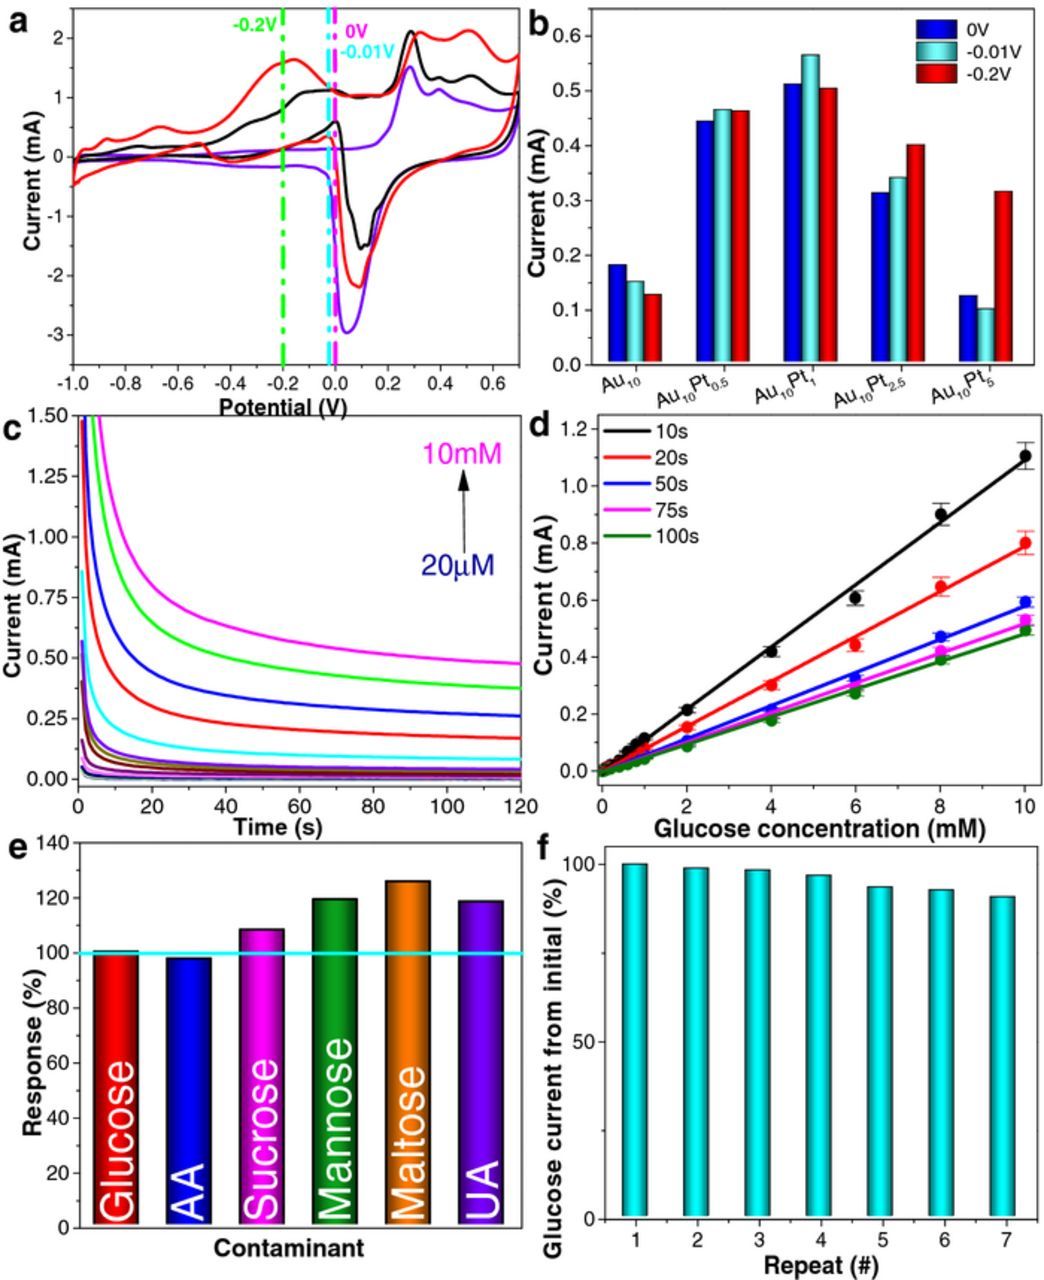
Figure 4. (a) CV analysis comparing Au10 in 0.5 M KOH with 10 mM glucose (black) and Au10Pt0.5 in 0.5 M KOH with (red) and without (purple) 10 mM glucose (b) Potential analysis of Au-Pt substrates at 0, −0.01 and −0.2 V (c) Chronoamperometric analysis of glucose additions for Au10Pt1 in 0.5 M KOH and increasing glucose concentrations (20 μM–10 mM) with an applied potential of −0.01 V where the error bars represent 1σ from seven separate testing events. (d) Calibration curves of additions analysis after 10, 20, 50, 75 and 100 s of stabilization (error bars are calculated due to standard deviation) (e) Selectivity analysis of Au10Pt1 after the addition of 10 mM glucose followed by 0.1 mM additions of acetic acid (AA), sucrose, mannose, maltose and 0.2 mM uric acid (UA) and (f) Current maximum from chronoamperometric responses in 10 mM glucose for 7 consecutive scans for Au10Pt1.
Chronoamperometric analysis in the presence of glucose
The activity of the surfaces for glucose analysis was tested using chronoamperometry at various potentials (0, −0.1 and −0.2 V). These potentials were chosen based on the glucose oxidation/reduction peaks observed in the CV profiles (Figure 4a) discussed in Cyclic voltammetry in the presence of glucose section. These peaks are attributed to glucose oxidation occurring at both active Au and Pt sites, as opposed to either the formation of Au-OH or Pt-OH at higher potentials.37,38 Furthermore, the adsorption of intermediates during glucose electrooxidation for Au-Pt alloys occurs at potentials more negative than pure gold alone,39 therefore potentials lower than and including 0 V were selected. Figure 4b clearly demonstrates that Au10Pt1 has the highest glucose electrooxidation current compared to the other alloy samples. From the 3 potentials analyzed, −0.01 V displays the highest sensitivity when tested for a 10 mM glucose solution. The peak related to glucose oxidation occurs at 0 V, showing good sensitivity due to the maximum peak height of Au and Pt-OH forming on the surface of the alloyed honeycombs. However when the onset potential applied sits just after the peak at −0.01 V, the sensitivity of the alloy is dramatically enhanced (Figure 4b). Furthermore, the increase in the response magnitude at −0.01 V was found to be ∼3 times higher than that obtained for the control (Au10) substrate. Given that only 55% increase in Ip value (shown in Figure 3) was observed for the same substrate (relative to the control (Au10) substrate), the results are a clear indication that the high activity of the Au10Pt1 substrate is not solely due to the increase in ECSA but primarily due to the Au-Pt content of the alloy.
To examine the sensitivity and selectivity of the Au10Pt1 honeycomb alloy, chronoamperometric analysis was employed with a glucose addition concentration range of 20 μM–10 mM. The additions analysis (Figure 4c) displays excellent stability of the alloyed substrate after each addition and analysis times, where the more pronounced differences between each addition are shown in Figure S6 presented in the SI. Figure 4d shows the current vs glucose concentration calibration curves, with the current sampled at different times from chronoamperometric curves and have been analyzed for their sensitivity, limit of detection (LOD) and R2 values as can be seen in Table S3 in SI. The sensitivty40,41 and limit of detection was calculated using the method of three standard deviation of the blank as reported in our previous sensing studies.42,43 From this data we can see that the sensing linearity is excellent (R2 values >0.99) for all concentrations, across all analyzed time points ranging from 10 to 100 seconds. From the experimental concentrations analyzed we can determine the linear range of the Au-Pt honeycomb sensor is 20 μM–10 mM with a response time as low as 10 s. The calculated sensitivity of the Au-Pt honeycomb was determined to be 109.3 μA·mM−1·cm−2 after 10 s and 39.7 μA·mM−1·cm−2 after 100 s with a calculated LOD (limit of detection) of 12.9 μM (experimental data in Figure S7 in SI) and 9.1 μM respectively. The high sensitivity and low detection limit displayed by the Au-Pt alloy sensors can be attributed to the Pt component of the alloy as Pt displays very high sensitivity in glucose sensing.44–46 According to previous studies surface poisoning readily occurs on pure Pt surfaces however due to the alloying with Au, an improved selectivity of the sensor has been achieved as is demonstrated in Figure 4e. A comparison of the optimum sensor developed in this study (Au10Pt1) with that reported in literature is shown in Table II. It can be seen that the Au-Pt honeycombs displayed a similar linear concentration range to those sensors reported in previous studies, however with a much higher calculated sensitivity compared to other Au-Pt alloy based sensors. Furthermore, when comparing to the plain monoatomic Au structures, our developed sensor was able to achieve a large sensitivity at quite a low operational potential, which is also thought to be advantageous from a selectivity point of view. That is, the addition of physiological contaminants did not hinder the sensitivity of the sensors, and a good selectivity was displayed in the presence of physiological related species (see Figure 4e and dynamic response data in Figure S8 in SI). The data shows that physiological sugars such as ascorbic acid (AA), sucrose, mannose, maltose and uric acid (UA) appear to be the main component in reducing the sensors selectivity; however the main competing contaminants AA and UA appear to cause little-to-no change in the current response of the sensor in the presence of 10 mM glucose. The main contribution for this successful selectivity is the reduction in the on-set potential observed for the Au-Pt alloy. Lower applied potentials effectively improve selectivity in glucose sensors, therefore the fact our glucose sensor has improved sensitivity at such a low potential is promising for these types of materials in future glucose research.
Table II. Comparison of the developed Au-Pt alloy honeycomb-like structures with recently reported materials for non-enzymatic electrochemical glucose sensing.
| Electrode material | Sensitivity (μA·mM−1·cm−2) | LOD (μM) | Linear range (mM) | Operation potential (V) | Reference |
|---|---|---|---|---|---|
| Au nanocorals | 22.6 | 10 | 0.05–30 | +0.25 vs Ag/AgCl | 25 |
| Au nanospikes | 91.8 | 20 | 0.02–10 | +0.13 vs Ag/AgCl | 47 |
| Porous Au film | 10.76 | 1 | 0.01–10 | +0.1 V vs SCE | 48 |
| Pt nanoporous | 37.5 | 50 | 0.05–30 | −0.12 V vs Ag/AgCl | 49 |
| Porous Pt-Pd | 20.1 | n/a | 0–12 | −0.3 V vs Ag/AgCl | 50 |
| Au-Pt nanocorals | 24.6 | 3.2 | 0.03–7.2 | +0.4 V vs Ag/AgCl | 51 |
| Au-Pt-CNT | 10.71 | 10 | Up to 24.44 | +0.3 V vs Ag/AgCl | 39 |
| Nanoporous PtAu | n/a | 0.5 | 0.2–5.4 | +0.6 V vs Ag/AgCl | 18 |
| Au-Pt honeycomb | 109.3 | 12.9 | 0.020–10 | −0.01 V vs Ag/AgCl | *This work |
Given the encouraging sensitivity and selectivity performance of the developed sensor, a series of 7 sensing events in a solution of 0.5 M KOH and 10 mM glucose were performed at −0.01 V for 100 s to determine the repeatability of Au10Pt1 which is shown in Figure 4f (dynamic response data in Figure S9 in SI). The sensor was found to exhibit good reproducibility during repeated glucose sensing events with a coefficient of variance (CoV) calculated to be less than 8%, displaying 92% repeatability after 7 successive runs making this sensor highly reusable for glucose sensing applications.
Conclusions
We have presented Au-Pt honeycomb-like porous structures that can be employed as an electrode material for non-enzymatic electrochemical glucose sensing applications. The material was developed using the hydrogen bubble template method to form honeycomb nanostructures made of pure Au-Pt alloy, with both Au and Pt evenly dispersed throughout the material. A low detection limit of 12.9 μM was obtained, with a linear concentration range of 20 μM to 10 mM. Furthermore, a high sensitivity of 109.3 μA·mM−1·cm−2 after only 10 s of stabilization was also observed. The optimum material (Au10Pt1) showed good selectivity toward glucose and did not respond to other physiological species such as Ascorbic acid and biological sugars, making Au-Pt alloy honeycomb a promising non-enzymatic glucose sensor, and a versatile material well-suited to other electrocatalytic applications.
Acknowledgments
The authors acknowledge RMIT Microscopy and Microanalysis Facility (RMMF) for the help received from their technical staff and for allowing the use of their comprehensive facilities and services. The technical staff (Yuxun Cao and Paul Jones) at the Microelectronics Materials and Technology Centre is also acknowledged for the chemical vapour deposition of Au on Si substrates.