Abstract
In this work, microporous layer (MPL) degradation was investigated through the characterization of polymer electrolyte membrane (PEM) fuel cell performance and in situ liquid water visualizations. While both the MPL and carbon fiber substrate underwent ex situ carbon corrosion-based degradation, the degradation of the MPL has the most significant impact on the electrochemical performance and the liquid water distribution within the operating PEM fuel cell. Specifically, MPL degradation resulted in larger quantities of liquid water accumulation within the gas diffusion layer (GDL), and we attributed this accumulation to the loss of MPL hydrophobicity caused by the carbon corrosion-based degradation process. The increased liquid water accumulation led to increased mass transport resistances and performance losses at high operating current densities (> 1.5 A/cm2). With increasing current density, the liquid water saturation profile converged to an upper threshold within GDLs with MPLs, whereas an upper liquid water saturation threshold was not observed for GDLs without MPLs. Predictions of long-term performance characteristics of PEM fuel cells should be informed by the proneness of the MPL to carbon corrosion degradation.
Export citation and abstract BibTeX RIS

This is an open access article distributed under the terms of the Creative Commons Attribution Non-Commercial No Derivatives 4.0 License (CC BY-NC-ND, http://creativecommons.org/licenses/by-nc-nd/4.0/), which permits non-commercial reuse, distribution, and reproduction in any medium, provided the original work is not changed in any way and is properly cited. For permission for commercial reuse, please email: oa@electrochem.org.
A polymer electrolyte membrane (PEM) fuel cell, featuring high power density and zero local-CO2 emissions, is a promising electrochemical energy conversion device for replacing the automotive internal combustion engine. For the commercial adoption of fuel cell-based transportation systems, the long-term durability (≥ 8,000 hours) must be reached over a range of operating conditions.1 Motivated by the need to realize this long-term durability goal, many researchers have provided valuable insights into PEM fuel cell degradation (ageing) through long-term durability and accelerated degradation experiments.2–19 Cleghorn et al.16 performed a continuous PEM fuel cell long-term durability test over a duration of 26,300 hours. At an operating current density of 0.8 A/cm2, they detected a performance reduction rate between 4 and 6 μV/h. They attributed the majority of the cell performance reduction to increases in mass transport losses. Bezmalinovic et al.3 conducted an accelerated stress test to study fuel cell degradation. They attributed the observed performance losses to the degradation of membrane electrode assembly. The extensive time requirements (up to 26,300 hours) to conduct long-term degradation experiments presents a significant challenge, and to-date accelerated degradation studies have not been used to differentiate the impacts of individual components on overall performance losses.
Studies have been specifically dedicated to investigating the degradation of the gas diffusion layer (GDL).20–46 Among these studies, several researchers have performed accelerated GDL degradation by submerging pristine GDLs in a heated hydrogen peroxide solution.37–45 The presence of hydrogen peroxide as a possible reaction intermediate in the PEM fuel cell is considered a potential cause of GDL degradation.47–51 Kätzel et al.37 immersed pristine GDLs into a 30% hydrogen peroxide solution at 90°C. They compared the water droplet size distribution within the pristine and degraded (aged) GDLs at an operating current density of 1.0 A/cm2 via in operando neutron radiography. They reported that liquid water preferentially accumulated at the interface between the degraded GDL and the flow field. Mukundan et al.38 exposed GDLs to a hydrogen peroxide solution with the intention of reproducing the degradation effect of a long-term drive cycle. They observed increases in mass transport resistance and correlated the mass transport resistance to the loss of GDL hydrophobicity resulting from the oxidation of non-graphitized (amorphous) carbon in the MPL. Liu et al.43 also attributed a performance reduction with degraded GDLs to an increase in mass transport resistance, which they related to the observed loss in GDL hydrophobicity. They also found that the addition of an MPL resulted in a significant increase in the amount of carbon corrosion from the degradation process. The aforementioned studies37–45 have provided new insight into the effects of GDL degradation on cell performance and the liquid water transport behavior; however, the distinct contributions of MPL degradation separate from carbon fiber substrate degradation via carbon corrosion have not yet been differentiated within the literature. Specifically, the effects of MPL degradation on cell performance and liquid water behavior are not well-defined within the literature.
Synchrotron X-ray radiographic imaging has been used as a state-of-the-art technique for imaging liquid water in operating PEM fuel cells with high spatial and temporal resolutions.52 Several groups have successfully utilized synchrotron X-ray radiography to advance the understanding of the liquid water behavior within GDLs in an operating fuel cell.39–41,52–70 Arlt et al.41 investigated the correlation between the GDL degradation and the liquid water content within the GDL through in operando synchrotron X-ray radiography. They reported that more liquid water accumulated within the degraded GDL than that within the pristine GDL, and they attributed this observation to the degradation of GDL hydrophobicity. George et al.45 investigated the impact of GDL degradation on the liquid water accumulation at limiting current density operation, and they reported that the degraded GDL accumulated more liquid water than the pristine GDL.
In this work, GDLs with and without MPLs were degraded through an accelerated degradation process with a heated hydrogen peroxide solution. Pristine and degraded GDLs were assembled in custom fuel cells, and cell performance, electrochemical impedance spectroscopy (EIS) measurements, and in operando synchrotron X-ray radiographs were obtained. In operando imaging of liquid water accumulation, concurrent performance characterizations, and EIS equivalent circuit modelling were used to investigate the MPL degradation effects on PEM fuel cell performance.
Methodology
In this section, the accelerated carbon corrosion-based GDL degradation method employed in this work for investigating MPL degradation is described. The fuel cell hardware and operating conditions are described, followed by a description of the methodologies for performance characterization and EIS equivalent circuit modelling. Finally, we discuss the combined use of micro-computed tomography (micro-CT) and in operando synchrotron X-ray radiography for determining the liquid water saturation within the GDL.
Gas diffusion layer accelerated degradation
Commercially available and commonly used GDL materials, Sigracet (SGL) 25 BA and 29 BC GDLs (Sigracet GmbH), were used in this study to assess the impact of MPL degradation. The SGL 25 BA GDL did not include an MPL, while the SGL 29 BC GDL included an MPL. Both the SGL 25 BC and 29 BC GDLs contain high porosity carbon fiber substrates with 5 wt% polytetrafluoroethylene (PTFE) loading; however, the SGL 25 BC GDL has been discontinued from the manufacturer. To the authors' best knowledge and based on the specifications of the manufacturer,71 it was assumed that SGL 25 BC and SGL 29 BC were manufactured with the same carbon fiber substrate (SGL 25 BA GDL). With this assumption, the impact of MPL degradation can be determined from the comparison of SGL 25 BA and SGL 29 BC.
As-received pristine SGL 25 BA and 29 BC GDLs were subjected to an accelerated degradation process via submersion in a 35wt% hydrogen peroxide solution at 90°C for 12 hours. The degraded GDLs were subsequently soaked in distilled water for 24 hours to remove residual hydrogen peroxide solution. The materials were dried in a vacuum oven at 80°C for 3 hours. For extensive details on the GDL accelerated degradation procedure used here, readers are directed to a previous work by Liu et al.43
Fuel cell hardware and operating conditions
A custom fuel cell with an active area of 0.68 cm2 (0.80 cm × 0.85 cm) was used for concurrent performance characterization and synchrotron X-ray radiographic imaging. The anode and cathode flow fields consisted of parallel channels with dimensions of 0.5 mm (width) × 0.5 mm (depth), and ribs with dimensions of 0.5 mm (width) × 0.5 mm (depth).
The catalyst coated membrane (Ion Power Inc., New Castle, DE) with a reinforced ultra-thin 22 μm-thick Nafion HP membrane was selected to minimize the effects of membrane swelling on the liquid water quantification. The catalyst layers on both sides of the membrane contained platinum loadings of 0.3 mg/cm2. The degraded GDLs were used in both the anode and cathode of the fuel cell. For comparative purposes, a reference fuel cell was also assembled and tested containing as-received pristine GDLs from the same lot as the degraded samples. By using rigid polyethylene naphthalate (PEN) gaskets, the GDLs were compressed to 68% and 69% of their original thicknesses that were stated in the manufacturer's specifications for SGL 25 BA and 29 BC GDLs, respectively.
Humidified hydrogen and air with a dew point temperature of 60°C, a flow rate of 1 standard liter per minute, and an absolute pressure of 200 kPa were delivered to the anode and cathode electrodes with a Scribner 850e fuel cell test stand (Scribner Associates Inc., Southern Pines, NC), respectively. The fuel cell temperature was set to 60°C with a temperature controlled water bath to achieve an inlet gas relative humidity (RH) of 100%. The high hydrogen and air flow rates were selected to prevent liquid water accumulation in the flow field channels and to encourage uniform reactant concentrations along the length of the active area, which may have otherwise affected the liquid water behavior within the GDL. The fuel cell was intentionally operated at high inlet gas RH conditions in order to investigate the impact of MPL degradation under flooding-prone conditions.
The fuel cells were conditioned via cell voltage cycling between 0.8 V and 0.3 V with an increment of 0.05 V (for 10 cycles), where each voltage step was held for 3 minutes. After this conditioning step, the fuel cells were operated at constant current density conditions (each step held for 15 minutes to reach steady state, validated by Banerjee et al.65). In operando synchrotron X-ray imaging was conducted, followed immediately by EIS measurements, at these steady state conditions. For each constant current density investigated, an average voltage was obtained over the last 1.5 minutes of operation. The EIS measurements were performed immediately following the 15 minute constant current density operation step to ensure that the liquid water visualization and EIS measurement correspond to the same operating conditions. The EIS measurements were performed in a frequency range from 10 kHz to 0.1 Hz with 10 measurement points per decade. For all applied current densities, the alternating current (AC) had an amplitude of 10% of the operating direct current (DC). We evaluated the linear behavior of the electrochemical system response to the AC perturbation with Kramers-Kronig transforms72,73 for all operating current densities (0.5, 1.0, 1.5, 2.0, and 2.5 A/cm2). It is important to note that we did not report EIS data for operating current densities 2.0 and 2.5 A/cm2, since for those current densities, an amplitude of 10% of the operating DC did not result in a linear relationship between the applied current and voltage response. We reported the EIS data for operating current densities of 0.5, 1.0, and 1.5 A/cm2, and we presented their corresponding linear voltage responses to the current density perturbations from our evaluation of the Kramers-Kronig transforms.72,73 For the fuel cell with SGL 25 BA, current densities of 0.5, 1.0, and 1.5 A/cm2 were held for 15 min each. For the fuel cell with SGL 29 BC, current densities of 0.5, 1.0, 1.5, 2.0, and 2.5 A/cm2 were held for 15 min each. The operating conditions were consistent across all experiments.
Equivalent circuit model
Equivalent circuit modelling was used to interpret the cell resistances measured from EIS. Figure 1 illustrates a Randles equivalent circuit model with a Warburg element. This model was then used to analyze the impedance response of the fuel cell.54,74–79
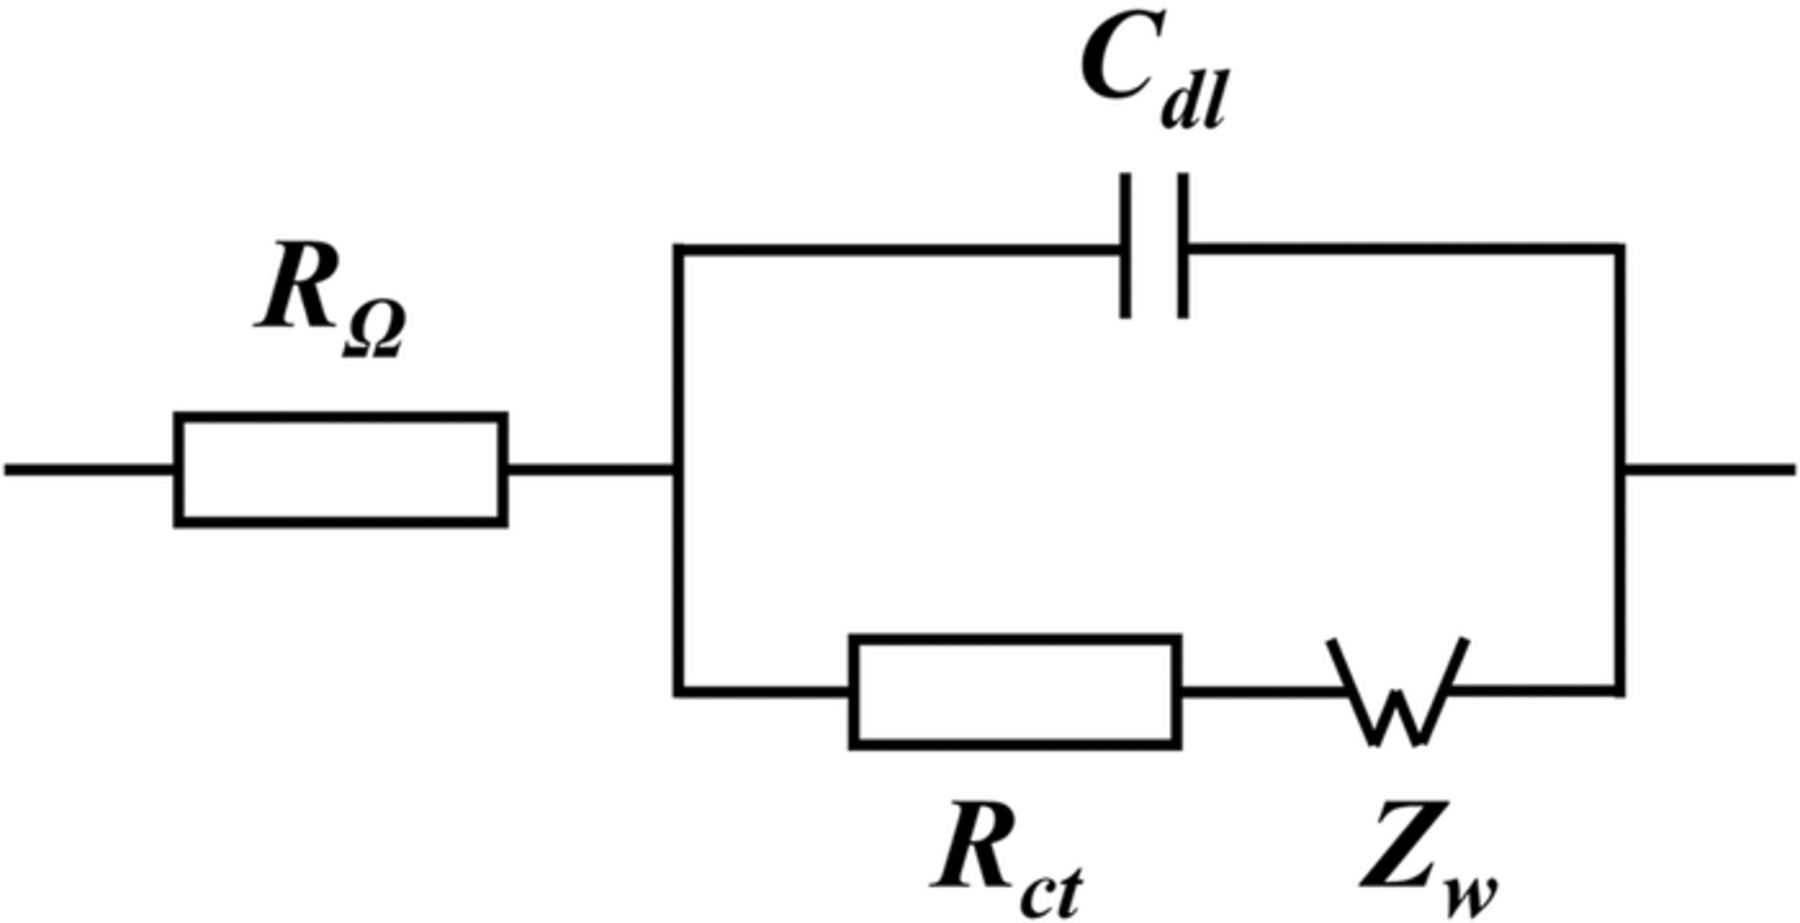
Figure 1. Equivalent circuit model for EIS analysis.
The Warburg element, Zw [Ω · cm2], was employed to analyze the mass transport resistance. The Warburg element describes both the oxygen transport resistance, Rmt [Ω · cm2], and the diffusive time, τ [s], through a diffusion media. The Warburg impedance was calculated as follows:
![Equation ([1])](https://content.cld.iop.org/journals/1945-7111/165/6/F3271/revision1/d0001.gif)
where ω [rad/s] is the angular frequency of the AC signal and  . The cell ohmic resistance,
  [Ω · cm2], corresponds to the resistance associated with the ionic charge transport through the membrane. The double layer capacitance, Cdl [F/cm2], corresponds to the charge storage at the interface between the electrolyte and electrode. The charge transport resistance, Rct [Ω · cm2], represents the resistance associated with electrochemical kinetics. The total impedance of the equivalent circuit was expressed as:
![Equation ([2])](https://content.cld.iop.org/journals/1945-7111/165/6/F3271/revision1/d0002.gif)
For a detailed description of the equivalent circuit model analysis, readers are referred to the previous work by Antonacci et al.54
Synchrotron X-ray radiographic imaging
To visualize the liquid water distribution in the fuel cell GDLs, in-plane synchrotron X-ray based studies were performed at the Biomedical Imaging and Therapy Bending Magnet (05B1-1) beamline at Canadian Light Source Inc. in Saskatoon, Canada.80 Figure 2a is a schematic of the imaging system for the synchrotron X-ray radiographic imaging. In this work, a Si(2,2,0) double-crystal monochromator was used to tune the incident X-ray beam to a photon energy of 24 keV. The monochromatic incident X-ray beam was then attenuated by the fuel cell, and the attenuated X-ray beam was detected by an AA40 scintillator (Hamamatsu Photonics, Japan). The scintillator proportionally converted the attenuated X-ray beam to photons in the visible light spectrum, which were detected by a C11440-22CU camera (Hamamatsu Photonics K.K., Japan). The pixel resolution was 6.5 μm and the frame rate was 0.33 frames per second. Figure 2b displays an example of an obtained raw radiographic image. The brightness of each pixel in the 16-bit image corresponds to the intensity of the attenuated X-ray beam. In this work, the cathode GDL was the main focus of liquid water analysis (as emphasized in the dashed box of Figure 2b).
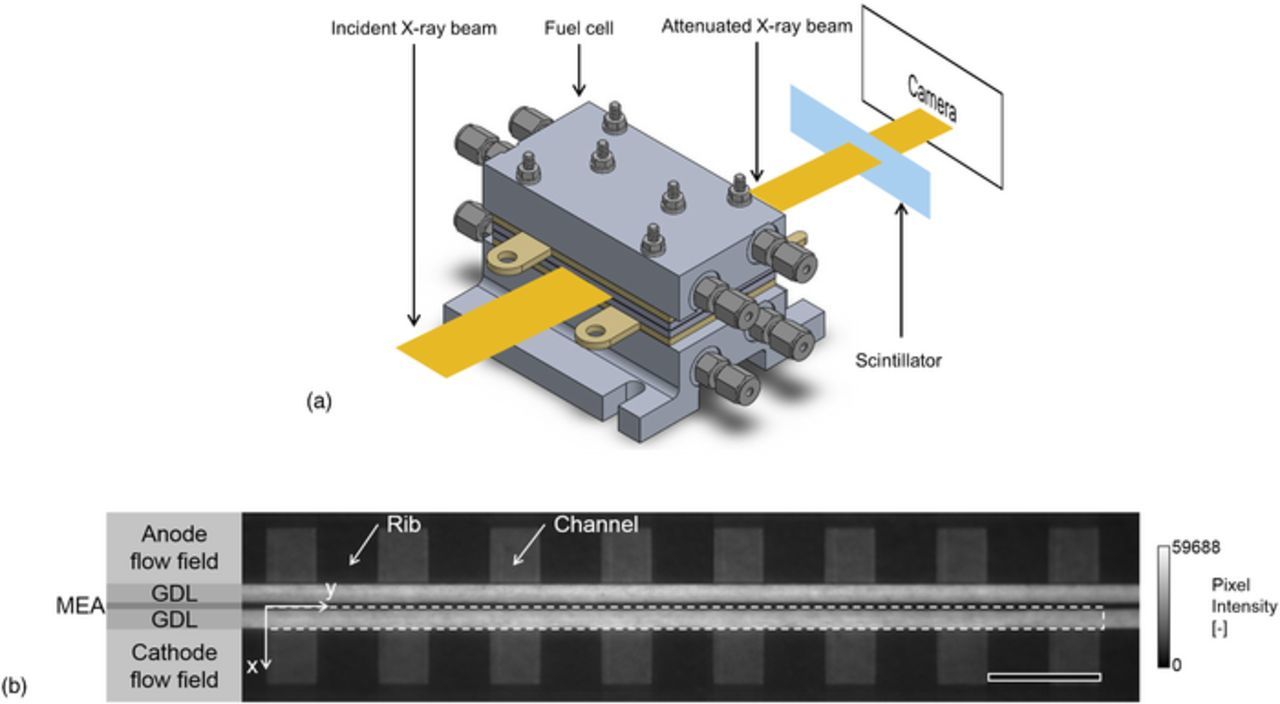
Figure 2. Synchrotron X-ray based liquid water visualization: (a) schematic of the imaging setup for synchrotron X-ray radiographic imaging and (b) raw grayscale radiographic image of the PEM fuel cell. The scale bar represents 1 mm.
Liquid water thickness quantification
The amount of liquid water in the cathode GDL was quantified from the raw radiographic images by applying the Beer-Lambert law as follows:81–83
![Equation ([3])](https://content.cld.iop.org/journals/1945-7111/165/6/F3271/revision1/d0003.gif)
where tw(x, y) [cm] is the liquid water thickness at the through-plane position, x, and in-plane position, y. μwater [cm− 1] is the liquid water attenuation coefficient obtained from a calibration experiment, and Idry(x, y) [-] and Iwet(x, y) [-] represent the pixel intensities in the reference dry-state image (with zero current density applied) and in the wet-state image (with a non-zero current density applied), respectively.
The reference dry-state image was obtained by averaging 10 frames at the end of 5 minutes of open circuit voltage operation when liquid water was not produced in the fuel cell. Before collecting the reference dry-state images during open circuit operation, the fuel cell was sufficiently circulated with dry nitrogen and humidified nitrogen; therefore, we assumed that an average of 10 frames at the end of open circuit voltage was sufficient for representing the reference dry-state image. The wet-state image was obtained by averaging 30 consecutive frames at the end of each 15 minutes of current density operation. For extensive details about the image processing procedures and the water attenuation coefficient calibration, readers are referred to the previous studies by Ge et al.83,84 and Hinebaugh et al.85
Figure 3a presents an example of a processed image from averaging 30 consecutive processed radiographic images in which the color of each pixel corresponds to the amount of liquid water. The liquid water distribution within the cathode GDL in the through-plane direction, x, was obtained by averaging the liquid water thickness along the in-plane direction, y, as presented in Figure 3b. The through-plane location x = 0 μm (leftmost position) and x = 162.5 μm (rightmost position) correspond to the interfaces between the catalyst layer and the GDL and the GDL and the flow field, respectively. The liquid water thickness profiles for the overall GDL, the GDL regions under the channel, and the GDL regions under the rib are presented in Figure 3b. Significant variations in the water thickness profile were observed between the GDL regions under the channel and under the rib. A greater amount of liquid water accumulated at the interface between the GDL and flow field rib compared to the interface between the GDL and flow field channel. Readers may refer to our previous work on investigating the degradation effects on GDL regions under the rib and under the channel.44,45 In this study, the focus of the liquid water analysis is the overall cathode GDL region, investigating the MPL degradation.

Figure 3. An example of liquid water quantification from the raw radiographic images in the fuel cell with SGL 29 BC GDLs: (a) a processed image quantifying liquid water thickness, (b) liquid water profile along the through-plane direction, x, in the overall GDL, in the region under the channel, and in the region under the rib. The scale bar in (a) represents 1 mm.
Porosity profile quantification
To quantify the liquid water saturation profile within the GDL, porosity profiles are used in conjunction with liquid water radiographs discussed above. Porosity profiles of pristine SGL 25 BA and pristine SGL 29 BC GDLs were acquired through a desktop Skyscan 1172 X-ray micro-CT scanner (Bruker Corp., Billerica, MA) with an X-ray source voltage of 36 kV. It has been previously concluded that the accelerated degradation process does not introduce micro-structural changes within the GDL.25,43,44 Therefore, these porosity profiles were used to analyze both the pristine and degraded GDL samples. During the CT scan, compression devices were used to house the GDL samples in order to provide the same compression ratio as achieved in the fuel cell assembly. Using NRecon software (Bruker Corp., Billerica, MA), three-dimensional images at a voxel resolution of 3.14 μm were obtained by reconstructing the series of two-dimensional projection radiographic images acquired from the CT scan. Three phases in the three-dimensional images, namely carbon fiber, MPL, and void space were then differentiated using an image segmentation software which was developed in house.86 The MPL phase was assigned a porosity of 50%.86–88 At each through-plane position, the corresponding porosity was characterized by computing the fraction of void voxels (void space) against the number of total voxels (void space, carbon fiber, and MPL). For more detailed procedures of the image reconstruction and the image segmentation process, readers are referred to a previous study by Banerjee et al.86 GDL bulging or tenting was not observed in the flow field channel in any of our radiographic images. Therefore, we assumed that the inhomogeneities from rib-channel compression were negligible in our experiment, and we applied the same porosity profiles for all regions of the GDL.
Liquid water saturation quantification
For each through-plane position, x, the liquid water saturation is denoted by s(x) [-]. The average liquid water saturation,  [-], was acquired by combining the liquid water thickness and the porosity information as follows:
![Equation ([4])](https://content.cld.iop.org/journals/1945-7111/165/6/F3271/revision1/d0004.gif)
![Equation ([5])](https://content.cld.iop.org/journals/1945-7111/165/6/F3271/revision1/d0005.gif)
where tw(x) [cm] is the liquid water thickness at the through-plane position x, which was obtained from Liquid water thickness quantification section, ε(x) [-] represents the corresponding porosity at the same through-plane position x obtained from Porosity profile quantification section, and L [cm] is the GDL length parallel to the X-ray transmission direction (0.8 cm).
Results and Discussion
In this section, the in operando performance of fuel cells with the pristine and degraded GDLs are compared with respect to cell voltage and the EIS analysis. Next, the through-plane porosity profiles of the GDLs with and without MPLs are presented. Subsequently, the liquid water distributions within the pristine and degraded GDLs are discussed.
Cell performance analysis
Figure 4 shows the polarization curves obtained for fuel cells with the pristine and degraded GDLs. For fuel cells with SGL 25 BA GDLs, the cell potentials with the pristine and degraded GDLs were similar throughout the operating current density ranges, and the maximum deviation of 9% was observed in cell voltage (decreased by 0.05 V) at an operating current density of 1.0 A/cm2. For fuel cells with SGL 29 BC GDLs, the cell voltage were identical at low current densities (less than 1.5 A/cm2), at which the mass transport losses were not significant contributors to the overall performance reduction. However, a clear difference in the fuel cell performance between the fuel cells with pristine and degraded SGL 29 BC GDLs was observed at higher current densities (greater than 1.5 A/cm2), where mass transport losses dominated the performance losses. A maximum performance deviation of 59% was observed between the fuel cells with pristine and degraded SGL 29 BC GDLs (lower by 0.16 V) at an operating current density of 2.5 A/cm2.
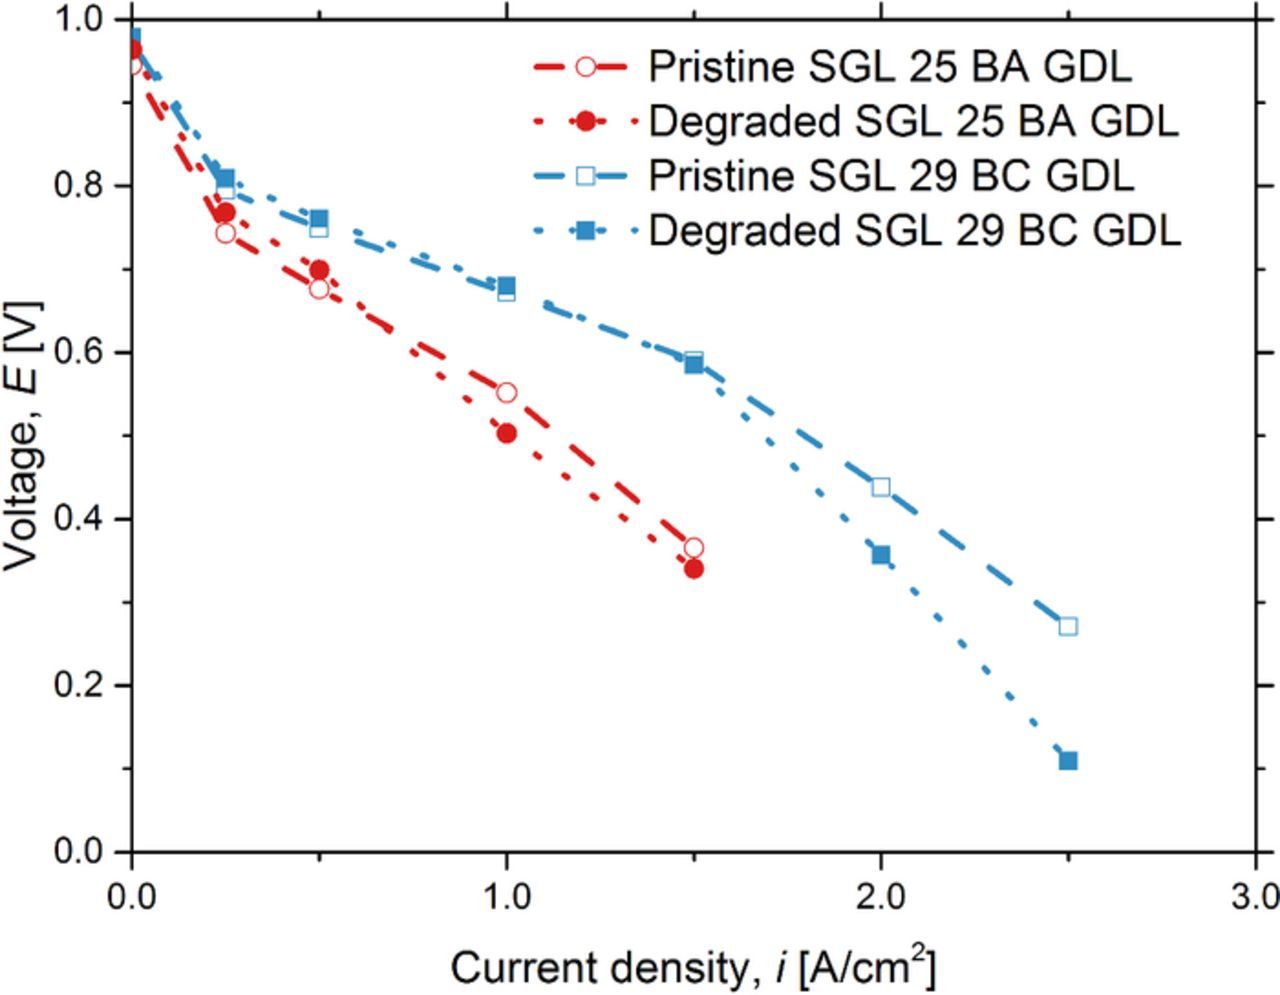
Figure 4. Comparison of polarization curves with fuel cells with the pristine and degraded GDLs, with and without an MPL. The operating conditions were maintained at a cell temperature 60°C and 100% RH for both anode and cathode inlet gases.
The expected benefit of an MPL was seen via the performance comparison of SGL 25 BA and SGL 29 BC, in agreement with previous studies.89–98 The fuel cell with a degraded GDL with an MPL did not experience reduced performance for current densities up to 1.5 A/cm2 and did experience significant performance reduction at current densities greater than 1.5 A/cm2. The fuel cell with a GDL without an MPL did not reach current densities greater than 1.5 A/cm2.
EIS analysis
Figure 5 shows the Nyquist plots acquired from the EIS spectral analysis over a range of operating current densities. The left intercept with the horizontal axis of the Nyquist plot represents the high frequency impedance, which corresponds to the ohmic resistance. The amplitude of the arc of the Nyquist plot indicates the combination of the mass transport resistance and the charge transfer resistance.
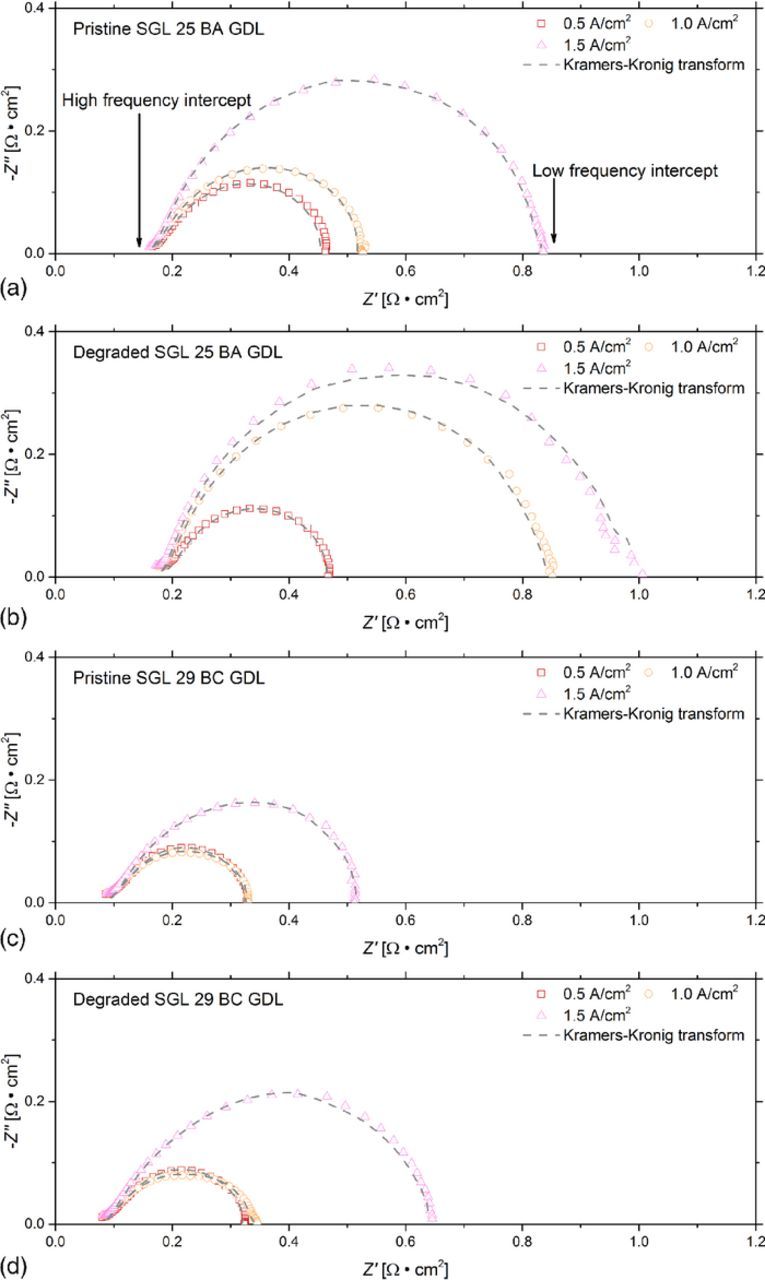
Figure 5. Nyquist plots of the fuel cells with (a) the pristine SGL 25 BA GDL, (b) the degraded SGL 25 BA GDL, (c) the pristine SGL 29 BC GDL, and (d) the degraded SGL 29 BC GDL. The operating conditions were maintained at a cell temperature of 60°C and 100% RH for both anode and cathode inlet gases.
Figure 6 presents the ohmic resistance and the mass transport resistance acquired from the equivalent circuit model analysis. The ohmic resistances for the fuel cells with SGL 29 BC GDLs were consistently lower than those of the fuel cells with SGL 25 BA GDLs. This finding was expected as the presence of an MPL decreases the contact resistance between the catalyst layer and the GDL. Previous studies have also reported that the MPL improves the membrane ionic conductivity by increasing the diffusion resistance for the product water and thereby encouraging the product water to hydrate the membrane.96–98 The ohmic resistance decreased as the operating current density increased, the phenomena attributed to the greater amounts of liquid water produced by the electrochemical reactions and the associated benefits for membrane hydration. The difference in the ohmic resistance between fuel cells was attributed to the inherent stochastic material structural differences, which we assume to make an insignificant contribution to the performance deviations the fuel cells with the pristine and degraded SGL 29 BC GDLs (presented in Figure 4).

Figure 6. Comparison of (a) the ohmic and (b) the mass transport resistances of the fuel cells with the pristine SGL 25 BA GDL, the degraded SGL 25 BA GDL, the pristine SGL 29 BC GDL, and the degraded SGL 29 BC GDL.
The mass transport resistance difference between the fuel cells with the pristine and degraded SGL 25 BA GDLs was found to be 0.20 Ω · cm2 at an operating current density of 1.0 A/cm2, resulting in the slight cell voltage difference (up to 9%) observed in Figure 4. The fuel cells with pristine and degraded GDLs with MPLs (SGL 29 BC) experienced similar ohmic resistances; therefore, we attributed the significant performance reduction of fuel cells with degraded GDLs with MPLs at current densities greater than 1.5 A/cm2 to increase in mass transport resistance, which was validated by the following liquid water distribution analysis.
Through-plane porosity profile
Figure 7 presents the porosity profiles of the GDLs without an MPL (SGL 25 BA) and with an MPL (SGL 29 BC). Similar porosity profiles of the two GDLs were observed near the flow fields (at x = 130 μm for SGL 25 BA and at x = 162.5 μm for SGL 25 BA), where the small differences were attributed to the inherent material structural differences in the selected samples.99,100 However, the difference between the porosity profiles was significant near the catalyst layer (at x = 0 μm), since the MPL coating results in a lower porosity region. The CT scan revealed the significant intrusion of the MPL into the carbon fiber substrate. For the purpose of liquid water measurements in this work, the interface between the MPL and the carbon fiber substrate regions was defined at the through-plane position x = 52 μm, where the fraction of the void voxels exceeded 0.5.44,45,101 This definition was used to differentiate the liquid water distribution within the MPL and the carbon fiber substrate regions.
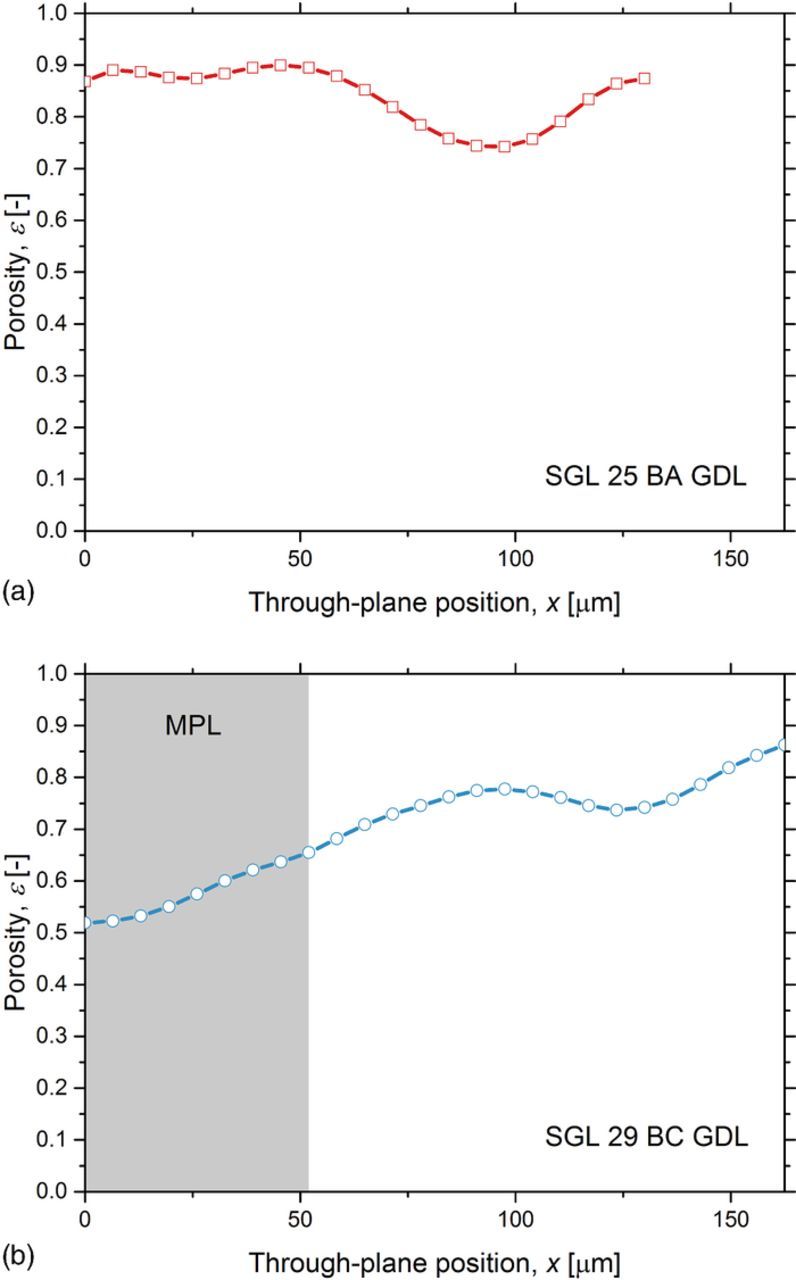
Figure 7. Through-plane porosity profiles of (a) SGL 25 BA and (b) SGL 29 BC GDLs. The shaded area indicates the MPL region for SGL 29 BC GDL.
Liquid water distribution analysis
In operando liquid water distributions within the cathode GDLs were combined with GDL porosity profiles to produce liquid water saturation profiles. Figure 8 illustrates the liquid water saturation profiles for the cathode with the pristine SGL 25 BA GDL, the degraded SGL 25 BA GDL, the pristine SGL 29 BC GDL, and the degraded SGL 29 BC GDL. With increasing current density, the liquid water saturation in the substrate region increased, gradually reaching upper liquid water thresholds for the pristine and degraded SGL 29 BC GDLs (Figure 8b). After reaching the upper liquid water threshold in the substrate, the liquid water saturation profile in the carbon fiber substrate region did not increase further as the operating current density increased. These established saturation thresholds were attributed to the establishment of liquid water transport pathways that become static once breakthrough was reached.102,103 This upper threshold in saturation was established at lower operating current densities in the degraded SGL 29 BC GDL compared to that in the pristine SGL 29 BC GDL. The establishment of this upper threshold at lower current density operation was attributed to the loss of GDL hydrophobicity via the degradation process, which is in strong agreement with previous works.44,45 The establishment of an upper liquid water saturation threshold was not apparent for the SGL 25 BA GDLs (Figure 8a); however, an insufficient amount of liquid water accumulation for reaching the threshold was likely the cause since the SGL 25 BA fuel cell reached lower limiting current densities due to the lack of an MPL. More operating current density results for SGL 25 BA GDLs would be required to determine whether the liquid water saturation profile reaches an upper liquid water threshold.
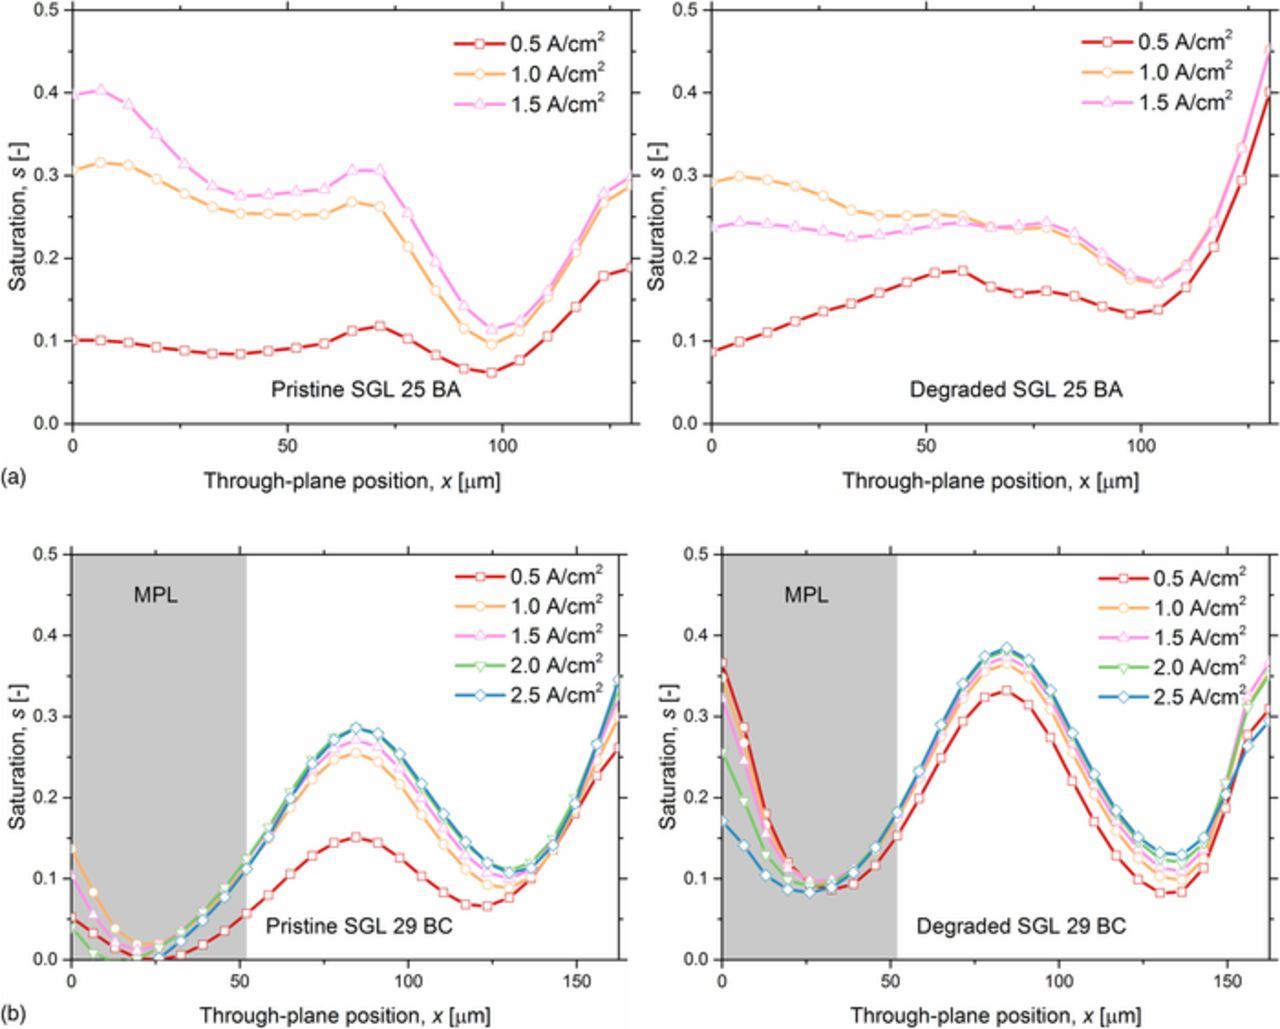
Figure 8. Comparison of liquid water saturation profiles within the cathodes for (a) the pristine and degraded SGL 25 BA GDLs and (b) the pristine and degraded SGL 29 BC GDLs. The operating conditions were maintained at a cell temperature 60°C and 100% RH for both anode and cathode inlet gases.
The local minimum saturations in the pristine and degraded SGL 25 BA GDLs (without MPLs) were observed at through-plane positions x = 97.5 μm and x = 104 μm, respectively (Figure 8a). The slight difference in the through-plane location of the local minimum saturations was attributed to the inherent material structural differences (as seen through their distinct porosity profiles) in the selected samples. The local minimum saturation is attributed to the local minimum porosity at the same through-plane location. The local minimum porosity region coincided with smaller open pores in the GDL, which provided a diffusion barrier for water transport. In the degraded SGL 25 BA GDL, more water accumulated at the local minimum position compared to that at the same position of the pristine SGL 25 BA GDL. This observation was attributed to the degradation of the carbon fiber substrate, which led to the loss of hydrophobicity. The liquid water saturation in the substrate adjacent to the catalyst layer (0–78 μm) was lower in the degraded SGL 25 BA GDL (Figure 8b) compared to the pristine SGL 25 BA GDL (Figure 8a). We propose that the liquid water that would have otherwise been observed in this region (0–78 μm) in the pristine GDL shifted to the region adjacent to the flow field in the degraded GDL in the region of the local minimum saturation (through-plane position 104 μm). It is also important to note that the GDL region adjacent to to the catalyst layer exhibited a lower saturation at an operating current density of 1.5 A/cm2 compared to an operating current density of 1.0 A/cm2; this observation was attributed to the greater amount of local heating at higher current densities, which encouraged liquid water evaporation.
For GDLs with MPLs, local maximum saturations within the carbon fiber substrate regions were observed at a through-plane position of x = 84.5 μm (Figure 8b). These local maximum saturations were attributed to the following two factors: the presence of co-located local maximum porosities and phase change events happening within the carbon substrate region.94 With increasing through-plane position (starting at the local maximum saturation location, x = 84.5 μm), the water saturation first decreased with increasing through-plane distance, and this trend was attributed to the porosity gradient variation (specifically decreasing porosity with increasing through-plane position) and the establishment of a liquid water transport pathway (which, once established, provides the preferential pathway for liquid water transport).102,103 Approximately mid-way through the carbon fiber substrate, the water saturation increased with increasing through-plane distance, and this trend was attributed to the porosity variation (specifically increasing porosity with increasing through-plane position) combined with the accumulation of liquid due to condensation driven by the cooling effects of the flow field. Compared to the GDLs without an MPL, the addition of the MPL significantly reduces the saturation level within the GDL. At an operating current density of 1.5 A/cm2, the liquid water saturation at the interface between the catalyst layer and the GDL was 0.39 for the pristine SGL 25 BA GDL and 0.10 for the pristine SGL 29 BC GDL. However, after degradation, the degraded MPL provided a dominating impact over the carbon fiber substrate degradation. At an operating current density of 1.5 A/cm2, the liquid water saturation at the interface between the catalyst layer and the GDL interface was 0.10 and 0.32 for the pristine and degraded SGL 29 BC GDLs, respectively. The MPL region of the degraded SGL 29 BC GDL accumulated a larger quantity of liquid water than the MPL region of the pristine SGL 29 BC GDL. The greater amount of liquid water accumulation in the degraded MPL further led to more liquid water accumulation at the interface between the MPL and carbon fiber substrate, within the carbon fiber substrate, and at the interface between the GDL and flow fields. These greater amounts of liquid water accumulation contributed to performance reduction via increased mass transport resistance at higher operating current densities (Figure 6b).
Figure 9 presents the average liquid water saturation for the pristine SGL 25 BA, the degraded SGL 25 BA, the pristine SGL 29 BC, and the degraded SGL 29 BC GDLs at a range of operating current densities. The addition of an MPL significantly reduces the average liquid water saturation for the pristine materials, with a maximum observed decrease of 41% (decreased by 0.11) at an operating current density of 1.5 A/cm2. However, the MPL degradation results in a significantly higher average liquid water saturation, higher by 44% (0.07) at the operating current density of 1.5 A/cm2 relative to the average liquid water saturation in the pristine SGL 29 BC GDL. The higher liquid water saturation in the degraded GDL with an MPL results in a distinct performance reduction (up to 59% at higher operating current densities).
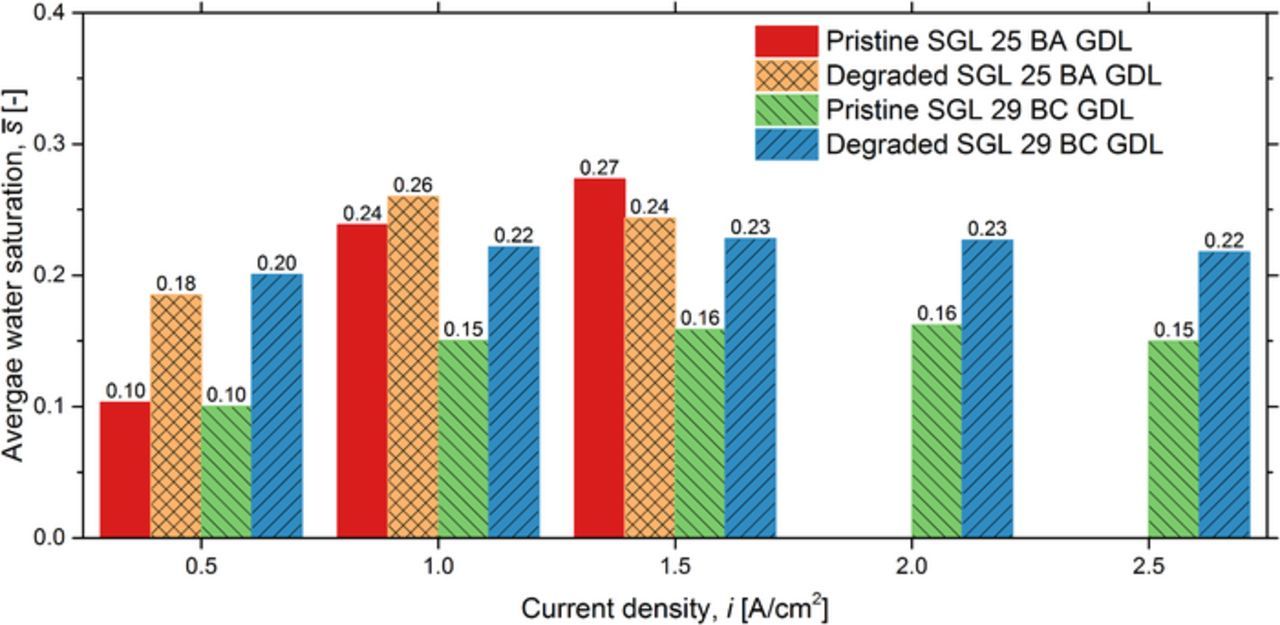
Figure 9. Comparison of the total liquid water saturation within the cathode for (a) the pristine SGL 25 BA GDL, (b) the pristine SGL 29 BC GDL, and (c) the degraded SGL 29 BC GDL. The operating conditions were maintained at a cell temperature of 60°C and 100% RH for both anode and cathode inlet gases.
The presence of an MPL leads to the mitigation of liquid water in the GDL, enhancing the fuel cell performance; however, the degraded GDL with an MPL led to more significant liquid water accumulation within the GDL, as well as at the interfaces between the catalyst layer and the MPL, the MPL and the carbon fiber substrate, the GDL and the flow fields. An upper liquid water saturation threshold was observed in the GDL with an MPL at lower current densities for fuel cells with degraded GDLs compared to those with pristine GDLs.
Conclusions
In this study, the MPL degradation effect on liquid water distribution was investigated via in operando performance analysis and synchrotron X-ray radiographic imaging. Pristine GDLs with and without an MPL were subjected to an in-house accelerated degradation process, and fuel cells with pristine and degraded GDLs were studied in terms of cell voltage, EIS analysis, and in situ liquid water visualizations. The GDL with an MPL degradation led to increases in the mass transport resistance and reduction in performance (voltage decrease by up to 59%) at an operating current density of 2.5 A/cm2. The degradation of the MPL led to an increase in liquid water accumulation within the GDL by up to 44% at an operating current density of 2.5 A/cm2. Performance reduction at higher current densities is directly attributed to these greater quantities of accumulated liquid water. A noticeable upper liquid water saturation threshold was established for the GDL with an MPL with increasing current density operation. The predictions of long-term performance characteristics of PEM fuel cells should be informed by the proneness of the MPL to carbon corrosion degradation. The use of carbon corrosion resistive MPL material should also be considered for extending fuel cell durability.
List of Symbols
| Cdl | Double layer capacitance [F/cm2] |
| Idry | Pixel intensity in the dry-state image [-] |
| Iwet | Pixel intensity in the wet-state image [-] |
| j |  |
| L | Length of the GDL parallel to the X-ray transmitting direction [cm] |
| Rct | Charge transfer resistance [Ω · cm2] |
| Rmt | Mass transport resistance [Ω · cm2] |
| RΩ | Cell ohmic resistance [Ω · cm2] |
| s | Liquid water saturation [-] |
| tw | Liquid water thickness [cm] |
| ZW | Warburg impedance [Ω · cm2] |
| Z | Total cell impedance [Ω · cm2] |
Greek
| ε | Porosity [-] |
| μwater | Calibrated water attenuation coefficient [cm− 1] |
| ω | Angular frequency [rad/s] |
| τ | Diffusive time [s] |
Acknowledgments
Financial support from the Natural Sciences and Engineering Research Council of Canada (NSERC), the NSERC Discovery Accelerator Program, the NSERC Canada Research Chairs Program, the Ontario Ministry of Research and Innovation Early Researcher Award, and the Canada Foundation for Innovation are gratefully acknowledged. Financial support from Alexander von Humboldt foundation, Impuls- und Vernetzungsfonds der Helmholtz Gesellschaft (Young Investigator Group project VH-NG-616), and German Federal Ministry for Economic Affairs and Energy project SoHMuSDaSS (03ET6057C) are gratefully acknowledged. The graduate scholarships to Hang Liu from the University of Toronto Connaught International Scholarship for Doctoral Students is gratefully acknowledged. Graduate scholarships to Michael G. George from the NSERC Canada Graduate Scholarship, the NSERC Michael Smith Foreign Study Supplement, the Ontario Graduate Scholarship, the University of Toronto Mary H. Beatty Fellowship, and the Mercedes-Benz Canada Graduate Fellowship in Fuel Cell Research are gratefully acknowledged. Graduate scholarships to Nan Ge from the William Dunbar Memorial Scholarship in Mechanical Engineering, the Mercedes-Benz Canada Graduate Fellowship for Fuel Cell Research, and the Ara Mooradian Scholarship are gratefully acknowledged. Graduate scholarships to Jongmin Lee from the Mercedes-Benz Canada Graduate Fellowship in Fuel Cell Research, the HATCH Graduate Scholarship, and the David Sanborn Scott & Ron D. Venter Fellowship are gratefully acknowledged. Graduate scholarships to Daniel Muirhead from the NSERC Canada Graduate Scholarship, the Ontario Graduate Scholarship, and the David Sanborn Scott Fellowship are also gratefully acknowledged. The graduate scholarship to Pranay Shrestha from the Pierre Rivard Hydrogenics Graduate Fellowship is gratefully acknowledged. Research described in this paper was performed at the BMIT facility at the Canadian Light Source, which is supported by the Canada Foundation for Innovation, Natural Sciences and Engineering Research Council of Canada, the University of Saskatchewan, the Government of Saskatchewan, Western Economic Diversification Canada, the National Research Council Canada, and the Canadian Institutes of Health Research. Authors acknowledge the receipt of support from the CLS Post-Doctoral and Graduate Student Travel Support Program. The authors acknowledge Dr. George Belev, Dr. Adam Webb, Dr. Ning Zhu, Dr. Tomasz Wysokinski, and the BMIT group of the Canadian Light Source Inc. for their generous assistance. The SGL Group is also recognized for donation of the gas diffusion layers used in this study. The authors would also like to thank Prof. M. T, Kortschot and Shiang Law in the Department of Chemical Engineering & Applied Chemistry and Prof. Mohini M. Sain in the Faculty of Forestry at the University of Toronto for the use of the X-ray micro-CT machine. The SGL Group is also recognized for donation of the GDLs used in this study. The authors thank Dr. Benzhong Zhao for his helpful discussion and assistance with the manuscript preparation.
ORCID
Aimy Bazylak 0000-0002-9594-4930