
Abstract
LiFePO4 has monopolized a lot of research efforts over the past decade because it stands as an attractive positive electrode material for the next generation of Li-ion batteries to EVs/HEVs. However, issues concerning aging mechanisms need to be solved before large scale industrial production. In order to get more insight in such mechanisms, the evolution of both electrodes of a LiFePO4 // graphite cell after 200 cycles at RT and 60°C was followed using X-Ray Photoelectron Spectroscopy (XPS). The results have revealed a lack of reversibility of the Fe3+/Fe2+ redox reaction increasing upon cycling and at high temperature. In depth analyses of interfacial layers on both electrodes allowed us to further elucidate the origin of the detrimental loss of active lithium with the formation of small amounts of lithiated species either deposited or partly dissolved in the electrolyte.
Export citation and abstract BibTeX RIS
The development of the lithium-ion (Li-ion) battery technology has made possible the tremendous development of portable electronics industry. Today, the research of new electrode materials for Li-ion batteries is motivated by an increasing need for efficient energy storage systems for urban transportation and renewable energies.1–3
Since the pioneering works of Padhi et al.,4 LiFePO4 has monopolized a lot of research efforts. LiFePO4 satisfies many of the criteria for a positive electrode for Li-ion batteries: high reversible capacity, excellent structural stability of the delithiated phase, abundant and environmental friendly elements. Its main drawback, namely its low total electrical conductivity (∼10−9 S.cm−1 at 298K), has been overcome to a great extent by efficient approaches i) carbon coating,5 ii) particle downsizing,6–8 iii) heteroatom doping.9–11 Recently, the predominant attention has focused on the good quality of the carbon coating curing the surface disorder of the particles and making electric contact between them.12,13
Actually, LiFePO4 has become one of the most promising candidates as positive electrode material for the next generation of Li-ion battery applications, especially for electric and hybrid vehicle applications. However, issues concerning aging mechanisms and safety need to be solved to meet very demanding life targets of batteries for industrial applications.
Although very good long term stability was reported for C-LiFePO4 // graphite cells, several works demonstrated that high temperature cycling (∼60°C) significantly accelerates capacity fading.14–18
Attempts to address aging issues are not a straightforward task, because in many cases capacity decrease and power fading do not originate from one single cause, but from a number of various processes and their interactions. Among the different mechanisms occurring at both the positive and negative electrodes, surface chemistry plays a major role. As far as the negative electrode side is concerned, aging effects may be mainly attributed to changes at the electrode/electrolyte interface, whereas a number of changes on the positive electrode may influence the life time of a Li-ion cell, such as for example aging of active material, chemical decomposition/dissolution reactions, surface film modification...
Considering the possible mechanisms that may be responsible for cell capacity degradation in C-LiFePO4 // graphite cells, several scenarios were proposed. Some authors suggested problems of iron dissolution and deposition at the surface of the negative electrode, the fast fading at high temperature resulting from the formation and growth of a thick interfacial film.19–22 From electrochemical and structural analyzes, it was proposed that loss of electrochemically active lithium is the dominating mechanism responsible for cell capacity degradation;15, 18, 23, 24 it was also proposed that the instability of the Solid Electrolyte Interphase (SEI) layer accelerates losses of active lithium and cell capacity.15,25 Other possible origins for cell capacity degradation were suggested, as wetting problems of the electrode and loss of active material.14,17
Further studies are necessary on C-LiFePO4 // graphite cells in order to provide more advanced knowledge on the degradation processes and to get more insight in aging mechanisms.
In this work, the evolution of both electrodes of a LiFePO4 // graphite cell after 200 cycles at room temperature (RT) and at 60°C was followed using a well established surface analysis technique: X-Ray Photoelectron Spectroscopy (XPS). XPS analyzes allow to differentiate the oxidation states of iron in LiFePO4 (Fe2+) and FePO4 (Fe3+) at the extreme surface of the electrode materials and thus to follow the evolution of the redox process at the surface upon cycling. By using the surface-sensitive character of XPS, in order to probe the homogeneity of iron oxidation states within the positive electrode, the spectra obtained for the two surfaces of LiFePO4 electrode, the one facing the electrolyte and the other one facing the metallic current collector were compared. As XPS provides access to other probes, in particular C 1s, O 1s, P 2p and F 1s, this work also addresses the evolution of the interfacial layers formed on the negative and positive electrodes.
Experimental
Electrochemical measurements
The positive electrodes were prepared by coating an aluminum foil current collector with a slurry composed of LiFePO4 (submicronic, D50 = 500 nm) provided by Süd-Chemie (Moosburg, Germany), poly(vinylidene fluoride) (PVdF) binder, and conductive carbon black, in N-methyl-2-pyrrolidone with a loading of 20 mg.cm−2. The composition LiFePO4:PVdF:carbon black of the electrode was 90:5:5 (wt%). The negative electrode consisted of a mixture of graphite and a polymeric binder deposited on a copper foil current collector. The electrodes were then dried at 120°C under vacuum, for 12h in an oven. Coin cells were assembled in a MBRAUN argon dry box (MBRAUN Garching, Germany), inside which the oxygen and water contents were maintained below 1 ppm. The molar graphite/LiFePO4 ratio in the cells was fixed at 1.2 (with respect to the total capacity of each compound). A standard liquid electrolyte consisting of a blend of ethylene carbonate (EC), propylene carbonate (PC) and dimethyl carbonate (DMC) with LiPF6 and few percent of vinylene carbonate (VC) additive was used in association with a standard separator. Coin cell design was chosen because it allows to enhance degradation mechanisms due to large electrolyte content, which makes surface analyzes easier.
Then the LiFePO4 // graphite coin cells were charged using a multichannel potentiostat galvanostat testing apparatus (Bio-Logic SAS, Claix, France) performed under galvanostatic mode at C/20 rate, (i.e. the full charge (or discharge) capacity of the cell is reached in 20 hours) for the first cycle between 2.5 V and 3.7 V. Following cycles were carried out at C/10 rate until the 50th cycle, then at C/5 rate until the 200th cycle at room temperature (RT) for a first batch and at 60°C for another one.
After the first and the 200th cycle, both positive and negative electrodes were carefully separated from the rest of the cell components in the argon dry box, washed with DMC solvent to remove the electrolyte, and dried prior to being packed into a hermetically sealed aluminum bag for transportation.
XPS analyzes
XPS analyzes were carried out with a Kratos Axis Ultra spectrometer (Kratos Analytical Ltd, Manchester, UK) using a focused monochromatized Al Kα radiation (hν = 1486.6 eV). The spectrometer was calibrated using the photoemission line Ag 3d5/2 (binding energy 368.3 eV). For the Ag 3d5/2 line, the full width at half maximum (FWHM) was 0.58 eV under the recording conditions. Core peaks and valence spectra were recorded with a constant 20 eV pass energy. The analyzed area of the samples was 300 × 700 μm2, and the pressure in the analysis chamber was ca. 1.4·10−7 Pa. The binding energy scale was calibrated from the hydrocarbon contamination using the C 1s peak at 285.0 eV. Core peaks were analyzed using a nonlinear Shirley-type background.26 The peak positions and areas were optimized by a weighted least-square fitting method using 70% Gaussian, 30% Lorentzian lineshapes. Quantification was performed on the basis of Scofield's relative sensitivity factors.27
To prevent the samples from moisture/air exposure, the XPS spectrometer was directly connected through a transfer chamber to an argon dry-box. The samples were removed from their packaging inside the dry-box and placed onto the sample holder without any contamination.
Results and Discussion
Cycled LiFePO4 positive electrode – Fe2+/Fe3+ redox reaction
Figure 1a shows the first electrochemical cycle of the LiFePO4 // graphite cell obtained at room temperature (RT) in coin cells. The full charge capacity is 154 mA.g−1 and the reversible discharge capacity is 132 mA.g−1. Note that the 22 mA.g−1 capacity loss upon the first cycle is mainly due to the loss of lithium ensuing from the formation of the Solid Electrolyte Interphase (SEI) at the surface of the graphite negative electrode.28
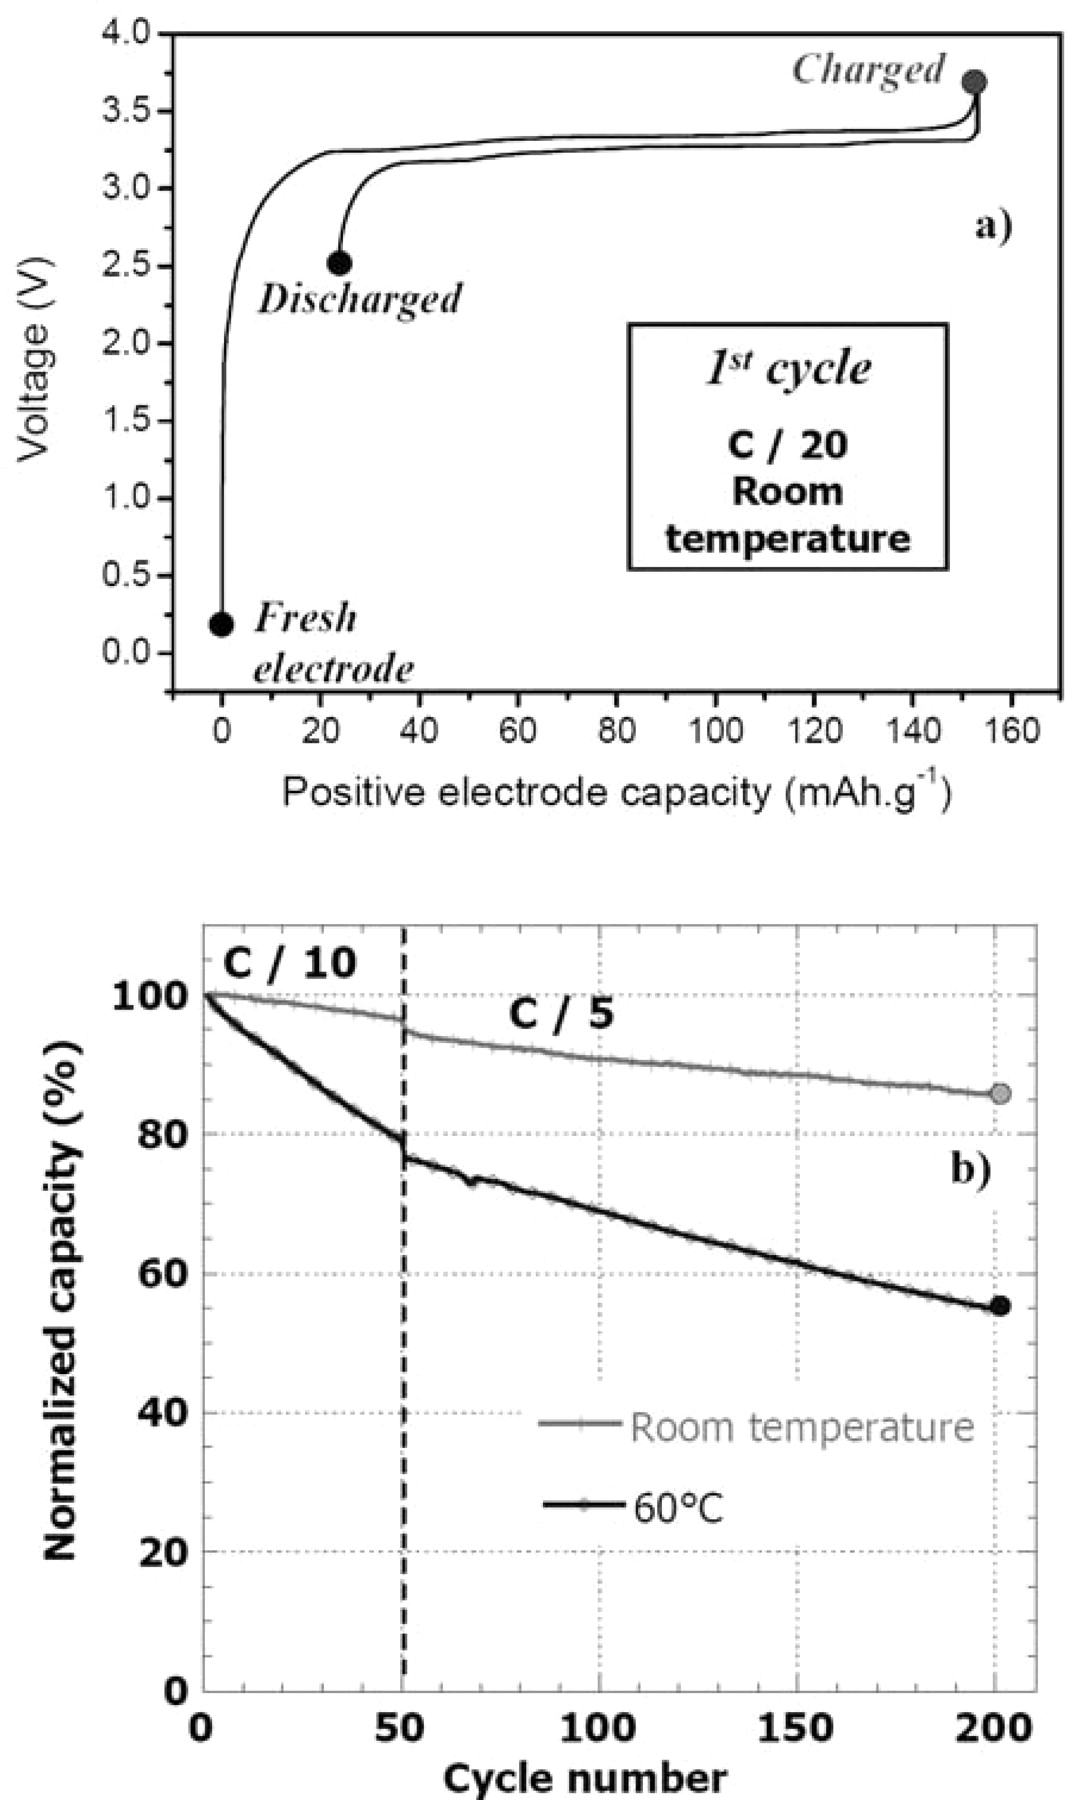
Figure 1. (a) First electrochemical cycle obtained at C/20 rate for a LiFePO4//graphite coin cell. (b) Normalized capacity of a LiFePO4//graphite coin cell upon cycling at room temperature and 60°C (at C/10 and C/5 rates).
A comparison of reversible capacities obtained upon long-term cycling at RT and 60°C is shown in Figure 1b. The capacity loss after 200 cycles is 14% of the initial reversible capacity for the coin cell which worked at RT, whereas it is 45% for the cell which worked at 60°C. This shows the increase of the capacity fading of LiFePO4//graphite cells when temperature increases, as reported in literature.14,15,17
In order to understand the surface mechanisms associated to aging processes of LiFePO4 // graphite cells at RT and at 60°C, XPS spectra of both the positive and the negative electrodes obtained after 200 cycles were carefully analyzed, and compared to those obtained for the fresh electrodes and after the first charge and discharge (first cycle).
To this aim, a specific sampling procedure was used, as explained in Figure 2. The LiFePO4 composite electrode actually displays two kinds of surfaces: (1) the side facing the electrolyte, and (2) the side facing the current collector. The side of the electrode facing the electrolyte is the obvious surface that is directly accessible after opening the battery under controlled argon atmosphere before XPS analysis (this is the surface usually analyzed by XPS). The side facing the current collector (2) is accessible after peeling the aluminum foil (under controlled argon atmosphere). The surface-sensitive character of the XPS technique (analysis depth ∼5 nm) allows to study separately both surfaces.
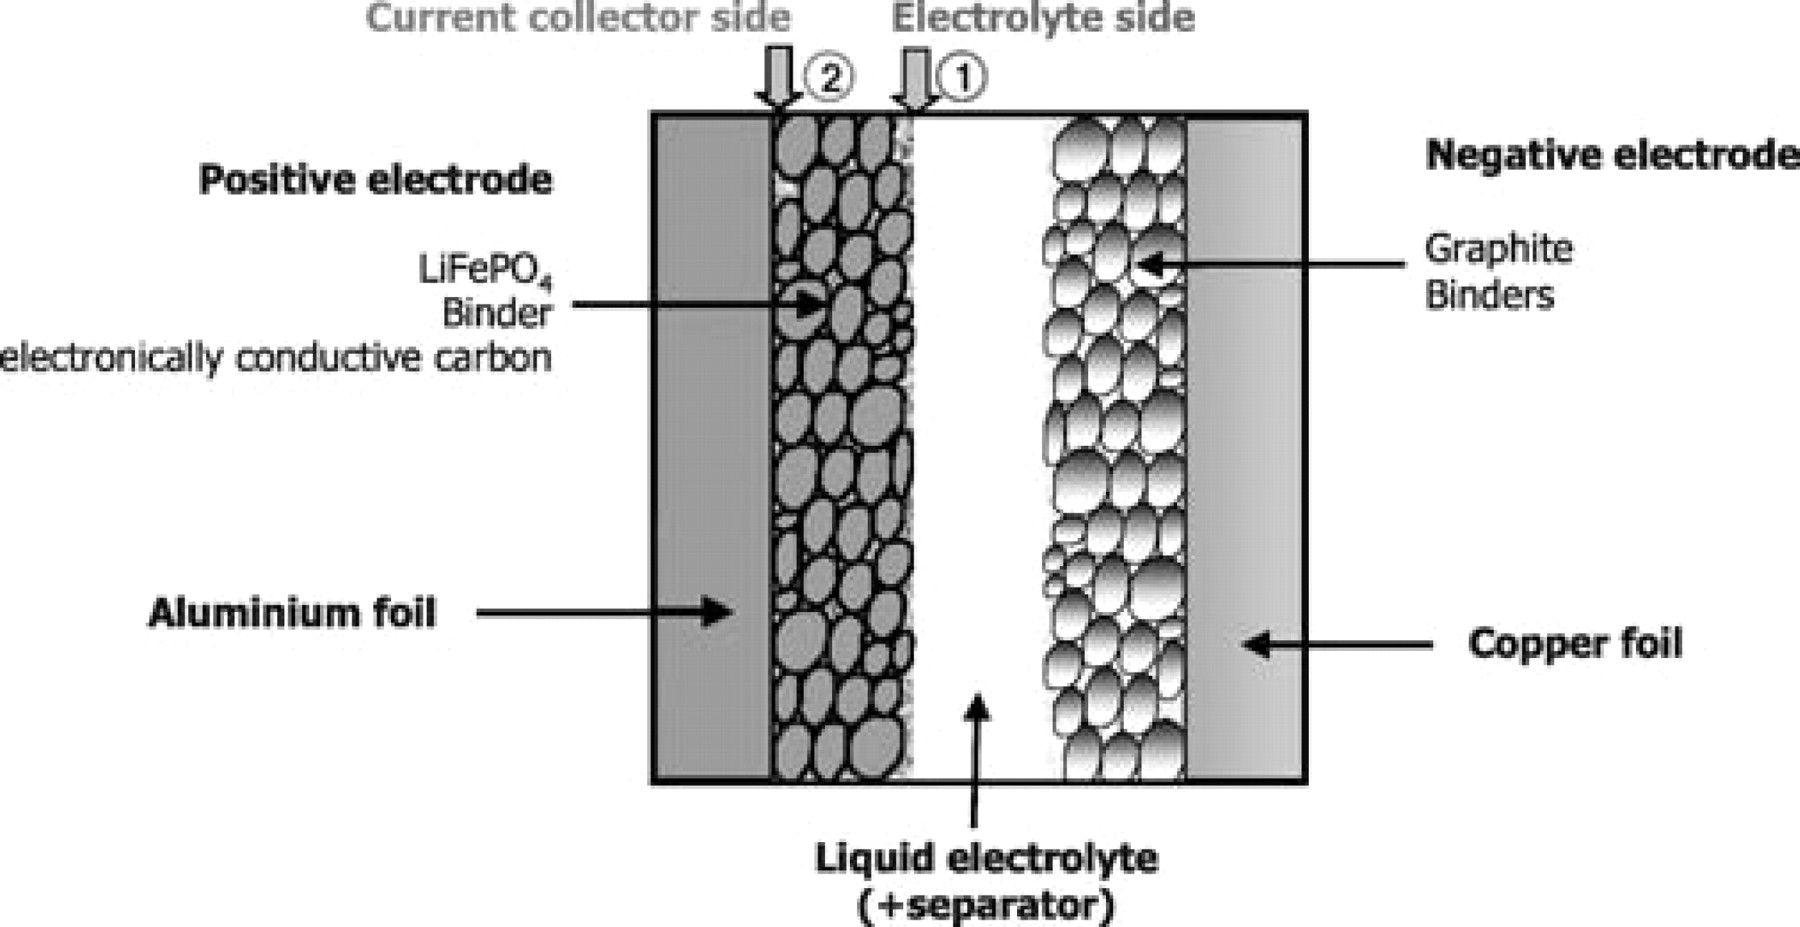
Figure 2. Schematic representation of a LiFePO4//graphite coin cell. (1) and (2) indicate the two kinds of surfaces of the LiFePO4 positive electrode that were analyzed by XPS. (1) is the electrolyte side surface and (2) is the current collector facing surface, accessible by a peeling the aluminum foil.
Figure 3 shows Fe 2p spectra of the LiFePO4 electrodes obtained at the electrolyte side surface (1). Fe 2p spectra are split in two parts due to spin orbit coupling, namely Fe 2p3/2 and Fe 2p1/2 with an intensity ratio of about 2/1. Each part consists of a main peak (∼710 eV for Fe 2p3/2 and ∼724 eV for Fe 2p1/2) and a "shake up" satellite (∼715 eV for Fe 2p3/2 and ∼729 eV for Fe 2p1/2).29 For the pristine electrode, the fine structure observed in the main peak (710 and 711 eV for Fe 2p3/2) may indicate the presence of some Fe3+ impurities at the surface of the LiFePO4 material due to air exposure.30
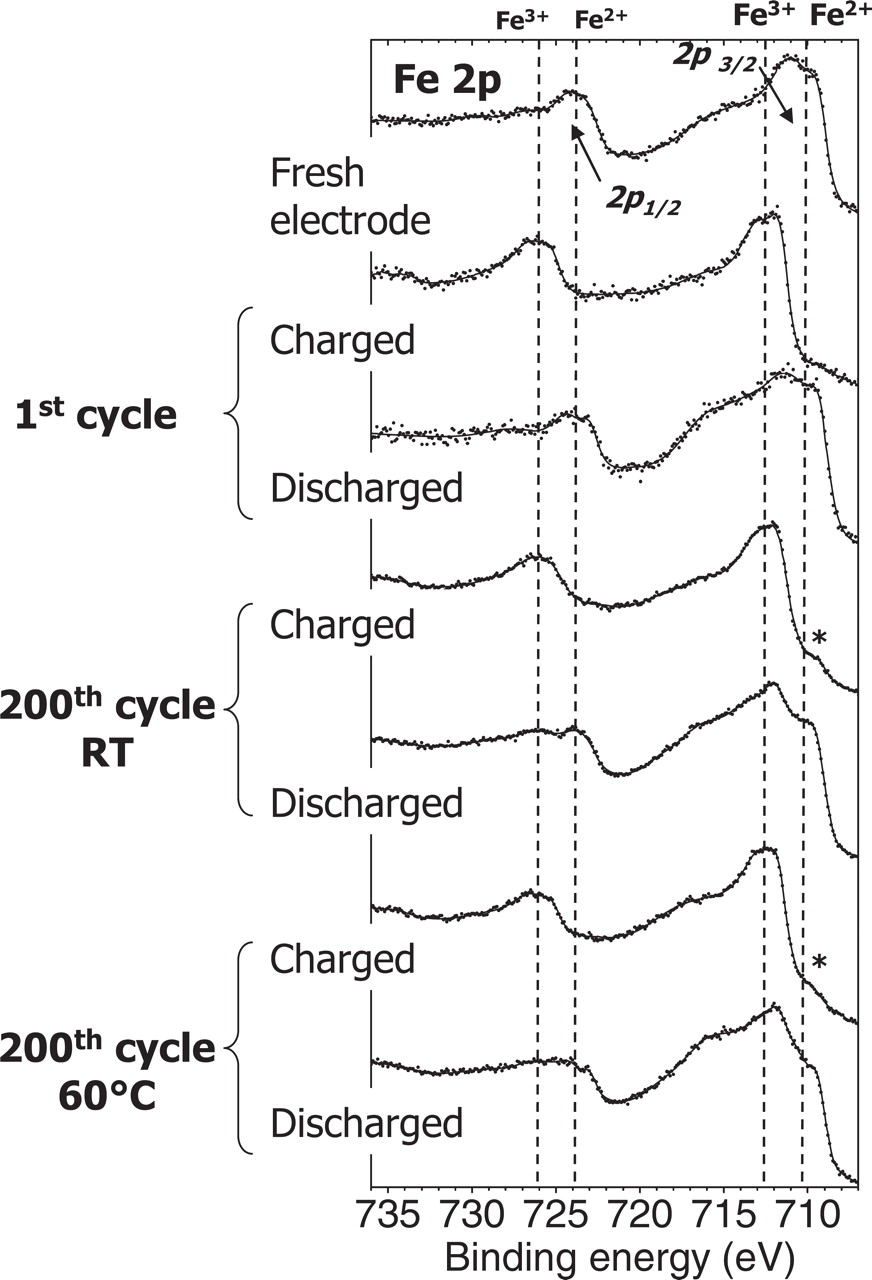
Figure 3. Fe 2p spectra of the charged and discharged LiFePO4 electrodes upon the 1st and the 200th cycle at room temperature and at 60°C. Spectra recorded on the electrolyte side surface (1). * indicates remaining Fe2+ in charged state (LiFePO4 phase).
After the first charge of the cell, the Fe 2p spectrum shows Fe 2p3/2 and 2p1/2 main peaks at ∼712 eV and ∼726 eV respectively, which is characteristic of Fe3+ ions in the FePO4 phase.31,32 The spectra obtained in charged state after long cycling (200th charge) have a very similar shape, either at RT or at 60°C. Only a weak shoulder at 710 eV (indicated by a star in the figure) shows that a weak amount of Fe2+ ions still remains at the surface of the material.
After the first discharge, the Fe 2p spectrum is very close to that of the starting LiFePO4 electrode and shows the re-insertion of Li+ ions in the active material at the positive electrode surface. Significant differences are observed after 200 cycles at RT and 60°C. Indeed, for these discharged samples a significant Fe3+ contribution can be noticed, which shows that the FePO4 phase is still present in the discharged state, at least at the surface of the particles (electrolyte side in this case). A quantification of the proportion of the LiFePO4 vs. the FePO4 phase at the surface of the three discharged samples (first discharge, 200th discharge at RT and at 60°C) is given in Figure 4. An overlay of the Fe 2p spectra after subtraction of the Shirley background is presented in Figure 4a. For a precise quantification of the proportion of both phases, the Fe 2p1/2 component of each sample was fitted with the spectra of the two reference samples LiFePO4 and FePO4, as reported in Figure 4b. The Fe 2p1/2 component (724–725 eV) was chosen because of some possible distortion of Fe 2p3/2 due to the intense neighboring F 1s signal. After the 200th cycle the FePO4 contribution accounts for 15 % at RT and 23 % at 60°C. This result points out that redox processes in the positive electrode active material are a good indicator of aging processes which are evidenced besides by capacity fading.
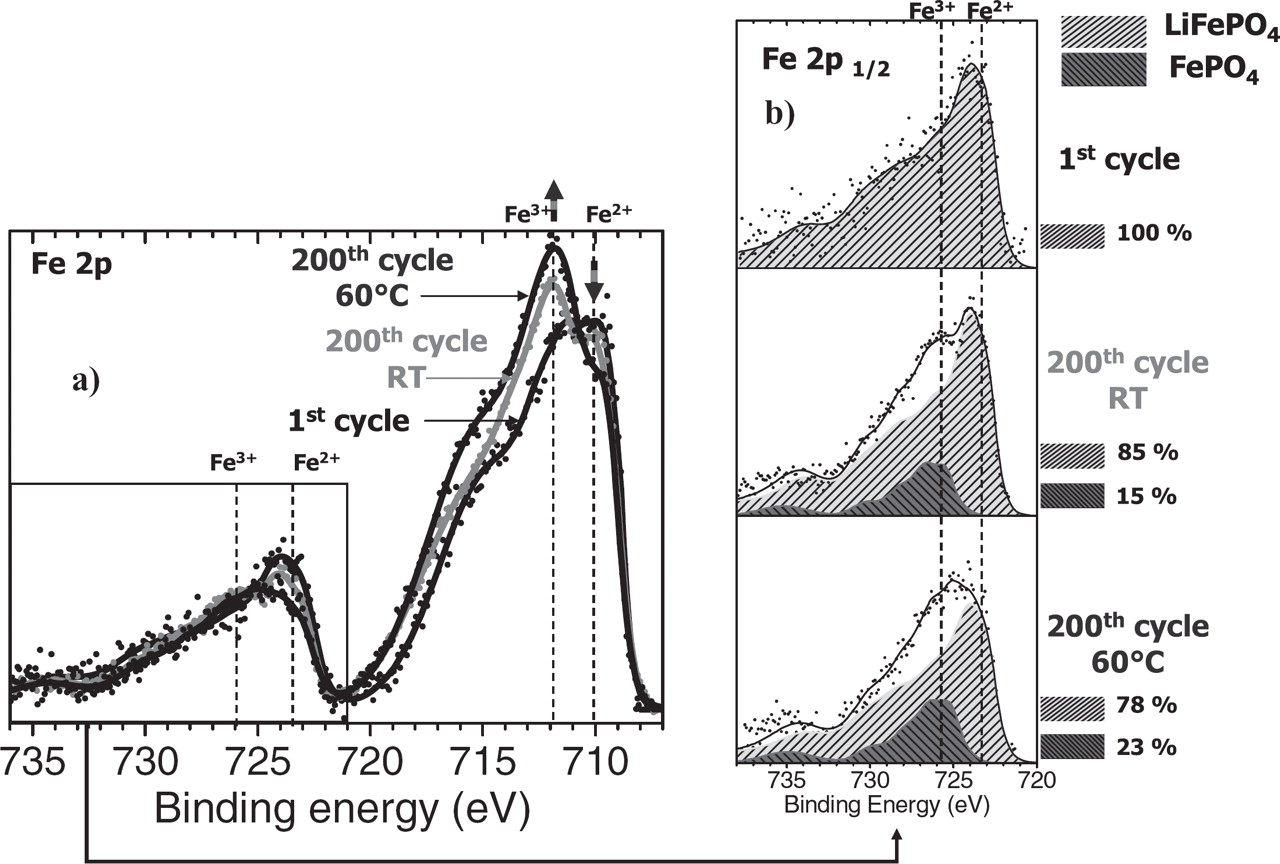
Figure 4. (a) Superposition of Fe 2p XPS spectra of discharged LiFePO4 electrodes (after subtraction of the Shirley background) obtained on the electrolyte side surface (1) after the 1st and the 200th discharge at room temperature and at 60°C. (b) Corresponding quantification of FePO4 phase from the Fe 2p1/2 component.
To grasp more insight into the understanding of these processes, we compared the results obtained on the two kinds of surfaces. Figure 5 shows the Fe 2p spectra of the positive electrode in charged states (first charge and 200th charge at RT and at 60°C) for both electrode surfaces: the electrolyte side (1) and the current collector side (2). The Fe 2p spectra of all samples are very similar, exhibiting the signature of FePO4. The weak shoulder indicated by a star at 710 eV is observed for both kinds of surfaces, revealing in all samples a very weak amount of remaining LiFePO4 phase in the charged state.
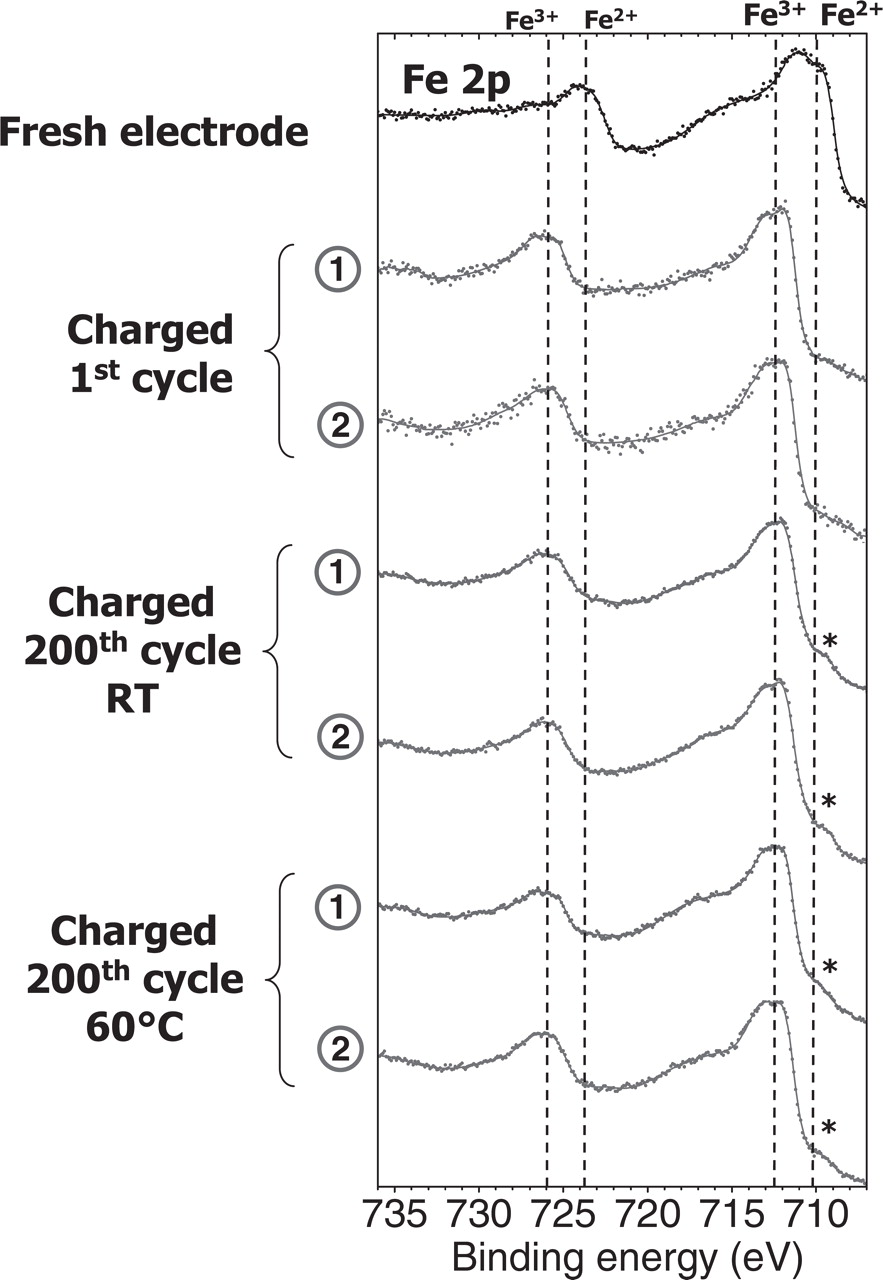
Figure 5. Fe 2p spectra of the charged LiFePO4 electrodes after the 1st and the 200th charge at room temperature and at 60°C. Spectra recorded on the electrolyte side surface (1) and current collector facing surface (2). * indicates remaining Fe2+ (LiFePO4 phase).
Figure 6 shows the Fe 2p spectra of the corresponding discharged states (first discharge and 200th discharge at RT and at 60°C). As soon as the first discharge, some differences are observed between the two electrode surfaces (1) and (2). Some remaining amount of FePO4 can be evidenced on the current collector facing surface (2), as indicated by arrows. Moreover, the proportion of this remaining FePO4 phase in discharged state increases after 200 cycles at RT and especially at 60°C. The proportion of FePO4 phase remaining at the two kinds of surfaces of the positive electrode after 1 discharge and 200 discharges at room temperature and at 60°C are reported in Table I. The proportion of FePO4 phase on the current collector side (2) in discharged state is 8% after the first cycle, 30% after the 200th cycle at RT and 44% after the 200th cycle at 60°C, to be compared to zero (not detected), 15% and 23% on the electrolyte side (1), respectively. The amount of remaining FePO4 phase is thus always higher on the current collector side (2) than on the electrolyte side (1) and this effect is more important at 60°C than at RT.
Table I. Percentage of FePO4 phase remaining at the two kinds of surfaces of the positive electrode after 1 discharge and 200 discharges of a LiFePO4//graphite cell at room temperature and at 60°C. The values are determined from Fe 2p spectra.
| % FePO4 phase | ||
|---|---|---|
| Electrolyte side (1) | Current collector side (2) | |
| 1st cycle | — | 8 |
| 200th cycle RT | 15 | 30 |
| 200th cycle 60°C | 23 | 44 |
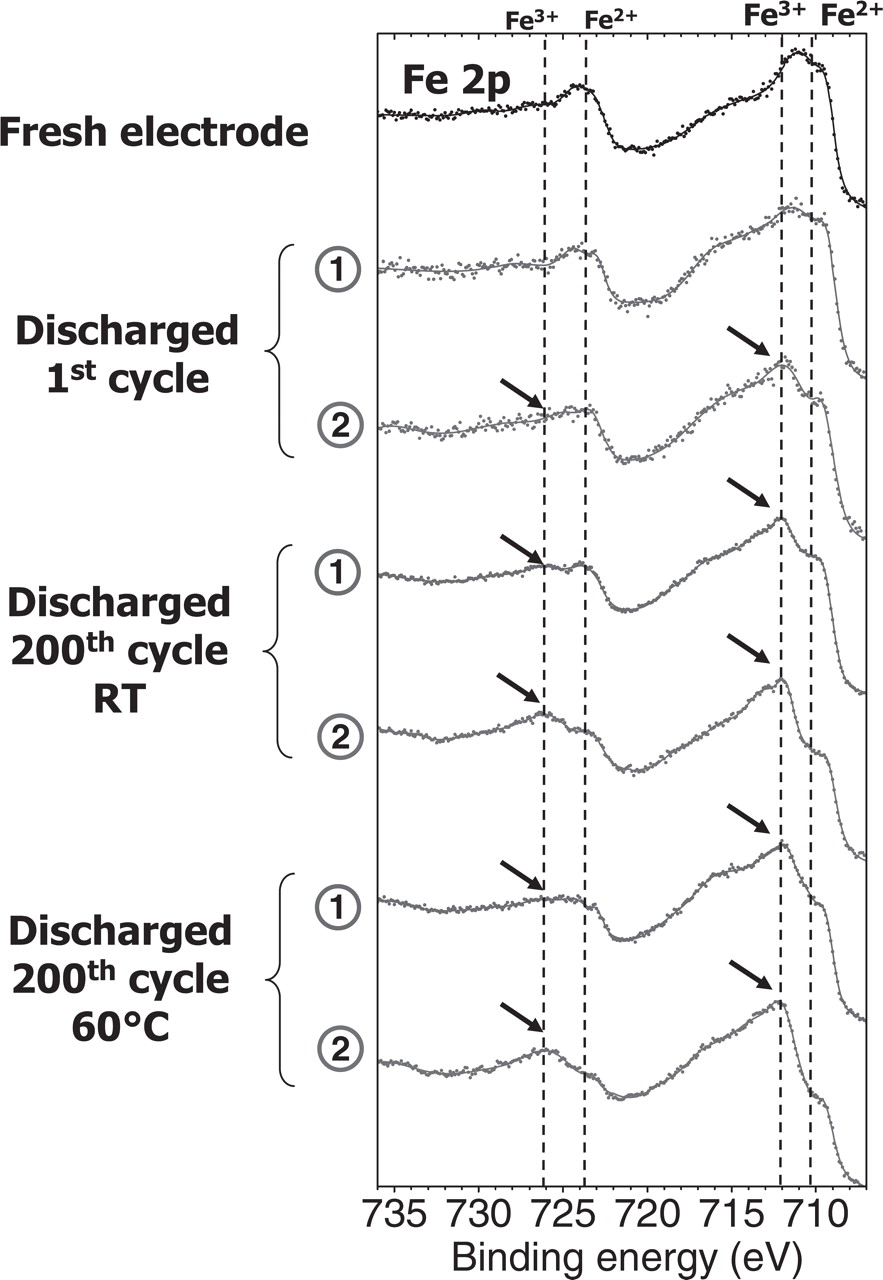
Figure 6. Fe 2p spectra of the discharged LiFePO4 electrodes after the 1st and the 200th discharge at room temperature and at 60°C. Spectra recorded on the electrolyte side surface (1) and current collector facing surface (2). The arrows indicate the signature of remaining Fe3+ (FePO4 phase).
Actually the LiFePO4 electrode is not expected to be totally in discharged state at the end of discharge of the cell, and the observation of a small amount of remaining FePO4 phase after the first discharge is expected. Indeed, upon the first charge of the LiFePO4 // graphite cell the following reaction takes place at the positive electrode:
![Equation ([1])](https://content.cld.iop.org/journals/1945-7111/159/4/A357/revision1/jes_159_4_A357eqn1.jpg)
Li+ ions and electrons are simultaneously transferred to the negative electrode via the electrolyte and the external circuit, respectively. However, a small proportion x of Li+ and electrons are consumed to form the Solid Electrolyte Interphase (SEI) at the surface of the graphite negative electrode, which is mainly an irreversible process and results in the irreversible capacity observed at the first cycle:
![Equation ([2])](https://content.cld.iop.org/journals/1945-7111/159/4/A357/revision1/jes_159_4_A357eqn2.jpg)
A decreased proportion (1 − x) of Li+ ions is thus actually inserted into the graphite negative electrode, which is taken into consideration for electrodes balancing:
![Equation ([3])](https://content.cld.iop.org/journals/1945-7111/159/4/A357/revision1/jes_159_4_A357eqn3.jpg)
As a result, upon the first discharge of the cell a decreased proportion of Li+ ions are re-inserted into the positive electrode:
![Equation ([4])](https://content.cld.iop.org/journals/1945-7111/159/4/A357/revision1/jes_159_4_A357eqn4.jpg)
Note that this simplified mechanism does not take into consideration the formation of a passivation layer at the surface of the positive electrode (to a lesser extent), or a partial redissolution of the SEI upon discharge. However, it shows that a small amount of remaining FePO4 phase in the LiFePO4 electrode is expected after the first discharge.
Now, our results show very different amounts of this remaining FePO4 phase on the current collector side (2) and on the electrolyte side (1). There is a heterogeneous state of charge of the active material within the positive electrode at the end of each cycle, and this heterogeneity increases upon long cycling, especially at 60°C. Note that this heterogeneity is not observed at the end of charge in the same conditions. It means that some particles, which have been normally de-intercalated upon charge, remain in the de-intercalated state after the following discharge.
Note that a non-uniform de-intercalation process within LiFePO4 electrodes was already evidenced in a recent work of Liu et al. using synchrotron X-ray microdiffraction.33 However, in their case the phenomenon was observed upon charge and at high current rates (18 C). In our case, this phenomenon is observed upon discharge and at low rates (C/5 and C/10). Fongy et al.34 have shown that ionic and electronic kinetic limitations upon discharge at high rate regimes could be attributed to LiFePO4 electrode formulation, depending on porosity and thickness. However in our case the non-uniform re-insertion of Li+ cations cannot be directly attributed to such parameters since the discharge rates are low, moreover we obtained similar results for thin electrodes (loading of 7 mg.cm−2) and for thick electrodes (20 mg.cm−2, presented in this work).
The increase of the heterogeneous re-insertion process of Li+ cations within the LiFePO4 electrode upon long cycling, especially at 60°C, suggests different aging processes:
- (i)A continuous loss of active lithium due to parasitic reactions at the electrode/electrolyte interfaces. Due to the instability of the SEI, the amount of active lithium can be reduced at each cycle, resulting in thickening or continuous repairing of this interfacial layer.
- (ii)A loss of active material participating to the electrochemical reaction, due to some electrochemical milling as recently evocated.17,35–37 Such mechanical process may provoke cracking arising from strain-stress field interaction in the solid grains upon Li+ insertion. By disruption of the electron conductive path provided by carbon black and coating, a loss of electronic contact may occur resulting in inactive grains towards the redox reaction. The cracked sub-grains can also generate wettability issues.
In order to better understand the origin of these aging processes we carried out similar analyzes with half-cells, by using the same positive electrode and electrolyte but with a metallic lithium foil as negative electrode. Figure 7 shows Fe 2p spectra of the positive electrode in discharged states, i.e. after the first discharge and the 200th discharge at RT for both electrode surfaces: the electrolyte side (1) and the current collector side (2). It is clear that no difference is observed for Fe 2p spectra between surfaces (1) and (2) either after the first or the 200th discharge. In addition, no residual signature of FePO4 is observed after the 200th discharge contrary to the results previously obtained for LiFePO4 // graphite cells.
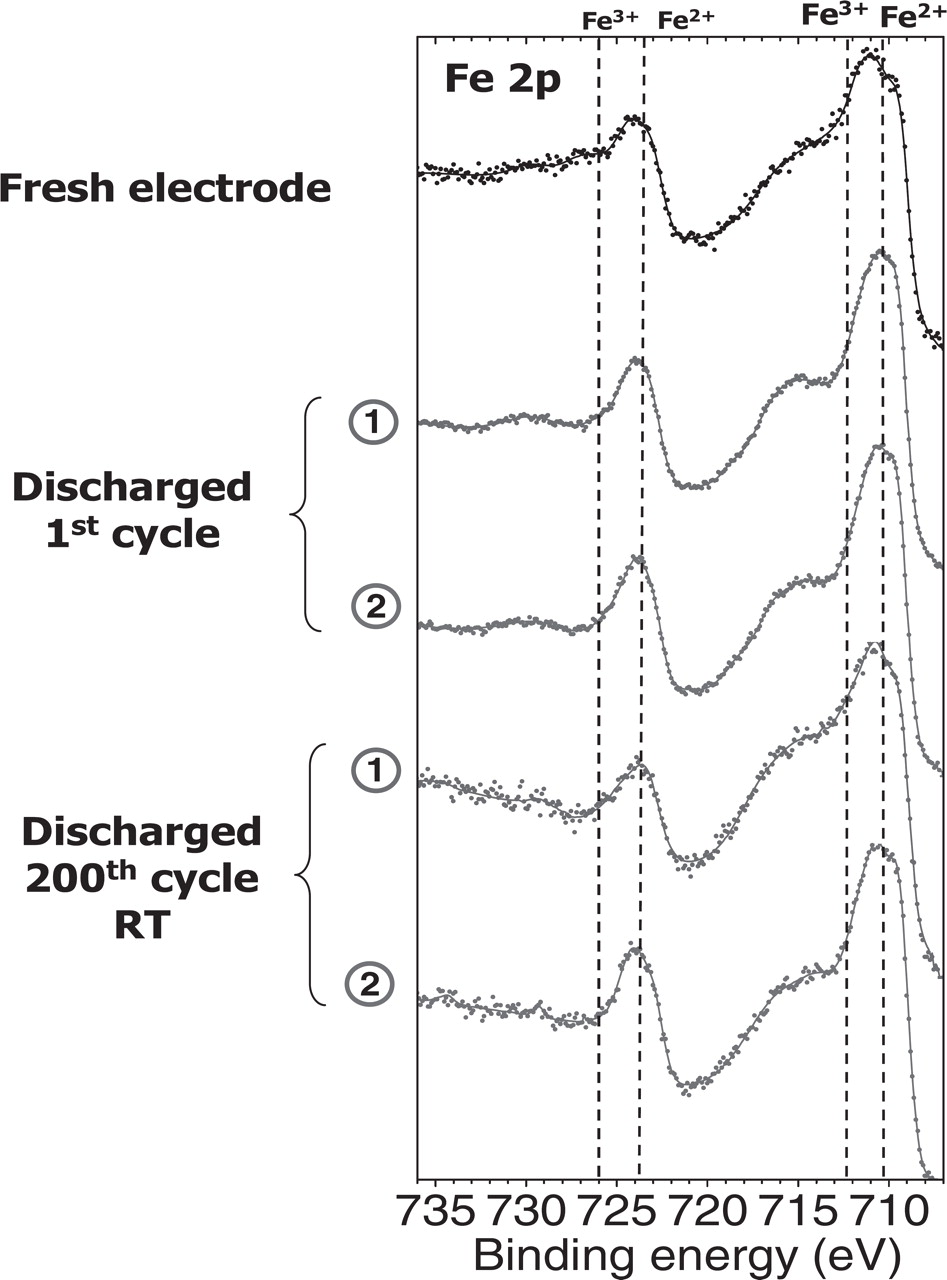
Figure 7. Fe 2p spectra of the discharged LiFePO4 electrodes after the 1st and the 200th discharge of LiFePO4//Li0 half-cells at room temperature and at 60°C. Spectra recorded on the electrolyte side surface (1) and current collector facing surface (2).
It is also to notice that the fine structure observed for the fresh electrode (710 and 711 eV for Fe 2p3/2) totally disappears after the first discharge in half-cell. Although it is beyond the scope of this paper to comment on this point, this observation supports the assumption that some impurities and/or defects at the surface of positive the active material may be reduced upon discharge.
Nevertheless, these results show that the lack of reversibility of the Fe2+/Fe3+ redox reaction previously evidenced within the positive electrode can be totally overcome by lithium replenishment, in agreement with a recent work demonstrating that active lithium can be inserted into a degraded Li-ion cell to extend its cycle life.38 The observed phenomenon is thus assigned to a continuous loss of active lithium upon cycling rather than to electrochemical milling.
The next step of this study was to further elucidate the origin of the detrimental loss of active lithium upon cycling. In this way we carefully analyzed the electrode/electrolyte interfaces.
Interfacial layers.— Positive electrode/electrolyte interface
Figure 8 shows the O 1s and P 2p spectra of the discharged LiFePO4 electrodes (first discharge and 200th discharge of a LiFePO4//graphite cell at RT and at 60°C). The O 1s spectrum of fresh LiFePO4 electrode reveals a narrow peak at 531.4 eV attributed to oxygen atoms of the (PO4)3− phosphate groups in LiFePO4, and a very weak component at ∼533 eV assigned to oxygenated species adsorbed at the surface. After the first cycle the O 1s spectrum exhibits the same components but additional weak contributions at 533 and 534 eV can be attributed to a small amount of oxygenated species deposited in the interfacial layer, ensuing from electrolyte degradation. After 200 cycles, the characteristic O 1s peak of LiFePO4 at 531.4 eV still remains the main peak of the spectrum, which points out the very low thickness of the interface layer on the LiFePO4 electrode surfaces that was already reported in previous works on the first cycle.31,32 However, an increase of the two components at 533 and 534 eV can be noted, especially at 60°C. These oxygenated species may be organic or inorganic, as it is commonly observed at the surface of graphite electrodes.39 However, the mechanisms leading to the formation of a passivation layer at the surface of LiFePO4 cannot be the same as those involved for a graphite negative electrode (reduction mechanisms), or for a high potential positive electrode (oxidation of the electrolyte at high potential). Here the passivation layer is very thin, as a consequence of the lower surface reactivity of the LiFePO4 electrode toward the electrolyte. Unfortunately, the identification of the organic species in this case is difficult because C 1s spectra are largely dominated by the PVdF binder and the carbon additive, so that no evolution of C 1s spectra can be observed from the fresh electrode to aged electrodes (for this reason, C 1s spectra are not shown here).
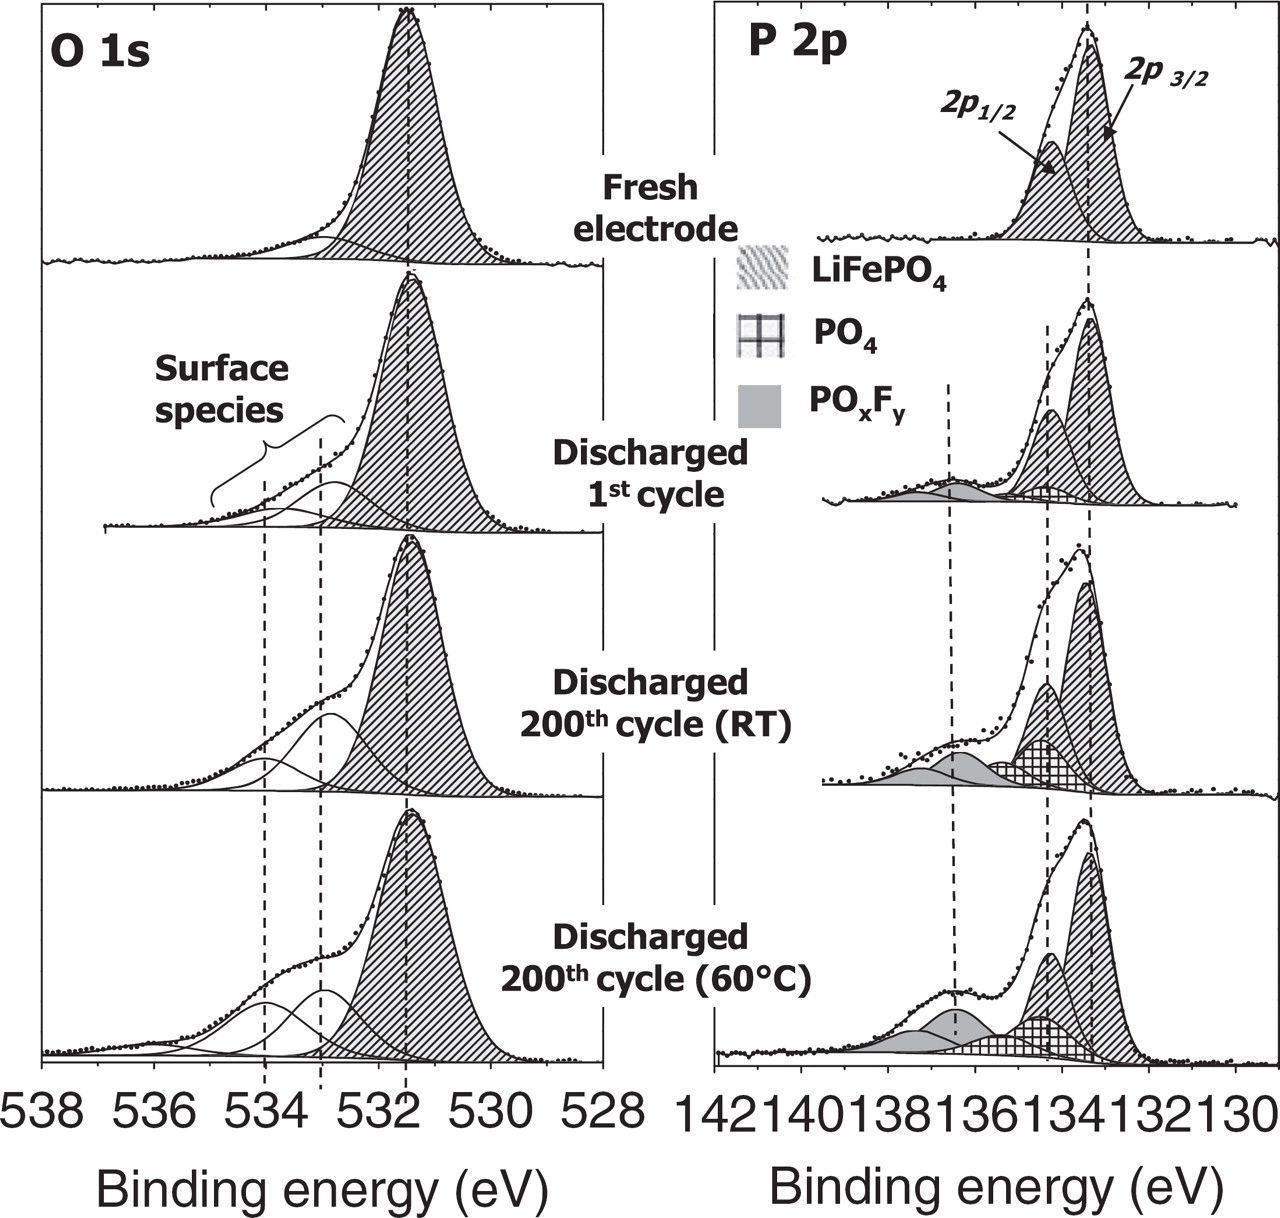
Figure 8. O 1s and P 2p spectra of LiFePO4 electrodes after the 1st and the 200th discharge of LiFePO4//graphite cells at room temperature and at 60°C. Spectra recorded on the electrolyte side surface (1).
Figure 8 also shows the P 2p spectra (2p3/2 − 2p1/2 doublets). The P 2p doublet with 2p3/2 at 133.4 eV observed at the fresh electrode surface can be assigned to the active material LiFePO4. Note that the presence of phosphide impurities at the surface of the pristine material can be excluded because the characteristic P 2p doublet of iron phosphide with 2p3/2 at 129.6 eV is not observed. After cycling the characteristic peak of LiFePO4 at 134.3 eV still remains the main peak of the P 2p spectrum. However we observe the increase of two additional doublets at higher binding energy (134.5 and 136.3 eV) that can be assigned to another kind of phosphates and to fluorophosphates (LixPOyFz) resulting from the degradation of the salt LiPF6. The amount of these species is greater after cycling at 60°C than at RT.
The presence of LiF resulting from the degradation of the salt was also evidenced by F 1s spectra (not shown here). The amount of deposited LiF was also greater at 60°C than at RT. Table II summarizes the measured amounts LiF and of oxygen and phosphorus assigned to deposited species in the interfacial layer. We can notice a progressive accumulation of deposited species upon cycling, especially at 60°C. However, these results show that the SEI layer still remains very thin even after 200 cycles at 60°C.
Table II. Atomic percentage of selected species at the surface of the LiFePO4 positive electrode after the 1st and the 200th discharge of a LiFePO4//graphite cell at room temperature and at 60°C.
| atom% | Fresh electrode | 1st cycle | 200th cycle RT | 200th cycle 60°C |
|---|---|---|---|---|
| LiF | — | 9 | 2 | 10 |
| Oxygen (surface species) | 2.3 | 3.7 | 5.8 | 6 |
| Phosphorus (PO4+POxFy) | — | 1.1 | 2.1 | 2 |
| LiFePO4 | 33 | 28 | 24 | 21 |
Negative electrode/electrolyte interface
Figure 9 shows the C 1s and O 1s spectra of the discharged graphite negative electrodes (first discharge and 200th discharge at RT and at 60°C). The C 1s spectrum of the fresh electrode consists of four peaks. The first component at ∼284 eV corresponds to graphite. The second one at 285 eV is assigned to the polymeric binder (and also to hydrocarbon contamination) while the two other peaks observed at 286.4 eV and 288.2 eV are attributed to C–O and O=C–O environments of carbon in the binder.
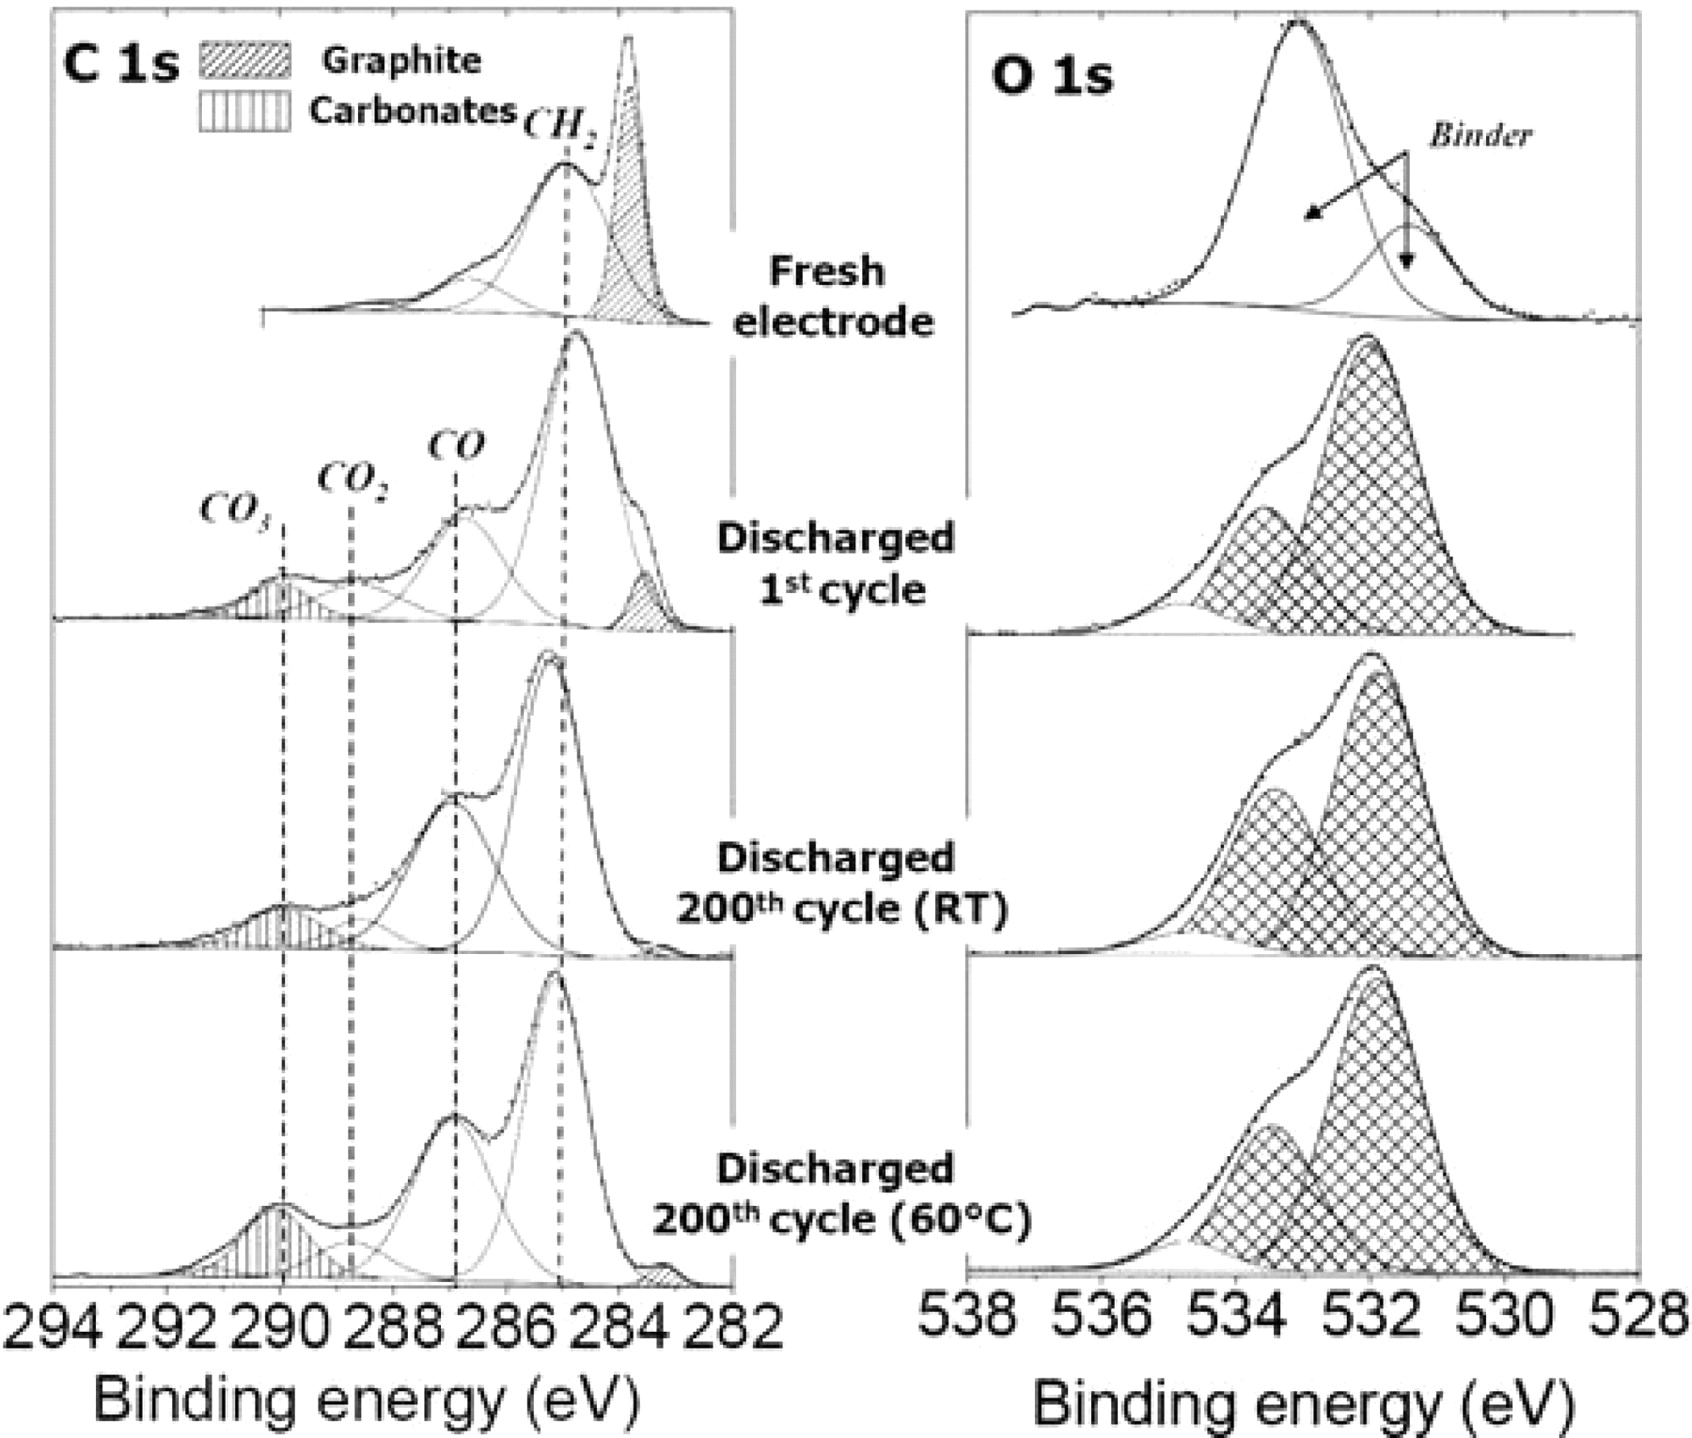
Figure 9. C 1s and O 1s spectra of graphite negative electrodes after the 1st and the 200th discharge of LiFePO4//graphite cells at room temperature and at 60°C. Spectra recorded on the electrolyte side surface.
After the first cycle, a significant decrease of the graphite component is observed showing that the active material has been covered by a SEI film. An increase of the two components assigned to C–O and O=C–O carbon atoms is noted with the appearance of a new component at 290 eV attributed to CO3-like carbon atoms (i.e. carbonate species). This is consistent with the deposition of Li2CO3 and/or ROCO2Li species at the surface of the electrode,40 resulting from the decomposition of the solvents EC, PC and DMC as described by several mechanisms reported in the literature.39,41–43
After 200 cycles a further decrease of the graphite component is observed, either at RT or at 60°C. Compared to the first discharge an increase of the component assigned to C–O environments is also observed, showing some accumulation of organic species at the surface upon cycling. The main change observed at 60°C compared to RT is the greater amount of carbonate species (25% at 60°C vs. 18% at RT) which suggests an enhanced degradation process at elevated temperature. The measured amounts LiF, of carbonates and of phosphorus assigned to deposited species in the SEI are reported in Table III.
Table III. Atomic percentage of selected species at the surface of the graphite negative electrode after the 1st and the 200th discharge of a LiFePO4//graphite cell at room temperature and at 60°C.
| atom% | Fresh electrode | 1st cycle | 200th cycle RT | 200th cycle 60°C |
|---|---|---|---|---|
| Carbonates | — | 12 | 18 | 24 |
| LiF | — | 21 | 30 | 7 |
| Phosphorus (PO4+POxFy) | — | 2.5 | 5.3 | 3.3 |
| Graphite | 22 | 1.5 | 0.2 | 0.6 |
Figure 9 also shows O 1s spectra of the same samples. For the fresh graphite electrode, the spectrum consists of two peaks only assigned to oxygen atoms of the binder. For cycled electrodes, we can observe the replacement of these peaks by new components in good agreement with the covering process of the graphite electrode by a SEI containing oxygenated species. The two components at 532 eV and 533.5 eV are in good agreement with the deposition of carbonate salts (Li2CO3 and lithium alkyl carbonates ROCO2Li40) in the SEI, that result from the decomposition of the solvents. The small component at 534.5 eV is attributed to the degradation product of vinylene carbonate (VC) used as electrolyte additive.44
Additional information was provided by F 1s and P 2p core peaks (not shown here). As for the positive electrode LiF, phosphates and fluorophosphates (probably lithiated) are identified at the surface (see Table III). Between the first and the 200th cycle at RT, the amount of LiF increases from 21% to 30% and some accumulation of (fluoro)phosphate species is also observed. Surprisingly, after 200 cycles at 60°C we can notice a significant decrease of the amount of LiF (30% at RT vs. 7% at 60°C) and also of the (fluoro)phosphate species. Indeed, one would expect an increase of the amount of LiF upon cycling at 60°C due to a more important degradation of LiPF6 at elevated temperature. However we have also to consider solubilization properties of the LiF in the electrolyte and its tendency to aggregate in apolar non-conductive species as reported in recent works.45 Note that the solubility of LiF is significant in the ternary mixture (EC/PC/3 DMC). This latest remark is in line with the simultaneous increase of LiF species identified at the positive electrode (200th cycle at 60°C).
To complete this study we have to consider the possible dissolution of iron in the electrolyte and its detrimental catalytic effect on the SEI at the graphite electrode surface.19, 21, 22 As the detection of very low amounts of iron is not possible by XPS when fluorine is present (Fe 2p analysis obscured by F 1s neighboring peak), complementary quantitative analyzes were carried out by X-ray fluorescence spectroscopy on graphite electrodes cycled at RT and at 60 °C. The amounts of iron found on the graphite electrode after 200 cycles at RT and 60°C are 100 and 140 ppm, respectively. These amounts of iron are very similar, and so this cannot be associated to the differences observed in aging processes of these cells. Note that these amounts of iron, even rather low, may contribute to the degradation the layered structure of graphite and so to the performances of the cell.
As a summary, the changes observed for C 1s, O 1s, F 1s and P 2p spectra upon long cycling at RT correspond to an accumulation process of both organic and inorganic lithiated species at the surface of the negative electrode. This result lets us assume that a small proportion of electrochemically active lithium is lost at each cycle. As a result, the lack of reversibility of the Fe2+/Fe3+ redox reaction in the active material after 200 cycles could be explained by this progressive evolution of the SEI.
When the temperature of cycling increases (60°C) the observed changes suggest other side reactions involving different lithiated species (Li2CO3, LiF ...), either deposited in greater amount on the electrode or partly dissolved in the electrolyte. In this case, the greater loss of electrochemically active lithium is in line with a further lack of reversibility of the Fe2+/Fe3+ redox reaction as previously commented.
Conclusions
In this work we have investigated aging mechanisms of LiFePO4 // graphite cells by XPS analyzes. Through the use of different probes/core peaks, we examined the evolution of the Fe2+/Fe3+ redox reaction as well as the changes occurring at the interfacial layers on both electrodes upon cycling. The results reveal a heterogeneous intercalation of Li+ cations within the positive electrode, that is detectable as soon as the first cycle and becomes more important upon cycling.
It is worth noting that the decrease of the Fe2+/Fe3+ redox reaction reversibility in the LiFePO4 active material can be totally overcome when lithium is used as negative electrode, showing that the loss of active lithium is of paramount importance. Careful analysis of interfacial layers after long cycling do not evidence any significant thickening of the SEI on the graphite electrode and confirm the low thickness of the surface layer on the LiFePO4 particles even after 200 cycles. These results are in agreement with a loss of cyclable lithium at each cycle, through the formation of small amounts of lithiated species mainly deposited at the negative electrode and maintaining some conversion and destabilization of the SEI.
They also suggest that the greater capacity fading under cycling at 60°C might be due to an increased amount of generated lithiated species either deposited on the electrode (Li2CO3) or partly dissolved in the electrolyte (LiF).
Acknowledgments
The authors thank Süd-Chemie Company for providing electrode materials and ANR (National Research Agency) Stock-E program (ANR-09-STOCK-E-07) for financial support.