
Abstract
CZTS thin films have been prepared from the electrolyte with different pH values by co-electrodeposition. The effects of bath pH value on the cyclic voltammetry, structure, morphology, composition and optical properties of CZTS thin films have been investigated in details. Cyclic voltammetry measurements reveal that pH value impacts the reduction potential of metals and the composition in precursors. The analyses of XRD and Raman spectroscopy suggest that the CZTS films have better crystallinity and less secondary phases when the bath pH is about 5.0. The chemical composition and morphological studies indicate the formation of compact and homogenous CZTS thin films with stoichiometric composition at a pH value of 5.0. And its bandgap energy is around 1.49 eV.
Export citation and abstract BibTeX RIS
Cu2ZnSnS4 (CZTS) is a candidate absorber for thin-film solar cells because of its direct optical bandgap of 1.5 eV, high optical absorption coefficient (104 cm−1), and abundant, non-toxic, and cheap constituent elements.1,2 The efficiency of pure-sulfide CZTS solar cell has reached 8.8%.3 However, it is still far below the theoretical limit (32%).4 Thus, there is plenty of room to make substantial progress toward developing low-cost and high-efficiency photovoltaic devices.
CZTS thin films have been prepared by a variety of methods based on vacuum and nonvacuum techniques.5 Among these methods, electrodeposition is promising because of low-cost source materials, large deposition area, inexpensive equipment and low-temperature growth.6 Quarternary Cu-Zn-Sn-S co-electrodeposition has the advantage of uniform element distribution in the films.7,8 Hence more and more people prepare CZTS thin films using single-step co-electrodeposition. Except for a few groups using bath containing mixture of metal cations and Na2S2O3, most of teams deposit single-step Cu-Zn-Sn-S films in the electrolyte consisting of metal cations, sulfur source (Na2S2O3 usually), complexing agents and pH controlling agent.9–12 The synthesis of Cu-Zn-Sn-S precursors is dependent on various factors, such as concentration of metal salts, concentration of sulfur source, complexing agents, pH of the solution and so on.13–16 Jiahua Tao et al.13 and Tulshi Shiyani et al.14 investigated the effects of Zn concentration in the solution and the concentration of Cu, Zn, Sn and S in the electrolyte on the properties of CZTS thin films prepared by co-electrodeposition, respectively. And they found that crystallinity and phase of CZTS thin films could be impacted. B. S. Pawar et al.15 and M. Jeon et al.16 found that tri-sodium citrate (Na3Cit), which was used as complexing agent in the fabrication of CZTS precursors by co-electrodeposition, mainly influenced the crystallinity and surface morphology of CZTS films. Nevertheless, the impacts of pH controlling agent on the performances of CZTS thin film are seldom studied.
In this work, the effects of pH value in the electrolyte on the properties of co-electrodeposited CZTS thin film are investigated. The research results reveal that the solution pH value has a significant effect on the structural, compositional, morphological and optical characteristics of the prepared thin films.
Experimental
A three-electrode system was used with a silver/silver chloride (Ag/AgCl) as a reference electrode, a platinum (Pt) foil as a counter electrode and FTO (SnO2:F) coated glass substrate as a working electrode. Depositions were made at room temperature without stirring. Electrolytic bath contained CuSO4 (0.02 M), ZnSO4 (0.04 M), SnSO4 (0.02 M), Na2S2O3 (0.02 M), Na3Cit (0.12 M) as complexing agent and tartaric acid as pH controlling agent. Samples S1, S2, S3 and S4 were prepared in bath pH value of 6.0, 5.0, 4.5 and 4.0 respectively, keeping concentrations of all other salts constant. The Cu-Zn-Sn-S precursors were deposited on FTO at −1.1 V (vs. Ag/AgCl). Then the precursors and sulfur powder (∼1 g) were loaded into a sealed quartz tube. The tube was sealed at low pressure (1 kPa). The sulfurization temperature was 580°C. The duration of sulfurization process was 60 min and the heating rate was 10°C/min, which was followed by naturally cooling.
The structural properties of the CZTS films were carried out using a Philips X'Pert-MPD X-ray diffraction (XRD) system equipped with a Cu Kα source (wavelength λ = 1.54060 Å). Crystalline phase compositions were determined by Raman spectroscopy using a RENISHAW Laser Raman Spectrophotometer with a laser wavelength of 532 nm. The thicknesses of the films were measured by a TENCOR D100 stylus profiler. The optical properties were measured in the range of 400–1400 nm with a Varian Cary 5000 spectrometer. PL measurement was done with 750 nm laser. The films were characterized using a HITACHI S-3000N field emission scanning electron microscope (SEM) attached with an energy-dispersive X-ray analysis (EDAX) analyzer to measure the sample composition. Mott-Schottky analysis was performed using three electrode electrochemical cell containing platinum as counter electrode, Ag/AgCl as a reference electrode and CZTS/FTO substrate as a working electrode in a 0.5 M Na2SO4 solution. And the AC frequency was 2 kHz.
Results and Discussion
Cyclic voltammetry of electrolyte
The conditions of co-electrodeposition of Cu-Zn-Sn-S precursor layers are related to the individual electrochemical reactions. The Nernst equations are the followings:
![Equation ([1])](https://content.cld.iop.org/journals/2162-8777/5/9/P521/revision1/d0001.gif)
![Equation ([2])](https://content.cld.iop.org/journals/2162-8777/5/9/P521/revision1/d0002.gif)
![Equation ([3])](https://content.cld.iop.org/journals/2162-8777/5/9/P521/revision1/d0003.gif)
![Equation ([4])](https://content.cld.iop.org/journals/2162-8777/5/9/P521/revision1/d0004.gif)
It can be seen that Cu, Zn, Sn and S have much difference in the standard reduction potentials and reduction potential of Zn is the most negative. To reduce the difference in the reduction potential of each component, Na3Cit was used as the complexing agent. Nevertheless, the stable species of citrates are varied with bath pH value. According to Ref. 17, the most dominant citrate species is citric acid (H3Cit) at low pH, but H3Cit cannot make complex with three metal components. When the bath pH is increased, H2Cit− becomes dominant followed by HCit2−. At high pH the most dominant citrate species is Cit3−. At a fixed citrate concentration, the form of the Cu citrate complex is dependent on the pH value of the electrolyte:
![Equation ([5])](https://content.cld.iop.org/journals/2162-8777/5/9/P521/revision1/d0005.gif)
When the bath pH value is under 2, Sn2+ is the dominant ionic species. And the dominant ionic form of the Sn citrate complex is SnHCit− under pH 7. When the bath pH value is 4.7 or 6.8, Zn(Cit)24 − is the most stable complex species. At pH 4.7, the reduction of Zn is easier than at high pH. Thus the bath pH affects complexing capacity of Na3Cit and the reduction behaviors of Cu, Sn, Zn and S from the unitary system further. Cyclic voltammetry (CV) was performed to analyze the behaviors (as shown in Figure 1). The scan rate of CV was fixed at 10 mV/s. It indicates that the reduction peaks of Cu, Zn and Sn shift to the negative direction, when the bath pH is lower than ∼5.0. For the solution of ∼6.0 pH, the Zn and Cu reduction peaks are at more negative potentials and there is no obvious reduction peak of Sn. Table I shows the composition of deposited Cu-Zn-Sn-S precursors with various bath pH values. It seems that when pH is ∼6.0 (sample S1), there is more Cu and less Zn in the film, which suggests that the bath is favor for Cu deposition rather than for Zn. And when pH is ∼4.0 (sample S4), the electrolyte is suitable for Sn deposition. It can be concluded that the pH value of solution could affect the citrate species and the forms of metal citrate complexes, then the metal reduction potential and thus the atomic composition of precursors.
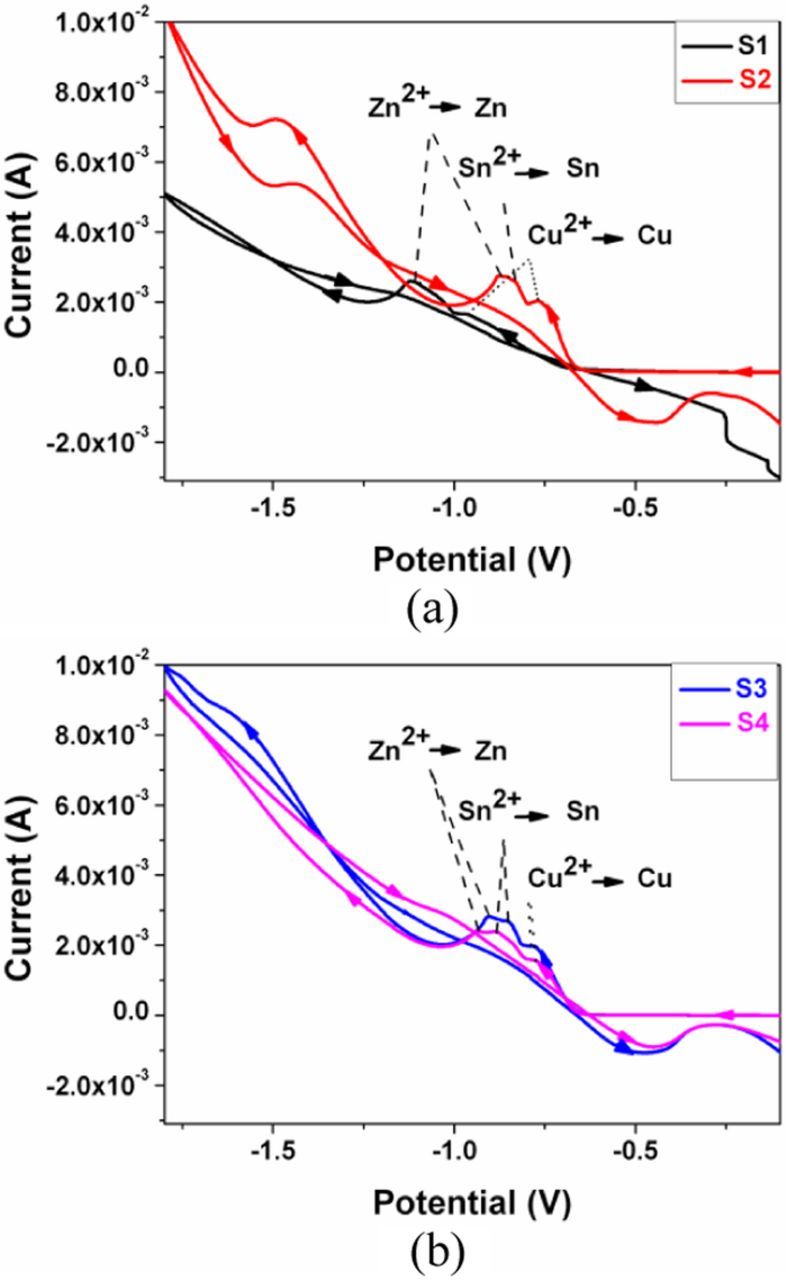
Figure 1. Cyclic voltammetry plots of the electrolyte solutions with different pH values for preparing precursors of (a) samples S1 and S2, (b) samples S3 and S4.
Table I. Elemental composition of CZTS films.
| Atom ratio of precursor (at.%) | Atom ratio of sulfurized film (at.%) | ||||||||
|---|---|---|---|---|---|---|---|---|---|
| Sample No. | pH value of electrolyte | Cu | Zn | Sn | S | Cu | Zn | Sn | S |
| S1 | 6.0 | 47.62 | 10.45 | 18.92 | 23.01 | 27.10 | 8.20 | 11.66 | 53.04 |
| S2 | 5.0 | 36.41 | 23.11 | 19.44 | 21.04 | 25.47 | 12.35 | 12.20 | 49.99 |
| S3 | 4.5 | 37.75 | 20.60 | 16.63 | 25.01 | 27.45 | 12.10 | 13.92 | 46.53 |
| S4 | 4.0 | 28.73 | 21.43 | 32.12 | 17.72 | 12.36 | 8.34 | 23.75 | 55.55 |
Structural characterization
The XRD patterns of the sulfurized CZTS films prepared at different pH values of electrolyte are shown in Figure 2. XRD analyses reveal that the samples are mainly composed of CZTS (JCPDS 26–0575) and FTO substrate. When the pH is ∼4.0 (sample S4), secondary phase Sn1-xS2 appears in the film. And there are no obvious peaks belonging to other impurities. The major diffraction peaks of CZTS appear at 2θ values 28.5°, 32.9°, 47.3° and 56.1°, which are attributed to (112), (200), (220) and (312) planes of CZTS crystals.18 The major peak along (112) plane is sharper than others when the pH is about 5.0, which means that the crystallinity of sample S2 is better.19 But when the pH is lower or higher than 5.0, (112) plane peak decreases.
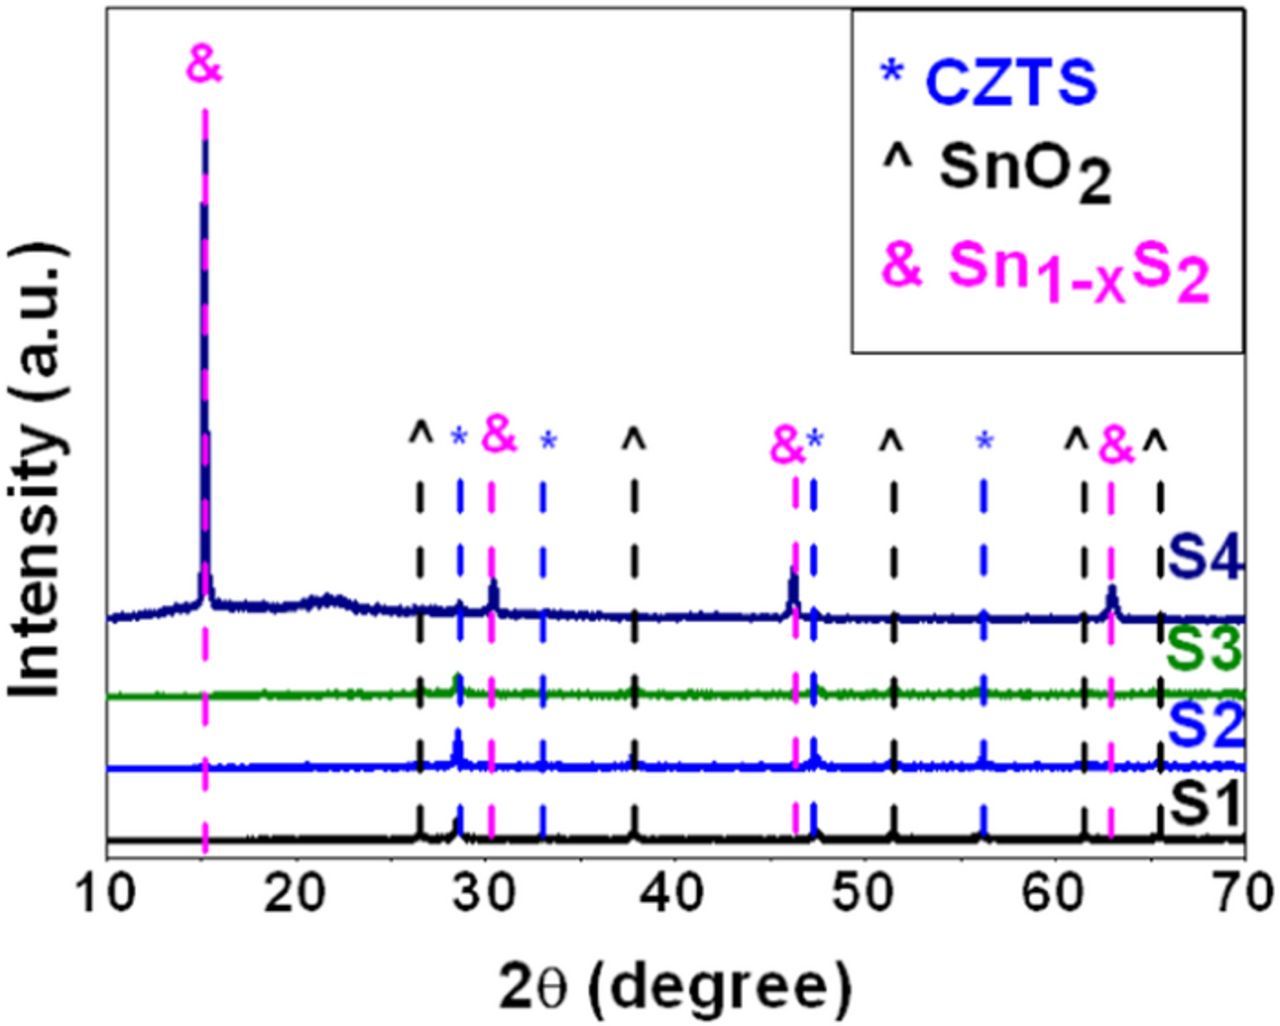
Figure 2. X-ray diffraction patterns of the CZTS films.
The grain size of the CZTS films was calculated for the most striking (112) peak by the Scherrer formula:20
![Equation ([6])](https://content.cld.iop.org/journals/2162-8777/5/9/P521/revision1/d0006.gif)
where k is the shape factor (k = 0.9), D is grain size of nanoparticles, λ is the X-ray wavelength (0.15406 nm), β is the full width at half-maximum (FWHM) in radians and θ is the Bragg angle. And the crystallite sizes were obtained from the Williamson and Hall (W-H) equation:20
![Equation ([7])](https://content.cld.iop.org/journals/2162-8777/5/9/P521/revision1/d0007.gif)
where ɛ is the lattice strain. The strain present in the material and the crystallite size were calculated from the slope and intercept of the fitted straight line taking 4sinθ along X-axis and βcosθ along Y-axis. The crystallite sizes calculated by Scherrer's formula and W-H equation are in close agreement and are listed in Table II.
Table II. Values of crystallite size (D) and strain (ɛ) calculated from Scherrer's formula and W-H analysis, respectively.
| (112) peak | D and ɛ calculated from W - H Equation | ||||
|---|---|---|---|---|---|
| Sample No. | 2θ (°) | 2FWHM (°) | D calculated from Sherrer's Equation (nm) | D (nm) | ɛ (×10−3) |
| S1 | 28.58 | 0.18 | 46.29 | 47.85 | 4.32 |
| S2 | 28.53 | 0.16 | 52.08 | 54.95 | 2.00 |
| S3 | 28.60 | 0.18 | 46.29 | 48.78 | 3.38 |
| S4 | 28.64 | 0.27 | 29.76 | 32.79 | 10.96 |
It is well-known that the X-ray diffraction peaks of CZTS coincide exactly with ZnS (JCPDS 05–0566) and Cu2SnS3 (CTS) (JCPDS 89–4714) compounds.19 Raman spectroscopy is a useful tool to confirm the formation of CZTS material. Figure 3 shows Raman spectra of the CZTS films. The three main Raman characteristic peaks of CZTS are observed clearly at ∼283, ∼334 and ∼371 cm−l for all the samples.21,22 There is a peak of 314 cm−1 belonging to SnS2 in sample S4, which is consistent with the analysis of XRD. The crystallinity of sample S2 is better for its sharper and narrower major peak (∼334 cm−1). From the results of XRD and Raman, it seems that the pH of electrolyte could affect the structure and crystallinity of the CZTS films apparently. And the CZTS film has better crystallinity and less secondary phases when the bath pH is ∼5.0.
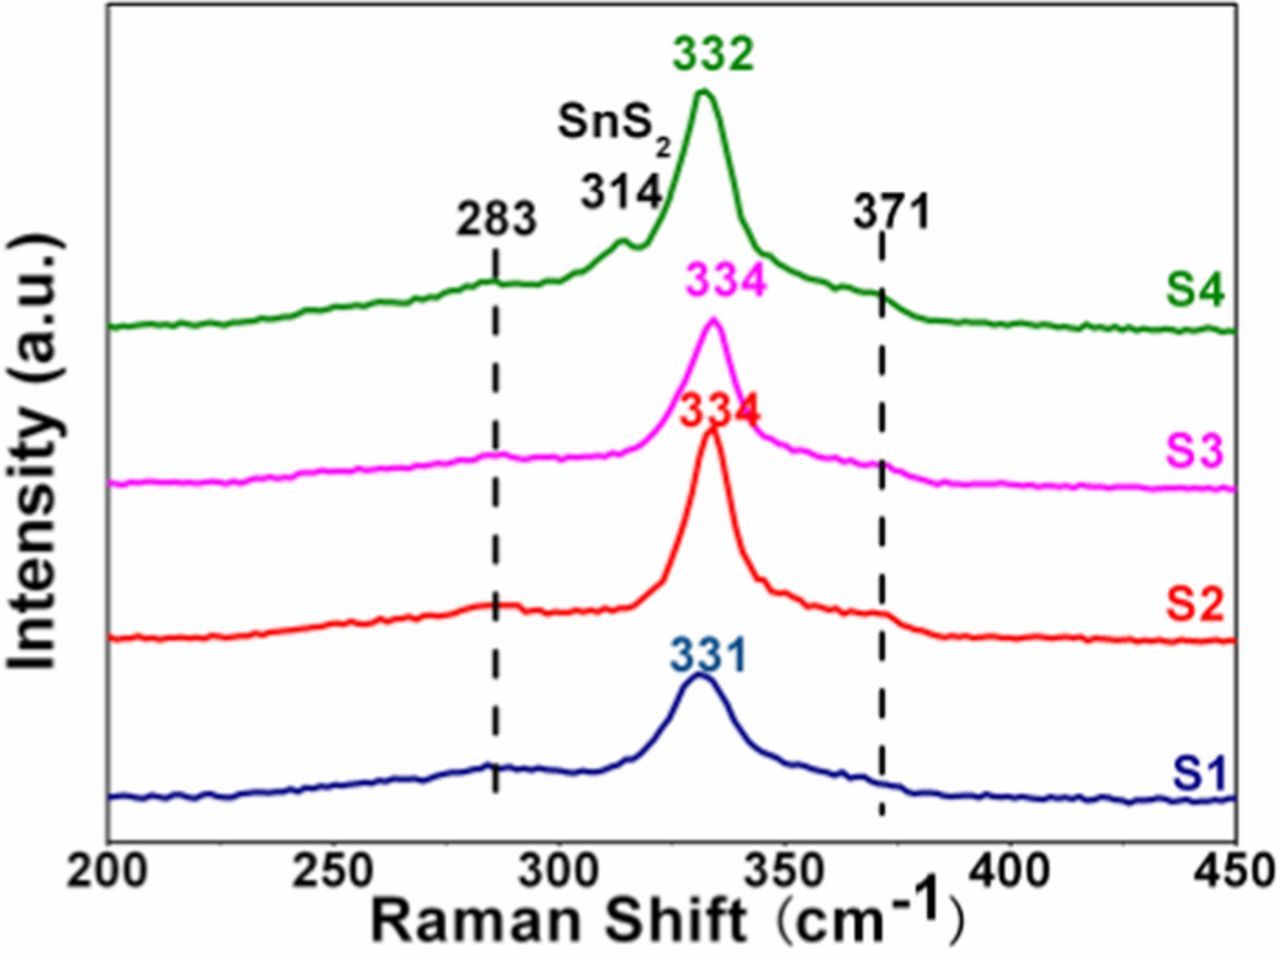
Figure 3. Raman spectra of the CZTS films.
Compositional and morphological characterization
Table I presents the compositions of the annealed films determined by EDAX. It seems that sample S1 is Cu-rich and Zn-poor with composition ratios of Cu/(Zn + Sn) and Zn/Sn are 1.36 and 0.70, respectively. And sample S4 is Sn-rich, which is in accordance with XRD and Raman analysis results. S2 and S3 have similar composition. However, the atom ratio of Cu:Zn:Sn:S for S2 is 2.09:1.01:1:4.10, which is approximate CZTS stoichiometric ratio. Figure 4 shows the SEM micrographs of the sulfurized films. It seems that, when the bath pH value decreases from ∼6.0 (Figure 4a) to ∼5.0 (Figure 4b), small granules are agglomerated to be grains and the borders of grains are clear. When the pH value decreases from ∼5.0 to ∼4.0 (Figure 4d), the surface appears rough for the marked size difference between particles and there are pinholes on the film surface and some holes indicated by arrows in Figure 4d. The surface holes may be caused by gaseous form of substance, such as SnS. It indicates that sample S2 has better composition ratio and morphology than others.
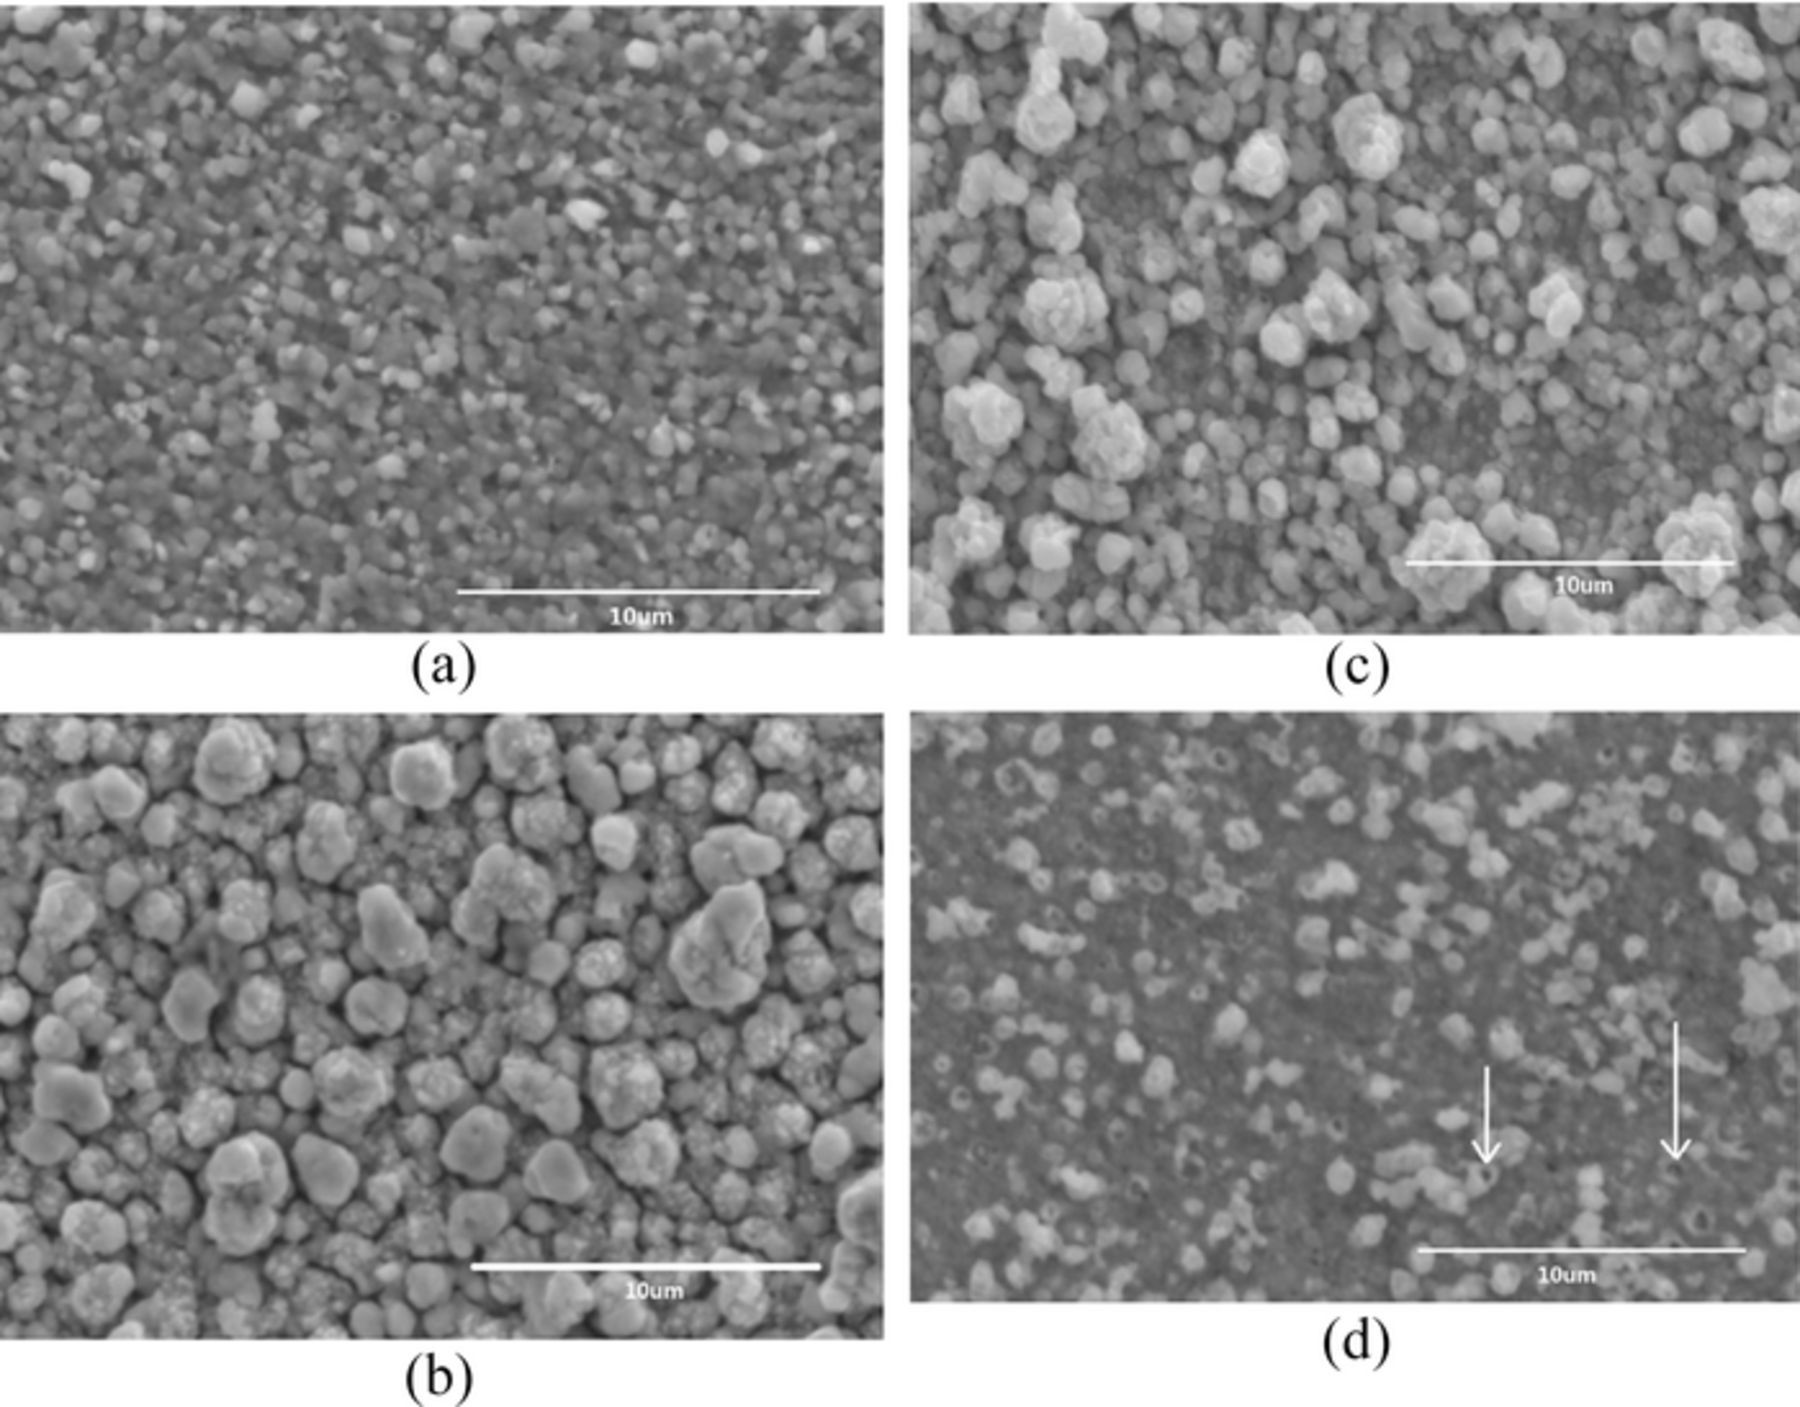
Figure 4. Surface SEM images of samples S1 (a), S2 (b), S3 (c) and S4 (d).
Optical and electrical characterization
The optical properties of the CZTS films were studied with transmission (T) and reflection (R) spectra measured by UV-VIS-NIR spectrophotometer at room temperature. The optical bandgap energy can be obtained using the following formula: 23
![Equation ([8])](https://content.cld.iop.org/journals/2162-8777/5/9/P521/revision1/d0008.gif)
where α is the optical absorption coefficient, A is a constant, Eg is the bandgap energy, and n = 2 for the direct bandgap. The optical bandgap energy is the intercept at the photon energy axis of the linear region extrapolation from the plot of (αhν)2 vs. photon energy (hν). The thicknesses of all the films are ∼ 500 nm. Figure 5 shows the plot of (αhν)2 versus hν for sample S2. The Eg of sample S2 is about 1.49 eV, which is in agreement with the result of its PL spectrum (Figure 6). The bandgaps of the CZTS films estimated from UV optical absorption and PL measurements are in the range of 1.40–1.60 eV and listed in Table III. The Eg of sample S4 is 1.60 eV, which may be caused by secondary phase SnS2 because the Eg of SnS2 is about 2.46 eV. And the data observed from optical estimation is an average of the overall sample. There is a difference of bandgap between optical estimation and PL, which is probably caused by the deviation of the linear region extrapolation, the presence of a conduction band to impurity radiative recombination channel and the inhomogeneity in the sample.24
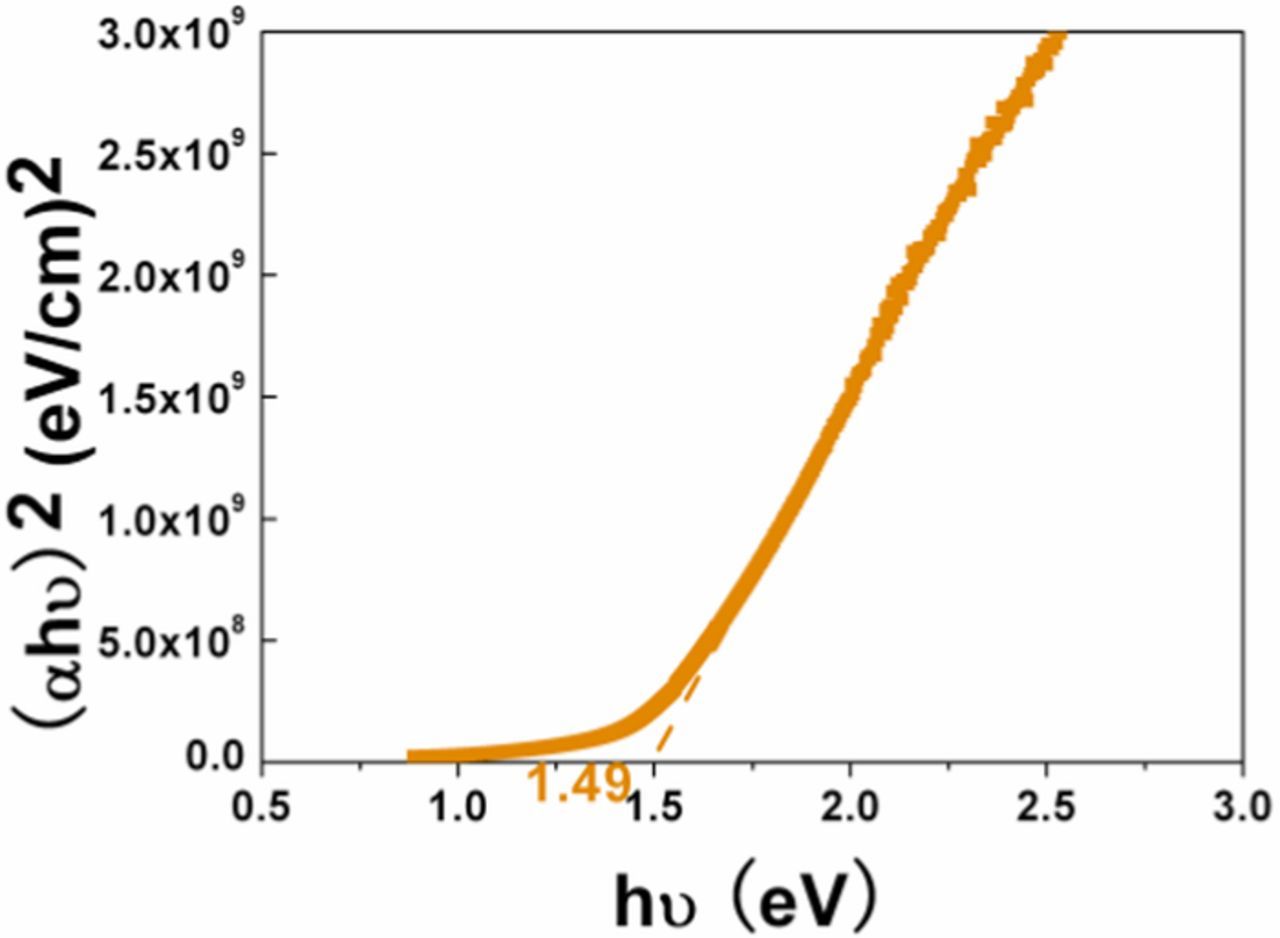
Figure 5. Plot of (αhν)2 vs. photon energy (hν) for sample S2.
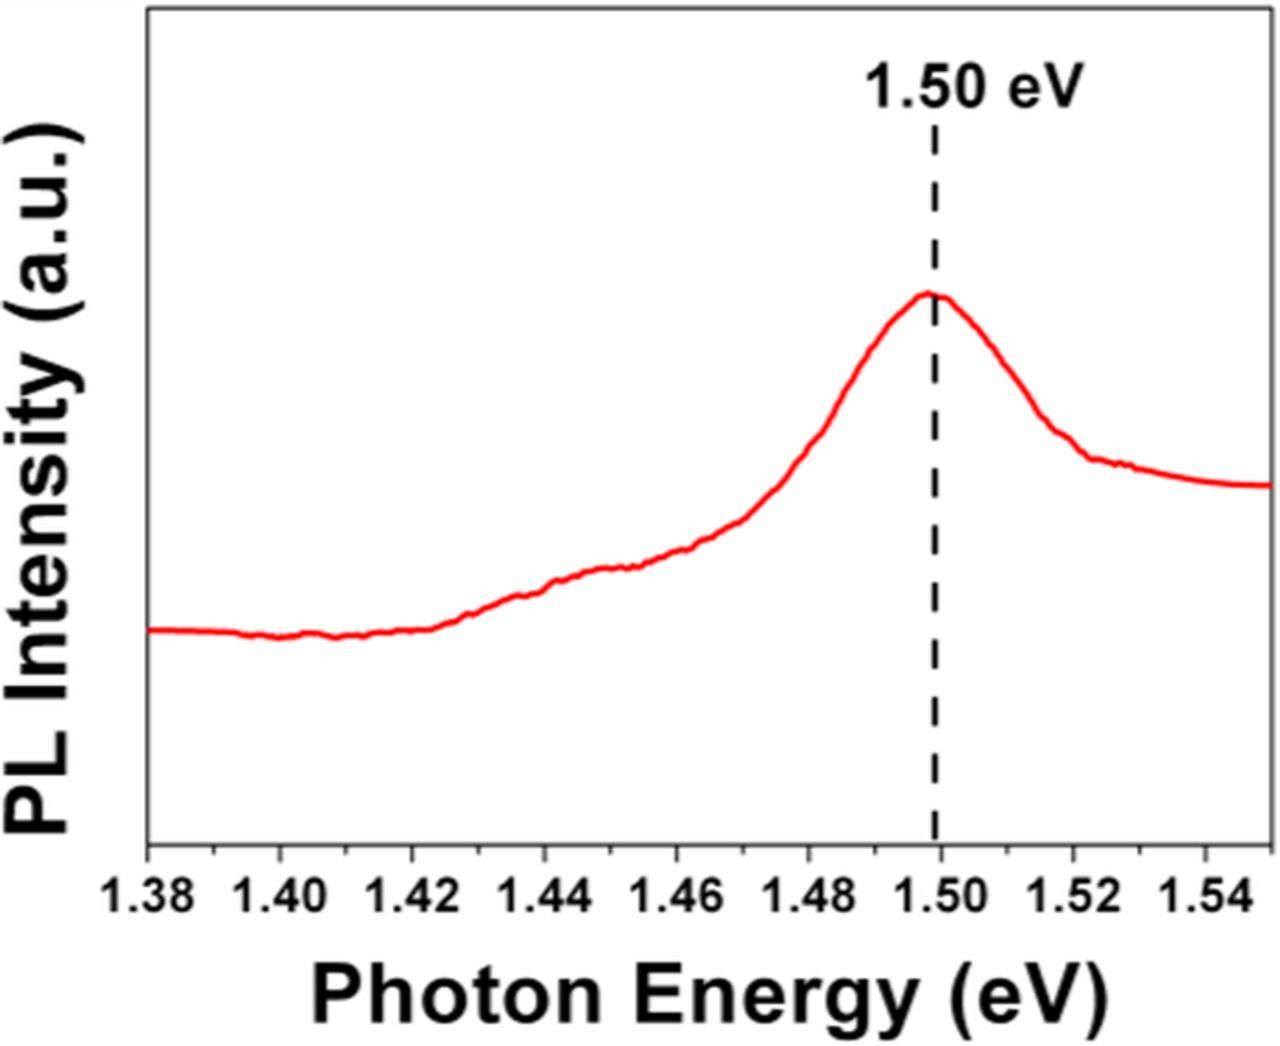
Figure 6. PL spectra of sample S2.
Table III. Bandgaps of the CZTS films.
| Sample No. | Bandgap estimated from UV optical absorption measurements (eV) | Bandgap estimated from PL measurements (eV) |
|---|---|---|
| S1 | 1.40 | 1.45 |
| S2 | 1.49 | 1.50 |
| S3 | 1.53 | 1.51 |
| S4 | 1.60 | 1.58 |
Figure 7 shows a Mott–Schottky plot of sample S2. A positive or negative slope indicates a n- or p-type semiconductor, respectively.25 The negative slope in Figure 7 further confirms that the CZTS film is of p-type conductivity, which is in good agreement with other report.25 The concentration of donors can be determined from the slope of the experimental 1/ C2 versus V plot as the following equation:
![Equation ([9])](https://content.cld.iop.org/journals/2162-8777/5/9/P521/revision1/d0009.gif)
where C is the space charge capacitance, ɛ is the dielectric constant of the CZTS film, ɛ0 is the permittivity of the free space, e is the electronic charge, A is the area of the measured sample and NA is the acceptor concentration. The carrier concentration of the CZTS film comes out to be ∼1021 cm−3, which is close to the reported value.26
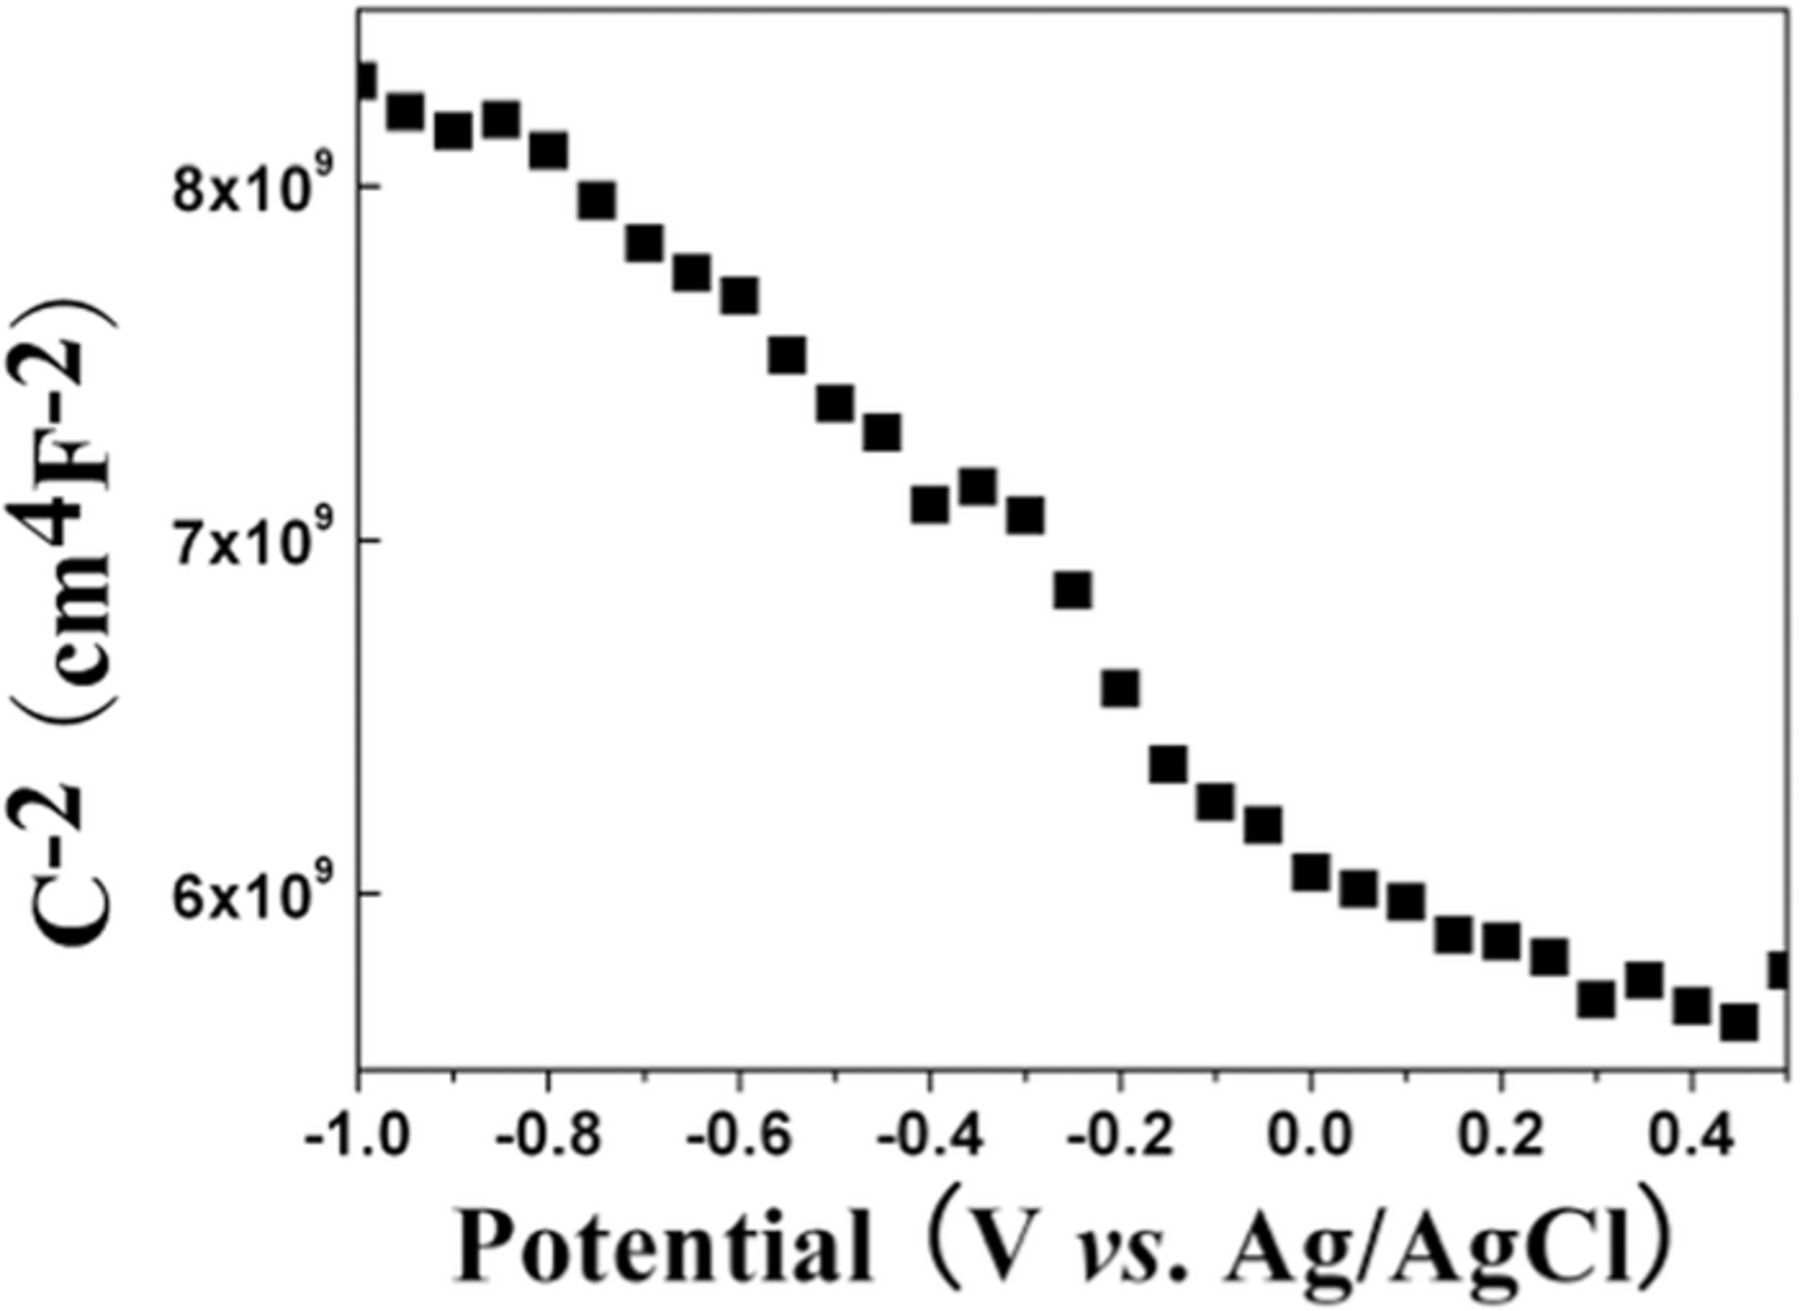
Figure 7. Mott-Schottky plot of sample S2.
Conclusions
CZTS thin films were prepared by one-step co-electrodeposition to investigate the dependence of the structural, compositional, morphological and optical properties at different solution pH values. The bath pH affects the reduction potentials of metal, which makes the element contents different. After annealing, the structure, composition, morphology and optical properties of the CZTS thin films are dissimilar. When pH is ∼5.0, the CZTS thin film shows prominent CZTS phase, compact morphology, p-type semiconductor and optical bandgap energy of 1.49 eV.
Acknowledgment
This work was supported by the National Nature Science Foundation of China (No. 61574038), Fujian Provincial Department of Science & Technology, China (No. 2015H0021) and Scientific Research Fund of Fujian Provincial Education Department, China (No. JA15092).