Abstract
This paper presents a two-dimensional (2D) computational model of a polymer electrolyte fuel cell (PEFC) with a platinum group metal-free (PGM-free) catalyst cathode that can significantly reduce PEFC costs by eliminating the need for expensive platinum catalysts. Due to their comparatively low volumetric activity, PGM-free cathodes are an order of magnitude thicker than their Pt-based counterpart. The resulting need for greater electrode thickness to achieve sufficient power density requires careful attention to the transport losses across the thicker cathodes. The presented model is used to correlate the composition and morphology of the cathode to PEFC performance. The model is a complete cell, continuum model that includes an advanced agglomerate model for a microstructurally consistent representation of the cathode. A unique feature of the approach is the integration of morphology and transport parameter statistics extracted from nano-scale resolution X-ray computed tomography (nano-CT) imaging of PGM-free cathodes. The model was validated with experimental results of PGM-free cathodes with varying Nafion loading. Our key findings are a need for increased cathode hydrophobicity and increased ionomer conductivity through either reduced tortuosity or increased bulk conductivity. We further use the model to evaluate targets for the volumetric activity and active site density for future catalysts.
Export citation and abstract BibTeX RIS

This is an open access article distributed under the terms of the Creative Commons Attribution 4.0 License (CC BY, http://creativecommons.org/licenses/by/4.0/), which permits unrestricted reuse of the work in any medium, provided the original work is properly cited.
Vehicle electrification can substantially reduce the CO2 emissions compared to using internal combustion engines. Electric vehicles using polymer electrolyte fuel cells (PEFCs) are efficient and offer quick refueling and long ranges. PEFCs commonly use platinum (Pt) or Pt-alloys catalyst supported on a high surface area carbon (Pt/C catalyst) for low-temperature oxygen reduction reaction (ORR) in acidic media.1 State of the art PEFCs typically have Pt loadings of 0.3 mgPtcm−2, which is the main contributor to the estimated stack cost of $55/kW and significantly greater than the US Department of Energy's target of $30/kW.2 Thus, cost reductions for the broader commercialization of PEFCs requires a dramatic reduction in Pt loading while still achieving power density and durability targets.
To alleviate the Pt cost burden, there has been a significant effort dedicated to improving Pt utilization to reduce loading as well as to use alternative Pt group metal-free (PGM-free) catalysts.3,4 Metal-chelated transitional metal (M-N4) macrocyclic catalysts have shown promise for oxygen reduction reaction (ORR) and the potential to compete with Pt. The active site is believed to be associated with pyridinic nitrogen group coordinated with a transitional metal such as iron (Fe).5–8 Several research groups have recently reported significant improvements in activity by increasing the carbon support surface area, which increases the active site density.9–11 Despite the recent progress, the lower turnover frequency (TOF) of the PGM-free active sites and corresponding lower volumetric activity requires cathodes that are approximately one order of magnitude thicker than commercial Pt or Pt-alloy cathodes. Greater cathode thickness leads to increased oxygen as well as proton transport resistances and underutilization of the catalyst. Thus, PGM-free cathode design must carefully consider transport losses.
Currently, the electrochemical testing of the PGM-free catalysts is most commonly done through rotating disk electrode (RDE) and rotating ring disk electrode (RRDE) measurements, with promising materials later evaluated in PEFCs. Although RDE and RRDE studies are helpful in understating the kinetic performance of PGM-free catalysts, they unfortuantely do not represent the signficant transport challenges of fuel cell operation. At present, there is an unclear understanding of the PGM-free catalyst utilization as there is scarcity in work toward estimation of the TOF and active site density. Only recently there has been work on characterizing TOF and active site density using ex-situ12 and in-situ13 techniques. As the performance of these catalysts continues to improve, the impact of transport will increasingly confound evaluating the catalyst's intrinsic performance. Thus, it is increasingly important to understand the relationships between the active site properties, the electrode morphology, and the fuel cell performance.
PGM-free cathode composition and morphology has a significant impact on performance. Prior research work has shown the effect of the catalyst layer architecture and ionomer distribution on the performance of the cathode.14–17 In this paper, we characterize the PGM-free cathode based on Los Alamos National Laboratory's (LANL's) cyanamide-polyaniline-iron salt (CM-PANI-Fe) precursor based catalyst. We previously characterized the morphology and transport properties of CM-PANI-Fe cathodes with varying Nafion loadings by nanoscale resolution X-ray computed tomography (nano-CT) and evaluated their morphological and transport properties.18 These PGM-free cathodes have a hierarchical morphology, i.e., characteristic features at two different length scales. There are large dense aggregate particles (500 nm – 10 μm) of the PGM-free catalyst with Nafion binder surrounded by large macropores. The dense aggregates are themselves porous with what we will refer to here as micropores (< 500 nm). The terminology of micropore and macropore used here to describe the hierarchical pore domain is mainly for clarity in the discussions despite not being consistent with the more formal definitions. The electrodes were imaged using nano-CT in multi-resolution, multi-contrast imaging modes to resolve different domain (catalyst, ionomer, and pore) features at the two different length scales. Zernike phase contrast imaging was at two different resolution modes was done to resolve the solid and pores at large and small length-scales. First, large field of view (LFOV) imaging resolved the large dense particles and the macropores. Second, high resolution (HRES) imaged resolved the interior of the dense aggregates and the micropores. Spatial ionomer distributions were obtained by ion-exchanging the protons in the ionomer with higher X-ray attenuating cesium ions. The 35 wt% loading cathode had non-uniform distribution and lower infiltration of the ionomer into the micropores, which resulted in higher activation losses seen in the polarization curve performance. The 50 and 60 wt% Nafion loading cathode had a uniform distribution inside the micropores and hence has a lower activation loss but has an increased mass transport loss. The sensitivity of the ionomer loading on transport properties in the cathode was also characterized using pore-scale and particle-scale transport simulation. That morphological analysis and transport property is used herein to inform the model parameters.
The progress in macro-homogeneous continuum scale models for PEFCs has improved significantly in the past two decades.19 Computational models have been an invaluable tool in the critical understanding of the phenomena that occurs inside the fuel cell that cannot be easily understood or resolved through experiments. The catalyst layer (CL) is typically the most complex component to model because of the coupling between mass and charge transport and the ORR.19–22 Hence, CL requires a highly detailed physical model to capture the phenomena occurring in it accurately. CL is commonly modeled as an interface23 or discrete volume model24 or an agglomerate model.25 As an example, Sun et al.25 refined the PEFC agglomerate model, an analytical solution to the coupled diffusion and reaction in an ideal spherical agglomerate, to include transport through external ionomer films. The prior agglomerate-type models generally use a single average representative diameter,25 or has been implemented with a spatial gradient of diameter26 and different sub-layers with each sub-layer represented by a single diameter.27 Epting et al.28 showed that there is a broad distribution of agglomerate diameters that contribute varying amounts of current on a volumetric basis. Depending on the Thiele modulus (ratio of reaction rate to diffusion rate), assuming a single diameter can incur significant, potential dependent error. At high overpotentials (higher current), the contribution from smaller agglomerates is greater because of the shorter diffusion length-scales, while at low overpotential agglomerates of all diameters contribute similarly as the reaction is activation limited. In the prior catalyst layer modeling work, very few models exist for thick electrodes and PGM-free electrodes, with notable exception being macrohomogeneous CL modeling by Leonard et al.29 That work reported important insights into the impact of through-plane transport on PGM-free cathodes, but did not directly relate that to actual electrode architectures beyond pore size distributions or account for local oxygen transport resistance within the cathode microstructure.
In this work, we focus on the effects of the hierarhial cathode microstructure as directly extracted for 3D nano-CT imaging of the pore, solid, and ionomer phases. Figure 1 shows the implementation of the hierarchical morphology of the PGM-free cathode in this model. The large dense catalyst aggregates imaged from LFOV is used to define the agglomerate and the macropore structure as shown in Figure 1. The HRES imaging of the dense aggregates is used to define the internal morphology of the agglomerates. The transport through the PGM-free electrode was modeled as parallel transport via micropore and macropore domains. We model the spatially distributed reaction in the dense aggregates using the agglomerate model with a distribution of the agglomerates diameter extracted from our prior nano-CT imaging.18 Effective diffusivities in the micropores was obtained from our prior pore-scale simulation on the internal pore morphology from the HRES nano-CT. The proton conductivity, volume fraction and the tortuosity of the Nafion binder are obtained from the prior particle scale simulation on the Nafion domain.
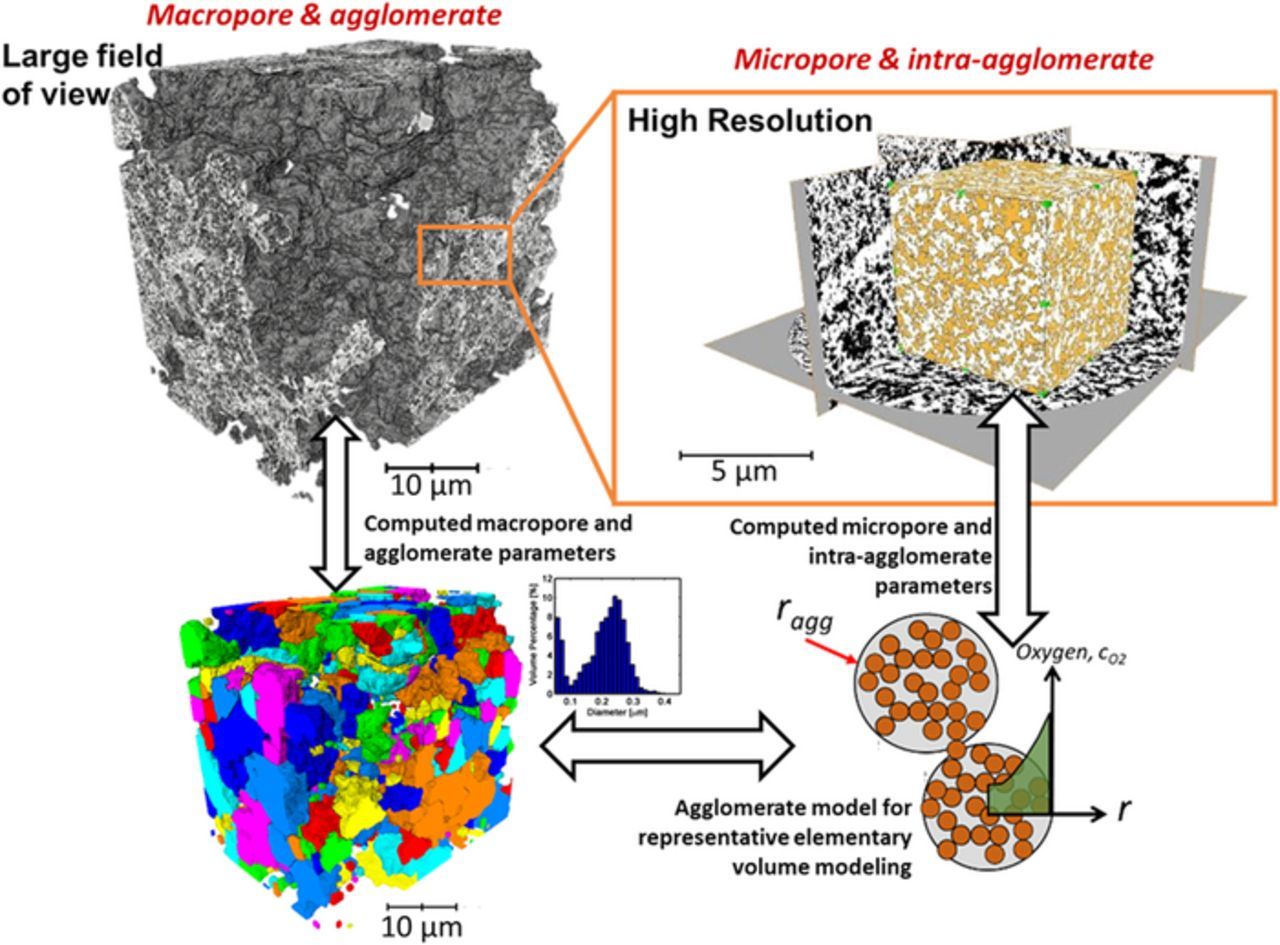
Figure 1. Hierarchical morphology PGM-free electrode model. The macropores and large dense agglomerates are imaged with LFOV scan, while HRES imaging resolves the internal morphology of denser porous solid domains. The morphology and transport properties extracted from both the scans are implemented into an agglomerate model used for representative elementary volume modeling.
In the present analysis, we use two-dimensional computational model of the channel cross-section to understand the relationships between the cathode morphology and the electrochemical performance of the PGM-free cathode with varying Nafion loadings examined in experiments. We go on to validate the model with those same experiments. Following validation, we present a sensitivity analysis of the cathode performance to morphological and operating condition parameters. The model is then used to evaluate synthesis targets for PGM-free catalyst active site TOF and site density for power density requirements. Finally, we investigate the with impact of cathode morphology for hypothetical catalysts with higher activity or active site density.
Models Description
This section describes the governing equations and the framework of our model. The model is two-dimensional land-channel cross-section and resolves multi-phase water transport. Figure 2 shows the geometry of different domains and the parameters being modeled. The model domains include land, channel, gas diffusion layer (GDL), microporous layer (MPL), anode catalyst layer (ACL), cathode catalyst layer (CCL), and membrane (MEM). Gas and liquid transport are modeled in the porous media (PM) which include the GDL, MPL, and the CL. In addition to modeling water vapor and liquid water, a separate water phase dissolved in the MEM and CLs' Nafion is considered. Table I describes the geometry and dimensions of the different domains as well the material properties. Table I also indicates the various phases associated with each domain. The governing equations conserved and the source terms are represented in Tables II and III. Table IV lists the correlations and equations used for the model parameters.
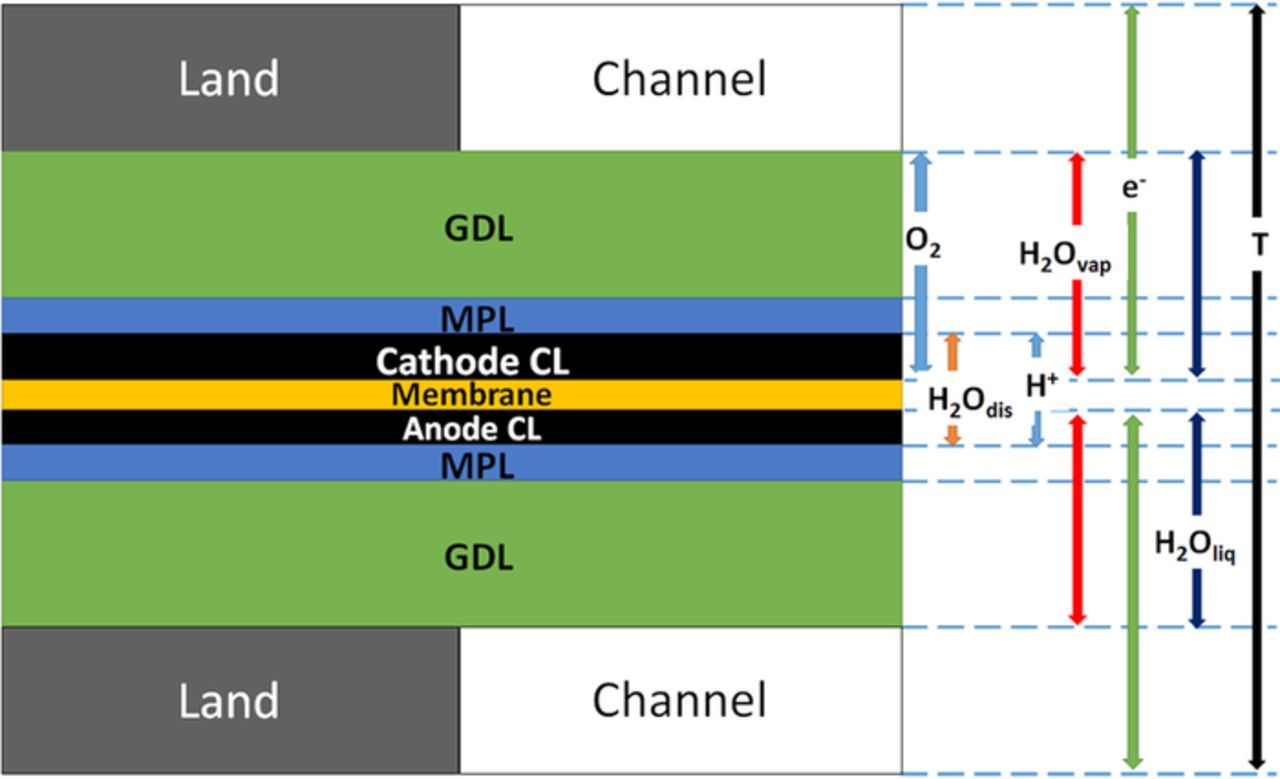
Figure 2. 2D land channel cross-sectional sandwich model domain and the species associated with each domain.
Table I. Model domain dimensions and the phases in each domain.
| Thickness | Length | ||||
|---|---|---|---|---|---|
| Domain | Phases | [μm] | [μm] | Material | |
| Land | T | 200 | 500 | Graphite | |
| GDL | G, L, T | 190 | 1000 | SGL 24 BC | |
| MPL | G, L, T | 45 | 1000 | SGL 24 BC | |
| Anode CL | G, L, DW, T | 25 | 1000 | Pt/C | |
| Membrane | DW | 25 | 1000 | Nafion 211 | |
| Cathode CL | 35 wt % | G, L, T, DW | 80 | 1000 | Present work |
| 50 wt % | 100 | ||||
| 60 wt % | 120 |
Table II. Governing equations and the domains they are modeled.
| Species | Domain | Governing equation | |
|---|---|---|---|
Ionic potential,  |
ACL, MEM, CCL |  |
[27] |
Electric potential,  |
GDL, MPL, ACL, CCL |  |
[28] |
| Gas species concentration, ci | GDL, MPL, ACL, CCL | ∇.( − Deffi∇ci) + u.∇ci = Srxni + Sphasei + SiDW | [29] |
| Gas flux, Ni | GDL, MPL, ACL, CCL | Ni = −Deffi∇ci + uci | [30] |
| Dissolved water concentration, cDW | ACL, MEM, CCL |  |
[31] |
| Dissolved water flux, NDW | ACL, MEM, CCL | NDW = −DeffDW∇cDW | [32] |
| Gas pressure, pG | GDL, MPL, ACL, CCL |  |
[33] |
| Liquid pressure, pL | GDL, MPL, ACL, CCL |  |
[34] |
| Temperature, T | GDL, MPL, ACL, CCL, Land, MEM | ρiCp, iu.∇T + ∇.( − keffT, i∇T) = Srxni + Sphasei + Sijoule | [35] |
Table III. Source terms for the governing equations.
| Domain | |||||||
|---|---|---|---|---|---|---|---|
| Source Term | Land | GDL | MPL | ACL | CCL | MEM | |
| Ionic, Srxni | iHOR | − iORR | |||||
| Electric, Srxni | − iHOR | iORR | |||||
| Oxygen, Srxni |  |
||||||
| Hydrogen, Srxni |  |
||||||
| Water Vapor | Srxni |  |
|||||
| Sphasei | Rphase | Rphase | Rphase | Rphase | |||
| SDWi | RAD | RAD | |||||
| Dissolved Water, SDWi | − RAD | − RAD | |||||
| Gas Pressure | Srxni |  |
 |
||||
| Sphasei | Rphase | Rphase | Rphase | Rphase | |||
| SDWi | RAD | RAD | |||||
| Liquid Pressure, Sphasei | − RAD | − RAD | − RAD | − RAD | |||
| Temperature | Srxni | iHORηanode | iORR(ηcathode + Π) | ||||
| Sphasei | − ΔHfgRphase | − ΔHfgRphase | − ΔHfgRphase − 43740RAD | ||||
| Sjoulei |  |
 |
 |
 |
 |
||
Table IV. Model parameter equations.
| Parameter | Governing equation | |
|---|---|---|
| Energy | ||
| Effective thermal conductivity, keffi | keffi = (1 − εi)ksolidi + εi(sikliquidi + (1 − si)kgasi) | [36] |
| Gas and Liquid transport | ||
| Diffusion coefficient, Dij |  |
[37] |
| Saturation, s |  |
[38] |
Rate of Evaporation,  |
 |
[39] |
| Rate of condensation, Rcond |  |
[40] |
| Saturation Pressure, Psat | Psat = −2864.4 + 411.24(T − 273) − 10.554(T − 273)2 + 0.16636(T − 273)3 | [41] |
| Ionomer Water and Proton transport | ||
Proton Conductivity,  |
 |
[42] |
| σ303Kl = −7.577 × 10− 5λ4 + 4.24 × 10− 3λ3 − 8.415 × 10− 2λ2 + 1.138λ − 2.012 | [43] | |
| Water Diffusion Coefficient, DDW |  |
[44] |
| Ionomer equilibrated water, λeq | λeq = 0.043 + 17.81φ − 39.85φ2 + 36φ3 + (22 − 14)s | [45] |
 |
[46] | |
| Adsorption / Desoprtion rate |  |
[47] |
 |
[48] | |
| Reaction Kinetics | ||
| Overpotential, η |  |
[49] |
 |
[50] | |
Open circuit potential,  |
 |
[51] |
| Effectiveness factor, Ei |  |
[52] |
| Thiele modulus, ϕi |  |
[53] |
| Henry's constant, H |  |
[54] |
Diffusion coefficient in Nafion,  |
 |
[55] |
| Agglomerate per unit volume, aiagg |  |
[56] |
Gas and liquid water transport
Mass and momentum are conserved in the PM for oxygen, and water vapor using Fick's law and Darcy's law shown in Eq. 29, Eq. 30 and Eq. 33. Liquid water is also modeled in the PM using Darcy's law (Eq. 34). In general, The effective diffusion coefficients, Deffjk, i, are calculated as shown below:
![Equation ([1])](https://content.cld.iop.org/journals/1945-7111/164/9/F1037/revision1/d0001.gif)
where τi is the tortuosity of the domain i and Djk is the molecular diffusion coefficient of species j in k. For GDL and MPL, the diffusion coefficient, Djk, is calculated using Eq. 37, while for CCL domain diffusion coefficient is calculated to represent the hierarchical morphology. In Eq. 37 PC, j, TC, j and Mj are critical pressure, critical temperature and molecular weight of species j.
In our hierarchical model of the cathode, the effective diffusion coefficient used in Eq. 29 is calculated as combination of the diffusivities in the macro- and micro-pore
![Equation ([2])](https://content.cld.iop.org/journals/1945-7111/164/9/F1037/revision1/d0002.gif)
where D is diffusion coefficient and ε is pore volume fraction. The subscripts micro and macro refer to the micropore and the macropore domains, respectively. The results of our prior pore-scale simulations on high resolution nano-CT images18 are used for the effective O2 diffusion coefficient inside the agglomerates, Deffmicro. In that modeling, we used local pores diffusion coefficients estimated using the Bosanquet formulation for Knudsen transition-regime diffusion. For the larger macropores, Knudsen diffusion is neglected as the pore sizes are generally in the range of 1 μm and larger.
The effective gas permeability, keffi, is a product of the saturated permeability ksati and the relative permeability, kreli.
![Equation ([3])](https://content.cld.iop.org/journals/1945-7111/164/9/F1037/revision1/d0003.gif)
The relative permeability is dependent on the saturation of the porous media. Here we use the common used cubic dependence relative permeability on saturation, s; for gas is kreli = si3 for liquid and kreli = (1 − si)3 for gas. The saturated permeability is obtained using Carman-Kozeny relationship30 using representative diameters including those from the nano-CT imaging of the cathodes. The effective permeability for the CCL used in Eqs. 33 and [34] are evaluated using the same form of expression as Eq. 2, but with permeability instead of effective diffusivity parameters. The transport properties in both the micropores and macropores are separately corrected as a function of saturation in each distinct pore size distribution.
The saturation in each domain is determined by Van Genuchten water retention curve model31,32 (Eq. 38) that relates the saturation to capillary pressure, pc, defined as
![Equation ([4])](https://content.cld.iop.org/journals/1945-7111/164/9/F1037/revision1/d0004.gif)
where nw and w are representing non-wetting and wetting phase. The saturations are separately computed in the cathode for the micropore and macropore domains. The pore size distribution obtained from the nano-CT imaging is used to fit a log-normal distribution to obtain a relation between the capillary pressure and saturation.33 The Van Genuchten fitting parameters pCB, n and m for GDL and MPL are reported in Supplementary Table S1. Both the micropore and macropore is assumed to be hydrophilic because of Nafion and the graphitized carbon in the electrode. Therefore, with increasing liquid water saturation, the micropores fill first and the liquid water fills the macropores.18 The water retention curve for the CL is shown in Supplementary Figure S3.
The effective saturation used for estimating relative permeability are corrected for the residual saturations, sres, that we assume are equal to 0.1:
![Equation ([5])](https://content.cld.iop.org/journals/1945-7111/164/9/F1037/revision1/d0005.gif)
The water condensation and evaporation are implemented as source terms in Eqs. 29, 33 and 34. The rate of phase change in domain i is represented as
![Equation ([6])](https://content.cld.iop.org/journals/1945-7111/164/9/F1037/revision1/d0006.gif)
where Revapi and Rcondi is the rate if evaporation and condensation respectively as is shown in Eq. 39 and Eq. 40. In both the rate equations, psat is the saturation pressure (Eq. 41) and switch is a mathematical operator defined as
![Equation ([7])](https://content.cld.iop.org/journals/1945-7111/164/9/F1037/revision1/d0007.gif)
Heat transfer
The temperature is obtained by solving energy balance in Eq. 35. Sources of heat include the electrochemical reactions, latent heat of condensation and evaporation, adsorption or desorption of water dissolved in Nafion, and Joule heating due to proton and electron conduction. The effective thermal conductivities, keffT, i, in the PM are estimated from volume averaged mixtures of the solid and fluid thermal conductivities as shown in Eq. 36.
Ionomer transport
Proton and ionomer dissolved water are modeled in the membrane domain and CLs' ionomer binder using Eq. 27 and Eq. 31. The proton conductivity correlation in Eq. 42 includes both water vapor and liquid equilibrated states. The proton conductivity of the CLs is corrected using the equation:
![Equation ([8])](https://content.cld.iop.org/journals/1945-7111/164/9/F1037/revision1/d0008.gif)
where εi and τi are the volume fraction and the tortuosity of the Nafion respectively in the domain i. The value of the volume fraction and the tortuosity in the membrane is 1, while these parameters for the cathode are obtained from the nano-CT image analysis (Table S2)18 or parametrically varied.
Our correlation for the diffusion coefficient of the absorbed water (Eq. 44) is a fit to the data of Zawodzinski et al.34 and is implemented as a continuously differentiable correlation for improved implementation in the computational model. The exchange of water between the vapor and dissolved Nafion phases is implemented as a source term as shown below
![Equation ([9])](https://content.cld.iop.org/journals/1945-7111/164/9/F1037/revision1/d0009.gif)
where λeq is membrane equilibrated water (Eq. 45) that depends on water vapor partial pressure in the gas phase, v is sulphonic acid site density in Nafion, and hAD is the rate of absorption or desorption (Eq. 47).35
Catalyst layers
The ACL is considered to be a Pt/C electrode and the HOR is modeled using the Butler-Volmer equation as a rough approximation:
![Equation ([10])](https://content.cld.iop.org/journals/1945-7111/164/9/F1037/revision1/d0010.gif)
where irefHOR is the reference exchange current density, aPt is the electrochemically active Pt surface area in the anode and α is the charge transfer coefficient. The anode overpotential, ηa (Eq. 49), is the potential difference between Pt and Nafion assuming a reversible potential of zero.
To model the PGM-free CCL, the agglomerate model is used to resolve coupling between oxygen diffusion and the ORR within an idealized spherical agglomerate with a closed-form, analytical expression.25 The advantage of the agglomerate model is that it captures transport losses within the microstructure implicitly without have to directly model the agglomerate transport. Following the work of Epting et al.,28 the current density for a size distribution with N bins of diameter is
![Equation ([11])](https://content.cld.iop.org/journals/1945-7111/164/9/F1037/revision1/d0011.gif)
and the effective current density is a summation of all the diameter weighted by the volume fraction. Figure S1 shows the distribution of the agglomerate diameter obtained from nano-CT for three different Nafion loadings. The effectiveness factor, Eir (Eq. 52), is the ratio of actual reaction rate to the ideal reaction rate and depends on the agglomerate's Thiele modulus, ϕi (Eq. 53) that represents the ratio of the diffusion rate to reaction rate and is a function of the agglomerate radius, riagg. It should be noted that the agglomerate model assumes a spherical agglomerate, however in reality the agglomerates are non-sperical as observed using nano-CT. Instead of the conventional inscribed sphere method to estimate the diameter from CT images, we have utilized the ratio of volume to surface (d = 6 V/A) and the effective diffusion coefficient is estimated from the high-resolution nano-CT images of the agglomerates via computational modeling.18 In Eq. 11, F,H and  represent Faraday's constant, Henry's constant (Eq. 54) and partial pressure of oxygen respectively. fi and aiagg are the volume fraction and agglomerate surface area per unit volume, respectively, for an agglomerate with radius riagg. Furthermore, δ is the Nafion film thickness,
  (Eq. 55) is the diffusivity of O2 in the Nafion, and εagg is the electrode's volume fraction of agglomerates not including ionomer film. In Thiele modulus, the effective diffusion in the agglomerate,
  , is corrected for the saturation in the micropore as follows
![Equation ([12])](https://content.cld.iop.org/journals/1945-7111/164/9/F1037/revision1/d0012.gif)
where smicroand  is the saturation and diffusion coefficient in the micropore respectively.
In Eqs. 11 and 53 kc is the ORR rate constant defined using a Butler-Volmer equation modified for PGM-free catalyst modeling:
![Equation ([13])](https://content.cld.iop.org/journals/1945-7111/164/9/F1037/revision1/d0013.gif)
In this approach, we have replaced the typical volumetric exchange current density with RsJs, which is the electrochemically active site density of the cathode multiplied by activity per site. The parameter  is the reference oxygen concentration for the RsJs estimation, αc is the cathodic charge transfer coefficient, and ηc(Eq. 50) is the representative local cathode overpotential.
Boundary conditions
The flux of protons is zero at the MPL|CL interface and is represented as below
![Equation ([14])](https://content.cld.iop.org/journals/1945-7111/164/9/F1037/revision1/d0014.gif)
The electric potential on the anode plate is set to the 0 V, while the cathode plate potential is set to the fuel cell voltage, VFC. To generate the polarization curve VFC is varied from 1 V to 0.8 V in 0.02 V steps and 0.8 to 0.2 V in steps of 0.05 V.
![Equation ([15])](https://content.cld.iop.org/journals/1945-7111/164/9/F1037/revision1/d0015.gif)
The relative humidity of both anode and cathode gas feeds are at 100% unless specified. The water vapor concentration at the channel|GDL interface is:
![Equation ([16])](https://content.cld.iop.org/journals/1945-7111/164/9/F1037/revision1/d0016.gif)
Similarly, the oxygen concentration at the channel|GDL is set as:
![Equation ([17])](https://content.cld.iop.org/journals/1945-7111/164/9/F1037/revision1/d0017.gif)
where χ = 0.21 if the cathode feed is air and χ = 1 for pure O2 cathode feed. The flux of gas species across the membrane is zero.
![Equation ([18])](https://content.cld.iop.org/journals/1945-7111/164/9/F1037/revision1/d0018.gif)
Nafion dissolved water flux at the CL|MPL interface is set to zero.
![Equation ([19])](https://content.cld.iop.org/journals/1945-7111/164/9/F1037/revision1/d0019.gif)
The gas channel pressure is set to the feed pressure and liquid pressure at the channel|GDL interface is set such that the capillary pressure corresponds to a saturation of 0.0025.
![Equation ([20])](https://content.cld.iop.org/journals/1945-7111/164/9/F1037/revision1/d0020.gif)
![Equation ([21])](https://content.cld.iop.org/journals/1945-7111/164/9/F1037/revision1/d0021.gif)
For thermal modeling, the temperatures at the outer surfaces at the top and bottom of the land domains was set to the fuel cell temperature:
![Equation ([22])](https://content.cld.iop.org/journals/1945-7111/164/9/F1037/revision1/d0022.gif)
A convection boundary condition was applied at the channel interface with the land and the GDL:
![Equation ([23])](https://content.cld.iop.org/journals/1945-7111/164/9/F1037/revision1/d0023.gif)
where hA, C is the convective heat transfer coefficient and Tgas is temperature of the gas feeds.
Numerical method
Charge, mass and energy conservation are modeled using second order discretization in commercial FEM package (COMSOL Multiphysics v5.1, Comsol Inc., Burlington, MA). The model was run in steady state condition. The potentiostatic parametric sweep was run in COMSOL interface, while the results were exported through MATLAB (Mathworks, Natick, MA). The mesh generated had 34400 triangular elements. The mesh density is higher in the both the CL and membrane domain. The density of mesh is also higher at the CL|MPL and CL|MEM interface.
Results and Discussion
Base case
This section discusses the baseline scenario for validation of the model. The experimental data of the CM-PANI-Fe electrodes with the 35, 50, and 60 wt% Nafion loading was presented previously by Zelenay et al.36 Figure 3 presents both the experimental and model results for CM-PANI-Fe with 35 wt% Nafion loading with different pure O2 partial pressures. The current density at 0.8 V for the 2 atm partial pressure case was matched between the experimental and model results to fit the RsJs parameter. Comparing with the estimated value of RsJs from the model to the experimental estimation from TOF and active site density by Sahraie et al.12 has an agreement within a factor of 2, which is reasonably good agreement considering the present challenges in estimating active site properties of PGM-free catalysts. The calculation of this comparison is shown in the supplemental material. In Figure 3, for the 0.3 and 1 atm partial pressure cases the fit parameter, RsJs, was not modified and the polarization curve from the model shows an excellent agreement with the experimental data. This agreement with pure O2 indicates that the kinetic parameters and the oxygen partial pressure dependence are well approximated by the model.
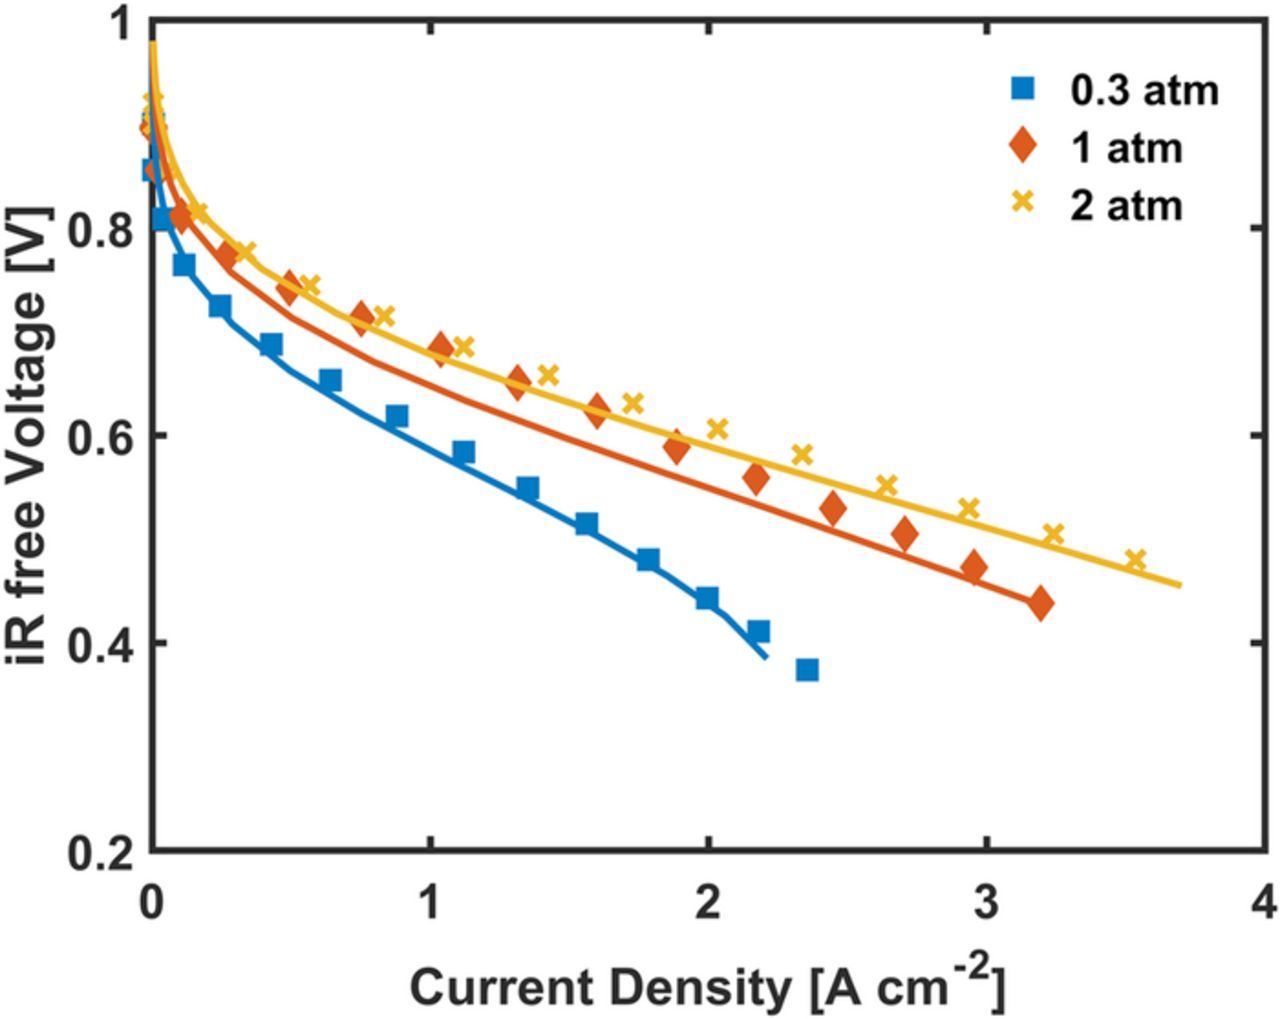
Figure 3. Polarization curves for the CM-PANI-Fe with 35 wt% Nafion loading cathode when operated on O2. The symbols are for experimental results36 and the line represents the model results. The simulation parameters match the experimental conditions of an 80°C cell temperature and 100% RH feed of H2/O2 in anode/cathode.
Figure 4 shows the model prediction for CM-PANI-Fe cathode with varying Nafion loading with air as the cathode feed gas. Table V lists the morphological and transport parameters that were changed. In addition, properties computed from the pore and agglomerate size distributions presented in the supplemental information were also updated for each cathode. For the 35 wt% loading, the value of RsJs was not varied from the prior pure O2 study. Due to the difference in activity observed in higher Nafion loading owing to improved Nafion distribution within the agglomerates,18 the RsJs, parameter was refit at 0.8 V for the 50 and 60 wt% loading cathode. In other words, the the RsJs parameter was modified to account for the fraction of catalyst that was electrochemically active. In our prior work, we showed evidence of the lower activity of the 35% wt Nafion electrode being due to agglomeration of the Nafion in the macropores and minimal intrusion of the Nafion into the agglomerates. No other parameters were fitted beyond the RsJs parameter and all other parameter changes are those extracted from the morphological and transport analyses of the nano-CT images.
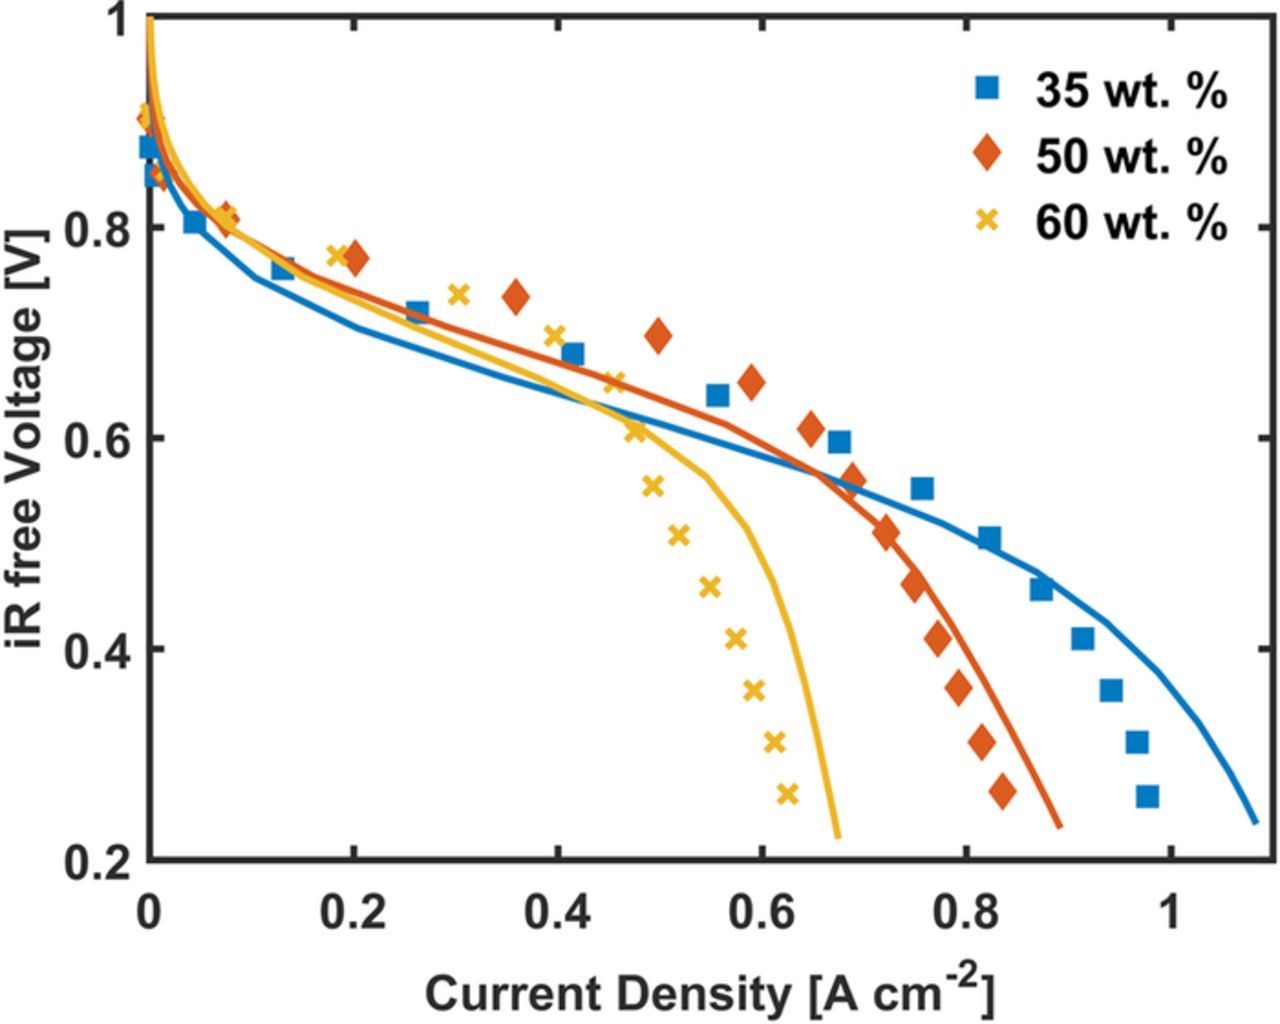
Figure 4. Experimental and model polarization curves for CM-PANI-Fe cathodes with 35, 50, and 60 wt% Nafion loading. The cell was operated at 80°C with air and H2 both at 100% relative humidity and 1 atm. The symbols are for experimental results36 and the line represents the model results.
Table V. Morphological and transport parameters for the CCL.
| Nafion loading | |||
|---|---|---|---|
| Property | 35 wt % | 50 wt % | 60 wt % |
| CL porosity | 0.68 | 0.58 | 0.57 |
| Micropore domain porosity | 0.47 | 0.49 | 0.46 |
| Macropore domain porosity | 0.4 | 0.17 | 0.21 |
| Nafion film thickness, δ | 0 | 0 | 230 nm |
| Volumetric active site activity, RsJs | 101 A m−3 | 142 A m−3 | 232 A m−3 |
| Effective proton conductivity | 0.75 S m−1 | 0.73 S m−1 | 1.66 S m−1 |
| Micropore diffusion coefficient, Deffmicro | 1.9 × 10⁻⁹ m/s | 2.0 × 10⁻⁹ m/s | 1.7 × 10⁻⁹ m/s |
As Figure 4 shows, the model captures well the change in the polarization curves with varying Nafion loading. In both the O2 and air case, the model prediction of the current density in the ohmic region is lower than the experimental values. This is likely due to the model being a steady-state approximation, where the experimental result is a transient process. Thus, the model evaluates the inifinite time water saturation at these low currents, which is likely higher than one would encounted in experiments. Nevertheless, the differences in the approximate limiting current with Nafion loading are well captured.
To understand the differences between the polarization curves with varying Nafion loading, we investigate the spatial distributions of properties predicted in the cathode to resolve the underlying sources of the mass transport resistance. First, we note that the model predicts effectiveness factors close to one in all cases, which means the agglomerate-level transport has only a minor effect when considering the present PGM-free catalyst activity. In addition, the 50 wt% case does not feature a Nafion film in order to be consistent with our prior nano-CT imaging of the Nafion domain.18 Thus, the origin of the losses is related to the through-plane transport across the cathode thickness rather than local microstructure. Figure 5a shows the liquid water saturation for the 50 wt% Nafion loading electrode at 0.4 V. The hydrophilic CCL is completely flooded at high current densities and reached the upper limit of 0.9, which is reduced from 1 by the residual gas saturation of 0.1. Figure 5b shows the corresponding O2 distribution that shows a sharp decline in oxygen concentration due to the low effective diffusivity of the flooded pores. Because of the very low oxygen concentration near the membrane, the ORR is inhibited and the region of Peak ORR current density is found approximately one third of the way into the cathode away from the membrane and underneath the channel (see Figure 5c). Since the reaction is primarily occurring 20–40 μm away from the membrane, protons must be conducted over a longer distance, resulting in large ohmic potential drops. Figure 5d shows, the potential drop from the membrane to the location of peak ORR is approximately 150 mV at 0.4 V for that cathode.
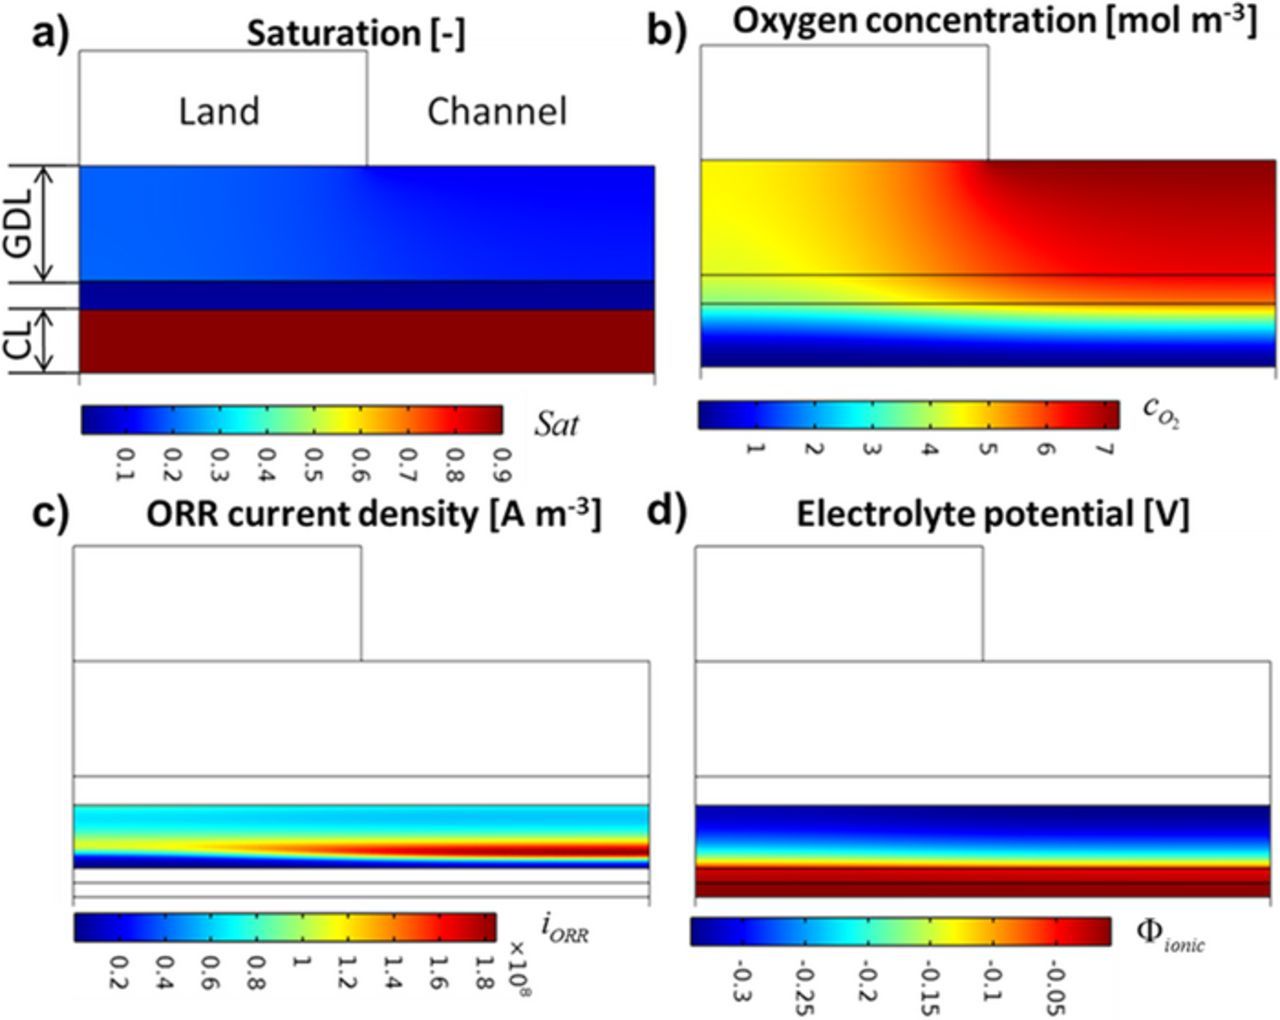
Figure 5. 2D spatial distribution in the cathode at 0.4 V for 50 wt% Nafion loading electrode. a) Liquid water saturation. b) Oxygen concentration [mol/m3]. c) ORR current density [A/m3]. d) Ionic potential [V]. The voltage loss is a flooding induced ohmic loss.
Comparing Figure 5 with Figure 4, the roughly 150–200 mV ohmic loss through the majority of the cathode in Figure 5 makes up a considerable portion of the mass transport overpotential seen in the polarization curves at 0.4 V in Figure 4. Thus, the oxygen transport resistance manifests itself as an ohmic loss that presents itself in polarization curves as a second ohmic slope, where the mass transport regime appears as steeper linear line without curvature.18,37 We previously identified this phenomena in experiments with thick Pt/C cathodes by measuring the potential drop through the cathode using microstructured electrode scaffold (MES) diagnostics.37
Considering the electrodes of different Nafion loading, we identify that the differences between the polarization curves in the mass transport regime is due to differences in the flooding of the macropores. First, the 50 and 60 wt% cases have quite similar porosities and 60% wt has much higher effective proton conductivity, but 60% wt presents notably larger losses. Thus, those parameters are not the origin of the difference. Instead, the difference relates to the current at which fully-flooded operation will occur. Nano-CT imaging showed the 60% wt electrode a much lower proportion of larger macropores as can be seen in the pore size distributions (Fig. S1) due to the thick Nafion films surrounding the agglomerates in the 60% wt case. Although the porosity of the macropore domain is similar for 50 and 60 wt%, the 60 wt% porosity resides more with the smaller pores because of the high Nafion loading. Thus, the smaller macropores of the 60% wt case presents early flooding onset and larger losses.
All the further analysis is done for the 50 wt% Nafion loading cathode because of it's good performance in both the activation, ohmic, and mass transport regimes of the polarization curve. Figure 6 shows the voltage gain in the 50 wt% Nafion loading cathode due to the resistance in different domains as a function of current density. We quantify voltage gain by individually setting the various resistance parameters to zero and subtracting the new voltage by the base case voltage at each current density. The effect of liquid water is studied by computationally setting the saturation to zero. The diffusion coefficients in different domains were multiplied by a large factor to make the transport resistance go to zero. Eliminating liquid presents the highest voltage gain, while the oxygen diffusion and proton conductivity in the CL are the next largest voltage gains and are close in magnitude. These voltage gains are similar because setting the O2 diffusion and proton conductivity offsets the liquid water effect by letting oxygen diffuse through the flooded electrode or by eliminating the potential drop associated with conductivity protons across the cathode. Increasing the oxygen diffusion in the GDL and MPL can also notably reduce the losses at the mass transfer region by up to 250 mV. Diffusion in the Nafion film surrounding the agglomerate and diffusion in the micropores in the agglomerate shows minimal or no effect on the performance. Once the flooding is mitigated, the other resistances would become significant.
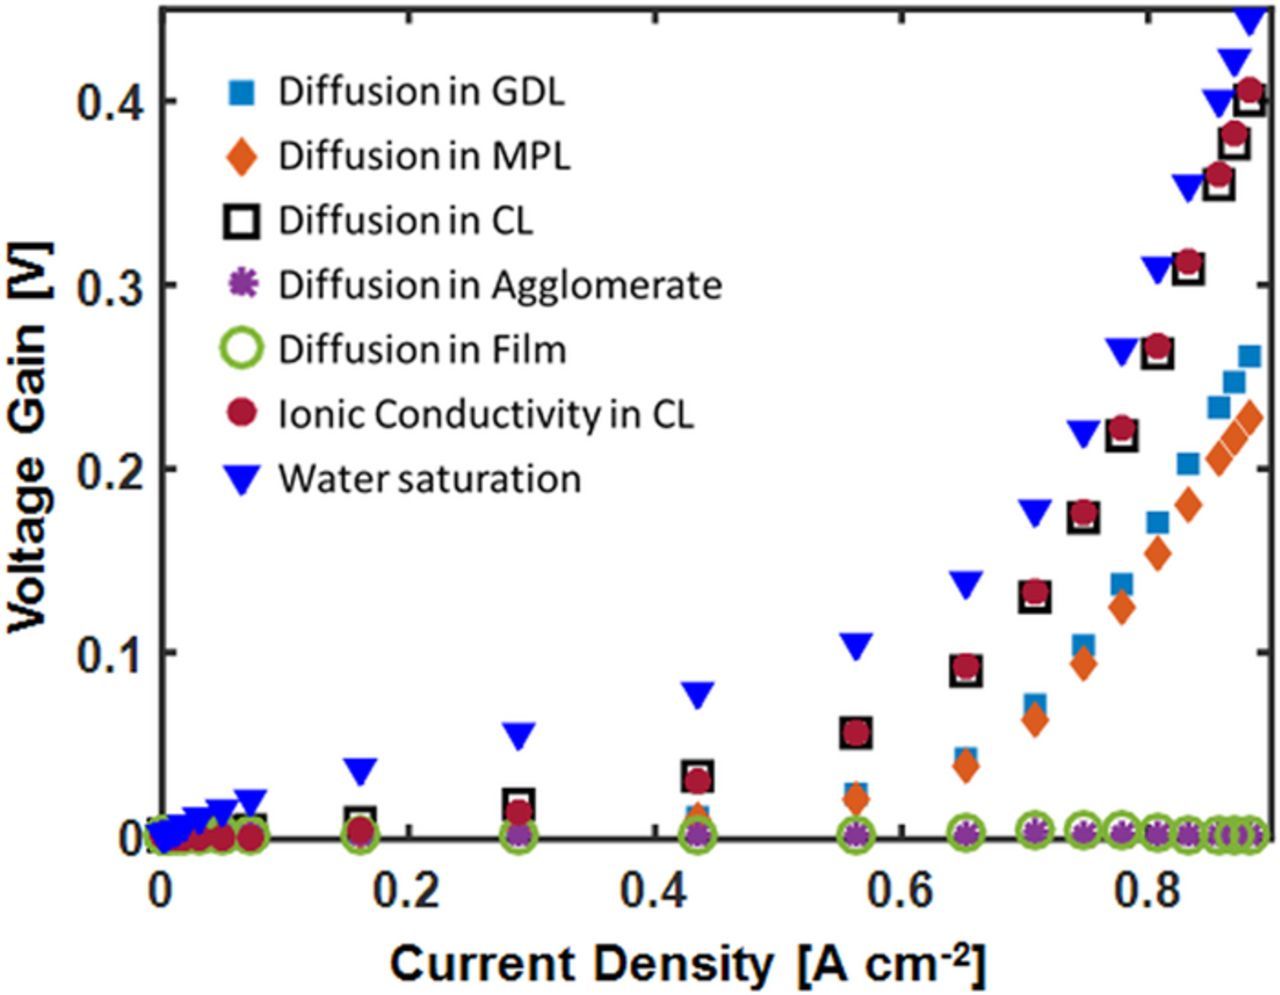
Figure 6. Voltage gain due to different resistance in the electrode for the 50 wt% Nafion electrode. The model was run with H2 and air fully humidified gas at 80°C and 1 atm partial pressure.
Parameter sensitivity
Different morphological and operating parameters were systematically varied for the 50 wt% Nafion loading electrode under realistic conditions to observe the parameter sensitivity. Figure 7 show the power density's sensitivity to these parameters. Similar to the voltage gain result, the wettability of the CCL has the highest effect on power density. At 0.7 V, increasing the operating pressure and Nafion conductivity increases the power density by 50 mW cm−2. However, at the voltage corresponding to maximum power, decreasing the thickness increases the power density by approximately 100 mW cm−2. Other morphological parameters like volume fraction and tortuosity of pore and Nafion domain show an increase of less than 50 mW cm−2. Oxygen diffusivity in the Nafion has a minimal improvement in power density. The following sections discuss a few parameters in detail.
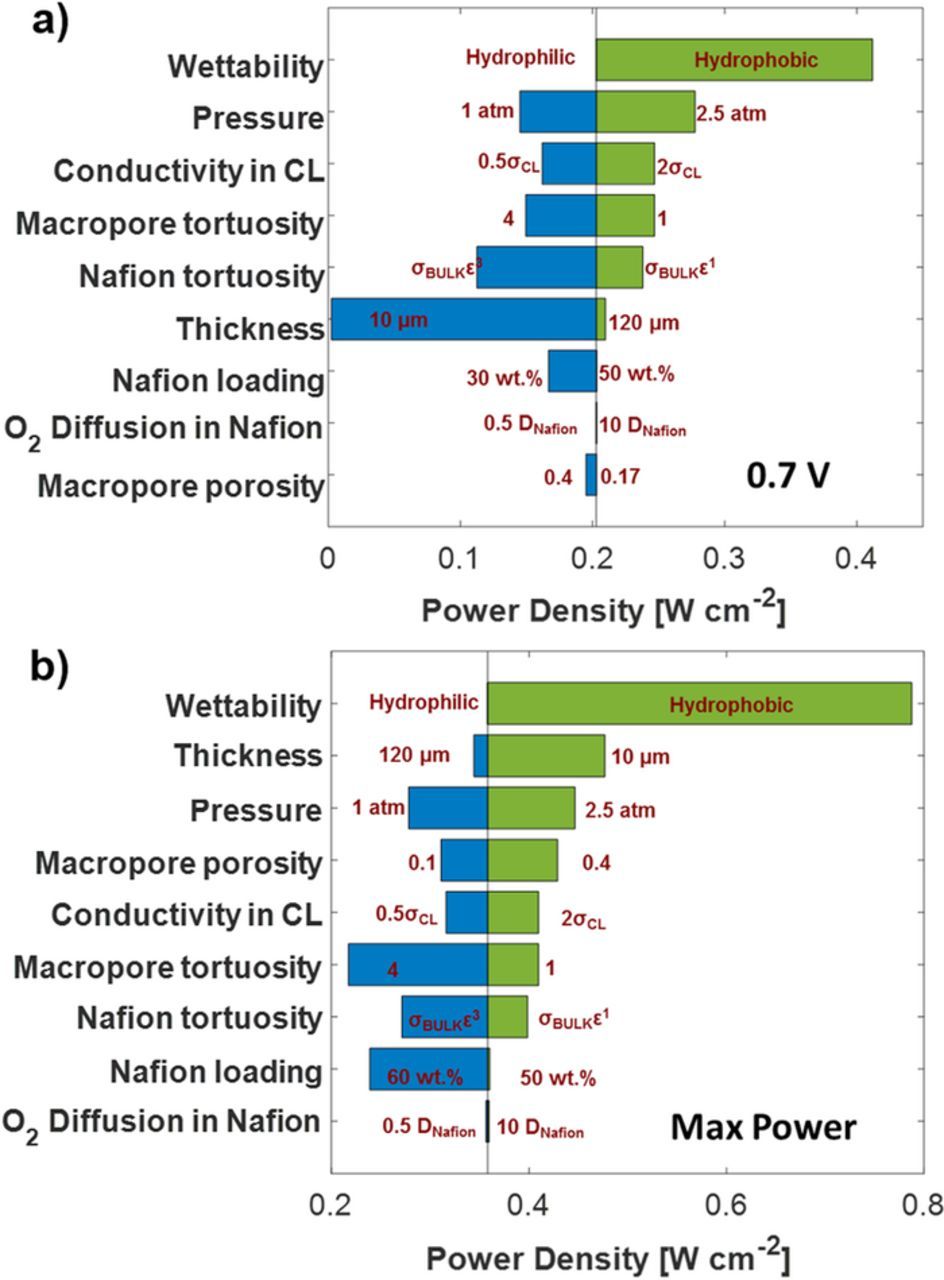
Figure 7. Parameter sensitivity for different morphological and operating conditions at a) 0.7 V and b) voltage corresponding to maximum power. The base case is the CM-PANI-Fe 50 wt% Nafion loading electrode fully humidified air and H2 at 80°C and 1.5 atm total pressure.
Wettability
Figure 8 shows the effect of wettability on the polarization curve for the 50 wt% Nafion loading cathode. The base case is the multiphase simulation with hydrophilic wettability. The effect of water saturation was studied by computational setting the saturation to zero in the single-phase case. This case showed significant improvement in the performance for all voltages below 0.8 V. In the mass transfer region, the current density is nearly doubled. Maintaining zero saturation is a practically impossible at these temperature with fully humidified gases and thick electrode. However, fabricating the electrode with increased hydrophobicity is possible.38,39 The hydrophobic cathode case is shown to have improved mass transport by reduced flooding. In the model, wettability is changed by changing the contact angle in the Young's-Laplace equation to the hydrophobic region (180°). The macropore is changed to hydrophobic while the micropore still is hydrophilic. This is a realistic assumption because the hydrophobic domain has a lower chance of infiltration into the micropore. The improved performance is observed when the through plane transport losses in the macropores becomes dominant, which is below 0.7 V.
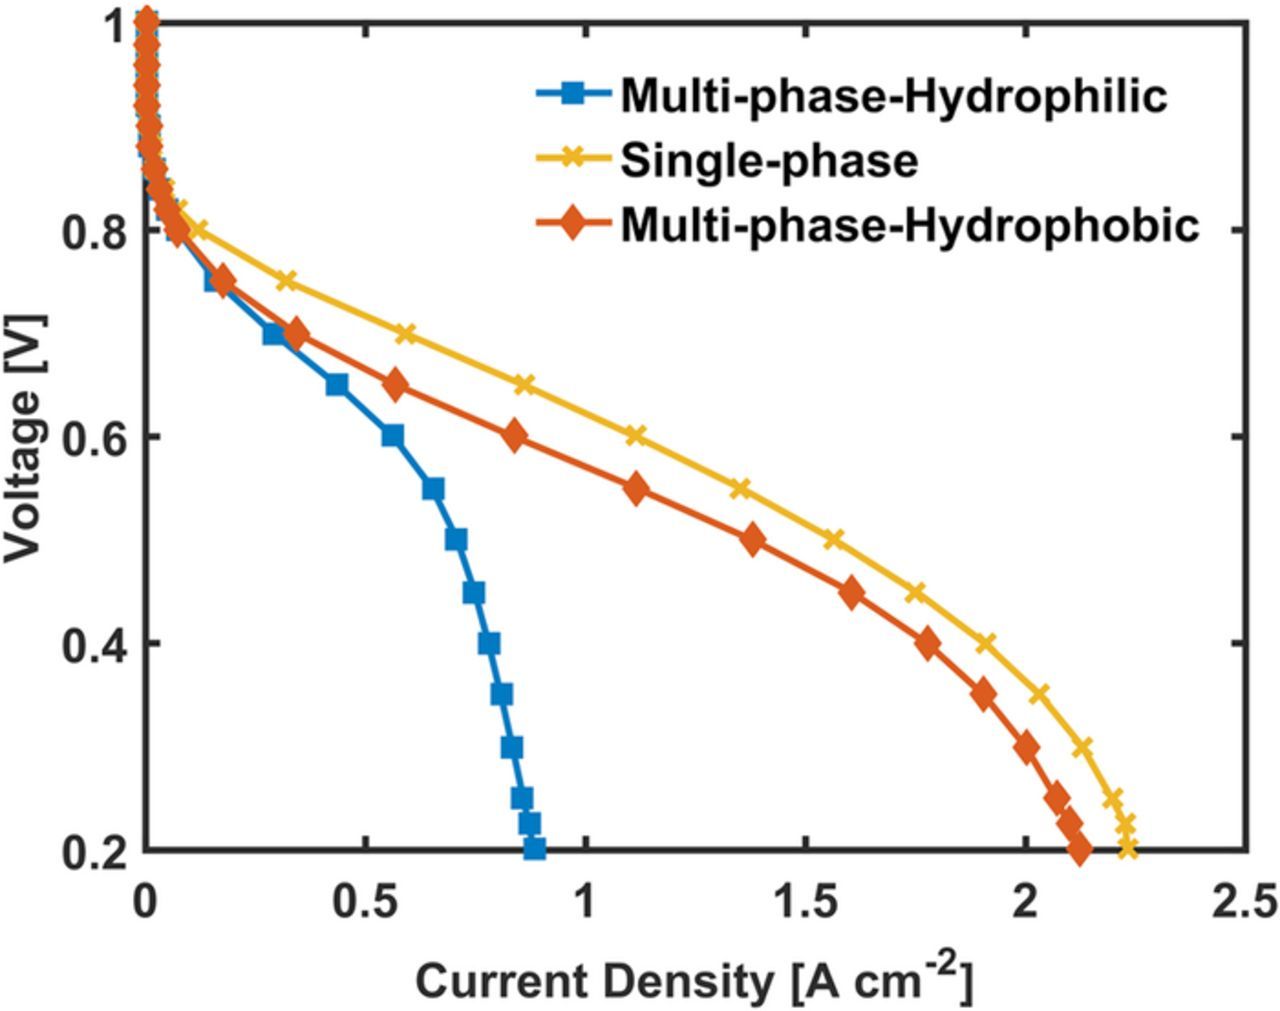
Figure 8. Effect of wettability on the 50 wt% Nafion loading CM-PANI-Fe electrode. The simulation was run at 80°C and 100% RH H2 and air feed gas at 1 atm partial pressure.
Thickness/catalyst loading
Effect of the catalyst loading is modeled by varying the cathode catalyst layer thickness. Figure 9 presents the polarization curve for varying thickness/catalyst loadings. While reducing the thickness of the electrode, morphological parameters were constant including the active site density and activity. Reducing the thickness of the CL reduces the current in the activation region, but also reduces the mass transport losses yielding higher limiting currents. If the thickness is reduced by decreasing the porosity, performance in the activation region would remain similar to the base case but a reduced current in the mass transfer region can be expected due to increased oxygen transport resistance with smaller macro-pores.
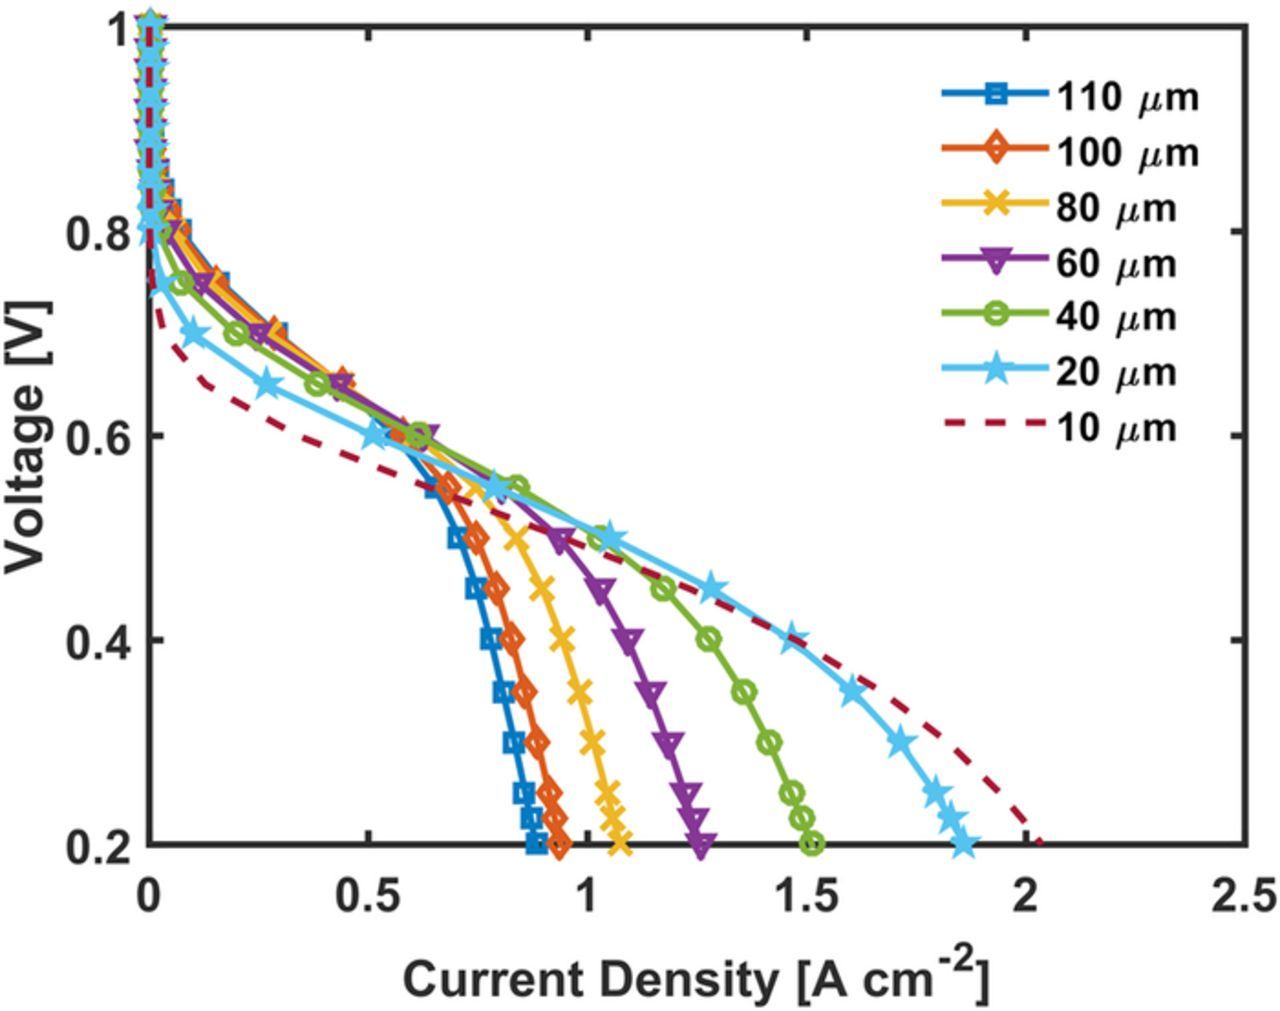
Figure 9. Effect of thickness on the 50 wt% Nafion loading CM-PANI-Fe electrode. The simulation was run at 80°C and 100% RH H2 and air feed gas at 1 atm partial pressure.
Nafion loading
In this section, effect of Nafion loading is studied. The Nafion loading and distribution is informed by the prior nano-CT observation of ionomer distribution.18 However, in all cases here the Nafion distribution is modeled assuming uniform distribution in the micro- and macro-pore unlike the 35 wt% Nafion loading sample that had feature large Nafion agglomerates, like due to the solid to solvents ratio used in making the electrode ink. The Nafion distribution model assumptions are:
- (1)For loadings below 50 wt%, only the micropores inside the agglomerate are infiltrated with Nafion, and there is no Nafion film formation on the agglomerate.
- (2)Films form around the agglomerates for Nafion loadings greater than 50 wt%.
- (3)Porosities in the micropore and macropore are corrected accordingly to the increase in Nafion volume fraction as well as film thickness.
The Nafion distribution is modeled as follows. The Nafion volume fraction, εNafion, in the agglomerate is estimated according to the expressions:
![Equation ([24])](https://content.cld.iop.org/journals/1945-7111/164/9/F1037/revision1/d0024.gif)
where ρNafion, LCCL, and yNafion are the density of Nafion and thickness of the cathode catalyst layer respectively. The mass of Nafion, mNafion, is calculated as
![Equation ([25])](https://content.cld.iop.org/journals/1945-7111/164/9/F1037/revision1/d0025.gif)
The film thickness, δfilm, is similarly calculated as
![Equation ([26])](https://content.cld.iop.org/journals/1945-7111/164/9/F1037/revision1/d0026.gif)
where εsolid is solid volume fraction and SA is the surface area of the agglomerate obtained from nano-CT imaging.
Figure 10a shows the Nafion volume fraction and the film thickness as a function of Nafion loading. Figure 10b shows the resulting polarization curves for different Nafion loadings. The current density at the activation region increases with increasing Nafion loading due to reduced through-plane ohmic losses since proton transport in the agglomerates and local proton activity is not modeled and are thus not reflected in the activation region current. Observing the mass transfer region, the current density is highest for the Nafion loading of 50 wt%. The 60 wt% Nafion loading shows a significant ohmic-like voltage loss at low potential due to the reduced size and porosity of the macro-pores, which increases the flooding rate.
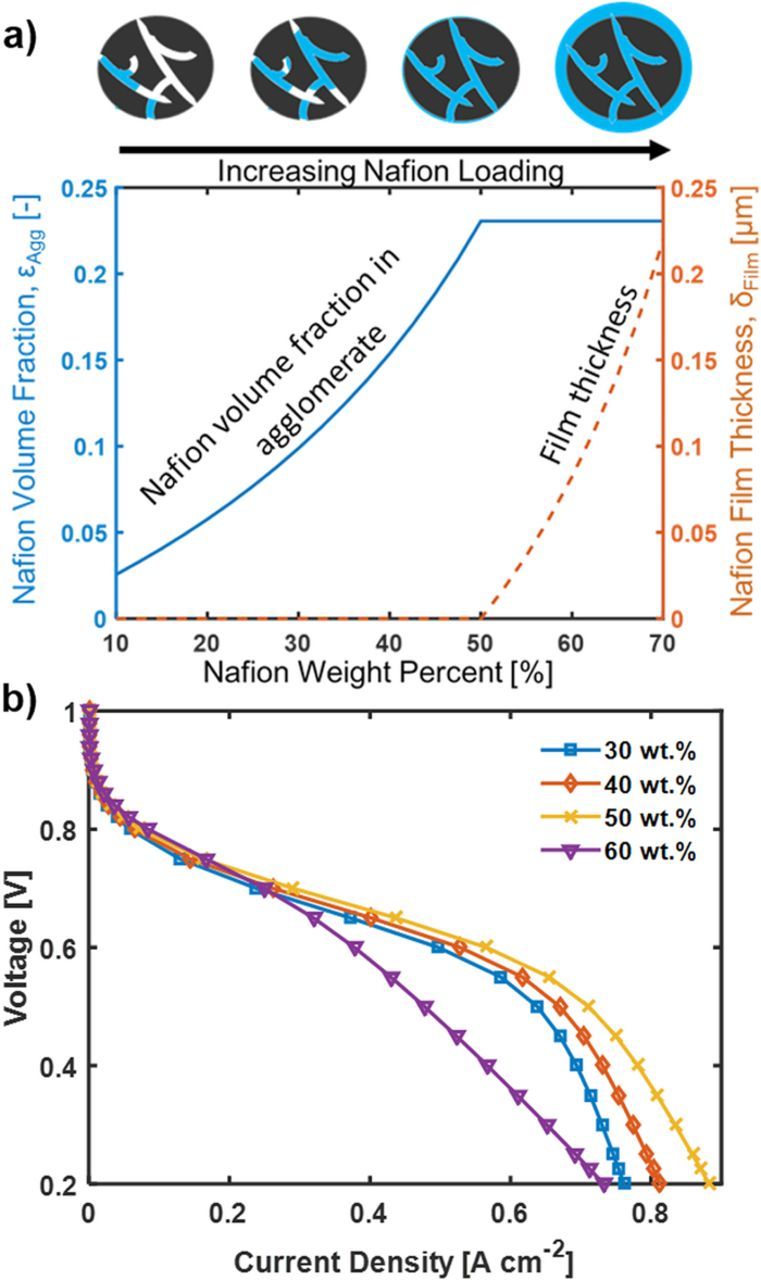
Figure 10. Performance of CM-PANI-Fe electrode with varying Nafion loading. a) Nafion volume fraction and film thickness as a function of the Nafion loading. b) Polarization curve with Nafion loading from 30 wt% to 60 wt%.
Agglomerate size distribution (ASD)
This section discusses the effect of using the distribution of ASD obtained from nano-CT imaging versus a single representative diameter. Figure 11a shows the ASD for the 50 wt% Nafion loading cathode as well as the mean and mode of the distribution. The mean and mode diameter of the distribution are 0.9 μm and 2 μm respectively. In addition, the apparent mean diameter from SEM is roughly 6 μm. The smaller size of the agglomerates from the nano-CT images relative to the SEM images is because the nano-CT uses a volume to surface area ratio to get diameter, which yields smaller diameters for these irregularly shaped particles. The distribution is implemented in the agglomerate model using Eq. 11, whereas the single diameter case was modeled with a single diameter having fi = 1. Figure 11b shows the resulting polarization curve comparison for the distribution and single diameter. For the current activity, the differences in the polarization curves for the distribution versus the mode case is very low. In the mass transfer region, the performance is notably lower for the SEM's apparent diameter and the mean diameter. Thus, these diameters are limit of where local, agglomerate-level losses are negligible. As ca be seen in Figure 11b, the agglomerate level losses become significant at the 6 μm SEM agglomerate diameter.
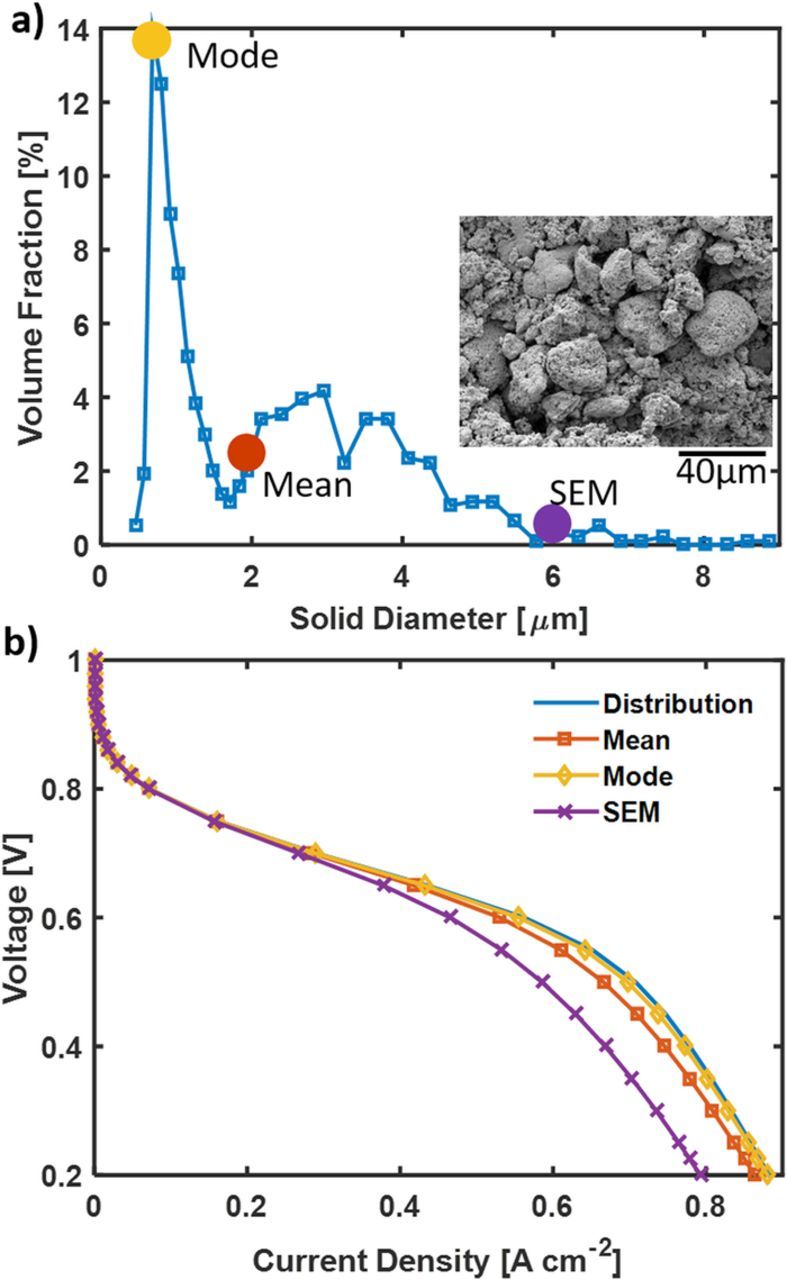
Figure 11. a) CM-PANI-Fe 50 wt% Nafion loading agglomerate distribution. Single representative Mean and Mode diameters. b) The polarization curves for the nano-CT distribution of diameters and the single representative diameters. The model was simulated at 80°C and fully humidified H2 and air at 1 atm partial pressure.
Parametric study on the power density
In this section, we discuss the improvement needed in the density or activity of the active sites to achieve higher power density. The active site's activity or activity site density was varied by changing the RsJs parameter using a multiplatication factor, which we refer to as the normalized site density. The rational for this approach and presentation of the results is based on assuming the active sites remain similar in terms of activity, but the spatial active site density is varied by tuning the catalyst synthesis. The site density can also be increased by increasing the utilization of the metal site. Sahraie et al. estimated that only 20% of the iron metal centers are ORR active in acidic medium.12 The active iron sites correspond to 1 wt% of iron content present in the catalyst. Figure 12 plots contours of the power density as function of the normalized site density and the cathode thickness. An additional line is ploted showing the thickness yielding the highest power density at a given normalized site density. The optimal thickness of the cathode decreases with increases in the activity or site density. Figure 12a shows that to achieve a proposed interim power density target [Insert ref to strategic analysis AMR presentation] of 475 mW cm−2 requires a 40 times increase in either the active site activity or the activity per site. The optimal thickness for 40 times increase in volumetric activity at 0.7 V is 47.5 μm while at 0.6 V it is less than 20 μm. For operating at 0.5 V and the voltage corresponding to maximum power, the optimal thickness, shown in Figures 12c and 12d, is below 20 μm.
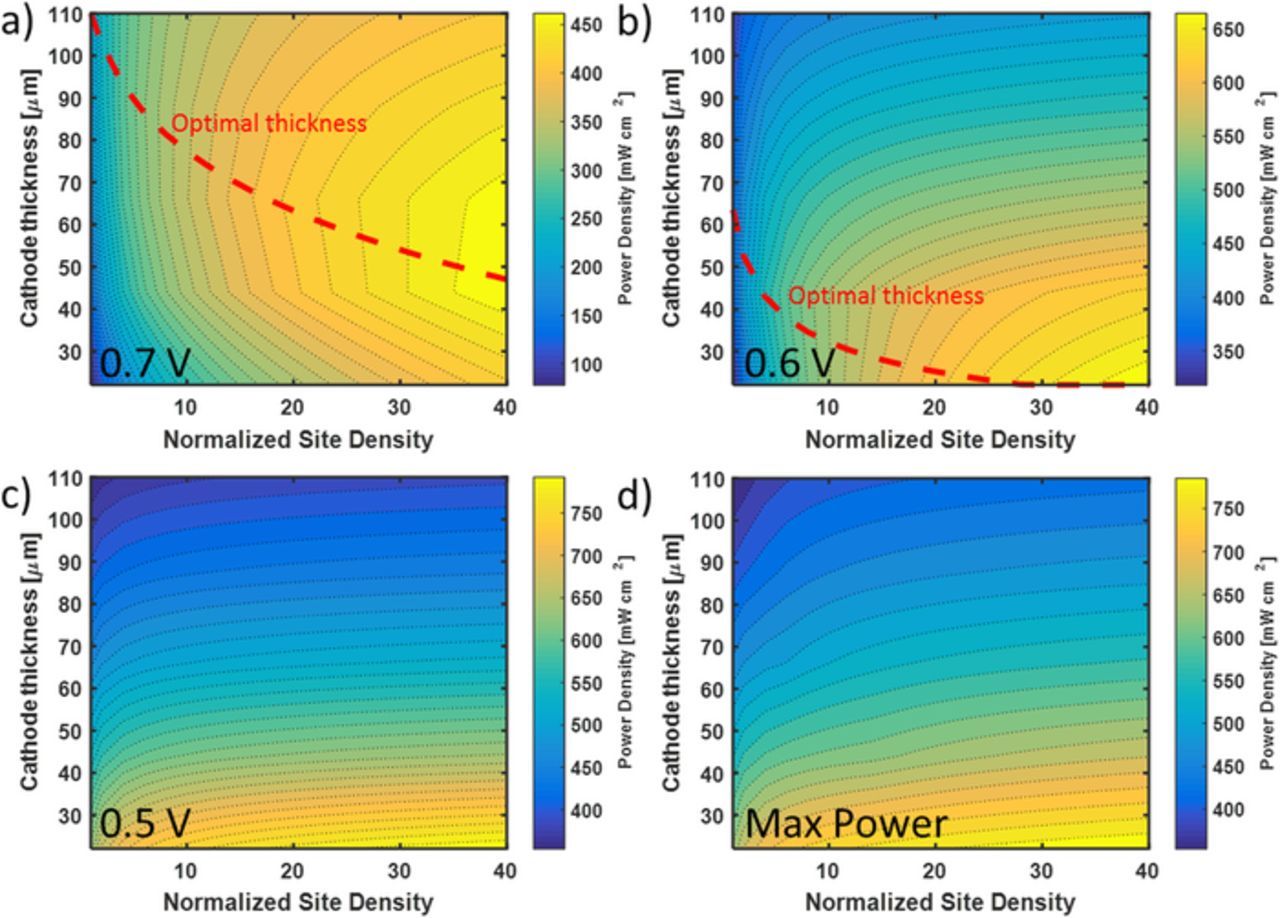
Figure 12. The power density of 50% wt Nafion cathode as a function of site density and thickness at a) 0.7 V, b) 0.6 V, c) 0.5 V, and d) voltage corresponding to maximum power. The optimal thickness is shown in dashed line.
Improved catalyst activity
This section discusses the performance and electrode parameters sensitivities of the PGM-free cathodes with increased activity or site density for a 50 wt% Nafion loading cathode. Here, the RsJs parameter is increased by a factor of 10. The morphological parameters were as before except the thickness of the cathode is 35 μm based on the optimal thickness estimation at 0.6 V from Figure 11b. Figure 13a shows the comparison between the electrode with the current activity fitted from experiments and the increased activity. Figure 13b shows the voltage gain due to different resistances for the increased activity catalyst. We quantify voltage gains with the improved catalyst similarly to the method in Figure 6 by individually setting the various resistance parameters to zero and subtracting the new voltage by the base case voltage with the improved activity catalyst at each current density. The voltage gains associated with flooding and through-plane transport still present the highest values. However, the voltage gains associated with oxygen diffusion in the Nafion and agglomerate are now more observable.
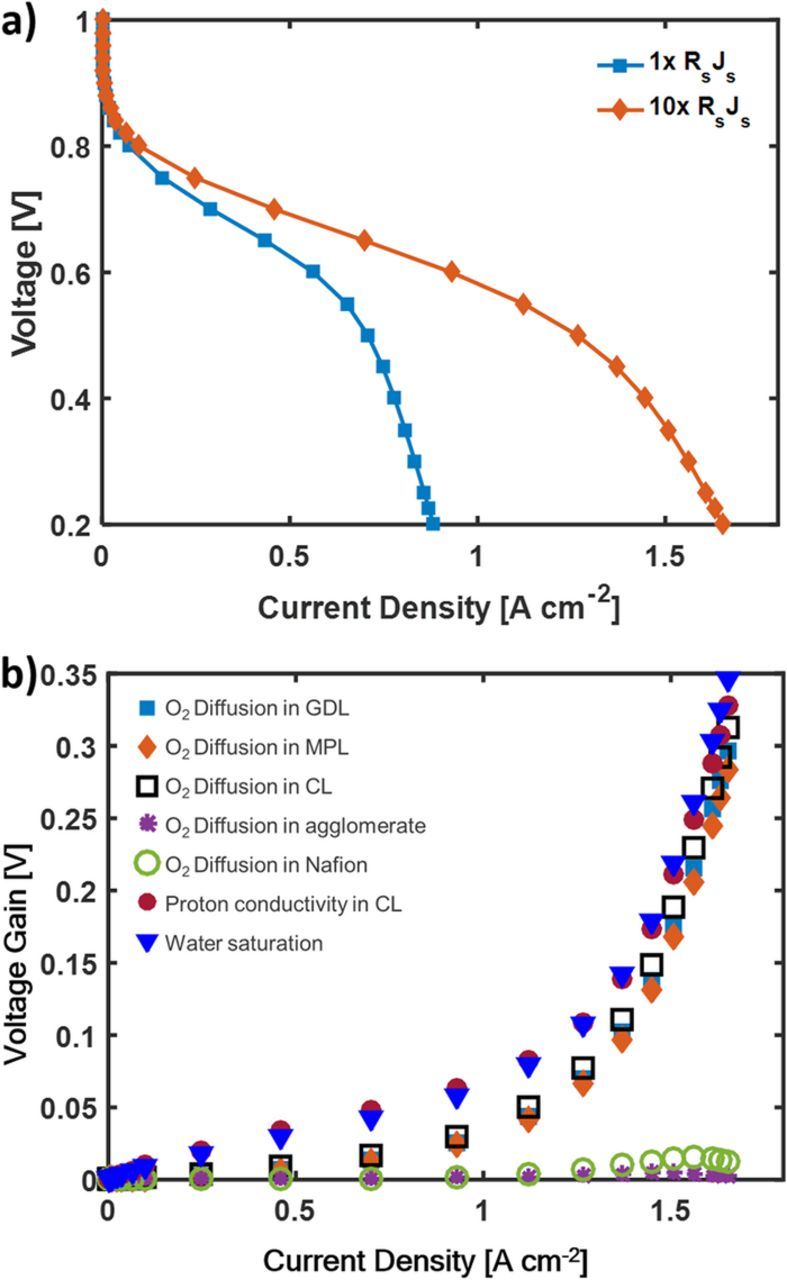
Figure 13. a) Polarization curves for current and the improved activity. b) Voltage gains for the cathode with the improved activity catalyst that is calculated by specifying each resistance to zero individually and evaluating the voltage increase.
Figure 14 shows the parametric study of the various morphological parameters for the improved activity catalyst. Even in the improved activity catalyst, the wettability shows the highest performance sensitivity. Unlike the present activity catalyst, other morphological and operating parameters show significant improvement at 0.7 V. Increases in the macropore porosity reduces the performance as the thickness of the CL increases.
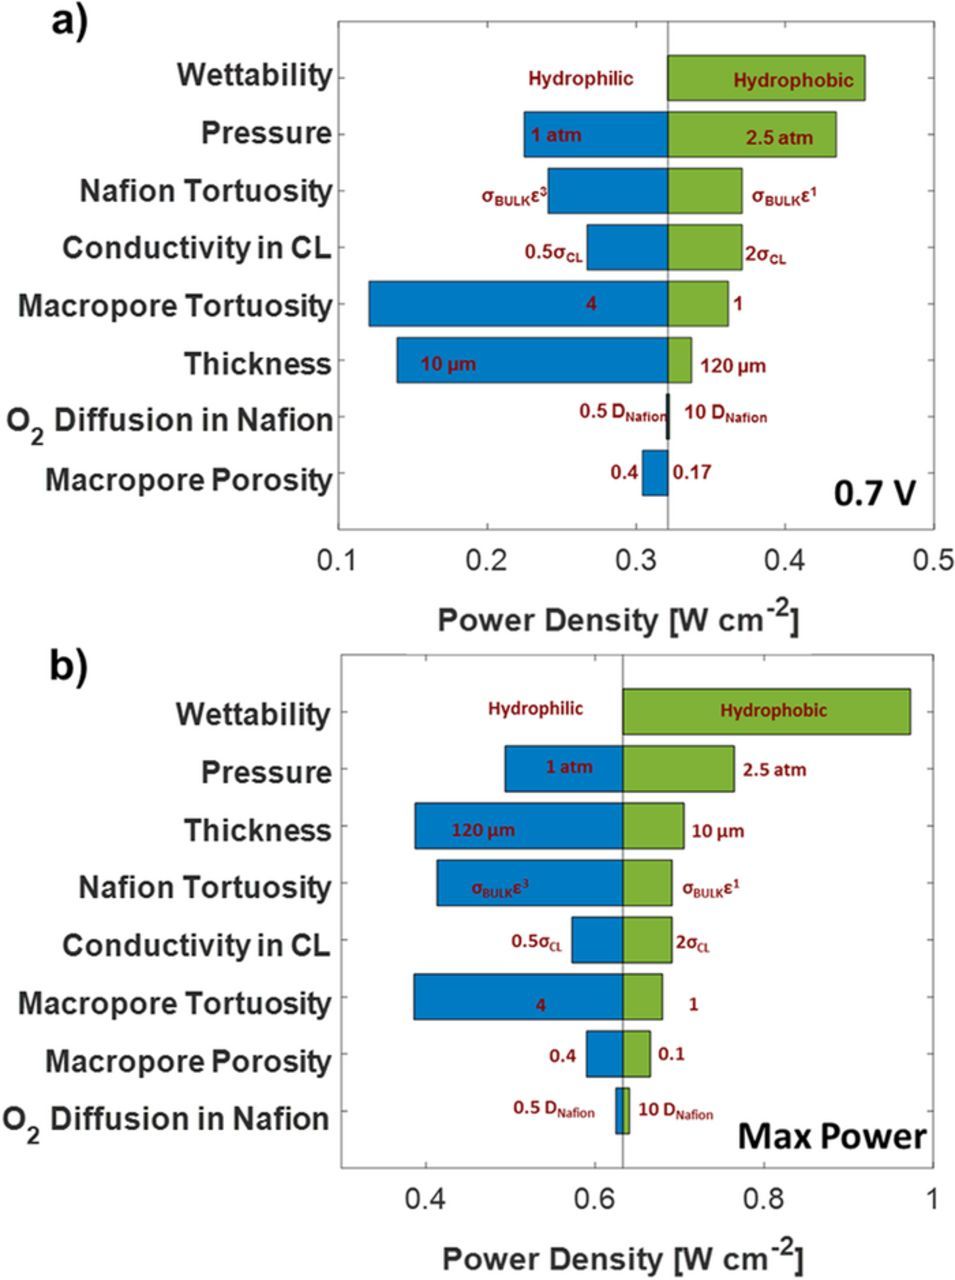
Figure 14. Parameter sensitivity for different morphological and operating conditions for the improved activity catalyst at a) 0.7 V and b) the voltage corresponding to maximum power density.
Figure 15 shows the model prediction for using the distribution and the single representative diameter in the agglomerate model for the improved activity catalyst. The single representative diameter of mode and mean case from the nano-CT distribution have higher mass transport losses than the distribution. The average from the SEM case has lowest performance because of the transport losses due to the larger diameter. Comparing to prior analysis with the present activity, it is apparent that agglomerate size control is important with future increases in active site activity or spatial density. While reducing the size of the diameters may be important, the mode suggests that macropore porosity should be maintained similar to the base case as decreasing the pore volume fraction reduces the through-plane oxygen diffusivity.
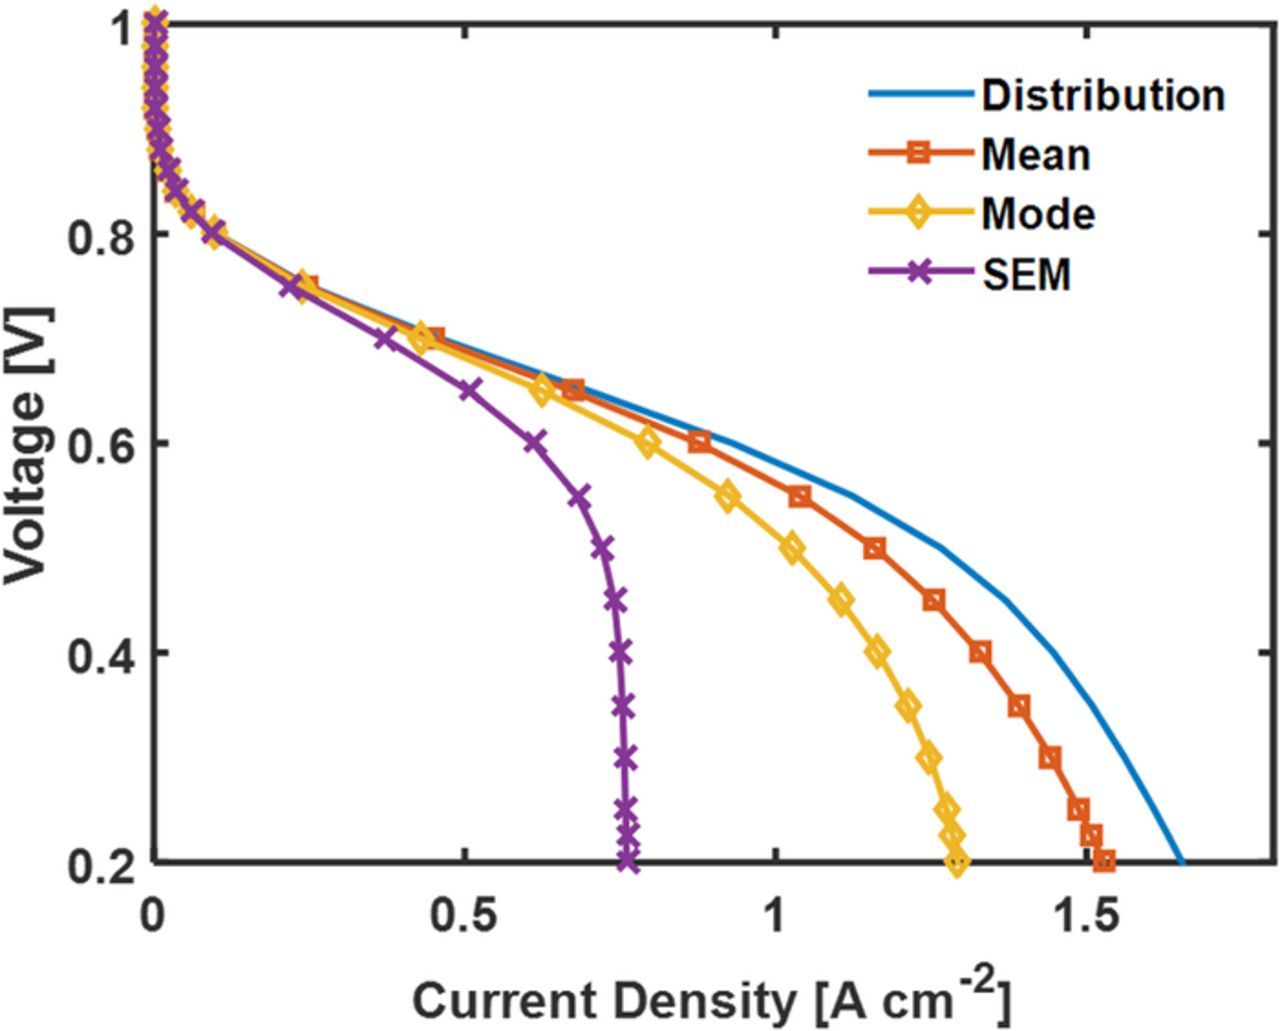
Figure 15. Model prediction of the improved activity catalyst's polarization curve for an agglomerate model with the nano-CT distribution of diameters and single representative diameters.
Conclusions
This article presented a computational model for the simulation of thick PGM-free cathodes that uses hierarchical morphology parameters obtained using multi-resolution, a multi-contrast mode nano-CT. The model was then applied to understanding which transport processes were limiting power density and evaluating the model sensitivity. Furthermore, the model was applied to evaluating the increased active site density needed for significant increases in PEFC power density with PGM-free cathodes. The model predictions with three different Nafion loadings (35, 50, and 60 wt%) were consistent with the experimental results. The spatially-resolved results show that large ohmic losses through the Nafion in the cathode is caused by flooding of the electrode, which manifests itself as a second ohmic slope in the polarization curve. Parameter sensitivity to operating conditions and morphological characteristics show the highest performance improvements were associated with flooding mitigation, including a hydrophobic treatment of the macropores, and increased Nafion conductivity. Although agglomerate size did not have a strong effect with current active density, the agglomerate diameters should have significant impact on performance with future increases in active site density. Our study of power density versus active site density and electrode thickness showed that a proposed interim power density target of 475 mW cm−2 can be achieved at 0.7 V with a 40 times increase in either the active site density or the activity per site, or some combination of both.
List of Symbols
| c | Concentration |
| D | Diffusion Coefficient |
| F | Faraday's constant |
| f | Volume fraction |
| ΔH | Difference in enthalpy |
| i | Current Density |
| irefHOR | Reference exchange current density for Pt on ionomer |
| Js | Activity per site |
| k | Permeability |
| kT | Thermal conductivity |
| M | Molecular Weight |
| N | flux |
| P | Pressure |
| PC | Critical pressure |
| PCap | Capillary Pressure |
| R | Rate of change |
| Rs | Active site density |
| r | radius |
| S | Source/Sink in domain i |
| Sat | saturation |
| T | Temperature, K |
| TC | Critical temperature |
| u | Velocity |
| y | Mass fraction |
Greek
| Φ | Potential |
| σ | Conductivity |
| ρ | Density |
| μ | Viscosity |
| η | Overpotential |
| Π | irreversibility |
| ε | Porosity |
| τ | Tortuosity |
| ν | Fixed charge site concentration |
| χ | Mole fraction |
| α | Charge transfer coefficient |
| δ | Film thickness |
Subscripts and Superscripts
| AD | Adsorption/Desorption |
| agg | agglomerate |
| DW | Dissolved water |
| eff | Effective |
| HOR | Hydrogen oxidation reaction |
| H2 | Hydrogen |
| i | Domain |
| Joule | Joule heating |
| ORR | Oxygen reduction reaction |
| O2 | Oxygen |
| Phase | Phase change |
| rxn | Reaction |
| res | Residual |
| wp | Wetting phase |
Acknowledgments
The authors gratefully acknowledge the support of the technology development manager Nancy Garland and funding from the US Department of Energy, the Office of Energy Efficiency and Renewable Energy, Office of Fuel Cell Technologies. The nano-CT instrument was acquired with the support of a Major Research Infrastructure award from the National Science Foundation under grant No. 1229090.