
Abstract
Anion-exchange membranes (AEMs) are a possible replacement for perfluorosulfonic-acid membranes in energy-conversion devices, primarily due to the hydroxide mobile ion allowing the devices to operate in alkaline conditions with less expensive electrocatalysts. However, the transport properties of AEMs remain understudied, especially electro-osmosis. In this work, an electrochemical technique, where the open-circuit voltage is measured between two ends of a membrane maintained at different relative humidities, is used to determine the water transport number of various ionomers, including Versogen and Sustainion AEMs and Nafion cation-exchange membrane (CEM), as a function of water content and temperature. In addition, the CEMs and AEMs are examined in differing single-ion forms, specifically proton and sodium (CEM) and hydroxide and carbonate (AEM). Carbonate-form AEMs have the highest transport number (∼11), followed by sodium-form CEMs (∼8), hydroxide-form AEMs (∼6), and proton-form CEMs (∼3). Finally, a multicomponent transport model based on the Stefan-Maxwell-Onsager framework of binary interactions is used to develop a link between water transport number and water-transport properties, extracting a range for the unmeasured membrane water permeability of Versogen as a function of water content.
Export citation and abstract BibTeX RIS

This is an open access article distributed under the terms of the Creative Commons Attribution Non-Commercial No Derivatives 4.0 License (CC BY-NC-ND, http://creativecommons.org/licenses/by-nc-nd/4.0/), which permits non-commercial reuse, distribution, and reproduction in any medium, provided the original work is not changed in any way and is properly cited. For permission for commercial reuse, please email: permissions@ioppublishing.org.
Symbols

| water activity in phase x |
| EWi | equivalent weight of membrane i |
| F | Faraday's constant |

| membrane permeability |
| Ni | flux of species i |
| R | gas constant |
| T | temperature |
| U | open circuit voltage |
| x | spatial coordinate parallel to the membrane between two electrodes |

| valence of species i |
| λ | water content |

| tortuosity power index in Archie's law |

| chemical potential of species i |

| tortuosity |

| water transport number in membrane of counterion-form i |

| electro-osmotic coefficient in membrane of counterion-form i |
The use of hydrogen-based energy-conversion technologies continues to grow in importance, especially as a replacement for fossil-fuel-based energy technologies. 1,2 In fuel cells, hydrogen gas undergoes an oxidation reaction (HOR) in the anode and oxygen gas undergoes a reduction reaction (ORR) in the cathode to produce electricity with water as a byproduct. In electrolyzers, water is fed to the anode, where the oxygen-evolution reaction (OER) occurs. Hydrogen evolution (HER) occurs at the cathode. In both cases, the anode and cathode are separated by an ion-conducting polymer-electrolyte membrane. The standard membrane is Nafion®, a perfluorinated sulfonic-acid proton-exchange membrane (PEM), which generally conducts protons as the mobile ion but can also conduct other cations as a cation-exchange membrane (CEM). 3 However, to overcome the high cost of the platinum catalyst necessary for operation under acidic conditions of PEM fuel cells, hydroxide-exchange membranes (HEMs), where hydroxide is the mobile ion, that can use low-cost catalysts (e.g. Fe, Ni) are being explored. 4–8 Popular HEMs include Versogen® and Sustainion®, the former of which uses an aromatic backbone and the latter of which has an aliphatic backbone. Versogen HEM uses a piperidinium incorporated into the backbone, whereas Sustainion HEM uses a pendant imidazole (See Supporting Information, Fig. S1). 7,9 HEMs are also utilized in CO2 electrolyzers, 10 where the hydroxide ion converts to a mixture of carbonate and bicarbonate ions upon exposure to carbon dioxide, 11


thus rendering the HEM a more general anion-exchange membrane (AEM). Both reactions have large equilibrium constants. 11 These reactions are useful for systems that rely on the carbonate ion (e.g., molten carbonate fuel cells) but can be detrimental in fuel cells and CO2 electrolyzers where feedstocks containing CO2 are used as a reactant and hydroxide is the desired mobile ion due to the lower conductivity of carbonate-exchanged AEMs compared to HEMs. 12,13
In addition to mixed-ion concentrations in the membrane, water management is critical in fuel cells and electrolyzers, wherein much work has been invested. 14–19 Water enhances membrane ion conductivity significantly compared to a dry membrane and may also be a reactant. 3,4 In Nafion, water drives phase-separation of the nanostructure, with a hydrophobic region consisting of the polymer backbone and a hydrophilic water nano-domain network that is responsible for the water transport and proton conduction. 3 Versogen and Sustainion uptake water similarly to Nafion yielding significant conductivity benefits, but their nanostructures are not well-defined. 13,20,21 Water diffusion has also been studied extensively in Nafion, where values of the diffusion coefficient depend on the measurement technique used, but range from ∼5 × 10⁻⁷ cm2/s for steady-state diffusion to ∼10−5 cm2/s using pulse-field nuclear magnetic resonance, and even higher using quasi-elastic neutron scattering, approaching the value of free diffusion in liquid water, ∼5 × 10⁻⁵ cm2/s. 22–24 Fewer direct measurements exist for AEMs, but initial results suggest a diffusion coefficient of ∼2 × 10⁻⁶ cm2/s for Versogen. 25,26 Nevertheless, excess water in the system can be detrimental. For example, PEM and AEM fuel-cell catalyst layers can flood with water due to excess water invading gas-filled channels, leading to additional mass-transport limitations and poor cell performance. 27–34 As a result, proper management of water balance is necessary to maintain adequate ion conductivity without flooding. Ion-exchange membranes can also be used in electro-dialysis; water transport is similarly important in these systems. 35–37
There are multiple methods by which water can move through an AEM. A classical mechanism is by viscous flow due to an applied pressure difference. A second mechanism is movement along a chemical-potential gradient, e.g., by exposing each side of the membrane to a different relative humidity (RH). Yet another mechanism is application of an electrical field (i.e., electro-osmosis) in which water can move in multiple ways: mobile ions carry water in their solvation shells as they move from one side of the membrane to the other and/or water is forced through small pores due to space charges on the pore walls. 3 We are primarily concerned with the former mechanism here. The number of water molecules transported per mobile-counterion (i.e., ions that neutralize fixed charges in the membrane) charge is defined as the ion-water transport number,

where Ni
is electro-osmotic flux of mobile ion species i, N0 is flux of water, and  is the counterion valence.
38
We refer to
is the counterion valence.
38
We refer to  below simply as the water transport number. It is related to the more familiar electro-osmotic coefficient by the relation

where the electro-osmotic coefficient is defined as the amount of water moved per mobile counterion, not to the mobile counterion charge. When the ion valence is unity, the electro-osmotic coefficient and the water transport number are identical. Due to the possible presence of multivalent counterions in AEMs, we utilize the water transport number exclusively in this work. Depending on the magnitude of the water transport number, the effect of counterion valence can be significant in the water balance, especially at high current densities due to the water electro-osmotic flux scaling with current density, i, by the relationship

where F is Faraday's constant. The water transport number of hydronium ions in Nafion is well-studied, using a variety of techniques, including electrochemical measurements,
38–40
various types of membrane-electrode assemblies,
41–45
and electrophoretic nuclear magnetic resonance.
46,47
At room temperature, proton  values in the range of 1.0 to 1.4 are common in vapor-equilibrated membranes, with higher values near 2.5 to 3 for liquid-equilibrated membranes.
3,38,44,46,48
Unfortunately, the water transport numbers of AEMs are largely unknown, with no comprehensive study. Two prior efforts focus on the Tokuyama A201® AEM, with both reporting water transport numbers for hydroxide as a function of water content
49,50
and with one
50
also reporting the water transport number for bicarbonate-exchanged as a function of water content. However, the reported values differ significantly (∼0.6
49
vs up to 8.2
50
) depending on the specific ion and water content, and do not agree on the water transport number for the hydroxide-form AEM. Multiple temperatures are not considered, and minimal physical explanation is provided. Thus, there is a need for further study of water transport numbers in AEMs, especially when multivalent mobile counterions are present.
values in the range of 1.0 to 1.4 are common in vapor-equilibrated membranes, with higher values near 2.5 to 3 for liquid-equilibrated membranes.
3,38,44,46,48
Unfortunately, the water transport numbers of AEMs are largely unknown, with no comprehensive study. Two prior efforts focus on the Tokuyama A201® AEM, with both reporting water transport numbers for hydroxide as a function of water content
49,50
and with one
50
also reporting the water transport number for bicarbonate-exchanged as a function of water content. However, the reported values differ significantly (∼0.6
49
vs up to 8.2
50
) depending on the specific ion and water content, and do not agree on the water transport number for the hydroxide-form AEM. Multiple temperatures are not considered, and minimal physical explanation is provided. Thus, there is a need for further study of water transport numbers in AEMs, especially when multivalent mobile counterions are present.
Several techniques can be used to study the water transport number in ion-exchange membranes. These include volumetric water measurements under an applied electrical bias and the use of the Scatchard equation to differentiate true and apparent water transport numbers.
51–54
The method of interest here to determine  is the electrochemical technique developed by Fuller and Newman, in which an exchange membrane is placed between two separate abutting chambers.
3,38
Water-vapor activity on the membrane upstream side is varied while holding the downstream-side water activity constant, and the open-circuit voltage(OCV) is measured as a function of water activity. By imposing a water chemical-potential gradient across the membrane using differing relative humidities, water transports downstream, carrying ions with it due to the coupled nature of multicomponent diffusion. Ions carried downstream by water diffusion must then migrate back upstream to maintain zero net current (i.e., counter electro-osmosis). Back osmosis is driven by a generated open-circuit voltage difference (OCV). The magnitude of the OCV quantifies the water transport number, as illuminated later.
is the electrochemical technique developed by Fuller and Newman, in which an exchange membrane is placed between two separate abutting chambers.
3,38
Water-vapor activity on the membrane upstream side is varied while holding the downstream-side water activity constant, and the open-circuit voltage(OCV) is measured as a function of water activity. By imposing a water chemical-potential gradient across the membrane using differing relative humidities, water transports downstream, carrying ions with it due to the coupled nature of multicomponent diffusion. Ions carried downstream by water diffusion must then migrate back upstream to maintain zero net current (i.e., counter electro-osmosis). Back osmosis is driven by a generated open-circuit voltage difference (OCV). The magnitude of the OCV quantifies the water transport number, as illuminated later.
In this work, a microelectrode assembly previously developed by the authors 55,56 measures the water transport number of Nafion PEM and Versogen and Sustainion AEMs, as a function of water vapor activity, and, accordingly, as a function of membrane water content. The gas flow-through design of the microelectrode cell enables much faster equilibration, and, thus, enhances experimental throughput and ease of use. Cell data interpretation builds on that developed by Fuller and Newman, 38 with important modifications to adapt to the materials used here. Multiple transporting counterions are explored, including the proton and sodium-exchange forms of Nafion and hydroxide, carbonate, and bicarbonate-exchange forms of the AEMs. The impact of temperature is also explored in the Versogen AEM for both hydroxide and carbonate counterions at low and high membrane water contents. Finally, a theoretical framework is developed to describe the measured water transport numbers in Nafion and Versogen. We then predict the water transport number as a function of water content of Nafion using literature 24 to extract membrane tortuosity and use the measured water transport number to predict the water-permeabilty range of Versogen.
Experimental Methods
Materials
The microelectrode working electrode (WE) was Pt, 50 μm in diameter (Metrohm, Florida, USA), and the counter (CE) and reference electrodes (RE) were gas-diffusion electrodes (GDE), again Pt. For acid-based experiments, commercial GDEs were used (0.5 mg cm−2 Pt, Ion Power, Delaware, USA), fabricated from commercial gas-diffusion layers (Sigracet 25BC, SGL Carbon, Wiesbaden, Germany); for alkaline-based experiments, custom GDEs were fabricated using a Sono-Tek spray coater (Sono-Tek Corporation, New York, USA), gas-diffusion media (AVCarb 370, microporous layer loading 0.5 mg cm−2, Pt loading 0.5 mg cm−2, AVCarb Material Solutions, MA, USA) and Versogen ionomer (PiperION-A (PAP-TP-85), 5 wt% in ethanol, Versogen, Delaware, USA). 57 Additional fabrication details are available elsewhere. 57
The CEMs used were Nafion 211 (25 μm, 1100 EW, used pre-treated by nitric acid and boiling
3
and as-received, Ion Power, Delaware, USA) and sulfonated polystyrene cast from solution (poly(4-styrenesulfonic acid) solution, 18 wt% in water, 100 g, Sigma-Aldrich, Massachusetts, USA). Nafion 211 was also exchanged to sodium form by submersion in 0.5 M Na2SO4 aqueous solution (Sodium sulfate, 1 kg, ACS reagent,  99.0%, Sigma-Aldrich, Massachusetts, USA). AEMs studied were Versogen (20 and 80 μm, ∼425 EW, Versogen, Delaware, USA) and Sustainion (X37–50, 50 μm, ∼900 EW, Fuel Cell Store, Colorado, USA).
13,21
1 M anion solutions determined the membrane ion-exchange form. Potassium carbonate (500 g, ACS reagent,
99.0%, Sigma-Aldrich, Massachusetts, USA). AEMs studied were Versogen (20 and 80 μm, ∼425 EW, Versogen, Delaware, USA) and Sustainion (X37–50, 50 μm, ∼900 EW, Fuel Cell Store, Colorado, USA).
13,21
1 M anion solutions determined the membrane ion-exchange form. Potassium carbonate (500 g, ACS reagent,  99.0%, Sigma-Aldrich, Massachusetts, USA), potassium bicarbonate (500 g, ACS reagent, 99.7%, Sigma-Aldrich, Massachusetts, USA), and potassium hydroxide (3 kg, Certified ACS pellets, Thermo Fisher Scientific, Massachusetts, USA) were used for carbonate, bicarbonate, and hydroxide AEM ion-exchanged forms, respectively. Before use, membranes were placed in three successive water baths using Millipore-grade water (18.2 MΩ-cm) to rinse excess ions, for at least 4 h, overnight, and 30 min, respectively. In the case of hydroxide-form membranes, the water was degassed with nitrogen to prevent conversion to carbonate form due to dissolved carbon dioxide.
Water-uptake measurements
Membrane water uptake as a function of RH were taken from previous studies at 25 °C for Nafion in the proton form, for Sustainion in the hydroxide form, and for Sustainion and Versogen in the carbonate and bicarbonate forms. 3,13,21 Water content was assumed to be invariant with temperature, as the impact of temperature on water content for Nafion in the studied temperature range is inconclusive. 3 The water uptake of hydroxide-form Versogen was measured in this study using a dynamic-vapor sorption (DVS) system (Surface Measurement Systems, UK) with the chamber flushed with dry nitrogen gas for 1 h to remove residual CO2 and set a dry weight prior to the humidification step. The sample was placed directly in the sample holder from a degassed water reservoir to minimize carbonate formation and held at 25 °C and 70% RH for 3 h to equilibrate the membrane. Next, the humidity was increased to 98% RH to begin equilibration for the water-uptake measurements. The 98% RH step was followed by 95% RH and 90% RH before the humidity set points were reduced in intervals of 10% RH down to 0% RH and then ramped back to 98% RH in a mirrored manner. all humidity set points were held for 60 min. The second, increasing-humidity sorption curve was used to analyze the water uptake. Additional details are found in prior studies. 13,58
Electrochemical experiments
The microelectrode cell used was as described previously; a description can also be found in SI. 55,56 Hydrogen gas (2 or 4 vol% in Ar, Linde Gas, or 100%, H2PEM-510 H2 generator, Parker Hannifin, Ohio, USA) was humidified via external humidifiers (Humidification System, Fuel Cell Technologies, New Mexico, USA) or a custom wet/dry gas mixing bubbler before entering the cell. Cell temperature was controlled by a heating pad below the cell controlled by a proportional-integral-derivative (PID) controller (Red Lion, Pennsylvania, USA). Gas lines entering the cell were held at 80 or 90 °C for the 40/50 °C and 70 °C trials, respectively, to minimize water-droplet formation. A syringe tube heater (New Era Pump Systems, New York, USA) maintained temperature between the humidifier and the microelectrode cell. Electrochemical measurements were performed with a VSP-300 potentiostat using an ultra-low current cable (Bio-Logic, Seyssinet-Pariset, France).
OCV measurements
OCV was measured between the working and reference electrodes. OCV was held for 30 min or until a stable reading was achieved at each tested humidity. An OCV was considered stable if there was a less than 2 mV continuous increase or decrease in at least a 5–10 min period as a baseline, or if the OCV was fluctuating in a ±5-mV range in the same time period. For the hydroxide-form AEMs, a 15 h potential hold at 0.5 V was performed to remove trace carbon dioxide before the OCV measurements. A hydrogen reference electrode was used in all cases.
All membranes and counterion-exchange forms were tested by fixing the reference electrode (RE) at a constant RH and varying the WE/CE side in 5% RH intervals ±10% from each of these setpoints, e.g., when the RE was held constant at 50% RH, the WE/CE side was varied in increments at 40, 45, 50, 55, and 60% RH. A table of all test conditions may be found in Table S1 of SI. The standard test for AEMs held the RE at 50, 70, and 90% RH while the WE/CE side was varied accordingly. 100% RH was not used when the RE was held at 90% RH due to water-droplet formation. Temperatures tested include 30, 40, 50, and 70 °C. At the non-50 °C temperatures, only 50% RH RE (30, 70 °C) or 90% RH RE (30, 40 °C) were tested. Experiments involving Nafion 211 used the standard procedure at 50 °C, but at 20 °C, the RE was held at 39, 57, 79, and 89% RH, and the WE/CE varied. At 20 °C, experimental error sometimes resulted in RH differences between the WE and RE of up to 14% instead of 10%. Raw OCV versus RH data can be found in the SI as an attached spreadsheet.
Data Interpretation
PEM
OCV, the open circuit voltage, U, corresponds to zero net current. The counter-ion water transport number,  describes the flow of ions to the flow of water in the membrane. To relate these two properties, both cell thermodynamics and species fluxes must be considered. We follow closely the development for hydronium ions in Nafion by Fuller and Newman.
38
describes the flow of ions to the flow of water in the membrane. To relate these two properties, both cell thermodynamics and species fluxes must be considered. We follow closely the development for hydronium ions in Nafion by Fuller and Newman.
38
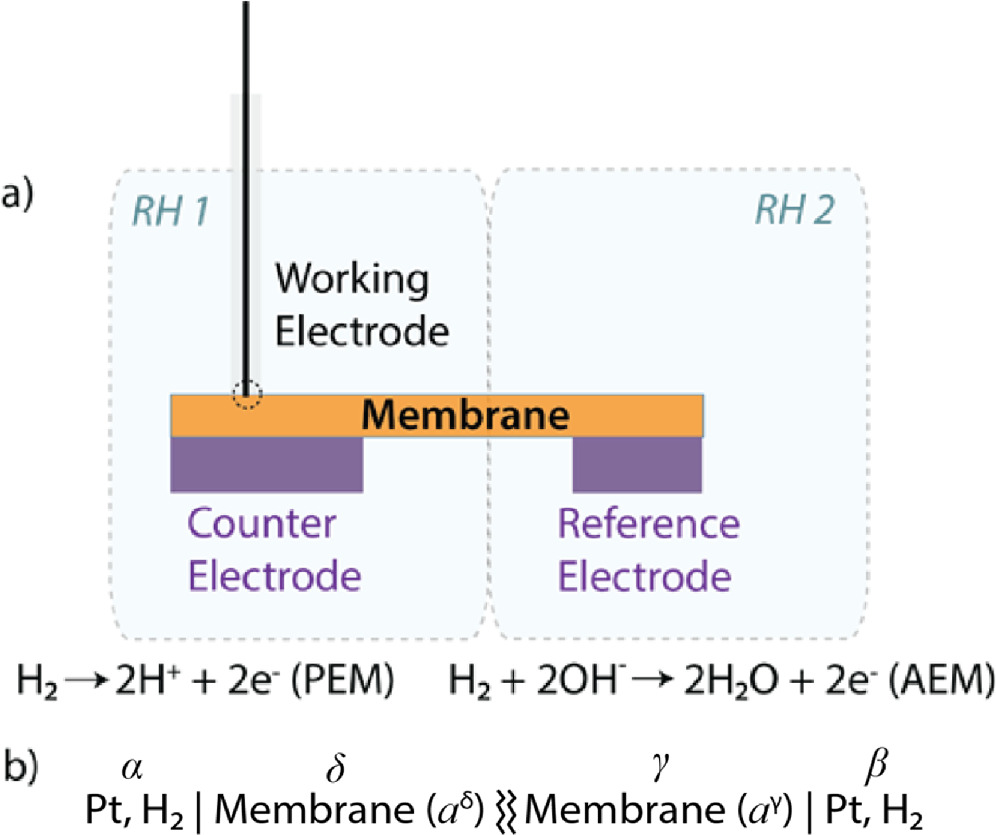
The electrochemical cell consists of two Pt electrodes (RE and WE/CE) separated by a PEM (or AEM), with the membrane enclosed in two regions each with a different water activity (as set by the RH). The Pt electrode and membrane enclosed on the "left" side are arbitrarily denoted as phases α and δ, respectively, and the electrode and membrane enclosed on the "right" side as β and γ. A cell schematic is given in Fig. 1a, and a corresponding thermodynamic phase diagram is depicted in Fig. 1b. The cell analysis of Fuller and Newman 38 for the water transport number of hydrogen ions in a PEM reduces to

where F is Faraday's constant, U is the OCV, R is the ideal-gas constant, T is the absolute temperature, and phases δ and γ are as defined in Fig. 1.
38
 is the water activity in phase i controlled by exposure to water vapor of known RH. Equality of water activity, signifying equilibrium, is imposed between the membrane phase and water vapor on each side. For an isothermal membrane, the ratio of upstream and downstream water activities is given by the ratio of the corresponding RHs. Thus, the hydronium-counterion water transport number, and those to follow, are ascertained by measuring the OCV as a function of the water-vapor RH ratio between the working and reference electrodes. We note that these correspond to in-plane transport numbers.
3,59
is the water activity in phase i controlled by exposure to water vapor of known RH. Equality of water activity, signifying equilibrium, is imposed between the membrane phase and water vapor on each side. For an isothermal membrane, the ratio of upstream and downstream water activities is given by the ratio of the corresponding RHs. Thus, the hydronium-counterion water transport number, and those to follow, are ascertained by measuring the OCV as a function of the water-vapor RH ratio between the working and reference electrodes. We note that these correspond to in-plane transport numbers.
3,59

Figure 1. (a) Schematic of the microelectrode cell. (b) Thermodynamic phase diagram used in the analysis of the OCV. Single vertical bars indicate a phase boundary and a wavy double bar indicates where the water activity changes in the membrane.
Download figure:
Standard image High-resolution imageEquation 6 demands isothermal cell operation with condensation of water on the upstream membrane side and vaporization on the downstream membrane side. Gas convection and small counter-electro-osmotic water flows justify this assumption. The membrane is also assumed homogeneous with membrane charge and neutralizing counterions uniformly distributed spatially. In addition, the membrane must be a single-neutralizing ion-exchange form. Hydrogen partial pressures on each side of the membrane do not appear in Eq. 6 because equal composition of hydrogen gas is supplied to both the working and reference electrode chambers. Partial pressure differences caused by different humidities are not significant, as calculated from the Nernst equation.
Sodium-form Nafion
Transport numbers of single cations other than hydronium can likewise be quantified by Eq. 3 even in the absence of electrode reactions (e.g., sodium ions). In this situation, the completely polarized electrodes sense the electric potentials enforced at the boundary between the electrode surface and the membrane. We report results below for the water transport number of sodium ions in Nafion 211. Implicit is the assumption that the sodium does not react at the electrode surface.
HEM
When an AEM is in the single hydroxide-exchanged form, i.e., HEM, the hydrogen-oxidation reaction 8 is

and thus different than that for a PEM. This reaction necessitates a different expression for the OCV than that used in the hydrogen-ion PEM case. We extend the framework of Fuller and Newman 38 to arrive at

where x is the coordinate parallel to the membrane between the two electrodes with subscript phases defined in Fig. 1, and  is the electrochemical potential of species i. Water is given the subscript 0. The last term on the right involving the water gradient arises from the alkaline reaction equilibrium in Eq. 7.
Zero current 38 of hydroxide ion demands that

where  is the transport number of water in a HEM and
  is the valence of hydroxide ion. Substitution of Eq. 9 into Eq. 8 and differentiation results in the desired expression for the hydroxide-ion water transport number

This result has previously been derived by Wang et al. 49 and Roy. 50
Carbonate and bicarbonate-form AEMs
In the presence of atmospheric carbon dioxide, alkaline AEMs can transform into multi ion-exchange forms of hydroxide, bicarbonate, and carbonate counter ions. Accordingly, we desire the water transport numbers of bicarbonate and carbonate ions in addition to that of hydroxide ion. However, the general multi-ion case is highly involved and requires additional unavailable transport parameters. 60 To simplify the analysis, we ion exchange the AEMs into predominately bicarbonate or carbonate forms where each counter ion is present singly. By analogy to Eq. 9, we write for bicarbonate and carbonate ions, respectively, that

and

When AEMs are either in the carbonate or bicarbonate forms, the reaction at the electrode remains the same as Eq. 7, as the system is still alkaline, and thus Eq. 8 still holds. However, the primary mobile ion is no longer hydroxide but is either bicarbonate or carbonate. From Eqs. 1 and 2, respectively, the hydroxide electrochemical potential in Eq. 7 is replaced by either that of bicarbonate or carbonate species. Upon neglect of the small quantity of dissolved carbon dioxide, one finds that

or

for bicarbonate and carbonate ions, respectively. These expressions follow from the criteria for carbonate chemical-reaction equilibria, and the derivation can be found in SI. Following the development above for HEM, Eqs. 13 and 14 are sequentially substituted into Eq. 8 and the result differentiated to yield

and

for bicarbonate and carbonate water-transport numbers, respectively.
To evaluate the various water transport numbers as a function of water content, a differential approach is used with Eqs. 6, 10, 15, or 16. In previous studies, an integral method was used to evaluate the water transport number, i.e., the reference side was held at one RH and the working side varied over the entire tested range of RHs. 38 The water-transport number was then evaluated from the slope of the data over the entire range of water contents. Herein, differential measurements were used as described above, where the reference-side RH was held at discrete points and the working-side RH was varied in a small range around this value. To quantify the water-transport number as a function of water activity, measured OCV data were plotted versus the natural logarithm of RH (i.e., water activity) and the local slopes calculated. Figure S2 in SI illustrates the procedure. Differential data analysis better accounts for the variation of the water transport number with water content as it minimizes the magnitude of the water diffusion gradient and error caused by overly large gradients, especially with properties dependent on membrane water content, and also better represents a quantitative water transport number. However, this approach also results in inherently more data scatter and error, as the fewer data around each reference RH datum results in more variability in slope (due to intrinsic variability in RH measurement), as documented in Fig. S2. Figure S3 reports typical error bars in water transport numbers for counterions in AEMs; similar data scatter was witnessed for Nafion.
Results and Discussion
Verification of experimental technique
To validate the microelectrode experimental apparatus and interpretation scheme, measurements were performed with the hydronium ion in Nafion 211 at 20 °C. Results are shown as filled circles in Fig. 2a compared with existing literature (remaining symbols). 38,42,43 All reported water contents in Fig. 2 and in subsequent figures are the average between the working and reference electrodes. Measured water transport numbers increase from approximately 1.3 at low membrane water contents to nearly 2 at high water contents, or 1.3 to 2 water molecules moving per proton migrated. An increase is expected as higher water contents raise the availability of free water in the membrane, 3 which then migrates with the counterion via electro-osmosis. With less free water, the solvation shell of the protons may not be fully filled, resulting in the lower measured water transport numbers. Our measured values are somewhat higher than previously reported, with a previous Nafion-211 maximum in water vapor reported as ∼1.4. 3,38 Membranes used in these studies were pretreated using different techniques—nitric acid and boiling in this work, whereas Fuller and Newman pretreated with sulfuric acid, which could contribute to the observed diference. 38 Cell design differences between studies are another possible source of the difference in reported values.

Figure 2. (a) Measured water transport number of hydronium ion in Nafion 211 at 20 °C (black circles) compared to literature sources (colored symbols) as a function of membrane water content. 38,42,43 (b) Measured water transport number of hydronium ion in Nafion 211 at 20 °C and 50 °C as a function of membrane water content. 3 Values reported at 50 °C are the average of three trials.
Download figure:
Standard image High-resolution imageThe proton water transport number of Nafion 211 at 50 °C is compared to that at 20 °C in Fig. 2b. There is a modest increase in the water transport number from a high of 2 at 20 °C to approximately 3 at 50 °C. This result is somewhat higher than expected based on prior studies of the water transport numbers for Nafion. 44–46 In those studies over the same temperature range, the water transport numbers increased ∼20% for liquid-equilibrated Nafion. It has been shown that the primary solvation shell of aqueous ions does not change significantly in this temperature regime. 61,62 As a result, it is likely that only the secondary solvation shell (i.e., long-range interactions) is impacted by the increasing temperature. We suggest that at higher temperature, local water viscosity in the secondary shell around each ion is relatively smaller than that at lower temperature leading to lessened viscous forces on the primary shell and more water transporting with the migrating ion. Additional analysis of temperature effects in the AEMs is addressed below.
Water transport number of AEMs
Understanding water uptake of the different ion-exchange forms of Versogen is requisite to describe fully how the water transport number changes with RH. The water uptake of Nafion as a function of RH is well-studied. 3,48,63,64 Likewise, water uptake in hydroxide and carbonate forms of Sustainion is available. 21 Figure 3 shows our measurement of water uptake of hydroxide-form Versogen (solid line) as a function of RH, compared to available literature data for carbonate and bicarbonate forms (dashed and dotted lines). 13 Literature results were performed in the same research group in a prior study with procedures consistent with those used in this work. The water uptake for the hydroxide counterion is slightly lower than that of carbonate and bicarbonate counterions, which, in turn, are almost identical. 13 It should be noted that water uptake is defined here as per fixed functional group—if defined per transport ion, the water uptake values for carbonate will be half that displayed in Fig. 3.

Figure 3. Water content of the different ion-exchanged forms of Versogen as a function of RH at 25 °C. Carbonate and bicarbonate results (blue dashed and black dotted lines) are from Luo et al. 13
Download figure:
Standard image High-resolution imageFigure 4a demonstrates the water transport number for hydroxide and carbonate ion-exchange forms of Versogen as a function of membrane water content at 50 °C (Fig. 4a can be found as a function of RH in Fig. S4 in SI). Carbonate-form Versogen has the highest water transport number at all water contents, ranging from ∼3 to ∼11, with the difference between ion-types more pronounced at higher water contents. Hydroxide form consistently has the lowest water transport number, ranging from ∼0.5 to ∼6, with bicarbonate-ion form falling between carbonate- and hydroxide-form values. The values for all ions in Versogen are similar to that for protons in Nafion at low water content and exceed that of protons at high water content. A similar trend is seen for Sustainion in Fig. 4b, with the water transport number for the carbonate species typically higher than the hydroxide counterion, particularly at high water content. The carbonate and hydroxide forms of Versogen are given with error bars in Fig. S3. These error bars are somewhat large, particularly at high water content, and are likely due to two primary factors. The first is the nature of small-interval slope measurements, as mentioned previously, which gives rise to larger error bars. The second is water-droplet formation at high water content (RH). Water droplets result in significant variation in the OCV as a function of time, making it difficult to discern the OCV at a given RH. Even very small quantities of liquid water disturb the measurement.

Figure 4. (a) Water transport numbers for hydroxide (red squares), carbonate (blue triangles), and bicarbonate (black diamonds) forms of Versogen as a function of water content at 50 °C. Subscript A represents a generic anion. (b) Water transport numbers of hydroxide (red squares) and carbonate (blue triangles) forms of Sustainion versus water content at 50 °C.
Download figure:
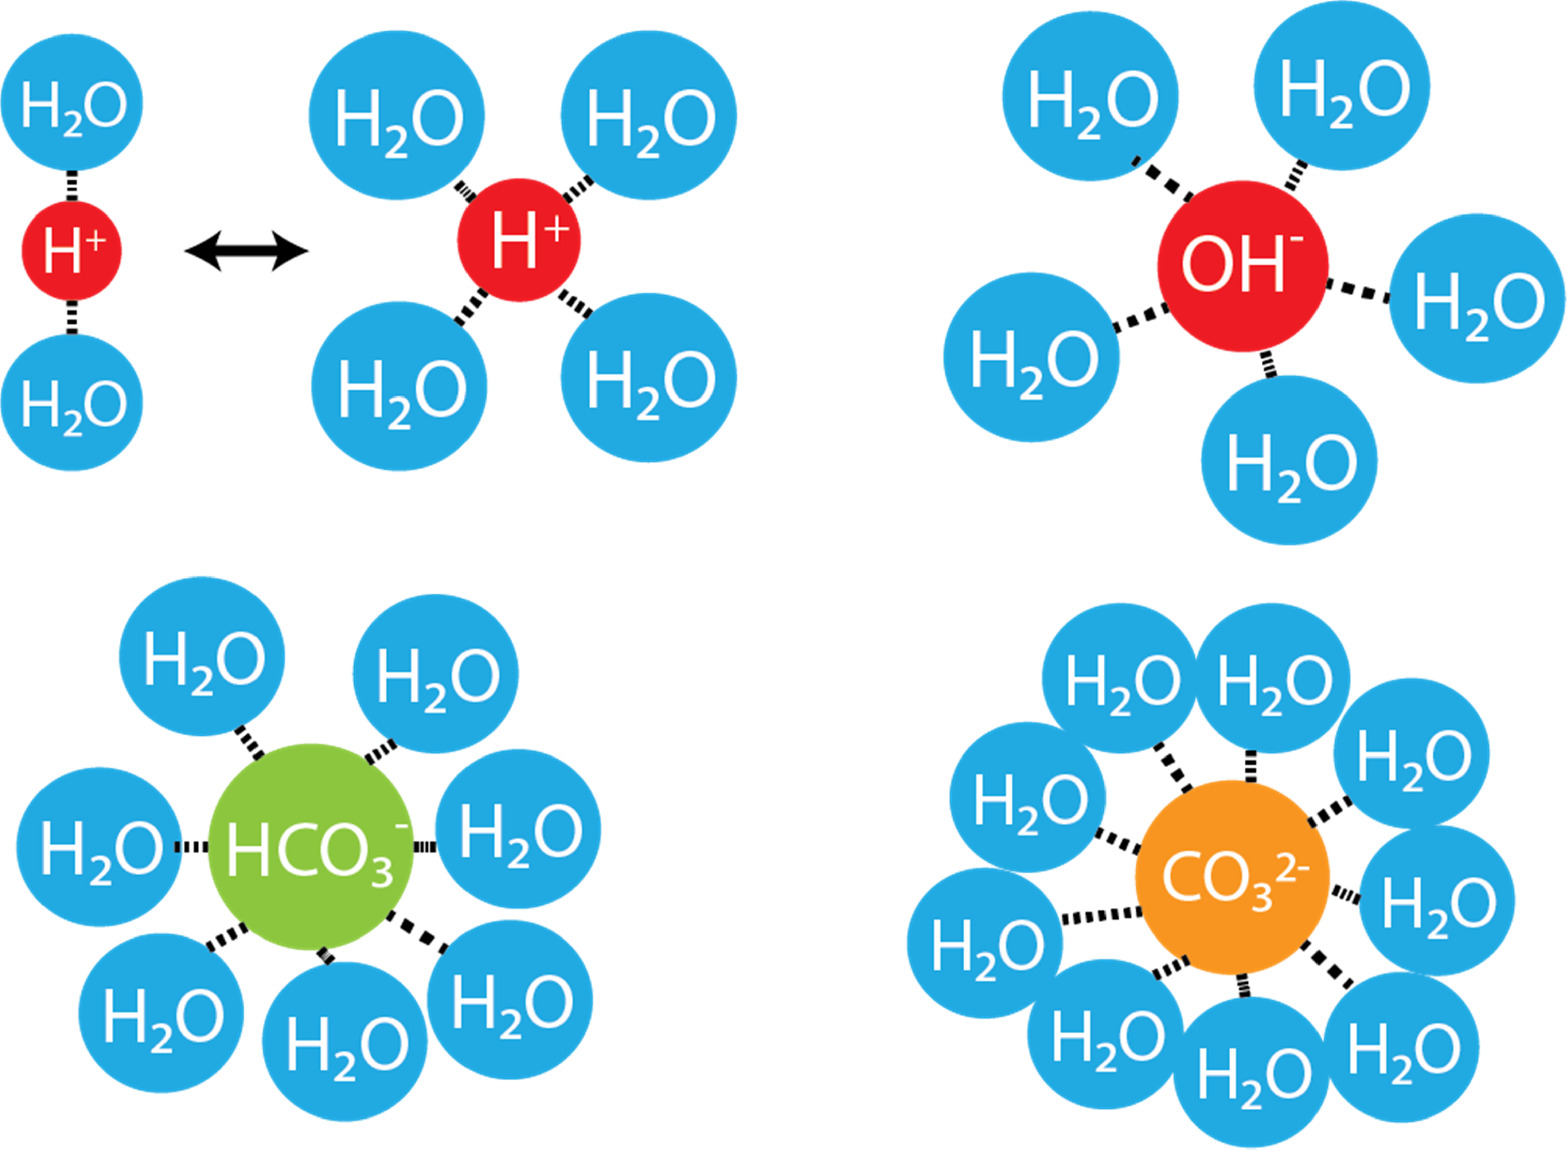
Standard image High-resolution imageThe origin of the differences in water transport number between specific ion forms is likely related to the solvation shells of the different ions. One interpretation of water transport number is that the amount of water dragged by an ion as it migrates is at least partially related to the water complexed around the ion in its solvation shells. 3 In this case, the transported solvation shell of protons is 2 or 4 waters, hydroxide ion is 4 or 5 waters, bicarbonate is 6-7 waters, and carbonate is 8-9 waters, as depicted in Fig. 5. 65–68 With this framework, the origin of the trend with ion type becomes clear: the larger is the number of water molecules solvated around an ion, the larger is the amount of water transported via electro-osmosis. The results indicate that the ion water transport numbers exceed the hydration number of the first solvation shell at high water content. Likely, this is due to the impact of secondary solvation shells and the presence of more free water with higher water uptake. 3 The solvation shells listed above are primary solvation shells only, and do not consider long-range interactions, such as water outside the primary solvation shell transporting with the moving shell due to viscous effects, which would increase the measured water transport number. The carbonate ion, in particular, appears to transport water in amounts far exceeding that of its first solvation shell (multiplying the values in Figs. 4a and 4b by the valence yields a value of 20–24 water molecules transported per carbonate ion in Versogen, for example). Although this result is somewhat surprising, it is known that carbonate ions impact surrounding water molecules beyond the primary solvation shell. 67 In addition, divalent ions (e.g., Ni2+, Cu2+) have similarly high electro-osmotic coefficients in Nafion, and thus transport similar large quantities of water. 69,70 Our results for the divalent carbonate ion in AEMs are roughly in line with those for divalent ions in Nafion. 69,70

Figure 5. Schematic of the primary solvation shells of protons, hydroxide, bicarbonate, and carbonate ions.
Download figure:
Standard image High-resolution imageTo verify that the origin of differences in water transport number between Nafion and the AEMs is primarily related to solvation shells, and not membrane microstructure, the water transport number of proton-form Nafion is compared in Fig. 6a with sodium-form Nafion and proton-form sulfonated polystyrene (PSS) (a non-phase-separated PEM) as a function of RH at 50 °C. 20 Proton PSS exhibits a water transport number equal to or slightly less than that of proton Nafion 211 at all RHs; transport numbers for PSS at high humidity are not shown due to membrane dissolution under those conditions. In contrast, sodium-form Nafion exhibits a water transport number of up to 8 at high humidity, greatly exceeding that of proton-form Nafion. Sodium ions display a solvation shell of 6 waters, again larger than that of a proton. 71 The only ion/membrane combination that transports less water than its ion solvation shell at high water content is protons in PEMs. This is likely due to Grotthüss hopping that protons undergo in a hydrogen-bonded water network at high membrane water contents. 72 Any proton that moves via hopping does not transport water with it, reducing the measured transport number compared to that of an ion that only moves vehicularly. Taken together, ion solvation shells are the primary driver of differences in water transport numbers between membranes (see Fig. 6b) as the impact of membrane microstructure appears smaller, with the lack of phase separation appearing to dampen slightly the transport number, in agreement with prior studies examining the water transport numbers in hydrocarbon-based membranes that similarly lack phase separation. 73,74

Figure 6. (a) Water transport numbers of sodium-form Nafion (black diamonds), proton-form Nafion (inverted blue triangles), and proton-form sulfonated polystyrene (red circles) as a function of RH at 50 °C. PSS coefficients are omitted at high RH due to membrane dissolution. Subscript C denotes a generic cation. (b) Water transport numbers of different ions are compared with the solvation shell size at high water content. Values of the transport number shown are the average of the two high water content values (e.g., see Fig. 6a) for Nafion and Versogen at 50 °C for cations and anions, respectively.
Download figure:
Standard image High-resolution imageImpact of temperature on the water transport number in AEMs
Most electrochemical devices do not run solely at 50 °C. Accordingly, it is of interest to determine how the water transport number varies with temperature. Figures 7a and 7b report the influence of temperature on water transport numbers for both the carbonate and hydroxide forms of Versogen as a function of RH. There appears to be a weak but inconsistent increase in water transport number with temperature, suggesting that the impact of temperature is limited. This assertion is supported by examining the activation energies of the transport number: 5 and –166 J/mol for carbonate form at low and high water contents, respectively, and 153 and 705 J/mol for hydroxide form at low and high water content, respectively. Three of the four activation energies indicate weak increases with temperature, whereas the activation energy of electro-osmosis in high water content carbonate form actually demonstrates a weak decrease with temperature; the large amount of scatter in the data prevents drawing definitive physical conclusions.

Figure 7. Water transport numbers in the (a) carbonate and (b) hydroxide forms of Versogen, respectively, as a function of RH and temperature (blue triangles, black diamonds, red squares, and magenta circles are 30, 40, 50, and 70 °C, respectively).
Download figure:
Standard image High-resolution imageCorrelation of water-transport parameters
To correlate different transport properties, especially for cases where there is a lack of experimental data, a model is developed for the water transport number. The Stefan-Maxwell-Onsager framework of frictional interactions between chemical species in a membrane is pertinent for electro-osmotic phenomena. 75,76 A detailed description of the model can be found in section 1.4 of SI, where we expand upon the specific adaptation of Crothers et al. 76,77 In the Stefan-Maxwell framework of multicomponent diffusion, the water transport number is defined as 38,77

where Lij
is the binary interaction parameter between species i and species j. As outlined in section 1.4 of SI, we estimate  and
and  by calculation of binary-species friction coefficients.
77
In this approach, the ion-water friction coefficient is determined by scaling the microscale friction coefficient obtained from a Stokes-Einstein estimate of the ion-water binary diffusion coefficient to account for temperature and viscosity.
76,77
The water-membrane and ion-membrane friction coefficients are determined from Darcy's law for porous-media flow following the work of Crothers et al.
76,77
This procedure yields
by calculation of binary-species friction coefficients.
77
In this approach, the ion-water friction coefficient is determined by scaling the microscale friction coefficient obtained from a Stokes-Einstein estimate of the ion-water binary diffusion coefficient to account for temperature and viscosity.
76,77
The water-membrane and ion-membrane friction coefficients are determined from Darcy's law for porous-media flow following the work of Crothers et al.
76,77
This procedure yields

for the transport number, where ci
is the interstitial concentration of species i,  is the effective viscosity of water in the membrane, wi
is the mass fraction of species i, cT
is the total concentration, Di0
is the binary diffusion coefficient between species i and water, ϕ is the water volume fraction, τ is the tortuosity, and k is the Darcy permeability. Equation 18 is used here to correlate experimental water transport number results with other useful membrane parameters. All experimental results used in this section correspond to 50 °C. In all cases, curves are calculated at a few discrete datum points.
is the effective viscosity of water in the membrane, wi
is the mass fraction of species i, cT
is the total concentration, Di0
is the binary diffusion coefficient between species i and water, ϕ is the water volume fraction, τ is the tortuosity, and k is the Darcy permeability. Equation 18 is used here to correlate experimental water transport number results with other useful membrane parameters. All experimental results used in this section correspond to 50 °C. In all cases, curves are calculated at a few discrete datum points.
Two unknown parameters assess the water transport number using the Stefan-Maxwell formulation in Eq. 18: the Darcy absolute permeability of water in the membrane (k) as a function of water content and the power-law parameter  in Archie's law for membrane tortuosity (see Eq. S9,
  where τ is the membrane tortuosity and
  is the water volume fraction).
78
Because there is one permeability for each experimental water-content datum, plus an unknown tortuosity power-law index, additional information is needed to quantify the transport numbers. For Nafion membranes, literature water transport coefficients, representing water flow in response to a chemical potential gradient, are available and are converted to a Darcy permeability and inserted into the model.
3,24,79
The
is the water volume fraction).
78
Because there is one permeability for each experimental water-content datum, plus an unknown tortuosity power-law index, additional information is needed to quantify the transport numbers. For Nafion membranes, literature water transport coefficients, representing water flow in response to a chemical potential gradient, are available and are converted to a Darcy permeability and inserted into the model.
3,24,79
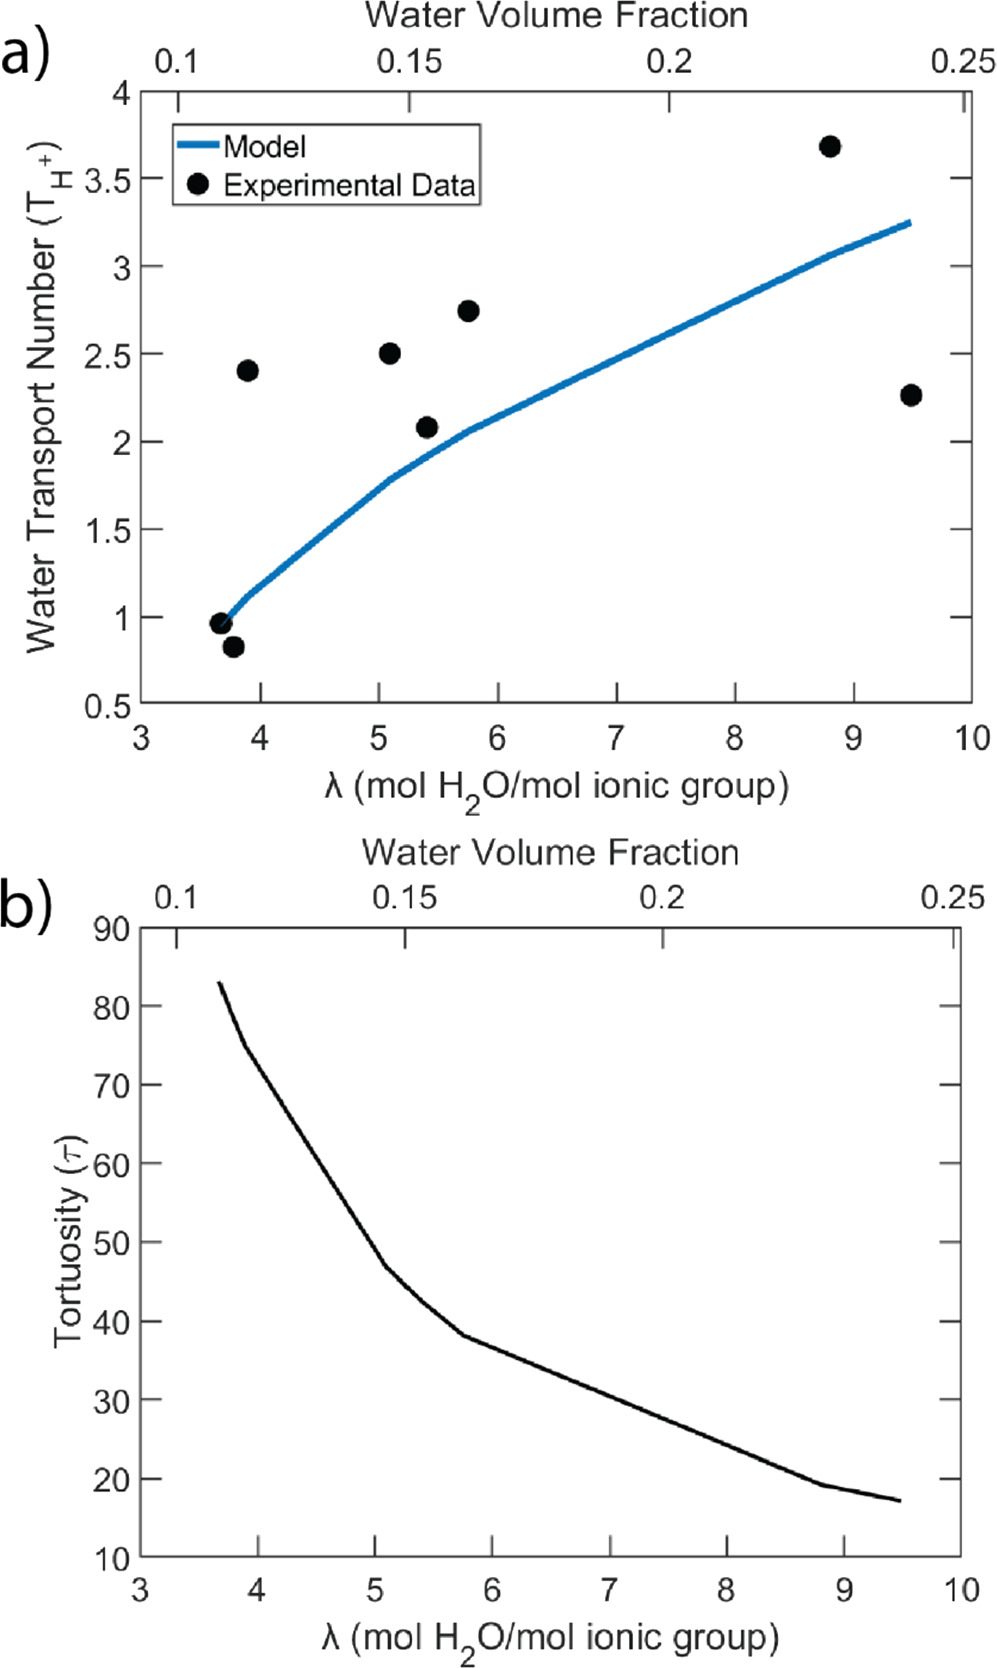
The  parameter was varied over a physically acceptable range to arrive at a value of approximately 2. The solid line in Fig. 8a compares the water transport number calculated via this approach with the experimental data from Nafion 211. Over the range of water contents examined, the fit of the proton transport number is good, with a maximum deviation of ∼33%, although it is typically less (there is also a point with much higher deviation at low water content). Figure 8b shows the resulting tortuosity as a function of water content, which decreases with increasing hydration as expected, although it is somewhat high compared to models in previous literature.
76,77,80
Nevertheless, the Archie law power index of 2 is well within the physical range determined for other porous media.
81
Further, the tortuosity of liquid-equilibrated Nafion (λ = 22) is approximately 5.5 when using
parameter was varied over a physically acceptable range to arrive at a value of approximately 2. The solid line in Fig. 8a compares the water transport number calculated via this approach with the experimental data from Nafion 211. Over the range of water contents examined, the fit of the proton transport number is good, with a maximum deviation of ∼33%, although it is typically less (there is also a point with much higher deviation at low water content). Figure 8b shows the resulting tortuosity as a function of water content, which decreases with increasing hydration as expected, although it is somewhat high compared to models in previous literature.
76,77,80
Nevertheless, the Archie law power index of 2 is well within the physical range determined for other porous media.
81
Further, the tortuosity of liquid-equilibrated Nafion (λ = 22) is approximately 5.5 when using  which is quite reasonable based on correlation of membrane transport properties to bulk values (e.g., comparing water diffusion in the membrane to bulk water diffusion gives a tortuosity around one order of magnitude), as well as more complex multi-scale transport models.
3,77,81
The water transport coefficients and Darcy permeabilities used from literature are presented as a function of water volume fraction in Fig. S5.
which is quite reasonable based on correlation of membrane transport properties to bulk values (e.g., comparing water diffusion in the membrane to bulk water diffusion gives a tortuosity around one order of magnitude), as well as more complex multi-scale transport models.
3,77,81
The water transport coefficients and Darcy permeabilities used from literature are presented as a function of water volume fraction in Fig. S5.

Figure 8. (a) Water transport number for Nafion 211 as calculated from the friction coefficient model at 50 °C. The solid line represents the model prediction (blue) compared to experimental data (black circles). (b) Calculated tortuosity of the Nafion 211 as a function of water content and water volume fraction with 
Download figure:
Standard image High-resolution imageThe acceptable fit of the water transport number and the magnitude of the tortuosity for Nafion PEM suggest that the proposed model may be accurately applied for Versogen AEMs. Literature water transport coefficients are not available for Versogen. We thus adopt a different approach. To determine Versogen tortuosity, a reasonable range of  parameters is considered, with that used for Nafion (
 ) as the maximum and the value calculated from the tortuosity of a liquid-equilibrated hydrogel with similar water uptake as Versogen as the minimum (
 ).
82
The latter value is reasonable because Versogen has a domain-network architecture similar to a hydrogel, as opposed to a phase-separated Nafion, as demonstrated by Fig. S7 in SI.
13,83,84
A total of 5 different
).
82
The latter value is reasonable because Versogen has a domain-network architecture similar to a hydrogel, as opposed to a phase-separated Nafion, as demonstrated by Fig. S7 in SI.
13,83,84
A total of 5 different  values are chosen in the 1.3 to 2 range. The water transport number is then fit by nonlinear least-squares to extract the Darcy permeability as a function of water content.
Figures 9a–9c give the water transport number, Darcy permeability (k), and tortuosity for hydroxide-form Versogen, respectively, as a function of water content. Each curve represents one  parameter. The fit in Fig. 9a is good and independent of the
  -value chosen. Corresponding Darcy permeability and tortuosity increase and decrease, respectively, with water content in all cases. Figures 9b and 9c also reveal that permeability and tortuosity are inversely proportional: more tortuous transport pathways result in less water transport. The permeability of Versogen appears to be higher than that of Nafion, with the vapor-equilibrated Versogen permeability at high water content approximately equivalent to that of liquid-equilibrated Nafion.
85
This finding is likely caused by the fact that Versogen has a higher water volume fraction (calculated assuming additive molar volumes) than does Nafion at the same water content due to the significantly lower equivalent weight and lower dry density of Versogen.
3,13
A higher water volume fraction lowers tortuosity and increases permeability. It is also likely that the more hydrogel-like structure enables faster water movement than in the phase-separated Nafion where such transport occurs only within the hydrophilic nano-domains. The calculated water transport coefficients are also shown as a function of water volume fraction in Fig. S6 in SI.
-value chosen. Corresponding Darcy permeability and tortuosity increase and decrease, respectively, with water content in all cases. Figures 9b and 9c also reveal that permeability and tortuosity are inversely proportional: more tortuous transport pathways result in less water transport. The permeability of Versogen appears to be higher than that of Nafion, with the vapor-equilibrated Versogen permeability at high water content approximately equivalent to that of liquid-equilibrated Nafion.
85
This finding is likely caused by the fact that Versogen has a higher water volume fraction (calculated assuming additive molar volumes) than does Nafion at the same water content due to the significantly lower equivalent weight and lower dry density of Versogen.
3,13
A higher water volume fraction lowers tortuosity and increases permeability. It is also likely that the more hydrogel-like structure enables faster water movement than in the phase-separated Nafion where such transport occurs only within the hydrophilic nano-domains. The calculated water transport coefficients are also shown as a function of water volume fraction in Fig. S6 in SI.

Figure 9. (a) The model fit of the water transport number of hydroxide-form Versogen (blue line) compared to experimental data (black circles) as a function of water content and water volume fraction at 50 °C. (b) Darcy permeability for hydroxide-form Versogen as a function of water content and water volume fraction at 50 °C. (c) Calculated tortuosity of the Versogen membrane as a function of water content and water volume fraction. Values of  (Archie's Law parameter) are, in order, 1.30, 1.4, 1.65, 1.82, and 2.
Download figure:
Standard image High-resolution image
Actual Versogen tortuosity and Darcy permeability are expected to lie between the two extremes in Fig. 9, highlighting the importance of independent verification of either Darcy permeability or tortuosity. Nevertheless, the values of the permeability across the investigated range of tortuosities are within an order of magnitude of each other at high water content (the most likely condition for device operation), and thus useful as an initial estimate of the water transport parameters in the absence of data. The tortuosity can be used to study other, related physical properties of the membrane by applying other membrane models that rely on tortuosity, such as those used for hydrogels. 86–88 The water permeability can be used to determine more accurate water balances in AEM fuel-cell and electrolyzer models, 89,90 thereby improving predictions of device performance.
Conclusions
Water transport numbers of Versogen and Sustainion AEMs in multiple single ion-exchange forms are measured using an extension of the Fuller-Newman electrochemical technique 38 and correlated to water content via measured water uptake at different relative humidities (RHs). In general, carbonate counterion has the highest transport number (ranging from ∼3 to ∼11 in Versogen) and hydroxide the lowest (∼0.5 to ∼6), over an RH range of 50 to 90%. This finding is likely due to differences in solvation-shell size between these two ions, as confirmed by examination of the Na-form of Nafion and H-form of PSS exchange membranes. Temperature does not have a significant impact on the measured water transport number in the range (30 °C–70 °C) studied. A range of Darcy permeability values of Versogen was obtained from a Stefan-Maxwell-Onsager friction-coefficient framework. Membrane permeability is higher in non-phase-separated gelatinous Versogen than in (nano)phase-separated Nafion, likely due to the higher water volume fraction of Versogen at similar water content (reducing tortuosity and increasing permeability) and more hydrogel-like structure of Versogen. Ion-water transport numbers and Darcy permeabilities obtained in this study are useful for predicting more accurate water balances in AEM-based fuel cells and electrolyzers. The relatively high values of the transport number emphasize the importance of electro-osmosis in AEMs relative to PEMs, and highlights how it must be considered when studying the water balance in AEM systems.
Acknowledgments
The authors thank Dr. Andrew Tricker for fabrication of Versogen GDEs. This work was performed under the HydroGEN Consortium, U.S. Department of Energy, Office of Energy Efficiency and Renewable Energy, Hydrogen and Fuel Cell Technologies Office under contract number DE-AC02–05CH11231.
Supplementary data (1.1 MB PDF)
Supplementary data (0.1 MB XLSX)