

Abstract
A total number of 25 different types of prismatic lithium-ion cells with a capacity between 8 and 145 Ah are examined in an autoclave calorimetry experiment in order to analyze their behavior during thermal runaway (TR). The safety relevant parameters such as mass loss, venting gas production and heat generation during TR are determined in two experiments per cell type and the results are compared to literature. An approximately linear dependency of the three parameters on the cell capacity is observed and hence correlations are derived. Due to the wide range in cell properties the correlations can be used as input for simulations as well as to predict the behavior of future battery cells within the property range of those tested and therefore contribute to the design of a safer battery pack.
Export citation and abstract BibTeX RIS

This is an open access article distributed under the terms of the Creative Commons Attribution 4.0 License (CC BY, http://creativecommons.org/licenses/by/4.0/), which permits unrestricted reuse of the work in any medium, provided the original work is properly cited.
One of the top barriers to purchasing an electric vehicle (EV) is the fear of customers to run out of power. 1 This reinforces the manufacturers of EVs to continuously enhance the range of their products: by now several EVs with a range of more than 300 miles have been announced. 2–5 This is achieved by the usage of battery cells with high energy density. The major safety issue of high energy batteries is the thermal runaway (TR) that can occur e. g. as a result of a traffic accident or a failure during the charging process. 6 Therefore, many researchers investigate the behavior of battery cells under certain abuse conditions with experimental and numerical methods.
On pack level the work focuses on the thermal propagation (TP) behavior and possible mitigation strategies. 7–10 On single cell level one objective is to get a better understanding of the TR process for example via X-ray imaging and tracking internal temperatures. 11 Other publications aim to determine safety relevant parameters such as mass loss, 12–16 onset temperature, 12,13,17–20 energy release, 15,16,21–26 venting gas composition and generated gas amount during TR. 12,13,19,20,27,28 It turned out that these parameters depend, among other things, on cell chemistry, 16,20,22,23,25,29 cell format, 19,27 trigger method 12,19 and state-of-charge. 13,15,29,30 The experimental results are widely used as input parameters or validation data for simulation models. 17,18,26,28 The latter support engineers to gain further insight into the TR and TP process and consequently are an important tool in the development and design process of safe battery packs.
This publication focuses on the TR behavior of prismatic lithium-ion batteries over a wide capacity range (8 Ah to 145 Ah). The objective is to derive empirical correlations of important parameters such as mass loss, amount of vented gas and generated heat during TR. The correlations can be used to determine crucial input parameters for simulation models as well as to predict the behavior of battery cells within the property range of those tested. To the author's knowledge, comparative analyses of a large number of state of the art automotive lithium-ion batteries have not been the subject of any scientific publication, especially over a wide capacity range and with capacities up to 145 Ah. Therefore, the results of this study contribute to the design of a safer battery pack.
Experimental
A total number of 50 prismatic lithium-ion cells (25 different types—2 tests each) is triggered into TR by nail penetration in order to investigate the TR behavior and identify dependencies of important parameters. The cells are integrated into an insulated copper block that itself is inside an autoclave as presented by Scharner in Ref. 21. Therefore, it is possible to quantify not only the mass loss and the amount of generated venting gas but also the generated heat. After one of the 50 tests a sample of the generated venting gas is analyzed via gas chromatography to identify the gas composition. This gas composition is assumed to be representative for all tests.
Autoclave calorimetry setup
Figure 1 shows the autoclave calorimetry setup. The tested battery cell (blue) is wrapped in a silicate fiber fabric (purple—thermal control) and integrated into a copper block (orange). The purpose of the thermal control is to prevent high heat fluxes between cell and copper block that could alleviate the TR reaction. The thickness of the fabric (ThermTextil® TT1200) is 2.3 mm, whereas the dimensions of the cavity inside the copper block are 1.75 mm bigger as the nominal cell dimension in each direction. This results in a compression of the silicate fiber fabric and therefore a tight fit of the cell in the copper block. The copper block itself is also insulated (yellow—PROMALIGHT®-1000X) to ensure a minimal heat transfer from the copper block to the autoclave environment. The thermal insulation has an opening above the vent of the battery cell to provide a flow path into the autoclave's void volume for the generated venting gas and particles. The cell is triggered into TR via nail penetration through another opening in the thermal insulation as well as in the copper block. Therefore, a steel nail with 3.2 mm diameter and 60° nail tip angle is used. The depth of the penetration is 15 mm in the center of the large side with a penetration speed of 80 mm/s. All tests are conducted under inert atmosphere (argon).
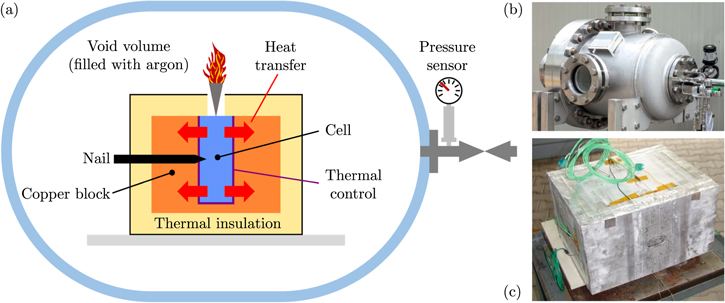
Figure 1. (a) Scheme of the autoclave calorimetry setup. (b) Full view of the autoclave. 21 (c) Insulated copper block with implemented cell. 21
Download figure:
Standard image High-resolution imageMeasured parameters and evaluation methodology
Table I summarizes all measured parameters before, during and after the autoclave calorimetry test. Before each test a preconditioning cycle is performed with each cell to ensure an adequate stabilization of the battery performance and to measure the cell capacity Ccell. During this process the following steps are repeated three times at room temperature:
- charging of the cell with the constant current constant voltage (CCCV) charging method,
- pause for 30 minutes,
- discharging of the cell with a constant current of Ccell,nominal/3, where Ccell,nominal is the cell's nominal capacity specified by the manufacturer,
- pause for 30 minutes.
Afterwards, the cell capacity Ccell is determined by the mean value of the three discharging cycles. Prior to the test the cell is charged to a state of charge of SoC = 100% with the CCCV charging method and a CV phase of 12 h. In addition, the weight of the copper block mCu and the cell mcell is measured before the test as well as the weight of the cell  after the test. The mass loss during TR Δmcell is then calculated by

Table I. Measured parameters before, during and after the autoclave calorimetry test.
| Parameter | Symbol | Unit | Frequency | Comment |
|---|---|---|---|---|
| Autoclave pressure | pgas | Pa | 100 Hz | 1 position |
| Cell can temperature | Ti,cell | °C | 1 Hz | 5 positions |
| Copper block temperature | Ti,Cu | °C | 1 Hz | 5 positions |
| Gas temperature | Tgas | °C | 1 Hz | 1 position |
| Capacity | Ccell | Ah | mean value | preconditioning |
| Copper block mass | mCu | kg | single value | before test |
| Pre cell mass | mcell | kg | single value | before test |
| Post cell mass |

| kg | single value | after test |
During the test the gas pressure pgas and temperature Tgas are measured. The generated venting gas ngas can then be calculated by applying the ideal gas law:

where Vvoid is the void volume inside the autoclave, R is the gas constant and ninit is the initial amount of gas at the start of the experiment. The void volume is determined by

where Vautoclave = 157.65 ℓ is the inner volume of the autoclave and Vspecimen is the volume of the investigated cell, the copper block and its thermal insulation.
The ideal gas law (Eq. 2) only applies if the measured Tgas is the average gas temperature inside the autoclave. Due to the high local and temporal gradients inside the autoclave during the TR (and thus the venting process) this is not the case until the gas reaches a thermodynamic equilibrium state. As a consequence the gas amount calculated by Eq. 2 ngas,calc shows high deviations from the actual amount of gas present inside the autoclave ngas. In this study it is assumed that this deviation is acceptable as soon as the following criteria are fulfilled:


Figure 2 visualizes this definition. During the venting process the curve of ngas,calc shows a nonphysical behavior due to the measurement errors of Tgas. After the venting event the gradients decrease due to the approach of the gas to a thermodynamic equilibrium. In this study the temperature inside the autoclave is considered homogeneous when Eqs. 4 and 5 are fulfilled. In addition ngas,calc has to be either at a (local) maximum or in a decreasing state. This is verified by Eq. 6.
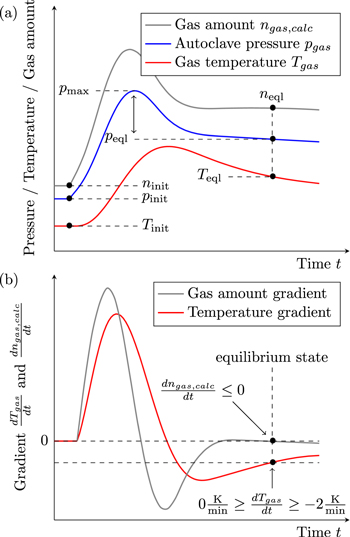
Figure 2. Evaluation methodology: (a) Sample curves of autoclave pressure pgas, gas temperature Tgas and the calculated gas amount ngas,calc. (b) Sample curves of gas temperature gradient dTgas/dt and gas amount gradient  with the criteria for the defined equilibrium state inside the autoclave.
Download figure:
Standard image High-resolution imageWith the calculated vented gas amount at the defined equilibrium state ngas,eql the vented gas mass mgas and the vented gas volume Vgas are determined by


with Mgas = 23.38 g mol−1 being the (assumed) average molar mass of the vented gas mixture and Vm,gas = 24.465 ℓ mol−1 being the molar volume of an ideal gas at 25 ◦C and 1 atm (SATP conditions). In this study the molar mass Mgas is determined in one of the test via gas chromatography (as shown below) and assumed to be constant for all cell types. With the total mass loss Δmcell and the vented gas mass mgas the vented particle mass is calculated by

With this definition "particles" also include liquid venting products or gaseous venting products that already condensed at the point of the defined equilibrium state.
The cell can temperature Ti,cell and copper block temperature Ti,Cu are monitored at several positions during the test as shown in Fig. 3. One sensor is placed in the center of each cell can side (circles). The sensor on the penetrated cell side is shifted in order to prevent a damage due to the nail (blue). Equivalent sensors are placed inside of the copper block (triangles). These are positioned at half of the block thickness in each dimension. As suggested by Scharner it is assumed that the total generated heat during TR Qtot is divided into two parts: heat that remains in the cell Q1 and heat that is transported by vented gas and particles Q2. 21 The remaining heat Q1 is calculated on the basis of a suggested formula in Ref. 21 as follows:

where cp,Cu and cp,cell are the specific heat capacities of the copper block and the cell, respectively,  is the maximum value (over time) of the mean over all temperature sensors in the copper block,
  is the mean over all cell can temperature sensors at the point in time of
  and
and  as well as
  are the initial values of the mean over all temperature sensors in the copper block and on the cell can, respectively. The heat that is transported by vented gas and particles Q2 cannot be directly measured with the autoclave calorimetry setup. Therefore, it is assumed that the generated heat per cell weight is constant and consequently Q1 correlates with the remaining mass in the cell
  , whereas Q2 correlates with the mass loss Δmcell.
21
This results in
, whereas Q2 correlates with the mass loss Δmcell.
21
This results in


Figure 3. Temperature sensor positions on cell can surface and inside the copper block.
Download figure:
Standard image High-resolution imageInvestigated cells
In total 25 different types of prismatic lithium-ion cells are tested in the autoclave setup described above. In order to cover a wide range in cell properties the investigated cells have different geometrical dimensions, exist of either LiNix Coy Alz O2 (NCA) or LiNix Mny Coz O2 (NMC) cathodes and contain an electrolyte consisting of lithium hexafluorophosphate (LiPF6) conducting salt with varying solvent concentrations of ethylene carbonate (EC), ethyl methyl carbonate (EMC), diethyl carbonate (DEC) and dimethyl carbonate (DMC). Table II gives an overview over the bandwidth of properties.
Table II. Properties of the tested battery cells.
| Parameter | Symbol & Range | Unit | ||
|---|---|---|---|---|
| Capacity | 8 ≤ | Ccell | ≤ 145 | Ah |
| Energy | 29 ≤ | Ecell | ≤ 535 | Wh |
| Weight | 246 ≤ | mcell | ≤ 2241 | g |
| Volume | 109 ≤ | Vcell | ≤ 973 | cm3 |
| Gravimetric energy density | 110 ≤ | ρgrav | ≤ 275 | Wh kg−1 |
| Volumetric energy density | 239 ≤ | ρvol | ≤ 662 | Wh ℓ−1 |
| State of charge (SoC) | 100% | — | ||
| Aging state | fresh, unused | — | ||
After one of the 50 tests a sample of the generated venting gas is analyzed with the gas chromatograph 8610C multigas analyzer of SRI Instruments (TCD and FID, second separation path with FPD/FID for e.g. analysis of organic carbonates) to identify the gas composition. This gas composition is assumed to be representative for all tests. For this analysis the vented gas products of a cell with a nominal capacity of 53 Ah, graphite anode, NMC111 cathode and electrolyte consisting of lithium hexafluorophosphate (LiPF6) conducting salt with ethylene carbonate (EC), dimethyl carbonate (DMC) and ethyl methyl carbonate (EMC) solvents in 1:1:1 composition is analyzed.
Results and Discussion
Two experiments were conducted in the autoclave calorimetry setup with every of the 25 types of prismatic lithium-ion battery cells. Each of the 50 cells was triggered into TR reproducibly by nail penetration. As observed in previous studies all cells showed the main effects of thermal runaway like cell voltage drop, self-heating of the cell, production of gas and particle ejection. 12–16,19–21,27,31 Safety relevant parameters such as mass loss, vented gas volume and generated heat during TR are analyzed depending on the capacity of the cells.
In the following plots the symbols (triangles and circles) represent the mean values of the two tests conducted with each cell type. The results of the two individual cell tests are visualized via error bars. Consequently, the greater the deviation of the error bars from the mean value, the greater the variance of the shown results of the two tests conducted with each cell type. If applicable, fits that follow the form of a linear equation y = m · x are used to show a linear dependency of the plotted parameters. In this case, the shaded area represents the 95% confidence interval of this linear fit.
Mass loss during TR
Figure 4 displays the mass loss during TR Δmcell (Fig. 4a) and the distribution of this mass loss (Fig. 4b) in vented gas mass mgas (red circles) and vented particle mass mparticles (gray triangles) over the cell capacity Ccell. The dashed or dashdotted lines represent linear fits of the data.

Figure 4. (a) Mass loss during TR Δmcell over cell capacity Ccell. The dashed line represents a linear fit with a slope of 7.05 g Ah−1. (b) Vented particle mass mparticles and vented gas mass mgas over cell capacity Ccell. The dashed lines represent linear fits with slopes of 5.00 g Ah−1 for mparticles and 2.05 g Ah−1 for mgas. The shaded areas show the 95% confidence intervals of the fits.
Download figure:
Standard image High-resolution imageFigure 4a shows a linear trend between Δmcell and Ccell. More precisely, Δmcell is on average 7.05 g Ah−1 (R2 = 0.88). The deviations between test results and linear fit tend to increase with Ccell. The origin of these deviations can be explained by separating Δmcell into vented particle mass mparticles and vented gas mass mgas as shown in Fig. 4b: On average Δmcell is distributed into 5.00 g Ah−1 particles (and liquid components) and 2.05 g Ah−1 venting gas. The determination coefficient of the linear fit R2 for mparticles is smaller (R2 = 0.80) as for mgas (R2 = 0.94), i. e. the variance of the vented particle mass is higher than the variance of the gas mass. In addition, the difference between two tests of the same cell type show a similar behavior. Therefore, it is hypothesized that the amount of vented gas is mainly dependent on Ccell and mostly independent from parameters as the (inner) cell design, whereas the amount of vented particles and consequently the mass loss during TR can be actively influenced up to a certain extent, e.g. by the vent size.
A comparison of the measured mass loss in this study with values from literature is given in Tab. III. Golubkov et al. investigated 11 prismatic 50 Ah cells within a sealed reactor in inert atmosphere using different thermal trigger methods. 12 The cells showed a mass loss from 10.3 to 12.4 g Ah−1 and therefore lost more mass than the cells in this study. Essl et al. used the same reactor setup and examined a 41 Ah pouch cell. 13 With a mass loss of 9.2 g Ah−1 the result is at the upper end of this study's range. A possible reason for this observation are the different trigger methods. In previous publications it is stated that nail penetrated cells show a lower mass loss in comparison to overheated cells. 19,31 Essl et al. explained this behavior with the "nail inside the cell [that] may have prevented further particle emission." 19 Diaz et al. observed a boiling of the (remaining) electrolyte solvents when opening the batteries after the nail-penetration test. 31 Both explanations are reasonable since during nail-penetration the nail gets stuck and hence prevents the inner cell parts from moving. With thermal triggering of the TR there are two sequences of gas venting: one minor venting before the TR due to the rising temperature inside the cell and one major venting when the TR occurs. 12 During nail-penetration tests there is no minor venting and therefore the vented gas amount may be lower.
Table III. Comparison of the mass loss during TR for different test setups.
| Reference | Investigated cells | Cathode material | Setup | Trigger | Ccell [Ah] | Δmcell [%] |
 [g Ah−1] [g Ah−1] |
|---|---|---|---|---|---|---|---|
| This study | 50 (prismatic) | NMC & NCA | autoclave | nail-pen. | 8-145 | 22%–67% | 4.8–9.1 |
| Golubkov et al. 12 | 11 (prismatic) | LMO | sealed reactor | over-temp. | 50 | 30%–37% | 10.3–12.4 |
| Essl et al. 13 | 1 (pouch) | NMC/LMO | sealed reactor | over-temp. | 41 | 43% | 9.2 |
| Larsson et al. 14 | 4 (prismatic) | NCA & unknown | oven | over-temp. | 6.6 | 22%–23% | 4.8 |
| Liu et al. 15 | 1 (18650) | NMC | open | over-temp. | 2.2 | 38% | 7.3 |
| Walker et al. 16 | 7 (18650) | NCA & unknown | open | over-temp. | 2.4–3.5 | 27%–79% | 5.4–12.9 |
| Essl et al. 19 | 2 (pouch) | NMC622 | sealed reactor | over-temp. | 60 | 56% | 8.1 |
| Essl et al. 19 | 2 (pouch) | NMC622 | sealed reactor | overcharge | 60 | 81% | 11.7 |
| Essl et al. 19 | 2 (pouch) | NMC622 | sealed reactor | nail-pen. | 60 | 47% | 6.8 |
| Essl et al. 19 | 2 (prismatic) | NMC622 | sealed reactor | over-temp. | 60 | 47% | 7.5 |
| Essl et al. 19 | 2 (prismatic) | NMC622 | sealed reactor | overcharge | 60 | 67% | 10.7 |
| Essl et al. 19 | 2 (prismatic) | NMC622 | sealed reactor | nail-pen. | 60 | 33% | 5.3 |
On the other hand, there are also experiments with a thermal trigger that show a similar mass loss as this study: Larsson et al. conducted oven tests with 6.6 Ah prismatic cells that showed a mass loss of 4.8 g Ah−1 which consequently are at the lower end of this study's results. 14 Liu et al. investigated a 2.2 Ah cylindrical cell (18650 format) in an open environment test setup and found the cell to lose 7.3 g Ah−1 of their mass due to a thermal trigger. 15 However, there are significant differences in the experimental setup (lower capacity of the cell and only one single test). Walker et al. examined 18 650 cells in an open environment test setup triggered by over-temperature with a capacity between 2.4 and 3.5 Ah. 16 Their results showed a mass loss up to 12.9 g Ah−1 and therefore the highest in the comparison.
In summary, the presented results are generally within the range of previous publications. However, due to differences in the number and type of examined cells as well as experimental methods (e. g. cell format, cathode material, setup, trigger) there are individual deviations from literature values.
Figure 5 illustrates the distribution between vented gas mass mgas (red circles) and vented particle mass mparticles (gray triangles) in relation to the total mass loss during TR Δmcell over the cell capacity Ccell (Fig. 5a) and over the gravimetric cell energy density ρgrav (Fig. 5b). The dashed or dashdotted lines represent the mean value of all data points.
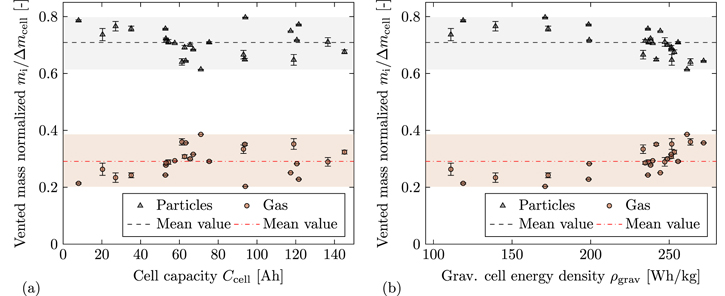
Figure 5. (a) Vented particle mass mparticles and vented gas mass mgas normalized with mass loss Δmcell over cell capacity Ccell. The dashed lines represent the mean value with 0.709 for mparticles and 0.291 for mgas. (b) Vented particle mass mparticles and vented gas mass mgas normalized with mass loss Δmcell over the gravimetric cell energy density ρgrav. The dashed lines represent the mean value with 0.709 for mparticles and 0.291 for mgas.
Download figure:
Standard image High-resolution imageFigure 5a shows that mgas makes up 29.1% and mparticles makes up 70.9% of Δmcell on average over all tested cells. This is higher for mgas and hence lower for mparticles in comparison to literature as summarized in Table IV. Furthermore, the vented gas mass mgas normalized with the cell capacity Ccell is in good agreement with comparable publications, whereas the vented particle mass mparticles normalized with the cell capacity Ccell is lower. 12,13 This underlines the hypothesis that the generated gas is mainly dependent from the cell capacity, whereas the vented particle mass is influenced by several parameters and therefore individual for each cell (type).
Table IV. Comparison of the mass loss distribution during TR.
| Reference | Ccell [Ah] |
 [%] [%] |
 [g Ah−1] [g Ah−1] |
 [%] [%] |
 [g Ah−1] [g Ah−1] |
|---|---|---|---|---|---|
| This study | 8–145 | 20%–39% | 1.6–2.7 | 61%–80% | 2.9–7.2 |
| Golubkov et al. 12 | 50 | 12%–25% | 1.4–2.9 | 75%–88% | 8.5–11.0 |
| Essl et al. 13 | 41 | 18% | 1.7 | 82% | 7.5 |
In addition, the data shows that there is a dependency between the gas-particle-distribution and ρgrav as plotted in Fig. 5b. For cells with high ρgrav the fraction of vented gas in total mass loss increases, whereas the fraction of vented particles decreases. A possible reasons for this behavior is a higher amount of liquid electrolyte that evaporates during TR due to higher temperatures. Unfortunately, an experimental evidence for this hypothesis cannot be given as the internal temperature of the cell was not measured. However, the highest mean cell can temperature  was measured for the cells with ρgrav ≥ 250 Wh/kg.
Another possible explanation is an increasing amount of active cathodic oxygen per unit volume in cells with higher energy density, whereas the amount of electrolyte in the electrode pores is mostly constant. As a consequence, we assume the chemical reaction during the thermal runaway process of a cell with higher energy density results in a higher COCO2/CO-ratio. Therefore, the average molar mass of the vented gas mixture shall be higher. Anyhow, this hypothesis needs to be further validated by analyzing the COCO2/CO-ratio for several cells with different energy density.
At this point it has to be mentioned that the distribution of Δmcell into mparticles and mgas as shown in Fig. 4b and 5 depends on the assumed molar mass of the vented gas. As described above, in this study the venting gas composition of a 53 Ah cell with NMC111 cathode was analyzed via gas chromatography. The main detected components were H2, CO and CO2 with a concentration of  Vol.-%, cCO = 31.34 Vol.-% and
  Vol.-%, respectively. Additional detected components were C2H4 with a concentration of
  Vol.-% and CH4 with a concentration of
  Vol.-%. These detected components are in accordance with literature.
12,13,19,20,27
Fig. 6 shows a comparison of each substance's concentration with selected publications.
Vol.-%. These detected components are in accordance with literature.
12,13,19,20,27
Fig. 6 shows a comparison of each substance's concentration with selected publications.

Figure 6. Comparison of the gas composition measured in this study with values from literature. 19,20,27 As Koch et al. in Ref. 27 analyzed 51 cells in total the error bars of these measurements are also shown.
Download figure:
Standard image High-resolution imageKoch et al. analyzed 51 cells in total (41 pouch and 10 prismatic—NMC cathode) with a capacity between 20 Ah and 81 Ah inside an autoclave in oxygen atmosphere triggered by heat. 27 The bars show the average substance concentration with the corresponding variance over all tests as error bars. Golubkov et al. analyzed a 1.5 Ah cell (cylindrical - N0.45 M 0.45 C 0.10 cathode) inside a sealed reactor in inert atmosphere also triggered by heat, 20 whereas Essl et al. analyzed two 60 Ah cells (prismatic—NMC622 cathode) in the same reactor in inert atmosphere with nail penetration. 19
This study's results are within the variance of the measurements by Koch et al. except for CO2. This can be explained by a lack of oxygen due to the inert atmosphere. The analysis of Essl et al. shows a comparable concentration of CO2. 19 For cells with a low capacity as tested by Golubkov et al. the ratio between CO and CO2 is also different from measurements done with high capacity cells. 20
The main parameter derived from the gas composition is the molar mass as compared in Tab. V for the different gas compositions. The molar mass used in this study is in accordance with the comparable data from literature that examined the cell(s) in inert atmosphere. 19,20 In addition, the difference of the molar mass for different cells and therefore cathode materials is small even with deviations in the assumed gas composition. Consequently, the error of the evaluation methodology in this study due to the same molar mass for all examined cells is assumed to be negligible.
Table V. Comparison of the molar mass derived from gas composition measurements.
| Parameter | This study | Koch et al. 27 | Golubkov et al. 20 | Essl et al. 19 |
|---|---|---|---|---|
| Investigated cells | 1 | 51 | 1 | 2 |
| Cell format(s) | prismatic | prismatic and pouch | cylindrical | prismatic |
| Atmosphere | inert | oxygen | inert | inert |
| Capacity Ccell | 53 Ah | 20–81 Ah | 1.5 Ah | 60 Ah |
| Cathode material | NMC111 | NMCxxx | N0.45 M0.45C0.10 | NMC622 |
| Molar mass Mgas | 23.38 g mol−1 | 27.42 g mol−1 | 23.19 g mol−1 | 23.10 g mol−1 |
| CO2/CO-ratio | 0.87 | 1.29 | 3.17 | 1.04 |
Table V also compares the COCO2/CO-ratio resulting from the gas analyses mentioned above. The cell with NMC111 cathode from this study shows the smallest ratio, followed by the cell with NMC622 cathode examined by Essl et al. 19 and the cells examined by Koch et al. with NMC cathodes of different compositions. 27 The cell with N0.45 M 0.45 C 0.10 cathode examined by Golubkov et al. 20 shows the highest ratio. However, the capacity of this cell is significantly smaller. As stated before, this observation could result from the different energy densities of the cathode material, but needs to be further validated.
Vented gas volume
Figure 7 shows the vented gas volume Vgas at 25 ◦C and 1 atm (SATP conditions) over the cell capacity Ccell for the results of this study (gray triangles), of Koch et al. from Ref. 27 (red circles) and of Golubkov et al. from Ref. 12 (blue diamonds). The lines represent linear fits of the data from this study (dashed) and the study of Koch et al. (dashdotted).

Figure 7. (a) Vented gas volume Vgas estimated with equilibrium state criteria over cell capacity Ccell. The dashed lines represent linear fits with slopes of 2.14 ℓ Ah−1 for cells tested in this study and 1.96 ℓ Ah−1 for the cells tested by Koch et al. 27 (b) Vented gas volume Vgas estimated at Tgas = 30 °C over cell capacity Ccell. The slope of the linear fit for cells tested in this study is 2.06 ℓ Ah−1. The shaded areas show the 95% confidence intervals of the fits of this study's results.
Download figure:
Standard image High-resolution imageAs plotted in Fig. 7a the data of this study results in a mean generated gas volume of 2.14 ℓ Ah−1. This is higher than the results of Koch et al. for 41 pouch and 10 prismatic cells triggered by over-temperature (1.96 ℓ Ah−1). 27 Measurements of Golubkov et al. with 11 prismatic cells and different trigger mechanisms are within the variance. 12
A possible reason for deviations is the definition of an equilibrium state via the gas temperature gradient dTgas/dt. The temperature inside the autoclave at this equilibrium state Teql varies between 20 ◦C and 45 ◦C and consequently some volatile venting products are present as a liquid and as a gas phase at the same time. Therefore, the partial pressure of those substances has to be taken in consideration. To identify the impact of this phenomena Fig. 7b shows the vented gas volume Vgas (SATP conditions) evaluated at Tgas = 30 °C and therefore on the same isotherm in the phase diagram for all tests. The slope of the linear fit changes from 2.14 ℓ Ah−1 to 2.06 ℓ Ah−1 and R2 from 0.94 to 0.96. Hence the influence on the mean value is little but there are single tests for that the chosen equilibrium state criteria has a significant impact on the result. To gain further insight into the exact distribution between gas, solid and liquid ejecta it would be necessary to collect all of the solid particles after the test. With a measured value of mparticles the liquid "remains" could then be estimated.
Deviations may also result from the cell format, the cathode material and the trigger method as shown in Tab. VI. Diaz et al. and Essl et al. reported a dependency of the vented gas volume from the trigger method. 19,31 Nevertheless, the results of this study are within the range of previous publications. 12,13,19,20,27
Table VI. Comparison of the generated gas volume during TR.
| Reference | Investigated cells | Cathode material | Trigger | Ccell [Ah] | Vgas [ℓ] @ SATP |
 [ℓ Ah−1] [ℓ Ah−1] |
|---|---|---|---|---|---|---|
| This study | 50 (prismatic) | NMC & NCA | nail-pen. | 8-145 | 14.0-329.9 | 1.6-2.8 |
| Koch et al. 27 | 51 (pouch & prismatic) | NMC | over-temp. | 20-81 | 51.7-173.5 | 1.4-3.0 |
| Golubkov et al. 12 | 11 (prismatic) | LMO | over-temp. | 50 | 70.9-114.3 | 1.4-2.9 |
| Golubkov et al. 20 | ≥3 (18650) | N0.45 M0.45C0.10 | over-temp. | 1.5 | 3.6 | 2.4 |
| Golubkov et al. 20 | ≥3 (18650) | NMC + LCO | over-temp. | 2.6 | 6.5 | 2.5 |
| Essl et al. 13 | 1 (pouch) | NMC + LMO | over-temp. | 41 | 56.5 | 1.4 |
| Essl et al. 19 | 2 (pouch) | NMC622 | over-temp. | 60 | 93.0 | 1.5 |
| Essl et al. 19 | 2 (pouch) | NMC622 | overcharge | 60 | 168.8 | 2.8 |
| Essl et al. 19 | 2 (pouch) | NMC622 | nail-pen. | 60 | 102.8 | 1.7 |
| Essl et al. 19 | 2 (prismatic) | NMC622 | over-temp. | 60 | 93.0 | 1.5 |
| Essl et al. 19 | 2 (prismatic) | NMC622 | overcharge | 60 | 159 | 2.7 |
| Essl et al. 19 | 2 (prismatic) | NMC622 | nail-pen. | 60 | 105.2 | 1.8 |
Generated heat during TR
Figure 8 shows the total generated heat Qtot (gray triangles) and the fraction of heat remaining in the cell or being transferred to the copper block Q1 (red circles) over the cell capacity Ccell. The dashed or dashdotted lines represent linear fits of the data that follow the form y = mx. The experimental results show an approximately linear increase of Q1 and therefore of Qtot with Ccell, more precisely Qtot is on average 19.45 kJ Ah−1 (R2 = 0.96) and Q1 is on average 10.76 kJ Ah−1 (R2 = 0.84). The deviations of Q1 from its linear fit are higher than for Qtot. This is due to the dependency between Q1 and the mass loss during TR: with increasing mass remaining in the cell  more heat remains in the cell as well and therefore Q1 is higher. This dependency is illustrated in Fig. 9 that plots Q1 normalized with the cell capacity Ccell over the (relative) remaining cell mass
  . The dashed line represents a linear fit of the data.

Figure 8. Total generated heat Qtot and fraction of heat remaining in the cell or being transferred to the copper block Q1 over cell capacity Ccell. The dashed lines represent linear fits with slopes of 19.45 kJ Ah−1 for Qtot and 10.76 kJ Ah−1 for Q1. The shaded areas show the 95% confidence intervals of the fits.
Download figure:
Standard image High-resolution image
Figure 9. Fraction of heat remaining in cell or being transferred to the copper block Q1 normalized with cell capacity Ccell over (relative) remaining cell mass after TR  . The dashed line represents a linear fit with a slope of 0.19 kJ Ah−1%−1. The shaded area shows the 95% confidence interval of the fit.
Download figure:
Standard image High-resolution imageFigure 8 and 9 show that it is possible to actively affect the distribution between Q1 and Q2 by influencing the mass loss of the cell. With respect to battery pack design it is conceivable to ensure a high mass loss in combination with a robust way to guide the vented products out of the battery pack. The high mass loss leads to a small Q1 and therefore inhibits the thermal propagation triggered by conductive transferred heat. It then has to be secured that the vented products have no direct contact with endangered components to also prevent a thermal propagation triggered by convective transferred heat. A possible approach for this is a venting channel that is separated from the rest of the battery pack.
Figure 10 shows the total generated heat Qtot (gray triangles) and the fraction of heat remaining in the cell or being transferred to the copper block Q1 (red circles) normalized with the nominal (electrical) cell energy Ecell (in Wh—capacity of the cell Ccell multiplied by the nominal voltage of the cell Unominal) over the cell capacity Ccell and the gravimetric cell energy density ρgrav. The dotted and dashdotted lines represent the mean values.

Figure 10. (a) Total generated heat Qtot and heat remaining in cell Q1 normalized with cell energy Ecell over cell capacity Ccell. The dashed lines represent the mean value with 1.41 for Qtot and 0.81 for Q1. (b) Total generated heat Qtot and heat remaining in cell Q1 normalized with cell energy Ecell over cell energy density ρgrav. The dashed lines represent the mean value with 1.41 for Qtot and 0.81 for Q1.
Download figure:
Standard image High-resolution image
Figure 10a illustrates that Qtot is on average 1.41 times higher than Ecell. There are single test results with a factor of up to 1.72. Consequently, the heat generated by chemical reactions inside the cell is significant and has to be considered in the development process of battery packs with regard to thermal safety. Q1 is on average 81% of Ecell with a minimum factor of 0.48 and a maximum of up to 1.12.
Figure 10b shows that Qtot as well as Q1 in relation to Ecell tend to decrease with increasing ρgrav. A possible reason for this behavior is that the high amount of energy leads to overall higher temperatures of the cell and consequently of the copper block. As a result more heat is transferred from the thermal insulation to the gas inside the autoclave. In this case the measurement error of Q1 would increase with a higher amount of heat transferred to the copper block.
A comparison of the measured values with data from literature is given in Tab. VII. In general, the results of this study are in accordance with previous reported values, 15,16,22–25 but it has to be mentioned that the cells examined in this study have a significant higher capacity. Therefore, it is possible that measurement errors of the autoclave calorimetry setup are not noticed at this point. The thermal insulation of the copper block is one source of errors due to the impossibility of creating a perfectly adiabatic system. Consequently, it is assumed that the total generated heat during TR can be slightly higher as 141% of Ecell on average. This assumption will be verified in future publications with an improved experimental setup.
Table VII. Comparison of the generated heat during TR.
| Reference | Investigated cells | Cathode material | Atmosphere | Ccell [Ah] |
 [kJ Ah−1] [kJ Ah−1] |
 [-] [-] |
 [kJ Ah−1] [kJ Ah−1] |
 [-] [-] |
|---|---|---|---|---|---|---|---|---|
| This study | 50 (prismatic) | NMC & NCA | inert | 8–145 | 6.0–14.7 | 0.5–1.1 | 15.6–22.8 | 1.2–1.7 |
| Walker et al. 16 | 7 (18650) | NCA & unknown | limited oxygen | 2.4–3.5 | 3.6–7.3 | 0.3–0.5 | 15.2–21.5 | 1.1–1.6 |
| Yayathi et al. 22 | 18 (prismatic & 18 650) | NMC & NMC + LCO | limited oxygen | 2.4–5.3 | 9.6–12.0 | 0.7–0.9 | 18.1–18.6 | 1–1.6 |
| Liu et al. 23 | 3 (18650) | NMC & LCO & LFP | open | 1.5–2.6 | 9.1–15.1 | 0.9–1.3 | n/a | n/a |
| Liu et al. 15 | 1 (18650) | NMC | open | 2.2 | 15.4 | 1.2 | n/a | n/a |
| Ye et al. 24 | 13 (prismatic) | NMC | limited oxygen | 1 | n/a | n/a | 6.6–9.3 | 0.5–0.7 |
| Walters et al. 25 | 4 (unknown) | LMO & LCO & NCA | inert | 1.0–3.1 | n/a | n/a | n/a | 1.7 |
Conclusions
The presented results show the TR behavior of prismatic lithium-ion cells in the autoclave calorimetry experiment. The examined cells are covering a wide capacity range (8 Ah to 145 Ah) and therefore correlations for safety relevant parameters are derived. More specifically the dependency of the mass loss, the vented gas volume and the generated heat during TR on the cell capacity are presented in this paper.
Mass loss during TR
- The tested cells lost on average 7.05 g Ah−1 of their mass during TR (R2 = 0.88). This mass loss is distributed into 5.00 g Ah−1 particles and liquid components (R2 = 0.80) and 2.05 g Ah−1 venting gas (R2 = 0.94). Consequently, the gas makes up 29.1% gas and particles and liquid components make up 70.9% of the total mass loss.
- The vented gas is subject to a smaller variance (1.6–2.7 g Ah−1) than the vented particles (2.9–7.2 g Ah−1). Therefore, it is concluded that the amount of vented gas is mainly dependent on the cell capacity and cannot be actively influenced by e.g. the cell design. In contrast, the vented particle mass is individual for each cell (type) and depends on several parameters.
- Cells with a high grav. energy density tend to show a higher fraction of gas in their mass loss compared to cells with a low gravimetric energy density.
Vented gas volume
- The tested cells generated on average 2.14 ℓ Ah−1 of gas during TR (SATP conditions). This is in accordance to reported values in literature.
- The generated gas volume was found to be between 1.6 ℓ Ah−1 and 2.8 ℓ Ah−1.
Generated heat
- The tested cells generated on average 10.76 kJ Ah−1 of heat that remained in the cell during TR (R2 = 0.84). By estimating the fraction of heat that is transported by the venting products the total generated heat during TR was found to be on average 19.45 kJ Ah−1 (R2 = 0.96).
- The distribution of the total generated heat into the fraction of heat remaining in the cell (Q1) and the fraction of heat that is transported by the venting products (Q2) depends on the mass loss during TR.
- By influencing the vented particle mass the distribution between Q1 and Q2 can be actively manipulated.
- The ratio between total generated heat and electrical energy stored in the cell was found to be on average 1.41. The maximum value was 1.72.
In general, the results allow to estimate safety relevant parameters for different battery cells in a wide capacity range. These parameters are crucial for the design process of battery packs, e. g. as input parameters for simulations. Furthermore, the correlations can be used to predict the behavior of other battery cells within the property range of those tested and therefore contribute to the design of a safer battery pack.
Acknowledgments
The authors would like to gratefully acknowledge the support of the Fraunhofer Institute for Chemical Technology (ICT), Pfinztal, Germany for the development and execution of the autoclave calorimetry measurements. In addition, S. Hoelle acknowledges the support of the TUM Graduate School.