
Abstract
Gas diffusion media is one of the main components affecting the water management in polymer electrolyte fuel cells, which is key for a high and stable performance. Building up on our previously designed gas diffusion layers (GDLs) with patterned wettability, we included in this study customized microporous layers (MPLs) with the target to enhance the effect of hydrophilic water pathways and reduce mass transport losses. The MPLs were modified by introducing "weak points" using electron induced radiation grafting or local mechanical perforation, in order to canalize the water injection to the hydrophilic pattern of the GDL. We describe the techniques used for gas diffusion media modification, their limitations and their influence on water distribution. We also study in detail the impact of different water injection methods on water distribution, in particular comparing capillary pressure water injection to electrochemical water production. The important differences observed between these two methods, were attributed to the absence of hydraulic connection between the water injection points in the latter case. Although the ex situ characterization shows that the local MPL modifications were successful, the targeted canalization of water injection was not observed, calling for future MPL modifications with an improved lateral transport.
Export citation and abstract BibTeX RIS

This is an open access article distributed under the terms of the Creative Commons Attribution Non-Commercial No Derivatives 4.0 License (CC BY-NC-ND, http://creativecommons.org/licenses/by-nc-nd/4.0/), which permits non-commercial reuse, distribution, and reproduction in any medium, provided the original work is not changed in any way and is properly cited. For permission for commercial reuse, please email: oa@electrochem.org.
This was paper 1372 presented at the Cancun, Mexico, Meeting of the Society, September 30–October 4, 2018.
Gas diffusion media (GDMs) are key components in polymer electrolyte fuel cells (PEFCs). They act as gas distributors, transporting the reactant gases from the channels of the flow field to the catalyst layer (CL).1 GDMs also provide mechanical support for the cell assembly, act as heat and electron conductors2,3 and, most importantly, play a critical role in water management.4 They are commonly composed of gas diffusion layers (GDLs) which are porous materials made of carbon fibers having a diameter of approximately 10 μm,5 and are generally coated with a fluoropolymer to increase hydrophobicity and avoid water accumulations.6–8 This is especially important in the cathode where water is produced.9 If water accumulates in the pathway of the reactant gas to the CL, the diffusion of oxygen is hindered, generating mass transport losses and it can lead to oxygen depletion on the cathode side.10,11 The GDLs have an average thickness of around 200 μm and a porosity of around 75% and a mean pore size close to 20 μm.12,13 As a standard practice, an additional layer composed by carbon particles and fluoropolymer called microporous layer (MPL) is incorporated to the material.14 This layer is frequently about 40 μm thick and has a porosity of about 50% with pore diameters between 0.05 μm and 1 μm.15 The MPL has several functions: it protects the CL and the membrane from mechanical damage which the direct contact with the GDL may cause. It also improves the electrical and thermal contact between GDL and CL. Finally, the MPL has shown to prevent water pooling at the GDM/CL interface.16–18
Coating of GDL fibers with a fluoropolymer and the incorporation of a hydrophobic MPL are the most common strategies to decrease mass transport losses and prevent cell flooding. Nevertheless, several authors have proposed further strategies to improve water management (see for example the review by Omrani and Shabani19). One of them consists in creating preferential water pathways through the GDL. Having a selected area of the GDL dedicated to water transport helps reducing the tortuosity of the remaining gas transport pathways, increasing the effective diffusivity of the material. To achieve this goal, two main strategies have been proposed: the first one consist in modifying the porous structure of the material and the second one relies on modifying the surface chemistry of given regions. The modifications can imply altering the whole GDM material, or just one of their components, for example only the GDL or the MPL.
Koresawa and Utaka20 designed a GDL to which they applied the fluoropolymer coating locally, resulting in slightly hydrophilic regions where the GDL remains uncoated and in hydrophobic regions where the coating is applied. Using X-ray computed tomography (CT), they analyzed the liquid water distribution through these hybrid samples in comparison with fully hydrophilic (non-coated) and fully hydrophobic GDLs with different coating loads, during imbibition and drying cycles. They analyzed the water saturation in relation to the oxygen diffusivity and found that samples with patterned wettability have the highest effective oxygen diffusivity for a given water saturation level. Nevertheless, they were not able to correlate their imbibition experiments with operando performance. In a more recent publication the same authors combined the hybrid GDL with a micro-grooved flow field21 but most of the reported improvement seems to be related to the flow field rather than to the GDL. Finally, the same authors studied the impact of different patterns of hydrophilic/hydrophobic characteristics.22
Instead of using localized through-plane or in-plane water pathways, some researchers studied the effect of a wettability gradient. Vijay et al.23 developed a method based on wicking to create GDLs with a gradual fluoropolymer content by partially imbibing the sample in the coating solution. On the other hand, Zahiri et al.24 achieved a wettability gradient by treating the GDL or the MPL surface with O2 plasma. They measured the wettability change by sessile drop method as well as by an in-house electrochemical method based on the double layer capacitance of the GDL used as an electrode. They found that the wettability gradient on the GDL led to lower performance and less repeatable results while a hydrophilic MPL led to a performance increase which they related to the wicking properties of a hydrophilic material with fine porosity.
Our approach consists in the creation of hydrophilic pathway by altering the chemical composition of the fluoropolymer coating. This modification uses radiation induced grafting co-polymerization combined with the use of a mask when applying the radiation that allows to select the pattern of modified regions.25 This modification has proven to improve performance and the analysis of the water distribution by neutron imaging shows that the water accumulates in the hydrophilic lines of the material, specially under the rib regions of the flow field and is then distributed to the channels.26 Our previous experiments did rely on the addition of a self-standing MPL layer, but to make this technology cost competitive the addition of a state-of-the-art MPL incorporated to the patterned wettability GDL is required.
However, there is a lack of knowledge about the optimal microstructural and wettability characteristics of the MPL. The MPLs in commercially available GDLs are hydrophobic, but some studies reported a better performance for hydrophilic MPLs. Aoyama et al.27 produced a hydrophilic MPL composed of carbon nanofibers and ionomer and compared its performance to the conventional hydrophobic MPL. They studied the electrochemical cell performance and the membrane electrode assembly (MEA) water content by freezing the MEA and analysing it with scanning electron microscopy. They found that the use of a hydrophilic MPL reduced the water content on the CL and correlated this with the performance improvement seen with the hydrophilic MPL. They performed their test under wet conditions but they argued that their findings are sustained by a previous research by Tanuma et al.,28 where a better performance for a hydrophilic MPL was also shown under dry conditions. Another study also reported that the addition of a hydrophilic MPL to the anode side improves membrane hydration while reducing or completely eliminating the gas humidification of the cell.29 Bae et al.30 were able to create a patterned wettability MPL by inkjet printing: they coated parallel stripes of hydrophobic MPL ink onto a GDL, and then used a hydrophilic MPL ink containing carbon nanotubes to cover the remaining regions. They reported that the efficiency of their modification was highly influenced by the pattern design and the relative humidity conditions.
As mentioned before, changing the surface chemistry of the GDM is not the only strategy for water management improvement. Several groups have studied the porosity of the MPL and determined that the cracks (large pores) have a clear influence on the water transport through the GDM.31,32 Hydrophobic highly porous MPLs with large pores have proven to increase performance.33,34 Many groups seek to tailor the MPL defects and adapt them to obtain a better understanding of the water transport through the cell and improve cell performance.35–37
As seen in the literature, there is an important number of parameters which can be varied in the design of GDMs, and there is no single, easy way to define a figure of merit to characterize the materials. Since GDM are multifunctional, to obtain the best performing material it is necessary to balance the trade of characteristics and not necessarily improving just one characteristic. Depending if the operating conditions are humid or dry, how much structural support the GDM should provide and how the ohmic losses are affected the optimal properties of the GDM will vary. Therefore it is important to understand the requirements of the systems where the GDM are to be employed and to be able to adapt the modifications to the desired system. It is also important to be able to control the used methodology and understand their limitations. Thanks to the versatility of our proposed radiation grafting approach, advanced GDM materials can enable novel fuel cell concepts. For example, we recently demonstrated that our GDM with patterned wettability can be used on the anode side to distribute liquid water fed through a single flow channel, resulting in a compact and simple design for evaporative cooling of fuel cells.38 In this case, the material requirements include highly hydrophilic pathways able to wick the water spontaneously and distribute it at a rate sufficient to sustain the required cooling power. Another example is the combination of our patterned wettability GDMs with interdigitated flow fields.39 In this case, the hydrophilic sections act as a by-pass for the water, preventing its accumulations in the dead-ended inlet channels and clearly improving the cell performance and stability. In both examples, water is meant to be transported through the GDL only, and it is convenient to use a hydrophobic MPL to avoid its flooding. As mentioned previously, a hydrophilic MPL can be useful in other cases, for example to reduce the water content in the CL.
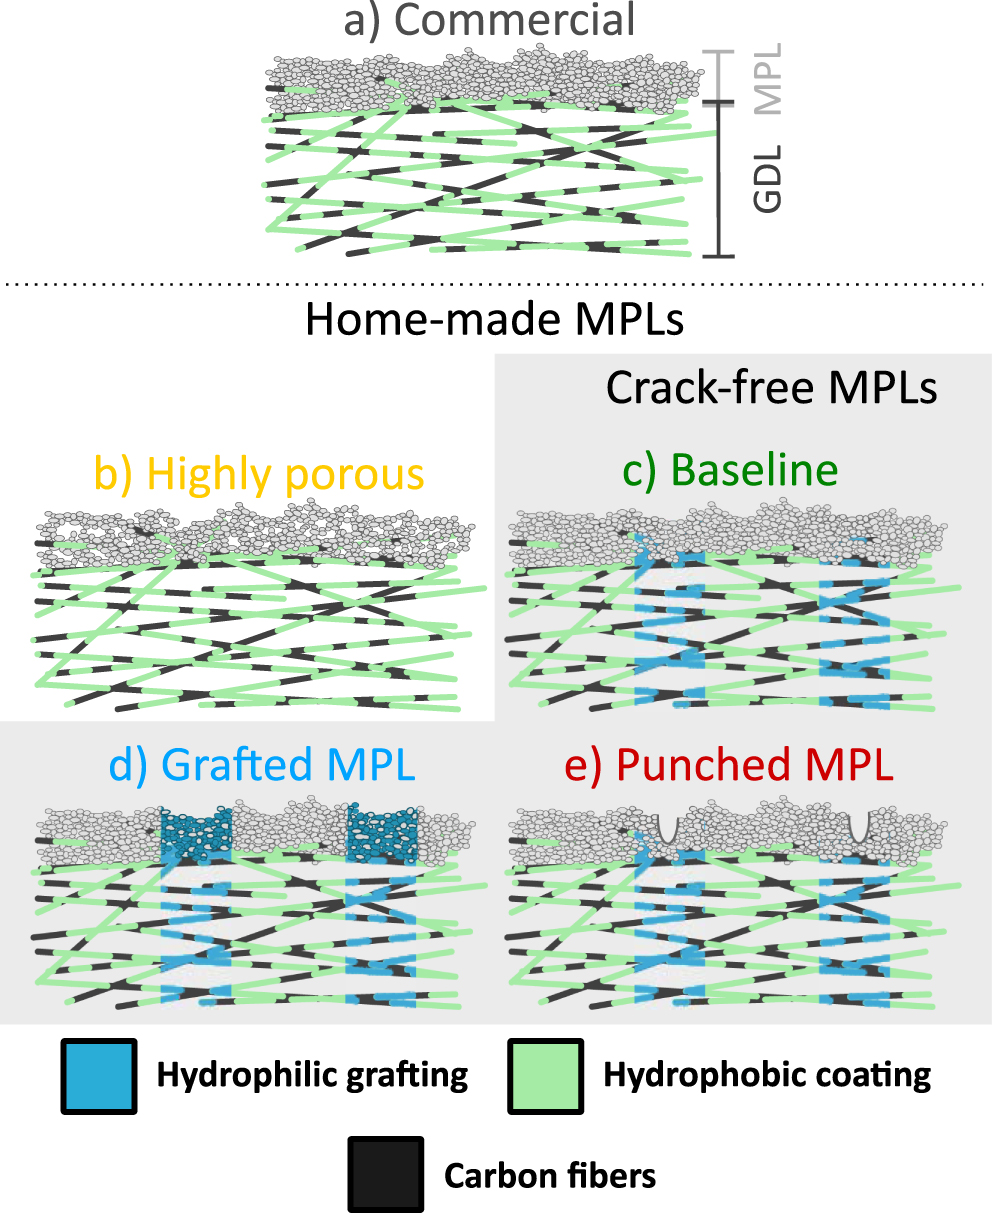
In this paper, the possibilities and the impact of MPL modifications combined in a GDL with patterned wettability will be presented. The studied MPL application and modification methods (see Fig. 1) include different spray coating procedures to produce highly porous or crack-free MPLs, localized wettability modification of the MPL by radiation grafting, and the creation of micro-holes as "weak spots" to create preferential pathways for water through the MPL. Besides the results related to synthesis, the behavior of the produced materials with respect to water transport is presented, discussing in particular the impact of different water injection methods on water distribution within the GDMs.

Figure 1. Sketch of the different GDMs employed. (a) Commercially available GDL, unmodified. (b) Highly-porous MPL. (c) Baseline sample, grafted GDL with crack-free MPL. (d) Grafted GDL with a crack-free grafted MPL. (e) Grafted GDL with a MPL with holes punched on top of the grafted lines.
Download figure:
Standard image High-resolution imageExperimental
Synthesis of the microporous layer
Freudenberg H23 GDLs were used as base material for all the experiments. The GDLs were coated in-house with 30%(w/w) FEP following a procedure reported previously.40 Before sintering, the MPL was added. The MPL ink was prepared by mixing 70 mg of fluoropolymer dispersion (FEP 55%w/w, FEPD 121 Dupont) with 11 ml of isopropanol (Sigma Aldrich) and 7.4 ml of ultrapure water (18.2 MΩ·cm). The obtained mixture was slowly added to 116 mg of carbon (Acetylene Black 50% compressed Alfa Aesar). The resulting ink was sonicated for an hour using an ultrasonic bath (VWR Ultrasonic USC100T) and then spray coated onto the coated GDL using a hand airbrush pistol (Sogole HP-200). The samples of 30 cm2 were taped to a flat aluminum table and the ink was sprayed in layers. After each layer compressed air was blown over the sample to help evaporate the solvent. Each layer was sprayed in a direction perpendicular to the previous one and the staring corner was change each time to improve homogeneity. For the highly porous MPL, an ink load of 0.16 ml·cm−2 was applied. For the crack-free MPL, the total ink load of 0.33 ml·cm−2 was applied and an intermediate drying step was required. In a first step one quarter of the total ink load was sprayed and the sample and was dried in an oven at 100 °C for an hour. Afterward the GDM was rapidly cooled and the rest of the ink was sprayed. Both the highly porous and crack-free MPL were subsequently sintered at 280 °C following the temperature program reported in our earlier publication.41
Control of the radiation grafting depth
After coating and adding the MPL, the materials were modified using electron induced radiation grafting to achieve the patterned wettability. The activation was done using an electron beam EBLab 200 sealed laboratory emitter system (Comet AG, Switzerland). The characteristics of the final pattern modification depends on the incident radiation beam energy as shown previously for GDLs without MPLs.42 To study this dependency for full GDMs in this work, the samples were placed in a metallic trade over a polyethylene film with approximately 1 mm thickness with the MPLs facing down and different samples were irradiated using 6 different electron beam energies: 100 keV, 120 keV, 130 keV, 140 keV, 170 keV and 200 keV. The samples were irradiated under air using a dose of 50 kGy and a trade transport speed of 12 m·min−1.
After irradiation, the GDMs were immersed in reactors containing a solution of 15%(w/w) of acrylic acid (Sigma Aldrich) and ultrapure water (18.2 MΩ·cm). The solution was bubbled with N2 during 1 h to prevent the presence of O2 during the reaction. Afterwards, the sealed reactor was placed in a water bath at 60 °C for 30 min. The samples were removed from the reactors and subsequently cleaned by applying vacuum through a Buchner funnel using three different solvents: first ethanol, then isopropanol and finally ultrapure water (18.2 MΩ·cm). After cleaning, the samples were dried in a vacuum oven overnight at 80 °C and 10 mbars.
For the purpose of analysis, the protons of the acidic groups were exchanged with Na+ using the following procedure. The GDMs were placed for 8 h in a 0.05 M NaOH (Sigma Aldrich) solution using a mixture of 40%(v/v) EtOH (94% Alcosuisse AG) and 60%(v/v) ultrapure water (18.2 MΩ·cm) as a solvent. The samples were then rinsed with water and dried overnight at 80 °C and 10 mbars. The Na+ stained GDM were cut in pieces of 3 × 3 mm2 and placed in a holder fixing them with conductive tape. The two sides of the GDM were measured using two different pieces, one placed with the GDL facing up and another piece with the MPL facing up.
The sample termed as "0 keV" was not exposed to radiation and was used as a reference. It was subjected to all other reaction steps, (including cleaning and ionic replacement), to quantify the possible residual element content in the samples.
Samples with patterned wettability
A similar procedure to the one described above was used to prepare the samples with patterned wettability. In this case, the samples were irradiated using a stainless steel mask that partially blocks the radiation. Three different radiation configurations were used, as summarized in Table I.
Table I. Radiation parameter and chemical conditions used for all the different GDM samples.
| Sample Type | Side facing the beam | Beam energy [keV] | Dose [kGy] | Copolymer |
|---|---|---|---|---|
| GDL (No MPL) | Indifferent | 200 | 50 | FEP-g-PNVF |
| Baseline | GDL | 140 | 50 | FEP-g-PNVF |
| Punched MPL | GDL | 140 | 50 | FEP-g-PNVF |
| Grafted MPL | MPL | 200 | 50 | FEP-g-(PSSA-co-PAA) |
The pattern used in these experiments consists of 500 μm wide hydrophilic parallel lines separated by 940 μm wide hydrophobic regions. After activation, two different chemistries were employed to graft the materials. In the case of grafting with N-vinylformamide (FEP-g-PNVF) the samples were submerged in a reactor with pure N-vinylformamide (NVF) (Sigma Aldrich) and bubbled with N2 for an hour. After this, the grafting reaction was conducted by heating the sealed reactor to 70 °C for an hour. For the samples grafted with poly(styrene sulfonic acid) copolymerized with poly(acrylic acid) (FEP-g-(PSSA-co-PAA)), a 0.5 M sodium styrene sulfonate (SSA) and 0.5 M acrylic acid (AA) solution in ultrapure water (18.2 MΩ·cm) was used. The reactor containing the solution and the sample was also bubbled with N2 for an hour, after which the grafting reaction was conducted during 36 h at 60 °C. The samples grafted with NVF were then cleaned as stated previously. The FEP-g-(PSSA-co-PAA) samples were cleaned with a different cleaning sequence. The homopolymer formed during this reaction is polar and therefore more soluble in water. Thus, the samples were first placed in water for 2 h and then cleaned using the filter based method described previously. The sequence of cleaning solutions was first water, then ethanol and finally water again.
The samples used for EDX analysis were stained in order to be able to visualize the grafted regions. To this purpose, the FEP-g-PNVF samples were first hydrolyzed. The samples were placed in a 2 M NaOH in 80%(w/w) ultrapure water and 20%(w/w) EtOH (94% Alcosuisse AG) at 80 °C for 8 h. After the reactions the samples were immediately placed in a 0.1 M HCl in 80%(w/w) ultrapure water and 20%(w/w) EtOH (94% Alcosuisse AG) solution for 8 h. The immersion of the samples in acid is necessary to remove the sodium formate residues from the basic hydrolysis43 and HCl was purposely selected to stain the samples with Cl−. The samples were then rinsed with ultrapure water and dried in vacuum following the parameters previously described. The FEP-g-(PSSA-co-PAA) samples were stained with Na+ using the procedure described in the previous section.
Punched MPL
The samples with micro-holes punched into the MPL were irradiated using a specific holder/mask system to ensure that the hydrophilic lines and the punched holes were well aligned. The samples were placed in a holder made from polyethylene with the MPL facing down, covered with the stainless-steel mask and irradiated. Afterwards they were grafted with NVF and cleaned as described before. Using the same holder, the GDMs were positioned with the MPL facing up, and micro-holes were punched through the slits of the mask. To control the depth, diameter, and spacing of the holes, a special tool was created. The shape of the hole is determined by the characteristics of the needle, tip diameter and rod diameter, and by the penetration depth. For this experiment, stainless steel insect pins size 000 (Fine Science Tools) were used. The pins have a 30 μm tip diameter with a rod of 250 μm diameter and 40 mm length. The head of the punching tool was designed and calibrated to precisely control the penetration depth into the material. The punching tool was guided by mounting it on a computer numeric controlled (CNC) mill to precisely control the positioning of the micro-holes through the slits of the mask using a repetitive NC-code. The micro-holes had a final diameter of about 50 μm and 30 μm depth and a separation center-to-center of 150 μm.
Energy dispersive X-rays spectroscopy (EDX)
A scanning electron microscope (FE-SEM Ultra 55, Carl Zeiss, Germany) was used with a compatible accessory (EDAX TSL, AMETEK) to obtain EDX spectral data and elemental mapping. The analysis was performed using a voltage of 10 kV, an aperture of 120 μm and a gun-to-sample distance of 9.7 mm. For the spectral analysis, three different spots were measured for each sample and averaged.
Since the additional elements present in the grafted monomers (O and N) are difficult to distinguish from the carbon and fluorine of the coating, we stained the grafted regions with Na+ or Cl− as described in the previous sections, increasing the detection limit and improving quantification. The sodium or chlorine signal were normalized with the fluorine signal (representative of the fluoropolymer coating). The coating of the GDL is not necessarily homogeneously distributed over the sample and due to the high porosity of the GDM the amount of material measured on a given spot can vary. Therefore the Na/F signal (or Cl/F signal when staining with chlorine) is a better representation of the hydrophilic grafting in the GDM than the corresponding absolute signal.
In the case of the elemental mapping analysis, an image processing procedure as described in our previous publication was used.42 The Na/F (respectively Cl/F) signal is computed only for pixels where the F signal is sufficiently high, and interpolated in between. The presented images use a color scale representation where green represents non-grafted regions (Na/F or Cl/F signal of 0.0) and blue represents grafted regions (threshold value Na/F signal of 0.05 or Cl/F signal of 0.04).
X-ray photoelectron spectroscopy (XPS)
The XPS data was acquired using a VG ESCALAB 220iXL spectrometer (Thermo Fisher Scientific) with a monochromatic Al Kα X-ray radiation (1486.6 eV) and a spot with 500 μm diameter (power of 150 W). The spectrometer was calibrated using the Ag 3d5/2 peak at the binding energy of 368.3 eV. All spectra were recorded in constant analyzer energy mode at a pass energy of 30 eV. The binding energy calibration was done based on the C-C (GDL) peak at 284.5 eV.
Optical microscope
The MPL surfaces were imaged using a Leica VZ700 C optical microscope including a polarization filter. The resulting images are presented as obtained from the microscope without any further processing.
X-Ray tomographic microscopy (XTM) with water
The XTM was performed using a Nanotom-m Lab-CT scanner (GE Measurements & Control) at PSI. The images were acquired using an acceleration voltage of 60 kV and a current of 280 μA. For each scan, 2400 projection were recorded during the 360° sample rotation. Each projection consisted of 3 averaged images with an exposure time of 500 ms each. A 30 fold magnification was used, which resulted in a final voxel size of 3.3 μm. To probe the location of the hydrophilic regions, water was injected from the GDL side. The wet sample was equilibrated during 16.5 h and then scanned.
Water injection experiments
Three different methods were used for water injection into GDMs as illustrated in Fig. 2. The description is given below for the three different methods.
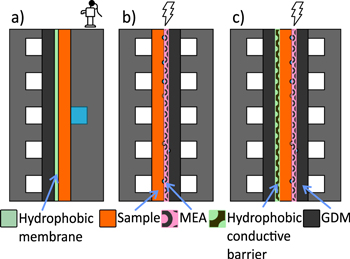
Figure 2. Sketch representing the different water injection methodologies. (a) Capillary water injection method with a mono-channel flow field for water injection. (b) Standard differential fuel cell used for electrochemical water injection (EWI). (c) Electrochemical water injection with hydrophobic barrier (EWIHB).
Download figure:
Standard image High-resolution imageWater injection by capillary pressure
The data corresponding to water injection by capillary pressure was obtained from the dataset used in our previous publication.25 The set-up description is repeated here for the sake of clarity. It was based on a single channel flow field through which the water was injected. The test set-up uses the body of a differential fuel cell at the water injection side a flow field with one channel for water supply in direct contact with the tested sample. A hydrophobic porous membrane (Durapore PVDF hydrophobic, pore size 0.22 μm) was placed between the sample GDL and the channels to allow air to escape while blocking the water. Another GDL was placed between the membrane and channels to ensure that the assembly was homogeneously compressed and PTFE gaskets were used for sealing (Fig. 2a). With this set-up, it is possible to increase the capillary pressure by increasing the pressure of the water, PL, since capillary pressure, PC, is defined as  where PG is the gas pressure. In our experiment, the gas pressure is equal to atmospheric pressure and the experiments were performed at room temperature.
Electrochemical water injection
The goal of this experiment is to analyze the water distribution in a sample GDM with water produced electrochemically. The test is carried out using differential cells with an active area of 10 × 10 mm2. For this experiment, a standard fuel cell membrane electrode assembly is used and the cell is operated to produce the water electrochemically. The sample under test is placed on the cathode side of the cell with the MPL facing the membrane. A catalyst coated membrane (CCM) of type Primea 5710 (W.L. Gore & Associates) was employed and on the anode side a commercial GDM (Freudenberg H23 C6), was used (Fig. 2b). The assembly was sealed using 350 μm thick PTFE gaskets.
Electrochemical injection with hydrophobic barrier
One of the limitations of the previously proposed electrochemical water injection methodology is that the amount of water that can be injected into the GDL is limited, as no water can accumulate after breakthrough has occurred. To deal with this constraint and provide further insight, a third setup combining elements of the two previously described method was used. Again, a Freudenberg H23 C6 was used as anode GDM and the same type of CCM (Gore Primea 5710) was used. The sample under test was placed on the cathode side with the MPL facing the CCM. An electron conductive hydrophobic micro-porous layer (Carbel CB30Z, Gore) was placed adjacent to the GDL side of the sample under test and a further GDM (Freudenberg H23 C6) was placed next to the cathode flow field to ensure homogeneous compression (see details of the stack-up in Fig. 2c). For this test, three Teflon gaskets were used (one 350 μm thick gaskets on each side of the MEA and a 200 μm thick gasket between the hydrophobic conductive membrane and the flow field).
Water generation protocol
For both cases (with and without hydrophobic barrier), the following fuel cell operation procedure was used. After drying, the cells were pre-conditioned during 20 min by flowing 1500 NmL·min−1 of O2 at the cathode and 700 NmL·min−1 of H2 at the anode, both with a relative humidity of 30%, to humidify the membrane. After this conditioning period, the outlet was closed and the gas flows in the cells were stopped. Water was produced with the cell in dead-end mode on both the anode and cathode side, ensuring that the produced water stayed in the cell. The water production sequence consisted in applying a current density of 0.5 A·cm−2 for 30 s, after which the cell was left without current for 5 min and 30 s, while neutron radiographs were acquired. These sequential steps of 6 min were repeated until the channels were filled with water. At this point, it was assumed that all the pathways through the GDL have been establish and no higher water saturation in the GDL was possible.
The experiments were conducted at a temperature of 35 °C and a pressure of 1.1 barabs. This temperature was selected because it was the closest to room temperature that our set-up could achieve in a controllable way. In all experiments, the cells were assembled so that the GDM were compressed to 70% of their original thickness.
All electrochemical injection experiments were performed using the multi-cell testing set-up described in a previous publication.17 This set-up allows to test simultaneously up to six different cells. The individual cell housings were machined in aluminum and coated with 60 μm of nickel and 5 μm of gold. The flow fields were made in stainless steel coated with a 5 μm gold layer. They included five parallel channels (1 mm wide and 0.5 mm deep) separated by four ribs (1 mm wide).
Neutron imaging setup
Two different acquisition modes were employed for the experiment: through-plane and in-plane imaging. For the through-plane imaging configuration, the neutron beam was perpendicular to the MEA plane, and for the in-plane configuration the neutron beam was parallel to the MEA plane. The neutron radiography experiments were performed at the NEUTRA beamline at the Swiss Spallation Source (SINQ) at PSI.44
For the through-plane imaging mode the neutrons were captured using a 30 μm scintillator screen made of Gd2O2S. The resulting light output image was collected through a mirror and a commercial optical lens (Zeiss Makro Planar T100) by a CCD camera (Andor Ikon-L, 2048 × 2048 pix). The acquisition time was set to 20 s and images were acquired continuously during the measurements, with an acquisition rate of approximately 3 images per minute.
For the in-plane imaging mode, a gadolinium sheet forming a 2 mm wide vertical slit was used to increase the beam collimation in horizontal direction to a L/D ratio of 1750, in order to limit the blurring due to beam divergence. The anisotropic resolution enhancement method by detector tilting developed at PSI45 was used. The neutrons were captured using a 10 μm thick scintillator screen made of Gd2O2S, tilted to form an angle of 10° with the beam axis. The resulting light output image was collected through a set of two mirrors and a commercial optical lens (Zeiss Makro Planar T100) by a CCD camera (Andor Ikon-L, 2048 × 2048 pix). The acquisition time was set to 30 s and images were acquired continuously during the measurements, with an acquisition rate of approximately 2 images per minute.
Image processing
Precise and extensive information about the general methodology employed for image processing can be found elsewhere.46 In particular, for these experiments, the images were corrected for camera thermal noise and outliers where removed using a 3-dimensional filter (3 × 3 × 3 pixels) on the measured time sequences. Subsequently, the images were corrected for the spatial inhomogeneities of the neutron beam, for displacements of the cell compared to the reference image of the dry cell and for the background related to scattered neutrons,47 and a Gaussian blur filter (sigma = 0.75) was applied to remove the noise in high spatial frequencies. Finally, the images were divided pixel-wise by an image of the dry cell and averaged over 5 min to improve the signal-to-noise ratio.
The water thickness was calculated using the Lambert-Beer law:

where I is the intensity of the beam after the cell containing water and Iref is the intensity of the beam after the dry cell. Σ is the water attenuation coefficient that has a value of 0.35 mm−1 (for the NEUTRA beam line and for the used detector configuration) and x is the water thickness. To obtain the water profiles of the different tested cells, only the water in the rib regions was taken into account.
Results and Discussion
Selection of grafting depth by varying the electron energy
As mentioned before, the ability to choose whether the MPL is modified along with the GDL or remains fully hydrophobic is important. Our previous analysis determined that the minimum electron beam energy required to graft through the thickness of a GDL is 160 keV, and numerical simulations predicted that with an electron beam energy of 140 keV, the radiation should be stopped near the interface between GDL and MPL.42 The previous experiments were conducted on different GDL substrates (Toray TGP-H-060), but the Freudenberg H23 used here has a similar thickness and porosity. Considering that, besides the additional thickness it induces, the MPL has a higher density than the GDL, the penetration depth of an electron beam of a given energy will be smaller for bi-layer samples. Therefore, to modify the material through its thickness we expect that energies higher than 160 keV are required.
Figure 3 shows the measured amount of grafting from each side of the sample—as a reminder, the sample was exposed to an electron beam coming from the GDL side—using EDX and XPS as detection methods. As explained in the experimental section we replaced the protons of the acid group of the grafted compound by Na+ in order to detect it more reliably, and we normalize it to the amount of coating, measured by the F signal. The results obtained without irradiation (displayed as the point at zero energy) confirm that the source of Na signal is resulting from the ionic exchange of protons in the grafting.
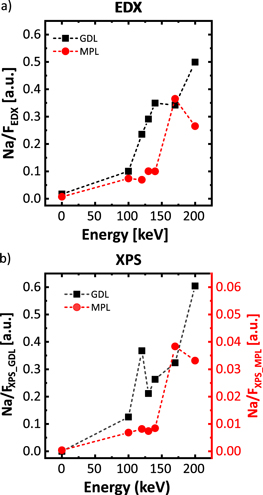
Figure 3. Chemical analysis of the grafted MPL depending on the electron radiation energy. (a) Result of EDX analysis of the content of Na/F on the GDL and the MPL. (b) Result of XPS analysis of the content of Na/F on the GDL and the MPL.
Download figure:
Standard image High-resolution imageThe analysis by EDX (Fig. 3a) shows a gradual increase of the Na/F signal for the GDL when increasing the electron energy. In theory, this energy should not impact the amount of grafting at the sample side which receives the radiation, as the radiation dose the sample receives is set as a constant. The energy of the electron beam will determine the penetration depth into the sample. Our interpretation of the increase of grafted amount on the GDL side at higher energies is that, since our samples are highly porous, we are probing the depth of the material while analyzing with EDX. The increase of radiation energy modifies deeper areas of the GDL and therefore increases the sample volume contributing to the measured signal.
Since the radiation was applied from the GDL side, we only expect to observe grafting from the MPL side once the electron energy is high enough to penetrate throughout the whole sample. This happens between 140 keV and 170 keV, where we detect a strong increase in the Na/F signal. Similar trends can be observed for the XPS analysis (Fig. 3b): The Na/F signal from the GDL side increases with electron energy—although the values are clearly more scattered than from the EDX analysis—and from the MPL side there is nearly no signal until 140 keV, and a strong increase between 140 keV and 170 keV. Even though the EDX and XPS data sets follow the same trends, the Na/F signal for XPS is one order of magnitude lower than for the EDX when measuring from the MPL side. This could be related to accumulation of fluoropolymer near the MPL surface or different distribution of the grafting degree on the MPL.
In summary, we identified that the most suitably electron energy for modifying the GDL only is 140 keV, as it provides the highest level of grafting in the GDL without modifying the MPL and electron energies higher than 140 keV allow to graft also the MPL.
Patterned wettability on the MPL side
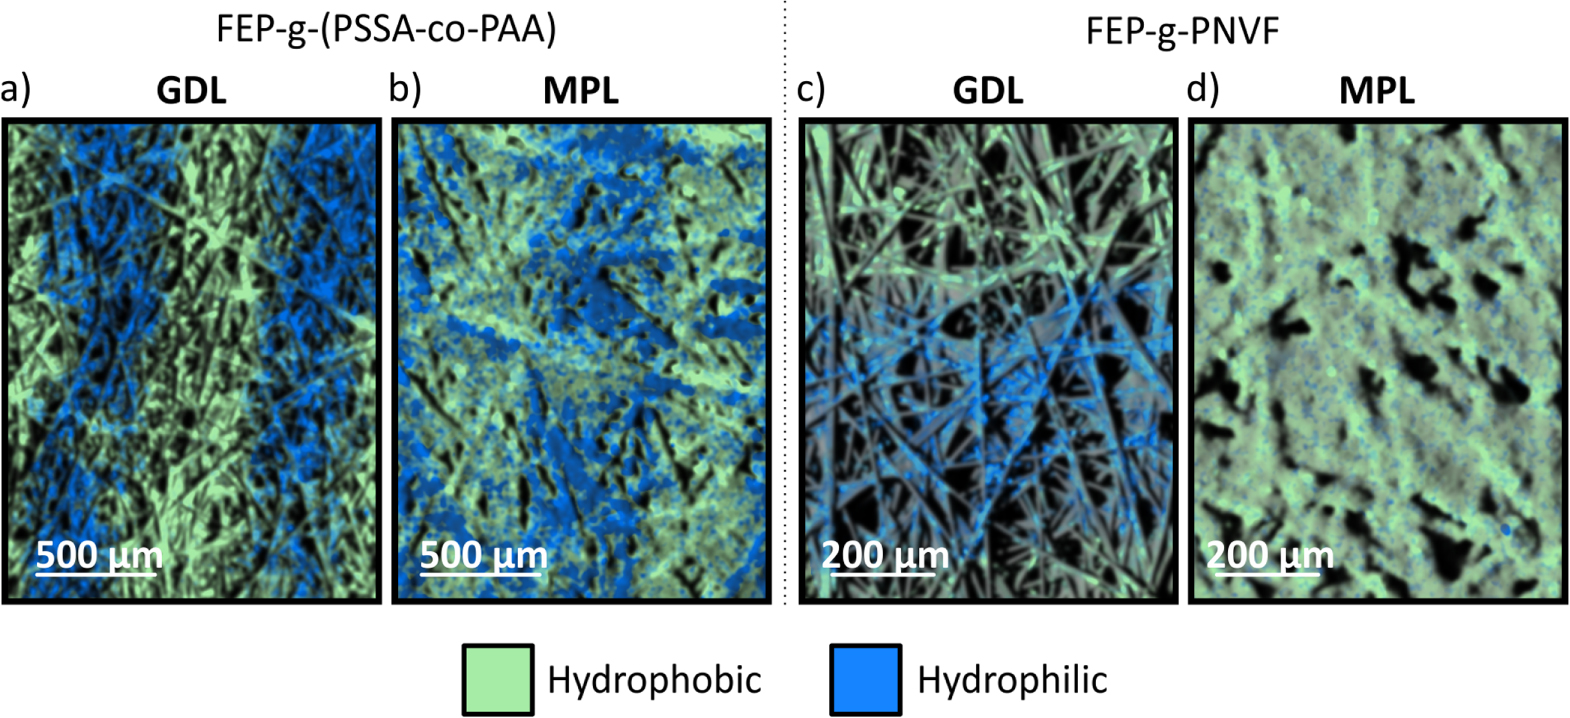
Once demonstrated that the MPL can be grafted, the next step was to create a patterned GDM. Since higher activation energies lead to a better defined pattern,42 the GDMs for which both MPL and GDL were grafted using an electron energy of 200 keV, which was the highest possible at the used electron beam. Figures 5a and 5b show EDX maps of such a modified GDM. It can be seen that the wettability pattern is clearly present in the MPL but less defined than in the GDL. One possible reason is that, due to the fine porosity and structure of the MPL, the grafting solution does not imbibe the material homogeneously, hindering the grafting in certain locations. Another possibility is that the carbon particles compete with the fluoropolymer for the radical formation (or act as radical scavenger) lowering the efficiency of the reaction. This is not an issue in the GDL because, in this case, the surface area of the carbon is much lower than in the MPL, and the fluoropolymer surface to be grafted is not in close vicinity to free carbon surfaces. In the MPL, the carbon particles have a mean diameter of 50 nm—resulting in a much larger surface area than for the GDL fibers having a diameter of 10 μm, and are closely mixed with the fluoropolymer which acts as a binder.
One fact that leads to this theory is that we have not been able to graft the MPL using NVF. (Figs. 5c and 5d). Our studies of grafting reaction kinetics and fourier transform infrared spectroscopy analysis in FEP films show that the grafting reactions with NVF are superficial, while grafting reactions with AA modify the bulk of the film, even over-growing the base polymer and becoming the main polymer.40 Reactions with SSA-AA induce a gradient where the grafting is mostly superficial but also result in a mild bulk modification. Our hypothesis is that the chemicals which induce more bulk reactions are able to overcome the reaction competition with the carbon and that this is the reason why we were able to graft with AA and SSA-AA but not with NVF (See S.I.1 is available on at stacks.iop.org/JES/167/064516/mmedia).
Mechanical characteristics of the MPL
As explained in the introduction, it has been shown that the cracks on the MPL can act as preferential water pathways since the capillary pressure through larger pores is smaller and the water permeability through the large pores is larger. The incorporation of a MPL to the GDL is crucial to obtain a PEFC with high performance. Our first attempt to incorporate a self-standing MPL to a grafted GDL showed the expected performance improvement. However, the water separation between the hydrophobic and hydrophilic regions was not as pronounced as when there was no MPL present. This difference in water distribution was attributed to the structural properties of the MPL. Since the MPL has smaller pores and lower permeability the necessary capillary pressure to break through this layer is more important than the capillary pressure differences obtained by changing the surface chemistry of the GDL. The water is transported through the MPL through the paths with lowest resistance to the GDL. If these paths lead to hydrophobic regions, it results in an undesired water accumulation there. Therefore, the incorporation of perforation in the MPL is expected to improve the efficiency of the grafting modifications in the GDL by establishing preferential pathways from the CL to the hydrophilic regions of the GDL.
In Fig. 4, optical microscope images of the surface of the different MPLs are shown (corresponding to the MPLs schematically illustrated in Fig. 1). Due to the opacity of the carbon particles, a polarization filter was required to image the MPL. This makes carbon fiber appear as white in the images (Fig. 4a) since they are more reflective than the MPL. By controlling the spraying methodology we can obtain two different types of MPL, a highly porous one (Fig. 4b) or a crack-free MPL (Fig. 4c). The crack-free MPL was further modified by punching holes or grafting. Studies analyzing the impact of a highly porous MPL34 reported that it can improve cell performance, highlighting the relevance of this type of material. Nevertheless, since one of the goals of our experiment was to incorporate features to the MPL and analyze the impact of such modifications on the water distribution in a GDL with patterned wettability, we casted crack-free MPLs to minimize the effect of the inhomogeneous structure.

Figure 4. Optical microscope images of different MPL surfaces. (a) Commercially available GDM, unmodified. (b) Highly-porous MPL, (c) Baseline sample, grafted GDL with crack-free MPL. (d) Grafted GDL with a crack-free grafted MPL. (e) Grafted GDL with a MPL with holes punched on top of the grafted lines, the yellow lines mark the region were the hydrophilic regions are in the GDL.
Download figure:
Standard image High-resolution image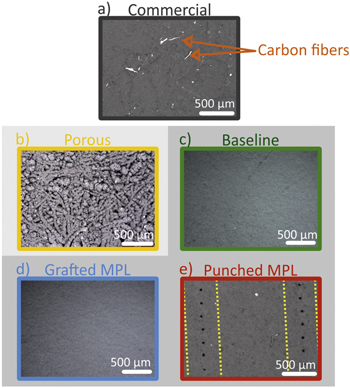
Figure 5. Chemical analysis using EDX mapping of GDL samples grafted with a pattern of 500 μm wide hydrophilic and 500 μm wide hydrophobic regions. (a), (b) Grafted with FEP-g-(PSSA-co-PAA). (a) GDL side, (b) MPL side. (c,d) Grafted with FEP-g-PNVF, (c) GDL side, (d) MPL side.
Download figure:
Standard image High-resolution imageThe images of the MPL surface of the crack-free MPL show no difference between the unmodified MPL (Fig. 4c) and the chemically modified (grafted) MPL (Fig. 4d), as expected. In Fig. 4e, the mechanically modified MPL with micro-holes of an approximate diameter of 50 μm, a separation of 200 μm and a penetration depth of 30 μm are shown.
To verify that the micro-holes in the MPL were properly positioned over the hydrophilic lines of the GDL, an X-ray computed tomography scan was performed. The sample was partially imbibed with water in order to make the hydrophilic portions of the GDL visible. Figure 6 shows two X-ray tomography slices of a GDM with punched micro-holes. These results confirm that the lines of micro-holes in the MPL (Fig. 6a) are aligned to the hydrophilic areas of the GDL (Fig. 6b).
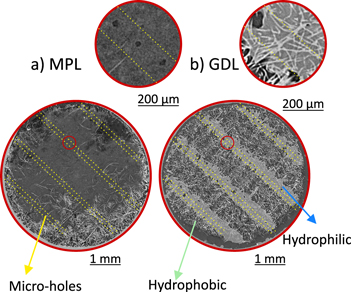
Figure 6. X-ray tomography slice of the GDM with punched micro-holes on the MPL. The yellow lines highlight the regions were the punched micro-holes are. (a) Slice showing the MPL. On the top right an insert magnification highlighting the micro-holes. (b) Slice showing the GDL. The brighter zone is where the water intrude showing the hydrophilic regions. On the top right an insert with a magnification image of the same region as for the MPL is shown.
Download figure:
Standard image High-resolution imageDifference between capillary pressure injection and electrochemical water injection
The key characteristic to determine the efficiency of the modifications incorporated to the GDM is how they affect the water distribution. The modifications—chemical and mechanical—are targeted to reduce, for defined pathways, the capillary pressure required for the water to be transported through the material, leading water to flow preferentially through these regions. This behavior can be tested by injecting water by capillary pressure and visualizing the water distribution in the material. We have already published the results and methodology of this testing method for several of our GDL samples with patterned wettability.25 This technique is very helpful to identify the samples and methods that are efficient at creating the water pathways but does not necessarily reflect the water distribution under real fuel cell operation.
Figure 7 shows the water distribution within the same type of GDL measured with neutron radiography using two different water injection methods. The GDL was a Freudenberg H23 carbon paper coated with 30% FEP and grafted with NVF with a pattern of 500 μm wide hydrophilic lines separated by 940 μm wide hydrophobic regions (no MPL). The water distribution varies significantly (Figs. 7a and 7b), as the capillary pressure injection method uses a hydrophobic layer that impedes water from leaving the set-up on the side opposite to the injection (see Fig. 2). Due to this, higher water saturation can be achieved and the material even reaches full saturation when using sufficiently high capillary pressures.25 With the electrochemical water injection method, water is produced in the CL and it is transported through the GDL over the pathway representing the lowest capillary barrier. Once this pathway is established, water exits the GDL to the flow channels and no further pressure can be build up. In consequence, much less water is accumulated and the pattern created by the water distribution is not as defined. Another difference between the two methodologies is that, in the capillary injection method, water can only be accumulated in the GDL under test. For the electrochemical water injection method, water can be present not only on the cathode side (where the test sample is), but also in the anode GDM. To clarify this, Fig. 7c shows an in-plane neutron radiograph of the sample tested with the electrochemical water injection method. It can be seen that the water accumulates mainly on the cathode side and under the rib region. Thus, water accumulated in the anode side masking the water on the cathode side cannot be the explanation for the absence of a clear pattern in the water distribution image acquired with the through-plane configuration (Fig. 7b). It must be noted that, with the in-plane imaging configuration, the patterned wettability cannot be analyzed since the pattern is perpendicular to the flow channels.
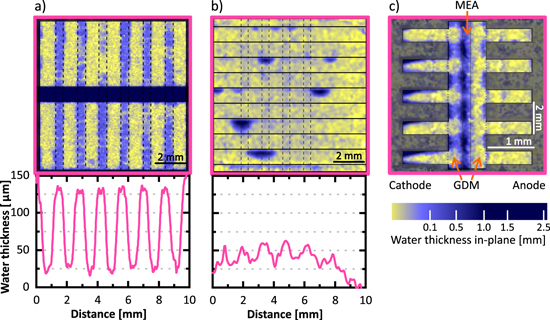
Figure 7. Neutron radiography images of the water distribution within the same GDL material, Freudenberg H23 with 30% FEP coating and no MPL, with two different water injection methods: Through-plane imaging configuration (a) capillary pressure injection and (b) electrochemical water injection. (c) In-plane imaging configuration and electrochemical water injection.
Download figure:
Standard image High-resolution imageFinally, an important difference between capillary pressure injection and electrochemical injection is the injection points. In both cases, the possible injection points are distributed over an extended area covering the hydrophobic and hydrophilic regions. However, with the capillary pressure injection method, all possible injection points are connected by the water supply channel, which allows the pressure to equilibrate and thus the water goes through the most favorable path in terms of capillary pressure barrier. With electrochemical injection, water needs to partially saturate the GDL in hydrophobic regions to create lateral transport pathways to the hydrophilic regions. As a consequence, a higher water saturation is obtained in the hydrophobic domains than with the capillary pressure injection method.
Water distribution in samples with an MPL
Figure 8a shows the neutron radiography of an electrochemical water injection experiment for our "baseline" sample, a GDL with patterned wettability and an unmodified hydrophobic crack-free MPL. In comparison to the sample without MPL (Fig. 7b), the separation between hydrophilic and hydrophobic domains is not visible anymore. To analyze in more detail the origin of these differences in water distribution, another electrochemical water injection set-up was built with an extra hydrophobic layer on the cathode side (see experimental, Fig. 2). This layer hinders the water transport to the flow channels and allows to accumulate similar amounts of water as with the capillary injection method. We also compare both electrochemical water injection methods with the water distribution under operation. There is not much difference between the water distribution with the electrochemical injection method without and with the hydrophobic barrier (Figs. 8a and 8b) when the water content is low. The main difference is the possibility to achieve higher water saturations (Fig. 8c) when a hydrophobic barrier is added. In that case, the impact of the wettability pattern is noticeable. Nevertheless, it is not as defined as when the sample is measured using the capillary pressure injection method (Fig. 7a). The results obtained with electrochemical water injection with a hydrophobic barrier are the most similar to the water distribution measured for a fuel cell in operation (Fig. 8d).
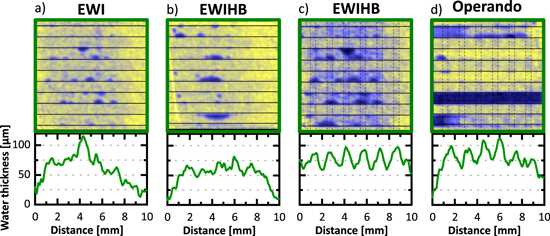
Figure 8. Neutron radiography images and average water thickness profile under the ribs for the electrochemical water injection (EWI) methods for the baseline material (GDL with patterned wettability and crack-free MPL) with and without hydrophobic barrier. (a) Step 6 of the experiment without hydrophobic barrier, (b) step 6 of the experiment with hydrophobic barrier (EWIHB), (c) step 9 of the experiment with hydrophobic barrier and (d) in operando without hydrophobic barrier at 50 °C, current density 2 A· cm−2, anode flow: 700 NmL·min−1 H2, cathode flow: 1500 NmL·min-1 Air, pressure 2 barabs, relative humidity: 90%.
Download figure:
Standard image High-resolution imageTo understand the differences between these experiments, several factors have to be taken into account. The first of these factors is the impact of the MPL. Unfortunately, our capillary pressure set-up did not allows us to reach capillary pressure high enough to break through the MPL, so this impact will be discussed on the basis of the electrochemical injection results. When a MPL is added, its fine porosity creates a hydrophobic barrier and the necessary capillary pressure for the water to permeate through is significantly higher than when there is no MPL. The produced water permeates through this barrier using the path with less capillary pressure, generating randomly distributed water injection points from the MPL into the GDL.16 Since there is no preferential pathway through the CL, there is the same probability for injection points to be in a hydrophobic or in a hydrophilic area. If the injection point lands on the hydrophobic region water needs to be transported laterally towards the hydrophilic region. As mentioned previously, this lateral transport is also required when no MPL is used, but it is apparent that the forcing of specific injection points by the MPL further hinders the lateral transport and the formation of the water distribution pattern.
Additionally it must be consider that when water is produced in the CL it can be transported through the GDM either in liquid or in vapor form. We have already discussed how the transport of liquid water takes place; for the gas transport it depends on the vapor water diffusion through the GDM and is not influenced by the surface chemistry. Nevertheless, due to the temperature differences in the cell the water is subjected to condensation/evaporation events. Where the condensation takes place depends mostly on temperature differences and local cold spots in the GDL. Although this is an important factor in the water distribution in a fuel cell, it is not the main reason of the differences in water distribution seen with the capillary injection method and operando cell test. The water distribution for the sample tested by electrochemical water injection with hydrophobic membrane is very similar to the water distribution for the same sample tested in operando. The capillary pressure test was performed at room temperature, the electrochemical water injection test was performed at 35 °C meanwhile the operando test was performed at 50 °C.
The fact that there is no hydraulic connection between the injection points is the key aspect that makes the water content in the hydrophobic region higher when the electrochemical water injection is used. This hinders the water separation due to the patterned wettability.
Impact of MPL modifications
We used the electrochemical water injection method with a hydrophobic barrier to compare the three different GDMs with different MPL characteristics (Fig. 9). The in-plane radiographies (Figs. 9d–9f) show that the produced water mostly accumulates in the cathode GDM. It must, however, be noticed that the water content in the anode channels is increased compared to the experiment with no hydrophobic barrier (Fig. 7c). This is to be expected, since due to the higher water pressure in the cathode the water diffuses to the anode side. When comparing the water content for different MPL modifications this fact must be considered since the water in the anode, although lower than in the cathode, can no longer be neglected. Nevertheless, as the anode GDM has no patterned wettability, water accumulating on this side can be regarded as a constant offset, which does not influence the visualization of water distribution in the cathode GDM wettability pattern.

Figure 9. Neutron radiography images and water thickness profiles of three different types of modified GDMs during electrochemical water injection experiment with hydrophobic barrier. Through-plane radiograph image and average water profile under the ribs for the (a) baseline sample, (b) sample with punched MPL and (c) sample with grafted MPL. In-plane water thickness profile for the (d) baseline sample, (e) sample with punched MPL and (f) GDM with grafted GDL and grafted MPL.
Download figure:
Standard image High-resolution image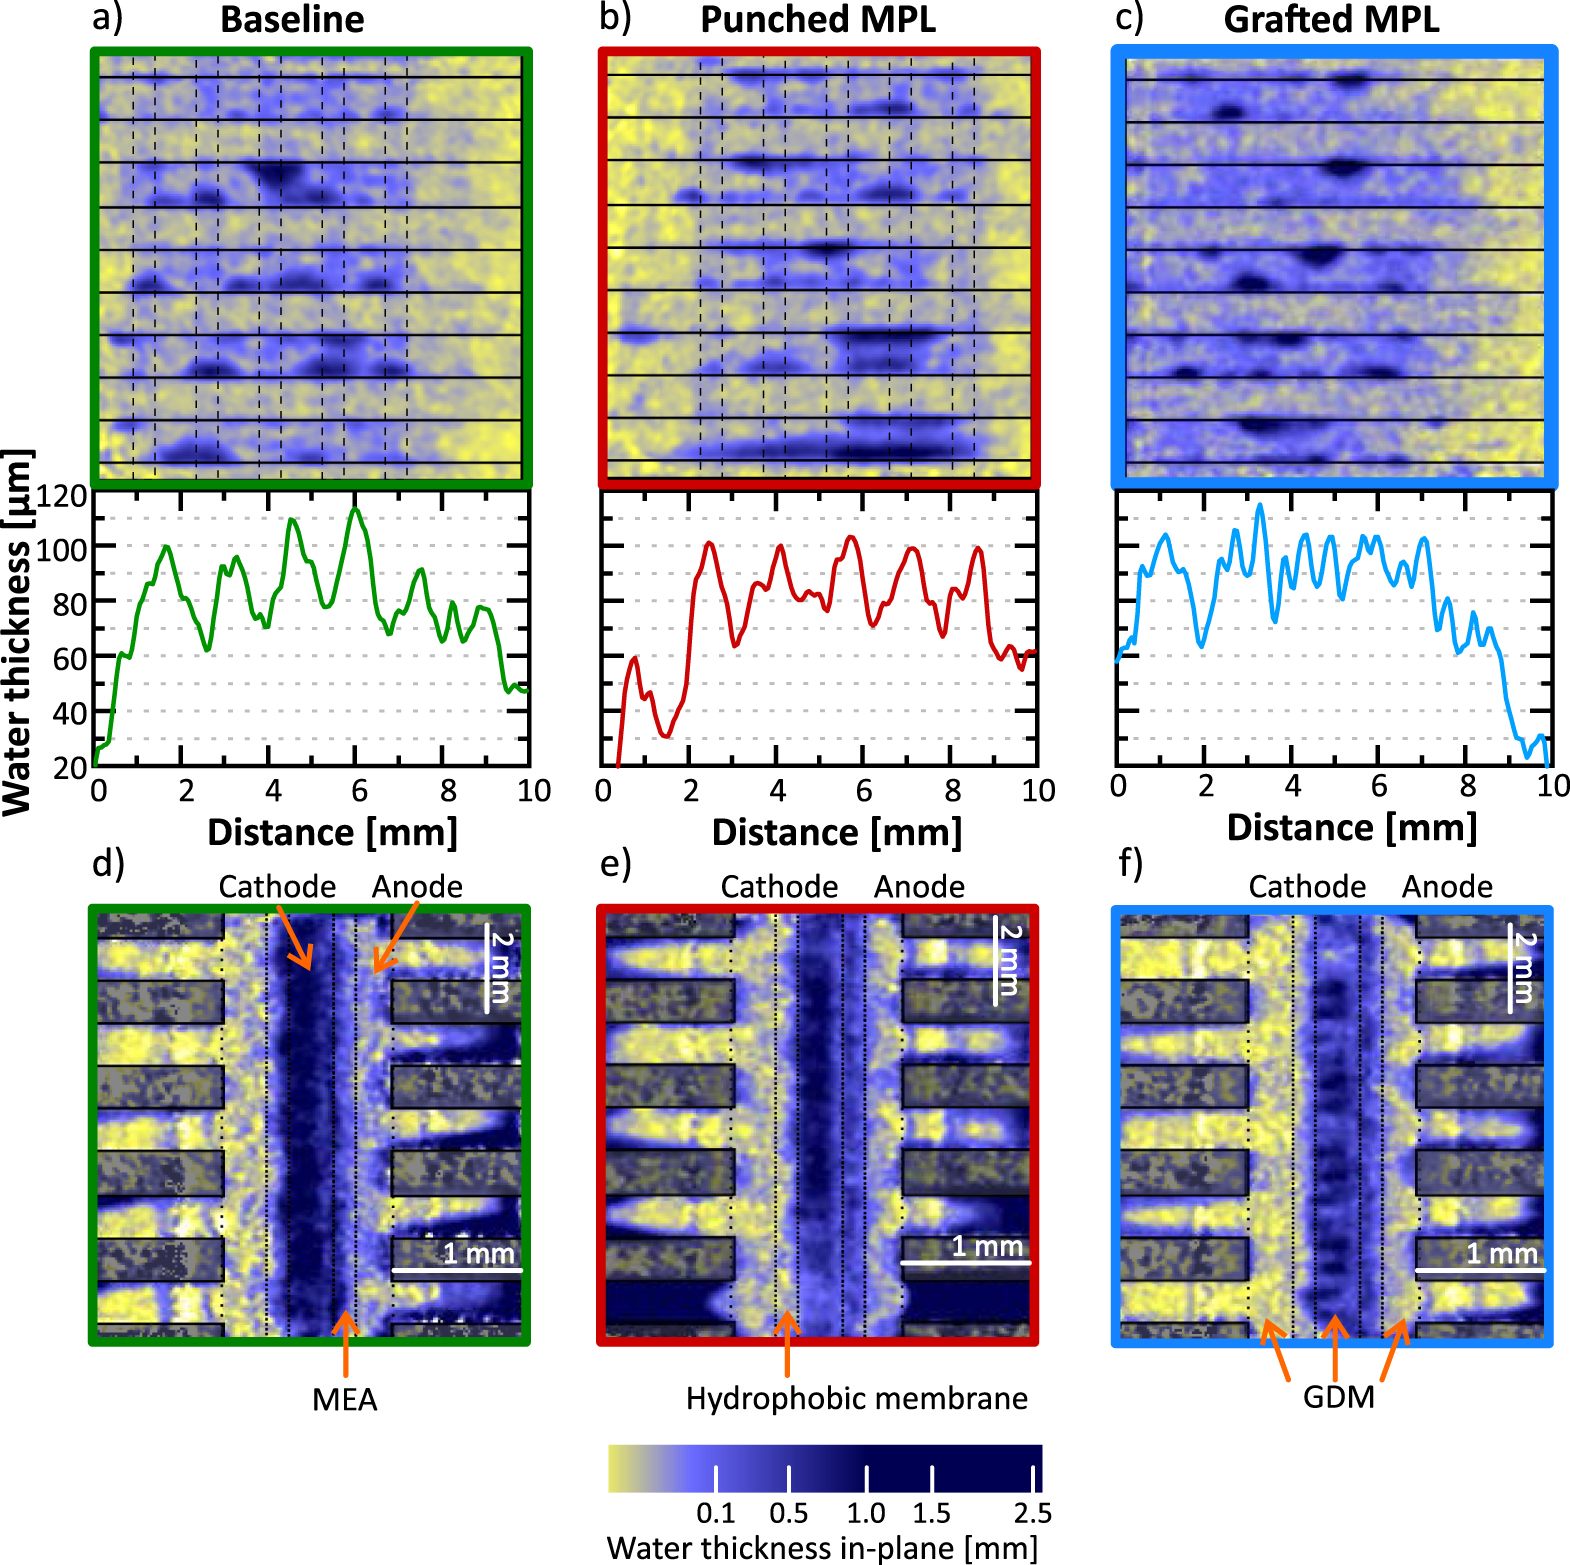
There are no significant differences between the water content of the baseline sample (Fig. 9a) and the sample with holes punched into the MPL (Fig. 9b): both samples have an average water thickness of approximately 80 μm, and the impact of the patterned wettability is visible in both samples.
This is not the case for the sample with a grafted MPL (Fig. 9c). The average water content of this sample is slightly higher (approximately 90 μm), but no pattern of water accumulation can be observed. A possible reason to explain why the pattern is not defined for the sample with grafted MPL is that we used a different grafting chemistry. The chemistry of the sample with grafted MPL is FEP-g-(PSSA-co-PAA) which yields a contact angle of 45° (see S.I.1), in comparison to the contact angle of 30° for the two samples grafted with FEP-g-NVF. One of the main elements to ensure an efficient water separation is to have a high enough difference between the contact angle of the hydrophobic and hydrophilic regions. The lower this difference, the less effective is the pattern.
In summary, although the success of the local modifications of the MPL (hydrophilic grafting and punched holes) was confirmed by ex situ characterization, they do not have a clear impact on the water distribution when injecting the water electrochemically.
The reason for using preferential water pathways is to limit the water content in the hydrophobic regions, and our results show that the effect is mostly favoring water accumulation in the hydrophilic regions without reducing the water content in the hydrophobic regions (compare Fig. 8b to S.I.2). This is due to the water being injected to the GDM through localized and hydraulically disconnected small spots (in the order of a few micrometers) when the water is produced electrochemically. These spots are randomly distributed through the MPL. To achieve that the GDM modifications reduce the water content in the hydrophobic regions the water injected here has to be transported laterally through the MPL, CL or membrane to a hydrophilic region before the break through to the GDL. Our hypothesis is that this lateral transport requires a higher pressure than the one required for water break through the GDM in hydrophobic regions. In the future, the MPL modifications (either chemical or mechanical) can focus on promoting water lateral transport through the MPL in order to canalize the water injection in the hydrophilic regions of the GDL.
Conclusions
Different types of gas diffusion media with incorporated modifications were developed and characterized. The summary of our findings can be found here.
- Having control over the synthetic procedure allows to adapt the modifications to the system requirements and to comprehend the limitations of its applicability. We have demonstrated that the extent of the grafting modification can be controlled by controlling the energy of the electron beam used for the sample activation. We have proven that it is possible to modify selectively only the GDL and both simultaneously, GDL and MPL. We can also control the MPL preparation to obtain a MPL highly porous or crack-free. In addition, we developed a technique to mechanically modify the MPL by generating holes in a controlled fashion, where the positioning of the hole, diameter, depth and the spacing can be selected.
- The addition of an MPL to a GDL with pattern wettability reduces the water separation between the hydrophobic and hydrophilic regions. The introduction of "weak spots" in the MPL does not seem to be sufficient to canalize the water injection to the hydrophilic regions of the GDL. In the case of the locally grafted MPL, the selective filling of the GDL fully disappears, which might be related to the different grafting chemistry used in that case.
- Capillary pressure experiments are helpful to characterize the wettability of GDLs, but do not necessarily reflect the behavior of the material under operation. A series of intermediate setups between capillary pressure water injection and fuel cell operation were used to elucidate the origin of these differences. Testing the water distribution by electrochemical water injection through a double dead ended fuel cell operation with and without a hydrophobic barrier shows that the main difference between capillary pressure characterization experiments and fuel cell operando experiments lies on the hydraulic connection of the injection points and higher GDM water saturation.
Acknowledgments
The authors gratefully acknowledge the Swiss National Science Foundation (SNSF) for funding (project no. 172474), Pia Klee for her assistance with sample preparation and during the performance of beam time experiments and Elias Rehmann for technical support at Brugg FHNW.