
Abstract
In this paper, the PEDOT-type conducting polymers/black TiO2 composites were prepared by in situ polymerization method by varying the weight ratio of black TiO2 to monomer (3,4-ethylenedixoythiophene(EDOT) or 3,4-propylenedixoythiophene (ProDOT)). And, these composites (PEDOT/B-TiO2 and PProDOT/B-TiO2) were applied for the electrochemical determination of Cd2+ and Pb2+ by using differential pulse voltammetry (DPV). The relationship between the structure and electrochemical performances was studied systematically. The structural analysis revealed that the PEDOT-type conducting polymers could act with B-TiO2 by non-covalent bonding. The combination of polymers with B-TiO2 effectively enhanced adsorption and charge transfer ability of composites to heavy metal ions, which was favorable for enhancing the eletrcocatalytic ability of composites. The results showed that under optimized conditions, the limit of detection (LOD) of the PEDOT/B-TiO2 composite electrode from 50 wt% B-TiO2 are 0.00073 μM and 0.0816 μM, respectively, and the linear range of simultaneous detection of Pb2+ and Cd2+ is from 0.04 to 1.24 μM. In the case of PProDOT/B-TiO2, the LOD of composite electrode from 50 wt% B-TiO2 for Pb2+ are 0.00087 μM (0.04–0.4 μM) and 0.00186 μM (0.4–1.8 μM), respectively, and the LOD for Cd2+ are 0.01523 (linear range of 0.04–0.4 μM) and 0.03214 (linear range of 0.4–1.8 μM), respectively.
Export citation and abstract BibTeX RIS

This is an open access article distributed under the terms of the Creative Commons Attribution 4.0 License (CC BY, http://creativecommons.org/licenses/by/4.0/), which permits unrestricted reuse of the work in any medium, provided the original work is properly cited.
In recent decades, the use of titanium dioxide (TiO2) has increased due to its advantages, such as relatively low cost, nontoxicity, good chemical and thermal stability, and strong adsorption capacity for metal ions.1 TiO2 is used for applications such as dyed solar cells,2 photocatalysis,3 sensors4 and removal of organic and inorganic pollutants.5 In recent years, the black titanium dioxide (B-TiO2) has attracted much attention from researchers. Compared with traditional TiO2, B-TiO2 has more Ti3+ or oxygen vacancies (V0),6 and the oxygen vacancies can change the electronic structure of ions and electron transfer in metal oxides without affecting crystal stability,7 consequently these defects can play active centers of redox reactions to regulate the surface electron state.8,9 Chen et al. reported the nanostructured B-TiO2 as an anode in sodium-ion batteries.10 Han et al. studied a photocatalyst from B-TiO2 for degradation of phenol under visible-light.11 Up to now, the alternative materials are used to combine with nano-B-TiO2 to enhance the performance of B-TiO2.12–14
According to previous reports, the modification of B-TiO2 by different materials such as carbon material, metal material and π-conjugated polymer not only reduce the electron-hole recombination rate, but also improve the electronic transmission capacity of the composite.15,16 Among them, π-conjugated polymers have been recognized as excellent candidates for high-performance material with particular structure and excellent optical, electrochemical properties.17–19 The combination of π-conjugated polymers with nano-TiO2 can bring an improvement of electrochemical behaviors.20 The PEDOT-type conducting polymers, such as PEDOT and PProDOT are particularly important in practical applications due to their low oxidation potential, good electrical conductivity and good stability.21–25 However, there are few reports on the preparation of PEDOT-type conducting polymer/B-TiO2 composites.
In this work, we selected the 3,4-ethylenedixoythiophene (EDOT) and 3,4-propylenedixoythiophene (ProDOT) as monomers for PEDOT-type conducting polymers/B-TiO2 composites. According to report of Guo et al., the sulfur atoms in thiophene ring take the oxygen vacancy in B-TiO2 as the adsorption center, and the sulfur atom occupies the oxygen vacancies (V0) to form S-Ti bond.26 Therefore, it can be assumed that the monomers (EDOT and ProDOT) are chemically adsorbed on the surface of B-TiO2 by the combination of the oxygen vacancies in B-TiO2 with sulfur atoms in EDOT and ProDOT. This kind of chemical adsorption of EDOT and ProDOT molecules on the surface of B-TiO2 can bring a possibility for preparing the PEDOT-type conducting polymer/B-TiO2 composites by in situ polymerization. In addition, it can enhance the interactions between the B-TiO2 and polymers, and the oxygen vacancies of B-TiO2 can be used as the active center of redox reactions to regulate the surface electron state.27 The modification of B-TiO2 with PEDOT type conductive polymer can increase the number of electrons on the conduction band and make more O2 to form a superoxide radical which could strongly adsorbs more heavy metal ions.28 Meanwhile, the oxygen and sulfur atoms on the thiophene rings in the PEDOT-type conducting polymer can interact with metal ions, which may bring a strong adsorption capacity of composites for metal ions. By combining the PEDOT-type conductive polymers with B-TiO2, the conduction path on the electrode surface can be improved, and the strong synergistic effect between the polymers with B-TiO2 enhances the sensitivity of ions detection. Based on the above consideration, the PEDOT/B-TiO2 and PProDOT/B-TiO2 composites were prepared by in situ polymerization method by varying the wt% (B-TiO2). And, these composites were applied for the electrochemical determination of Cd2+ and Pb2+ by using differential pulse voltammetry (DPV). The relationship between the structure and electrochemical performances was studied systematically.
Experimental
Materials
3,4-ethylenedioxythiophene (EDOT), 3,4-Propylenedioxythiophene (ProDOT) and anhydrous ferric chloride were obtained from Aldrich and used as received. Tetrabutyl titanate and all other chemicals and solvents were used as received without further purification.
Preparation of B-TiO2
B-TiO2 is prepared by reported methods.29 First, 1 g urea and 14 ml tetrabutyltitanate are added to a beaker containing 20 ml ethanol and stirred with a glass rod. Then, 1 ml hydrochloric acid and 5 ml deionized water were added to 10 ml ethanol, and the mixture was slowly added to the other solution. In the process of stirring and dripping, a TiO2 sol is prepared. The prepared product was dried in an oven at 80 °C for 5 h. The dried solid samples are then ground in a mortar. Finally, the white solid powder is placed into a tube furnace and sintered at 500 °C in N2 atmosphere, and the black powder (B-TiO2) was obtained.
Preparation composites
The composites (PEDOT/B-TiO2 and PProDOT/B-TiO2) were prepared by in situ chemical oxidative polymerization. First, B-TiO2 (0.1 g), hexadecyl trimethyl ammonium Bromide (CTAB 0.1312 g) and chloroform (30 ml) are added to the monomer (EDOT or ProDOT) and ultrasonically dispersed for 30 min. Then, FeCl3 and chloroform (10 ml) are added into a reaction medium and ultrasonically dispersed for 10 min. Finally, the completely dispersed oxidant is added to the reaction medium and reacted for 24 h under magnetic stirring. The products were alternately washed with chloroform, methanol and distilled water and then dried in a vacuum drying box at 60 °C for 12 h. The experimental details and denotation of composites are listed in Table I.
Table I. The different feed ratios of B-TiO2 to EDOT and PProDOT.
| Sample | EDOT(g) | ProDOT(g) | B-TiO2(g) | Weight ratio |
|---|---|---|---|---|
| 1 | 0.9 | 0 | 0.1 | 10 wt% |
| 2 | 0.1 | 0 | 0.1 | 50 wt% |
| 3 | 0.1 | 0 | 0.9 | 90 wt% |
| 4 | 0 | 0.9 | 0.1 | 10 wt% |
| 5 | 0 | 0.1 | 0.1 | 50 wt% |
| 6 | 0 | 0.1 | 0.9 | 90 wt% |
Preparation of the modified electrodes
The bare glassy carbon electrode (GCE) is polished with 0.3 and 0.05 μm alumina slurries in sequence. The electrode is rinsed in an ultrasonic bath with a nitric acid solution, isopropyl alcohol and ultrapure water for 5 min each. The geometric area of GCE is about 0.1256 cm2, the suspension concentration of 2 mg ml−1. Then, the electrochemical sensor is prepared by dripping 5 μl composites on GCE surface by drop-coating technique, and the final surface loading of the modified electrode is 0.0796 mg cm−2. Finally, it is dried at 40 °C. The obtained modified electrode is called PEDOT-type conductive polymer/B-TiO2.
Characterization and electrochemical measurements
The structure and element content of the product are analyzed by Fourier transform infrared spectroscopy (FT-IR), ultraviolet–visible absorption spectroscopy (UV–vis), X-ray diffraction (XRD), X-ray photoelectron spectroscopy (XPS) and energy-dispersive X-ray spectroscopy (EDS), and the morphological characteristics of the material are studied by scanning electron microscopy (SEM) and transmission electron microscopy.30 All electrochemical measurements are carried out with an electrochemical workstation CHI 660 C (ChenHua Instruments Co, Shanghai, China) at room temperature. In electrochemical measurement, platinum electrode is used as opposite electrode, saturated mercury electrode (SCE) is used as reference electrode, and modified GCE (diameter 4 mm) is used as working electrode. The GCE was modified by the drop-coating method as follows: first, the complex solution (2 mg ml−1, isopropanol and ultra-pure water as the solvent) was dropped onto the surface of a clean GCE and then dried at 40 °C. Pb2+ and Cd2+ ions were detected by differential pulse voltammetric (DPV). The test conditions are as follows: buffer solution 0.1 M ABS (pH = 4.5), deposition potential: −1.2 V, potential range from −1.2 to +0.2 V, deposition time: 180 s, amplitude: 0.05 V, increment potential: 0.002 V, pulse width: 0.05 s, pulse period: 0.1 s. The limit of detection can be estimated according to the formula (LOD = 3S/N), where S is the testing of 10 times blank sample the standard deviation and N is the slope of the corresponding linear relationship of the test sample.31
Results and Discussion
SEM and TEM studies
Figures 1a–1c presents the SEM and TEM images of B-TiO2. It can be observed from the images that there is an obvious disordered layer on the surface of the B-TiO2 which is similar to the previous report.32 The thickness of the disordered layer on the surface of the B-TiO2 nanocrystal is approximately 1 nm.33

Figure 1. (a) SEM and (b)–(c) TEM images of the B-TiO2; (d)–(f) SEM and (j)–(l) TEM images of the PEDOT/B-TiO2 (10 wt%), PEDOT/B-TiO2 (50 wt%) and PEDOT/B-TiO2 (90 wt%); (g)–(i) SEM and (m)–(o) TEM images of the PProDOT/B-TiO2 (10 wt%), PProDOT/B-TiO2 (50 wt%) and PProDOT/B-TiO2 (90 wt%).
Download figure:
Standard image High-resolution imageFigures 1d–1f and 1j–1i show the SEM and TEM images of PEDOT/B-TiO2 (10 wt%), PEDOT/B-TiO2 (50 wt%) and PEDOT/B-TiO2 (90 wt%), respectively. It is clear from Figs. 1d–1f and 1j–1i, with the increase in the amount of B-TiO2, the morphologies of the composites change from irregular structure to spherical structure. The PEDOT/B-TiO2 (10 wt%) shows irregular shaped particles accompanying with some fibrous structure. In the case of PEDOT/B-TiO2 (50 wt%), the composite displays rod-like structure with porous structure and the mutual adhesion phenomenon disappears in the case of PEDOT/B-TiO2 (10 wt%), and the shape of the particles in the composite system is multispherical, which is similar to the morphology of B-TiO2. Figures 1g–1l and 1m–1o show the SEM and TEM images of PProDOT/B-TiO2 (10 wt%), PProDOT/B-TiO2 (50 wt%) and PProDOT/B-TiO2 (90 wt%), respectively. As shown in Figs. 1g–1l and 1(m)–1(o), with the increase in the amount of B-TiO2, the morphologies of the composites change from short fibrous structure (PProDOT/B-TiO2 (10 wt%)) to coral-like structure with porous structure (PProDOT/B-TiO2 (50 wt%)), then to irregular shaped particles accompanying with some fibrous structure (PProDOT/B-TiO2 (90 wt%)).
All these morphological differences imply that the presence of B-TiO2 can affect the microstructure of composites. With the increase in the amount of B-TiO2, the morphology of the composites also changes significantly. In the case of the lowest 10 wt% B-TiO2, the composites show short rod-like particle morphology. As the amount of B-TiO2 increases, the composites exhibit a coral-like morphology. However, in the composite system, when the amount of B-TiO2 is 90 wt%, most of the coral-like morphology disappears, revealing similar morphology to that of B-TiO2. Figure 2 shows a schematic illustration of the preparation process of composites. At the beginning of the polymerization, the monomers can be adsorbed on the surface of B-TiO2, which may be resulted from the interactions between B-TiO2 and monomers by the combination of the oxygen vacancies in B-TiO2 with sulfur atoms in monomers.34 Accordingly, the monomer molecules adsorbed on the surface of B-TiO2 are polymerized to form polymer chains. As is reported, the monomer and the newly formed nanofibrous oligomers can act as a soft template for the formation of the nanofibrous structure of PEDOT.35 Therefore, the fibrous, network and coral-like structures occurred in respective composites are mainly coming from growing tendency of monomers. And, the 50 wt% of B-TiO2 can be an appropriate amount for forming a network structure (PEDOT/B-TiO2) and coral-like structure (PProDOT/B-TiO2) in composites. And, the small sized B-TiO2 nanoparticles uniformly distribute in the polymer matrix and adhere to network structure (PEDOT/B-TiO2) and coral-like structure (PProDOT/ B-TiO2) of composites. This kind of morphological characteristics can be benefit for the enhancement of synergetic effect. The strong adhesions of B-TiO2 on the surface of network and corals as well as the porous structure of composites are the main factor for enhancing the electrocatalytic activity towards the detection of ion.
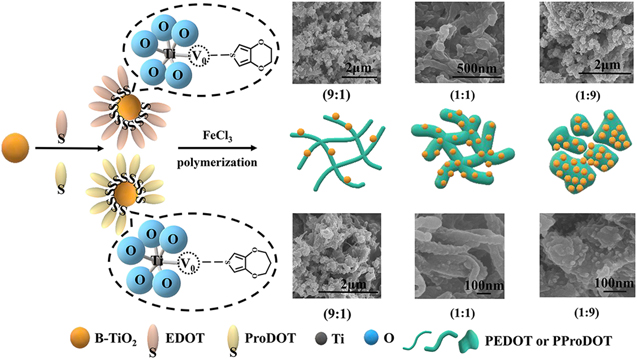
Figure 2. Schematic illustration of the preparation process of PEDOT-type conductive polymer/B-TiO2 composites.
Download figure:
Standard image High-resolution imageEnergy-dispersive X-ray spectroscopy and mapping
Figures 3a∼3d depicts the SEM mapping images of PEDOT/B-TiO2 (50 wt%) and PProDOT/B-TiO2 (50 wt%). It can be seen that there are four elements of C, O, S and Ti, and they are uniformly distributed in composites. In addition, the weight percentage of Ti in PEDOT/B-TiO2 (50 wt%) is 7.8%, while it is 12.9% for that of PProDOT/ B-TiO2 (50 wt%).

Figure 3. Elemental mapping images of (a) PEDOT/B-TiO2 (50 wt%) and (b) PProDOT/B-TiO2 (50 wt%); EDS spectrum of (c) PEDOT/B-TiO2 (50 wt%) and (d) PProDOT/B-TiO2 (50 wt%).
Download figure:
Standard image High-resolution imageStructure characterization
Figure 4a shows the FTIR spectra of PEDOT, B-TiO2 and PEDOT/B-TiO2 composites. As shown in Fig. 4a, the spectra of PEDOT/B-TiO2 are similar to that of pure PEDOT, the asymmetric stretching mode of C=C and the interring stretching mode of C–C are 1513 and 1324 cm−1, respectively.36 The C–O–C bending vibration in the ethylenedioxy group is 1194, 1141, and 1051 cm−1, respectively.37 The characteristic bands of C-S-C bond stretching vibration of thiophene ring are 976, 834, and 685 cm−1, respectively, indicating that the polymer has been successfully prepared.38 The FTIR spectrum of B-TiO2 shows distinct −OH stretching vibrations at 1562 cm−1 and flexural vibrations at 1402 cm−1, indicating the presence of reductive Ti3+ and oxygen vacancy(V0).28,39 The spectra of PEDOT/B-TiO2 composites can reflect the characteristic peaks of PEDOT and B-TiO2.

Figure 4. (a)–(b) FT-IR spectra; (c)–(d) UV–vis spectra; (e)–(f) XRD patterns of the composites.
Download figure:
Standard image High-resolution imageFigure 4b shows the FTIR spectra of PProDOT and PProDOT/B-TiO2 composites. The asymmetric tension of C=C and the interring tension of C–C are visible at ∼1495 and ∼1320 cm−1, respectively.40 The C–O–C bending vibration of the epoxy propyl alkyl is at ∼1175 and ∼1045 cm−1 .41 The vibrational bands at ∼840 and ∼660 cm−1 are the stretching vibrations of the C–S–C bond of the thiophene ring. The vibrations at ∼775 and ∼435 cm−1 indicate the formation of a polaron charge in the thiophene. The C-S telescopic vibration of thiophene quinone structure is at ∼1125 cm−1 ,42 indicating the successful incorporation of PProDOT in the composites.43 Although the main bands of composites are similar to those of polymers, several discrepancies are observed between polymers and the composites. Compared with polymers, the position and intensity of the characteristic peaks in composites change slightly. Additionally, the characteristic peaks of B-TiO2 are obvious in the case of composites from 10 wt% of B-TiO2, while these peaks are almost invisible in other composites, resulting from low amount of B-TiO2 and overlapping of the characteristic peaks of B-TiO2 with that of polymers.44
Figure 4c shows the UV–vis spectra of PEDOT, B-TiO2 and PEDOT/ B-TiO2 composites. The pure PEDOT displays a broad absorption peak from 400 to 650 nm, which is assigned to the π–π* transition of the thiophene ring.33 The PEDOT/B-TiO2 composites show all the characteristic peaks of the polymers. It is found that the characteristic peaks of the PEDOT/B-TiO2 (50 wt%) is wider than that of other two composites of PEDOT/B-TiO2. This can be understood by the synergistic effect between PEDOT and B-TiO2 which can cause an increase in conjugation degree of polymer chains.45 Figure 4d shows the UV–vis spectra of PProDOT and PProDOT /B-TiO2 composites. It can be found that pure PProDOT has three strong characteristic peaks at ∼425, ∼455 and ∼500 nm. According to the previous reports,42,46 the peaks at ∼425, ∼455 and ∼500 nm are caused by the π–π* transition of the thiophene ring. In the case of the PProDOT/B-TiO2 composites, the characteristic peaks appearing at ∼620 nm are caused by the conjugated segments with different conjugated lengths and the p-doping of the polymer chains.32,47 And, the peak at ∼620 nm in PProDOT/B-TiO2 (50 wt%) is broader than other two PProDOT/B-TiO2 composites. Comparing with both pure polymers, it can be concluded that 50 wt% of B-TiO2 in reaction system can lead a significant increase in the conjugated degree of polymers chains.
Figure 4e shows the XRD patterns of PEDOT, B-TiO2and PEDOT/B-TiO2 composites. The X-ray diffraction spectrum of pure PEDOT shows only one characteristic peak, at approximately 2θ = 25.9°,33 which is related to intermolecular π–π* stacking, corresponding to the (020) reflection of the polymer backbone.48 The characteristic peaks of B-TiO2 at 25.5°, 37.9°, 48.1°, 54.2°, 55.2° and 62.7° are observed, corresponding to the (101), (004), (200), (105), (201), and (204) crystal faces of anatase TiO2, respectively, which is in accordance with the previous report for B-TiO2.8 After N2 reduction at 500 °C, the diffraction peaks of the B-TiO2 nanostructures are consistent with those of anatase TiO2 and show almost no change, indicating that the B-TiO2 nanostructures have structural stability and most of the oxygen defects and the Ti3+ structure are located on the surface of the crystal.39 The diffraction peaks of B-TiO2 can be clearly observed in the XRD pattern of the composites, but the intensity is lower than that of pure B-TiO2. As the amount of B-TiO2 increases, the characteristic diffraction peaks of B-TiO2 become increasingly more obvious. Figure 4f shows the XRD patterns of PProDOT and PProDOT/B-TiO2 composites. The characteristic diffraction peaks of B-TiO2 are found in the XRD patterns of the composites.10 The pure PProDOT has a wide diffraction peaks at 2θ = 24°, indicating that the PProDOT has a small degree of crystallization and an amorphous structure, which is similar to the results reported for other polythiophene derivatives.32 Comparing with the pure polymers, there is no new characteristic peak except that of B-TiO2 in composites. However, the intensity of the characteristic diffraction peaks of B-TiO2 are low in the case of composites, which may be cause by the B-TiO2 particles embedding in the polymer matrix of the composites.49
X-ray photoelectron spectroscopy
Based on the structural analysis from SEM, TEM, FTIR, UV–vis and XRD, it is found that the addition of B-TiO2 results in a unique structure and morphology of the composites. The surface chemical compositions and valence states of PEDOT/B-TiO2 (50 wt%), PProDOT/B-TiO2 (50 wt%) and B-TiO2 nanostructures are characterized by the XPS analysis and the results are shown in Fig. 5. Figure 5a shows the XPS spectra of B-TiO2, and the result shows that the Ti 2p3/2 and Ti 2p1/2 peaks of B-TiO2 do not have obvious shift comparing with that in the report.14 The O 1 s peak of B-TiO2 can be divided into two peaks by the Gaussian method at 530.28 eV and 532.08 eV as the O 1 s peak is asymmetrical.49 Unexpectedly, the XPS spectra of Ti 2p and O 1 s are almost the same as those of anatase TiO2 and are similar to previous report for B-TiO2.50 Figure 5b shows the XPS spectrum of PEDOT/B-TiO2 (50 wt%). XPS survey scans of PEDOT clearly indicate the presence of C, O and S, which is the elemental marker for this polymer.45 The element of S is observed in the XPS spectrum of PEDOT/B-TiO2 (50 wt%), indicating that PEDOT is successfully introduced. The Ti 2p XPS spectrum of B-TiO2 has two broad peaks corresponding to the characteristic Ti 2p3/2 and Ti 2p1/2 peaks at 459.18 and 465.18 eV.51,52 Figure 5c shows the XPS spectra of PProDOT/B-TiO2 (50 wt%), and it is clear that this composite has similar characteristic peaks to that of PEDOT/-TiO2 (50 wt%). Furthermore, the S 2p XPS spectrum corresponds to the monosulfide bond environment in PProDOT with spin-split doublet, S 2p3/2 (163.78 eV) and S 2p1/2 (164.98 eV), with a 1.2 eV energy splitting.53 In the O 1 s peaks of B-TiO2, the peak intensity at 532.08 eV is lower than at 530.28 eV, while after combination of B-TiO2 with the PEDOT type polymers, the peak intensity at 532.08 eV is higher than at 530.28 eV, and these peaks shift to the high energy direction. This indicates that the presence of polymers can change the electronic chemical state of the B-TiO2 surface, which is consistent with the phenomenon of previous report for the adsorption of oleic acid on the surface of TiO2 nanorod.54 At the same time, in the XPS spectrum of S 2p, the asymmetric tail with high binding energy is related to the doping process.55 According to the reports,48,56 the Ti-S bond exists at 163–164 eV in the S 2p peak of PEDOT/TiO2 composites, resulting in higher peak intensity at S 2p3/2 than that of S 2p1/2. Therefore, it can be concluded that these peaks changes attributed to the bonding between B-TiO2 and PEDOT type polymers. These changes may be due to the synergistic effect of the combination of PEDOT-type conductive polymers and B-TiO2.
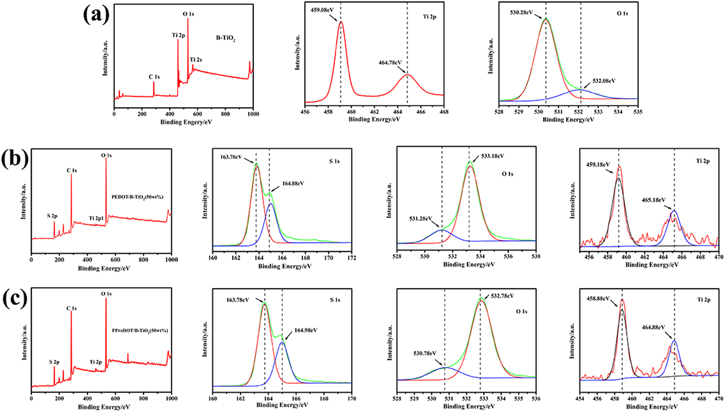
Figure 5. XPS spectra of (a) B-TiO2 and Ti 2p and O1s spectra, (b) PEDOT/B-TiO2 (50 wt%) and S 1s, O 1s and Ti 2p; (c)PProDOT/B-TiO2 (50 wt%) and S 1s, O 1s and Ti 2p.
Download figure:
Standard image High-resolution imageElectrochemical characterization of composites
Figure 6 shows the DPV of different modified GCEs in 0.1 M ABS (pH = 4.5) containing 1.0 M Pb2+ and Cd2+. It can be seen that the peak currents of Pb2+ and Cd2+ occurs at −0.588 V and −0.844 V, respectively. Compared with the pure polymers and B-TiO2, the peak currents intensity of the composites are higher in composites, and the maximum peak currents occur in the composites (PEDOT/B-TiO2 (50 wt%) and PProDOT/B-TiO2(50 wt%)) modified GCE.

Figure 6. DPV of (a) B-TiO2, PEDOT, PEDOT/B-TiO2 (10 wt%), PEDOT/B-TiO2 (50 wt%) and PEDOT/B-TiO2 (90 wt%) and (b)PProDOT, PProDOT/B-TiO2 (10 wt%), PProDOT/B-TiO2 (50 wt%) and PProDOT/B-TiO2 (90 wt%) modified GCE in 0.1 M ABS (pH = 4.5) containing 1 μM of Pb2+ and Cd2+. The effects of (c) pH values, (d) deposition potential and (e) deposition time on the stripping peak currents of Pb2+ and Cd2+ at PProDOT/B-TiO2 (50 wt%) in 0.1 M ABS containing 1 μM of Pb2+ and Cd2+.
Download figure:
Standard image High-resolution imageTo optimize the experimental conditions, the composites from 50 wt% B-TiO2 are used to determine the peak currents of 1.0 M Pb2+ and Cd2+ at different pH values. The other electrochemical parameters are as follows: deposition potential: 1.2 V, deposition time: 180 s, pulse width: 50 ms, pulse period: 100 ms, incremental potential: 2 mV. As shown in Fig. 6c, the peak currents of Pb2+ and Cd2+ are the highest at pH = 4.5. Both a low pH value and a high pH value lead to a decrease in the peak current. Therefore, pH = 4.5 was selected as the best condition for electrochemical measurements.
As shown in Fig. 5d, the effect of the deposition potential on the performance of the modified electrode is studied in the range of −1.8 to −1.0 V. The maximum current peak value is observed at approximately 1.2 V. The peak current gradually decreases as the potential moved in the negative direction. Therefore, the optimal deposition potential for the two heavy metal ions is −1.2 V.
Figure 6e shows the peak current response of the modified electrode to 1.0 M Pb2+ and Cd2+ over a cumulative time of 120 s–220 s. When the deposition time is more than 180 s, the peak current of Pb2+ change, and the peak current of Cd2+ decrease obviously, this may be due to saturation of the working electrode surface. Therefore, 180 s is selected as the best deposition time after considering the responses of the two heavy metal ions at the same time.
Electrochemical detection of Pb2+ and Cd2+
The principle of electrochemical detection of Pb2+ and Cd2+ is mainly based on the redox reaction between heavy metal ions in the tested samples and the modified materials of the working electrode for quantitative and qualitative detection. Different heavy metal ions require different polarization potentials when polarization occurs.57 Therefore, when detecting Pb2+ and Cd2+, the specific peak location can be clearly observed at the same time. In the process of electrochemical detection, the electron transport capacity and strong adsorption of PEDOT type conductive polymerization/B-TiO2 make Pb2+ and Cd2+ easy to be deposited on the surface of modified electrode, and finally obtain the peak current of ion oxidation. Under the optimized conditions, DPV is used as an analytical method for the electrochemical detection of Pb2+ and Cd2+ ions using various modified GCE in 0.1 M ABS (pH = 4.5). Figure 7 exhibits the DPV of the PEDOT-type conductive polymer/B-TiO2 (50 wt%) composite-modified GCE detect to Pb2+ and Cd2+. Figure 7a show the DPV curves of Pb2+ and Cd2+ detect separately by the PEDOT/B-TiO2 (50 wt%) composite-modified GCE. The linear regression equations for Pb2+ and Cd2+ ion detection are determined to be i/μA = 16.11121 + 25.50899 x/μM and i/μA = 20.9844 + 24.1264 x/μM with correlation coefficients of 0.99577 and 0.99314, respectively. The limits of detection (LOD) are found to be 0.005816 μM and 0.00488 μM for Pb2+ and Cd2+, respectively. Figure 7b show the DPV curves of Pb2+ and Cd2+ detect separately by the PProDOT/B-TiO2 (50 wt%) composite-modified GCE. The linear regression equations for Pb2+ ion detection is i/μA = 0.58168 + 41.53472 x/μM (0.04–1.6 μM) and i/μA = 45.2572 + 15.02196 x/μM (1.6–3.6 μM) with correlation coefficients of 0.99404 and 0.99713, respectively. The LOD is found to be 0.00520 μM and 0.00664 μM for Pb2+. The linear regression equations for Cd2+ ion detection is i/μA = 3.80024 + 65.09189x/μM with correlation coefficients of 0.99457. The LOD is found to be 0.00664 μM for Cd2+. The contents of Pb2+ and Cd2+ in 0.1 m ABS (pH = 4.5) are simultaneously determined by the PEDOT-type conductive polymer/B-TiO2 (50 wt%)-modified GCE. As shown in Figs. 7c, 7d, the DPV curves of Pb2 + and Cd2+ are obtained by PEDOT conductive polymers at the same time. The distance between each individual peak is large enough to simultaneously detect these heavy metal ions using the PEDOT type conductive polymer/B-TiO2 (50 wt%) composite-modified GCE. Table II shows the linear equations, correlation coefficients and the detection limits for the peak current and the concentration of Pb2+ and Cd2+. At the same time, the peak current shows a linear relationship with the increase of Pb2+ and Cd2+ concentrations. With the increase of Pb2+ and Cd2+ concentrations, the peak current increase linearly. The sensitivity of single detection and simultaneous detection of Pb2+ and Cd2+ are the same, which indicates that it is feasible to determine Pb2+ and Cd2+ at the same time.

Figure 7. DPV response curves and correspondingly relationship between concentration and peak current of the (a) PEDOT/B-TiO2 (50 wt%) and (b) PProDOT/B-TiO2 (50 wt%) modified GCE for the individual detection different concentration of Pb2+ and Cd2+ and the (c) PEDOT/B-TiO2 (50 wt%) and (d) PProDOT/B-TiO2 (50 wt%) modified GCE for the simultaneous analysis different concentration of Pb2+ and Cd2+(The geometric area of GCE is about 0.1256 cm2 and the final surface loading of the modified electrode is 0.0796 mg cm−2).
Download figure:
Standard image High-resolution imageTable II. Performance of the PEDOT/B-TiO2 (1:1) and PProDOT/B-TiO2 (1:1) modified GCE for simultaneous determination of Pb2+ and Cd2+.
| Electrode | Analytes | Linear Range(μΜ) | Linear Regression(μΜ) | R2 | LOD(μΜ) |
|---|---|---|---|---|---|
| PEDOT/B-TiO2 | Pb2+ | 0.04–1.24 | y = 55.65794x + 1.11066 | 0.99577 | 0.00073 |
| Cd2+ | 0.04–1.24 | y = 8.45172x + 4.46037 | 0.98217 | 0.0816 | |
| 0.04–0.4 | y−65.01754x − 0.00792 | 0.99336 | 0.00087 | ||
| PProDOT/B-TiO2 | Pb2+ | 0.4–1.8 | y = 30.51905x + 14.42155 | 0.99435 | 0.00186 |
| Cd2+ | 0.04–0.4 | y = 27.70298x + 3.82317 | 0.99436 | 0.01523 | |
| 0.4–1.8 | y = 13.13512x + 8.80012 | 0.99687 | 0.03214 |
EIS (Electrochemical Impedance Spectroscopy) is also a powerful technique to study the interface properties of modified electrodes surface. Generally, the impedance spectra include a semicircle portion and a linear portion. The semicircle diameter corresponds to the electron-transfer resistance (Ret) at higher frequencies and the linear part at lower frequencies represents the diffusion limited process. Figure S2 (available online at stacks.iop.org/JES/167/067514/mmedia) exhibits the Nyquist plots of the GCE and modified GCEs (supporting information). As shown in Fig. S2, there is no obvious semicircle domain of the bare GCE, indicating that the electron transfer resistance is very small. After the electrode is modified with pure polymer, the Ret is significantly increased. The Ret of nanocomposites decreases obviously with the introduction of B-TiO2, suggesting that the combination of PEDOT with B-TiO2 can accelerate the electron-transfer of electrochemistry, which is resulted from the high charge-transfer ability of B-TiO2. Coating of surface B-TiO2 with PEDOT increased conductivity by facilitating charge-transfer processes between the components when compare with conductivity of original inorganic substrate and conducting PEDOT.
In order to further study the adsorption capacity of Pb2+ and Cd2+ on the modified electrode, the adsorption capacity is calculated.58 According to the related calculation, the geometric area of GCE is about 0.1256 cm2, the suspension concentration of 2 mg ml−1, 5 μl suspensions is dripped on the electrode surface, and the final surface loading of the modified electrode is 0.0796 mg cm−2. The relationship between the adsorption capacity of Pb2+ and Cd2+ and electrochemical detection by under the same conditions is studied. The results are shown in Table SI (supporting information). These results show that the modified electrode has high adsorption capacity for Pb2+ and Cd2+ in the initial stage, and the adsorption capacity of Pb2+ is larger than that of Cd2+. The peak currents intensity of Pb2+ and Cd2+ are different, and this is consistent with the results of electrochemical detection.
The interference study of coexisting inorganic ions was performed by adding 10-fold interfere metal cation ions including K+, Na+, Li+, Mn2+, Zn2+, Mg2+and Co2+ with the analytes standard solution 1 μM Pb2+ and Cd2+ into 0.1 M ABS (pH = 4.5) at the PEDOT/B-TiO2(50 wt%)/GCE and PProDOT/B-TiO2(50 wt%)/GCE. As shown in Figs. 8(a), 8(b), the peak currents for both Pb2+ and Cd2+ change slightly with the errors lower that ± 10%. The results indicate that the interference of these ions is negligible to proposed electrode.

Figure 8. Interference of (a) metal ions (10-fold concentration) on the peak currents of Cd2+ and Pb2+ simultaneous detection where I represents the current, and M represents the selected interferential ions.
Download figure:
Standard image High-resolution image
Comparison with other research work
Table III summarizes previous reports on rapid screening of Pb2+ and Cd2+. Compared with other studies, the electrode modification materials prepared in this study have very good LOD and minimum detection concentrations of Pb2+ and Cd2+. The results show that the PEDOT-type conductive polymer/B-TiO2 (50 wt%)/GCE shows reasonable properties for the simultaneous detection of Pb2+ and Cd2+ ions. However, in this study, black titanium dioxide is introduced into the field of ion detection and provided strong evidence for the use of titanium-based materials in the field of electrochemistry. It should be noted that the LOD and minimum detection concentrations of Pb2+ and Cd2+ ions from composite material modified GCE can correspond to a highly sensitive technique which indicates that this kind of composite is more appropriate for detection of Pb2+ and Cd2+ ions by DPV method to get the better detection limit with the specific binding of the composite with heavy metal ions than that of previously reported materials.59–63 This further implies the practical value of this kind of composite as electrode material for electrochemical determination of heavy metal ions.
Table III. Comparison of Pb2+ and Cd2+ detection different modified electrodes.
| Electrode | Metal ions | LOD (μΜ) | Linear Range (μM) | References |
|---|---|---|---|---|
| Ti/TiO2/GCE | Pb2+ | 0.14 | 0.6–13.2 | 59 |
| Cd2+ | 0.213 | |||
| Fe3O4/TA/GCE | Pb2+ | 0.04 | 0.4–1.3 | 60 |
| Cd2+ | 0.2 | |||
| SbF/GO/SPCE | Pb2+ | 0.026 | 0.1–1.5 | 61 |
| Cd2+ | 0.054 | |||
| PANI/GCE | Pb2+ | 0.1 | 0–2.0 | 62 |
| Cd2+ | 0.13 | |||
| AuNPs/CNFs/GCE | Pb2+ | 0.1 | 0.1–1.0 | 63 |
| Cd2+ | 0.1 | |||
| PEDOT/B-TiO2/GCE | Pb2+ | 0.00073 | 0.04–1.24 | this work |
| Cd2+ | 0.0816 | 0.04–0.4 | ||
| Pb2+ | 0.00087 | 0.4–1.8 | this work | |
| PProDOT/B-TiO2/GCE | 0.00186 | 0.04–0.4 | ||
| Cd2+ | 0.01523 | 0.4–1.8 | ||
| 0.03214 |
Conclusions
In summary, PEDOT-type conductive polymers/B-TiO2 nanocomposites were prepared by in situ oxidation polymerization and these composites were applied for the electrochemical determination of Cd2+ and Pb2+ by DPV. The combination of polymers with B-TiO2 not only improves the active sites of Pb2+ and Cd2+, but also increases the sensitivity and stability of nanocomposites. Furthermore, the fibrous, network and coral-like structures occurred in the composites could be benefit for the enhancement of synergetic effect. The strong adhesion of B-TiO2 on the surface of network and corals as well as the porous structure played an important role for enhancing the electrocatalytic activity towards the detection of ion. Accordingly, the composites from 50 wt% of B-TiO2 displayed higher electrcocatalytical activity than that of polymers and other composites. The PEDOT-type conductive polymer/B-TiO2-modified electrode prepared could be used for highly selective electrochemical sensing and had a good adsorption ability and high electrochemical current response for Pb2+ and Cd2+ ions. The results showed that the PEDOT-type conductive polymers/B-TiO2 were promising electrode materials with practical value for the electrochemical determination of heavy metal ions.
Acknowledgments
We gratefully acknowledge financial support from the National Natural Science Foundation of China (No. 21865034, No. 21564014).